Article

Increased Digital Resource Consumption in Higher Educational Institutions and the Artificial Intelligence Role in Informing Decisions Related to Student Performance

1
Permanent Secretary for Ministry of Education, Heritage and Arts, Suva, Fiji
2
School of Information Technology, Engineering, Mathematics and Physics (STEMP), Suva, Fiji
*
Authors to whom correspondence should be addressed.
Current address: Faculty of Science, Technology and Environment, University of the South Pacific, Suva, Fiji.
Sustainability 2022, 14(4), 2377; https://doi.org/10.3390/su14042377
Submission received: 3 December 2021 / Revised: 7 January 2022 / Accepted: 11 January 2022 / Published: 18 February 2022
(This article belongs to the Special Issue Resources Conservation, Recycling and Waste Management)

Abstract

:
As education is an essential enabler in achieving Sustainable Development Goals (SDGs), it should “ensure inclusive, equitable quality education, and promote lifelong learning opportunities for all”. One of the frameworks for SDG 4 is to propose the concepts of “equitable quality education”. To attain and work in the context of SDG 4, artificial intelligence (AI) is a booming technology, which is gaining interest in understanding student behavior and assessing student performance. AI holds great potential for improving education as it has started to develop innovative teaching and learning approaches in education to create better learning. To provide better education, data analytics is critical. AI and machine learning approaches provide rapid solutions with high accuracy. This paper presents an AI-based analytics tool created to predict student performance in a first-year Information Technology literacy course at The University of the South Pacific (USP). A Random Forest based classification model was developed which predicted the performance of the student in week 6 with an accuracy value of 97.03%, sensitivity value of 95.26%, specificity value of 98.8%, precision value of 98.86%, Matthews correlation coefficient value of 94% and Area Under the ROC Curve value of 99%. Hence, such a method is very useful in predicting student performance early in their courses of allowing for early intervention. During the COVID-19 outbreak, the experimental findings demonstrate that the suggested prediction model satisfies the required accuracy, precision, and recall factors for forecasting the behavioural elements of teaching and e-learning for students in virtual education systems.

1. Introduction

Artificial intelligence (AI), connectivity (the Internet of Things), information digitisation, additive manufacturing (such as 3D printing), virtual or augmented reality, machine learning, blockchain, robotics, quantum computing, and synthetic biology are all examples of areas where the digital revolution can help to facilitate Sustainable Development Goals (SDGs) [1,2]. Similarly, the digital transformation will fundamentally affect many aspects of global communities and economies, resulting in a shift in how the sustainability paradigm is interpreted. Digitalization is a key driver of disruptive, multiscalar change, not just a “tool” for resolving sustainability concerns. Working with digital revolution is already reshaping leisure, work, education, behaviour, and governance. Generally, these contributions can boost labour, energy, resource, and carbon productivity, as well as cut production costs, improve service access, and dematerialise production [2]. Rapid increase in digital resources have influenced the education sector to achieve the SDGs.
The SDGs Agenda of the United Nations endorsed by global leaders in 2015 include climate change mitigation, poverty eradication, and universal access to education [1]. Today in all functions achieving SDGs is very important, and in achieving these SDGs, the role of education is crucial. SDGs are indivisible and encompass economic, social, and environmental dimensions [1]. Equitable quality education (EQE) is one of the major challenges faced by most academic institutes around the globe. SDG 4 talks about the concepts of “equitable quality education”. Quality education is thought to lead to a more sustainable world. The major criterion for Education for Sustainable Development (ESD) is to provide a culture that assists students in completing their academics while also providing greater opportunity for addressing problems. Despite these goals, it is questionable what education for sustainability intends to do. The following are some of the historical policy statements [2]:
  • The United Nations Education, Scientific, and Cultural Organization (UNESCO), in collaboration with the United Nations Environment Programme (UNEP), hosted the world’s first intergovernmental conference on environmental education from 14 to 26 October 1977 in Tbilisi, Georgia (USSR).
  • The Earth Summit in Rio de Janeiro in 1992 saw the launch of Education for Sustainable Development (ESD): The United Nations Conference on Environment and Development (Rio Summit, Earth Summit) and Agenda 21’s Chapter 36 on Education, Training, and Public Awareness consolidated international discussions on the critical role of education, training, and public awareness in achieving sustainable development.
  • In 2002, during the World Summit on Sustainable Development, the Decade for ESD was announced: A proposal for the Decade of Education for Sustainable Development (ESD) was included in the Johannesburg Plan of Implementation. At its 57th session in December 2002, the United Nations General Assembly passed a resolution declaring the UN Decade of Education for Sustainable Development (DESD) to begin in January 2005.
  • In 2014, the announcement of the Global Action Programme (GAP) for ESD was introduced during the UNESCO World Conference on ESD.
  • In 2015 the World Education Forum in Incheon, Korea R, emphasised the importance of education as a primary driver of development and achievement of the SDGs.
Therefore, with the above argument it is also debatable if these efforts have succeeded in changing curricula and teaching methods to be more sustainable. The concept and understanding of sustainability is crucial to the development of acceptable educational pedagogies, their implementation, and their capacity to provide what they are created for.
EQE is one of the key drivers of a country’s economic prosperity and supports sustainability. Exponential growth in enrolment in Higher Education Institutions (HEI) has been observed in the past twenty years [2], as a result of the perceived importance of further education in career development and opportunities. In contrast to the students historically entering tertiary education, a shift in student demographics has been recorded with an increasingly heterogeneous student population taking multi-modal course deliveries [3]. With the increase in student numbers, the demand for state-of-the-art services and resources from the learners has also escalated [4].
Competition amongst the HEI is stiff, as they strive to attract students to take their programmes. With the growing consumerism in higher education, criteria amongst students to choose HEI is more complex, considering factors such as the delivery of the service, reputation and likelihood of getting a better career amongst the traditional socio-economic factors [5]. While student enrolment is dependent on the reputation and attractions on offer, student satisfaction and success are the impetus that drive student retention. Thus, factors that lead to student success are given increasing importance.
Various measures of student success and attainment are used by the HEIs, which include the use of cross-sectional and longitudinal data measuring student progress, completion rates for courses and programmes, to the success of their alumni [6]. Universities strive to maximize successful completion of courses and programmes with student support services, tools and technologies that have been shown to enhance student learning. This warrants the use of new and innovative pedagogies to captivate interest and maximize the potential of the learners.
Today, education relies heavily on ICT, with new tools in the field of higher education [7,8,9]. For instance, distance learning is not a challenge anymore with off-campus students accessing learning resources using e-learning and m-learning tools [10,11,12,13,14]. In addition to this, AI is gaining interest as it can be used to execute tasks normally associated with human intelligence [15,16], such as social networking applications for learning, speech recognition, learning management systems (LMS), decision-making, cloud learning services, visual perception, mobile learning applications and translating languages [8,9]. Currently, most universities are livestreaming lectures and offering full courses online. Massive Open Online Courses (MOOCs) have made higher education courses from some of the world’s most prominent universities available to anybody with a reasonable Internet connection anywhere in the world [17]. Virtual reality will increasingly allow students to participate in field trips and obtain practical experience without ever leaving the classroom or their homes. Through Internet platforms like as chegg.com, students have access to “personal” instructors 24 h a day, from anywhere on the globe [18,19]. Textbooks, school libraries, and even consolidated campus attendance are all on the decline.
In conjunction with SDG 4, which aims to “provide inclusive and equitable quality education and encourage life-long learning opportunities for everyone”, the digital revolution in education will undoubtedly enhance access to high-quality education throughout the world [1]. However, in order to do this, the essential broadband and energy infrastructure must be supplied simultaneously in poor countries and rural places. The rapid digital revolution of education will have an influence on our cities’ structure and social connections. The necessity for centralised campuses and accompanying infrastructure will shrink as education is increasingly given remotely, allowing students to learn from home, either individually or via “virtual classes”.
Student performance is one of the most essential elements for any learning institution [20]. Student enrolment and attendance records, as well as their examination results, are the most conventional form of data mining (DM) in higher education institutions [11,20,21,22]. In this age of big data, education data mining (EDM) is an interdisciplinary field where machine learning, statistics, DM, psycho-pedagogy, information retrieval, cognitive psychology and recommended systems methods and techniques are used in various educational data sets to resolve educational issues [23]. This phenomenon surrounding the EDM can be better explained in Figure 1. To date, little has been done in EDM using AI in education in the developing world. In the current dynamic status of EDM, numerous studies have been carried out in relation to different typologies of DM in educational environment [23,24,25].
Common representative classifications are as follows:
  • Analysis and Visualization of Data,
  • Providing Feedback for Supporting Instructors,
  • Recommendations for Students,
  • Predicting Student’s Performance,
  • Student Modelling, and
  • Social Network Analysis.
The use of AI in the educational environment is imperative because it can contribute significantly to the improvement of the teaching and learning processes, as well as encourage the process of knowledge construction [15,16,17]. Based on the results of a report on the sustainability of higher education and TEL [26], when identifying the necessary conditions for technology to assist and not obstruct teaching and learning, we need to be very careful.
This research is designed to model an AI based predictor for student performance in a higher education online course and the significant contributions of the paper can be recounted as follows:
  • A framework for an AI based student performance predictor is proposed,
  • Digital resources are used in informing decisions related to student performance,
  • Al prediction for student performance is designed and analyzed for a first-year IT literacy course at The University of the South Pacific (USP).
In this work, the main focus was to achieve better accuracy when compared with previous research [20] and the early prediction of student performance by employing AI in EDM. A Random Forest (RF) classifier model is applied to the data set and an accuracy of 97.03% was achieved at week 6.
The paper is organized as follows. Section 2 summarizes the literature with the current direction, the role of digital learning, and the involvement of AI in HEI. Section 3 provides the design and architecture of the developed model (i.e., intelligent Early Warning System (iEWS)). The methodology used to predict student performance is presented in Section 4. Section 5 provides the results and discussion, and the conclusion and research suggestions are provided in Section 6.

2. Types of Early Warning Systems

A substantial body of research shows that progressive trends for students are significant contributors to student performance in online learning. There are several methods associated with EWS. One of the most common techniques is the use of statistical analysis to predict performance. Until recently, statistical approaches were largely applied in educational institutes to understand potential student pass/fail and dropout rates. More recently, different approaches have been combined to show better performance in EDM. Different predictive techniques are used in order to have a better prediction rate. Different classification methods are applied for given data sets. Figure 2 depicts the graphical representation for a list of the common methods used for EWS for student performance prediction.

2.1. The Evolution of EWS in Higher Education

The topic of predictive algorithms is often regarded as the most relevant field of study within the data analytics discipline. EWS is widely used in various fields of study and has impacted the education sector [20,27,28] more recently. One of the prime reasons for applying EWS is that universities use it to track student progress and recognize students at risk of failing a course or dropping out of a course or programme [11,29]. Various techniques are being proposed, applied and tested, and there are many advanced tools available in the literature which have better-predicting accuracy in the field of EDM [30,31]. One of the pre-processing algorithms of EDM is known as Clustering 32. Interestingly, DM is one of the most popular techniques which is widely applied in education to analyse student performance [25,32]. EWS has been used widely in secondary schools in the United States for many years. It has been used to track student success in schools and to identify measures that predict the likelihood of dropping out of school [33,34]. The features and variables that were collected for EWS were based on demographic/historical data, ongoing test results and the use of LMS. Once the EWS identifies an at-risk student, the teacher has the option of providing corrective measures which includes indicating different alert signals on a student’s Moodle page and alert message via e-mail messages or text messages [29,30]. Additionally, students were allowed to get a referral to an academic advisor to address the problem faced in a particular course.
There has been an increase in different types of prediction models used in learning analytics. According to [35], analytical researchers are trying to predict with better accuracy and employing different classification tools to compare accuracies. The common classification algorithms, such as EM, C4.5, Naive Bayes Classifier, Support Vector Machines, K-nearest neighbor [29], neural network models [36], and decision tree methods [37] are also employed.
In most cases, the analysis is performed to predict whether a student will pass or fail a course based on the binary response variable ‘pass/fail’. Principally, one of the fundamentals and keen methodologies usually applied in predictive models is that the analysis is usually performed on a single course rather than used for several courses. As a systemic approach, model features and response variables are used in classifying at-risk students but for a prediction model [29], the beginning of the semester is too early to identify at-risk students. It is often difficult to contrast the studies and identify which study has obtained the most accurate results.
Azcona and Casey [37], argue that a single course analysis is more efficient in terms of accuracy. This may be because each course is structured differently and, therefore, the feature will be not the same for classification in different courses. In a similar study by Ognjanovic et al. [38], it was evident that predictive models could be applied to multiple courses. However, they noted that the inherent differences in disciplines caused specific variables to be strong for some courses and weak for other courses. Hence, the nature of the course should be considered before selecting variables for an early warning system.

2.2. AI in Early Warning Systems

The involvement of AI in previous years has attracted several controversial remarks [15,16]. The use of AI in computing power, DM and Big Data technologies appears to be a more advanced tool in predicting with better accuracy [15,32]. As mentioned earlier, AI used a better classification tool to predict the accuracy of any EDM. Ognjanovic et al. [38] and Andriessen et al. [39] both examined AI methods used in learning platforms and the relationship between education and AI, respectively. To add to this, academic performance in game-based learning strategies was studied by Stojanovska et al. [40]. They also studied flip teaching techniques, and video conferencing sessions by mining personality traits, learning style and satisfaction. Basavaraju et al. [41] proposed a study by supervised learning to use the android app. Table 1 shows the different research carried out in the field of AI and DM methods and their accuracies. EMD study was carried out where student’s behavioural features were used to model the system. The system yielded 22.1% accuracy, and later, using an ensemble method, they noticed there was an increase in the accuracy of 25.8% [42].
A Deep Neural Network (DNN) was used to analyze student performance in Keras library. They used online data sets and achieved 83.4% accuracy, and the quality of the classifier was measured by Cost Function and Accuracy [43]. In 2017, a Recurrent Neural Network (RNN) was implemented to predict the students’ performance for logged data from 108 students. The predicting feature used was log data of an LMS and the results revealed a 90% accuracy [44]. A review was carried out on predicting student performance using DM methods and showed that the results of Neural Network and Decision Tree had achieved an accuracy of 98% and 91%, respectively [45]. A prediction model was developed using an Artificial Neural Network (ANN). The work was designed to predict the Cumulative Grade Point Average of students. The academic datasets were modelled in one of the universities in Bangladesh. They performed a compassion test with the predicted and original grades. The highest accuracy of 99.98% and Root Mean Square Error of the work was 0.176546 [46].
Table 1. Research carried out in the field of AI and DM methods with its accuracy.
MethodFeatureAccuracy (%)Ref.
DNNExternal assessment, Student Demographic, High school background74[47]
Student Demographic, High school background72[48]
CGPA, Student Demographic, High school background, Scholarship, Social network interaction71[49]
CGPA75[50]
External assessment97[51]
Psychometric factors69[52]
Internal assessments81[53]
SVMInternal assessment, CGPA80[54]
Internal assessment, CGPA, Extra-curricular activities80[55]
Psychometric factors83[56]
Decision TreePsychometric factors, Extra-curricular activities, soft skills88[57]
External assessment, CGPA, Student Demographic, Extra-curricular activities90[58]
Internal assessment, Student Demographic, Extra-curricular activities90[59]
Internal assessment, CGPA, Extra-curricular activities73[55]
CGPA, Student Demographic, High school background, Scholarship, Social network interaction73[49]
CGPA91[50]
External assessment85[60]
Psychometric factors65[51]
Internal assessments76[24]

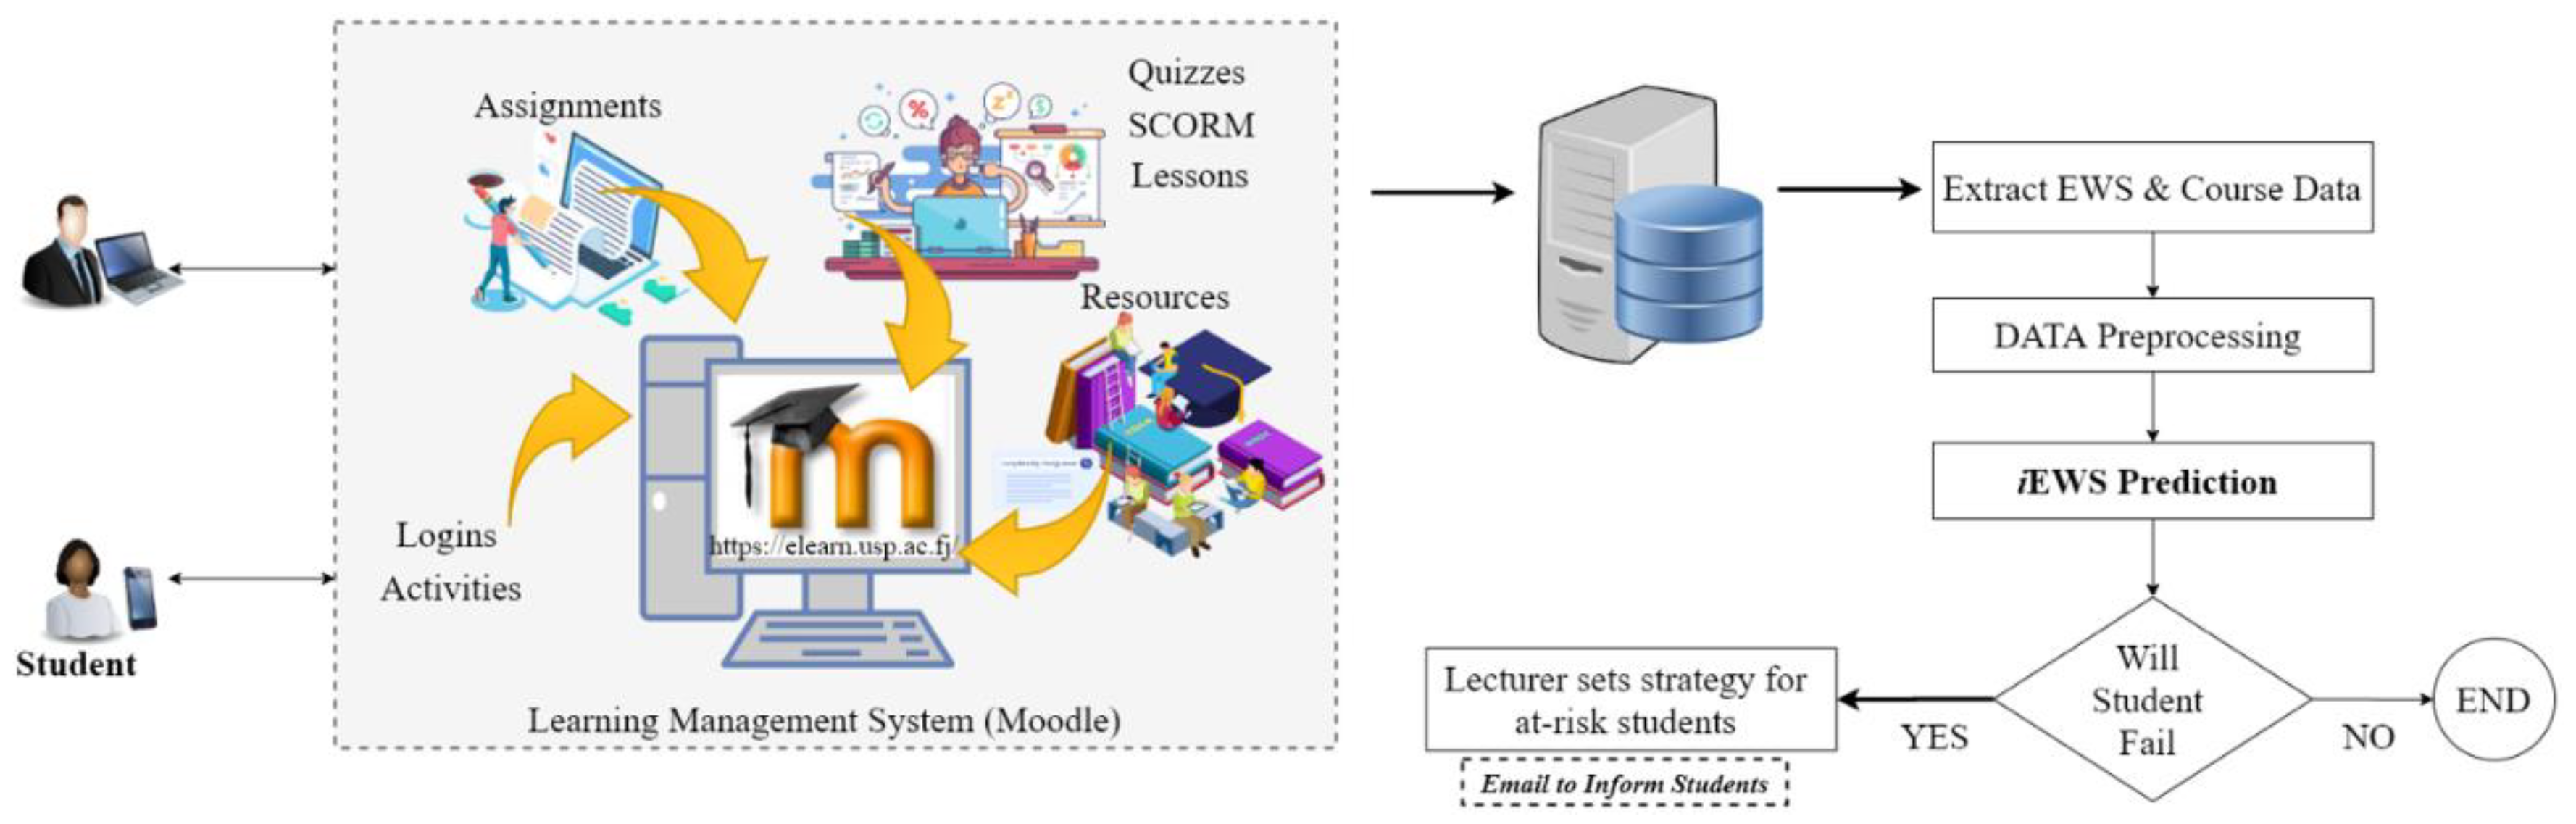
3. Design and Architecture of Intelligent Early Warning System (iEWS) Model

This study retrieved complete online interaction data for undergraduate students of a fully online first year course, Communication Information Literacy, at the USP for one semester. The USP uses Moodle LMS where all the online, face-to-face and blended courses are hosted. Moodle requires user authentication to access the registered courses for a particular student and detailed interactions for each student for the course are recorded in the Moodle database including system login, logout, material access, assignment submission, discussion forum activities, score package records, quiz activities and numerous other activities and resource data. All these data are stored on individual activity/resource table and all other interactions in the course are stored in a log table.
An EWS (Student Alert Moodle Plugin) developed by the Faculty of Science, Technology and Environment at the USP was implemented in week 4 of the semester in the course [11]. The data from the EWS plugin were used to extract features to develop iEWS predictor. The architecture is shown in Figure 3 and the process flow is discussed in Table 2.

4. Methodology

This study discusses the proposed predictor called iEWS, which uses students’ EWS data based on online course login, interaction and completion for as early as Week 6 to predict if the student will pass or fail a course. The following sections discuss the dataset, data cleaning and extraction of features, statistical measures and validation scheme used to measure the performance and RF classifier used for prediction.

4.1. Dataset

On implementation of EWS in week 4, the completion rates, interaction rates and average logins per week increased. Completion rate is based on the number of the course activities mentioned earlier that were completed by the students in each week. EWS data collection started in week 4, after the EWS was implemented for weekly/fortnightly intervals. In this research, a total of 1523 student data-sets were used, in which 1271 students passed (positive samples) and 252 students failed (negative samples).

4.2. Features

The following attributes from EWS plugin were used for this study:
  • AvgCompRate—average percentage of online activities completed by students each week,
  • AvgLogin—average number of logins by students each week.
  • CourseworkScore—the coursework marks for Weeks 6, 8 and 10.

4.3. Reducing the Imbalance between Classes

After investigating the dataset, it was clear that the number of positive samples (students passed) was much bigger than the negative samples (students failed). This clearly resulted in a high-class imbalance of dataset.
The k-nearest neighbour technique was employed to reduce the imbalance of the dataset (i.e., between samples and classes) to remove redundant positive samples. Euclidean distance between all the samples in the dataset was calculated. Firstly, the cut-off was set by dividing the number of positive instances and negative instances (1271/252) which equals to a ratio of 5.04, thus K = 5 was set. This implies that there was a removal of a positive sample if there existed at least a positive sample within five nearest neighbours. After initial filtering, imbalance classes still remained, therefore, the K value was continuously increased until both the sets were approximately similar in size. This method eventually reduced the initial positive samples of 1271 to 256 with a threshold value of 29 (k = 29), which implies a positive sample was removed if at least one negative sample existed within the 29 nearest neighbours. The negative instances were not changed and remained at 252. The final dataset after filtering (filtered negative samples and positive samples) was used to carry out 6-, 8-, 10- fold cross-validation and assess the predictor’s performance.

4.4. Tool

MATLAB® software was used to carry out data pre-processing, feature extraction, reducing the imbalance between classes, splitting the data set into “N” folds of approximately equal sample size with similar positive and negative counts, creating a Weka data format (ARFF) file for Weka Classifiers. Weka was developed by University of Waikato in New Zealand, for classification and performance assessment [61,62].
The code was written in Java to train and test a set of classifiers provided by Weka for which performance assessment was carried out for different “N” folds. Net beans IDE was used for Java code and Weka.jar library downloaded from (http://www.cs.waikato.ac.nz/ml/weka/snapshots/weka_snapshots.html (accessed on 15 October 2021)) and referenced in the java project to access and run the Weka classifiers required [62]. Different classifiers were used to train and test to finalize the best classifier for iEWS predictor, based on the performance from each of the classifiers stated below.

4.5. Classifier

C4.5 (J48) is an algorithm used to generate a decision tree for classification of different applications [63]. PART is a partial decision tree algorithm, developed from C4.5 and RIPPER algorithms [64]. A decision table represents conditional logic with a list of tasks depicting business rules that can be used with the same number of conditions, which makes it different from the decision tree [65]. One Rule (OneR) is a simple classification algorithm that creates one rule for predictor in the data and then selects the rule with minimum error rate [66]. Decision stump consists of one level of Decision Tree, and uses only a single attribute for splitting [67]. Logistic regression is a statistical model, which uses a logistic function to model and predict the probability of an outcome that can have two values or binary classes [68]. Sequential Minimal Optimization (SMO) algorithm is based on the Support Vector Machine (SVM) solving quadratic programming (QP) problem, which arises during the training of SVM [69]. Multilayer perceptrons (MLP) is one type of neural network, which has a similar structure as a single layer perceptron, with one or many hidden layers and two phases [70].

4.6. RF

RF and decision trees are well known and used for the supervised learning model with associated learning algorithms that analyze data used for classification and regression analysis. It has been used in many other similar studies [24,48,49,50,55,57,58,59,60] and it gives high accuracy as shown in Figure 3. RF is an ensemble approach that includes a lot of trees for decision. The growing level of trees in a candidate feature set is calculated by an optimal law. The candidate feature set is a random subset of all features, which is distinct at each tree level. The RF grouping is an ensemble identification, corresponding to a new approach consisting not just one but several classifiers as well. In reality, hundreds of classifiers are built into RF grouping, and their selections are commonly combined by plurality vote. The concept remains that sometimes the combination of ensemble classifiers are more reliable than any of the ensembles [71,72], evicting conflicts among subsets of features. The RF classification is, therefore, commonly used for remotely sensed imagery processing. The common element in all of these procedures is that for the k-th tree, a random vector k is generated independent of the prior random vectors k k 1 , but with the same distribution; the tree is grown using the training set and k , resulting in a classifier h ( k ) where x is an input vector [71]. The genetic expression to predict a class of an observation is obtained by:
H ( x ) = a r g m a x y i 1 k I ( h i ( X , θ k ) = Y )
where, a r g m a x y represent the Y maximize value of i 1 k I ( h i ( X , θ k ) = Y ) which is the output variable, I ( h i ( X , θ k ) ) is the indicator function, and h i ( X , θ k ) is a single decision tree.
The classifier comprises various trees which are uniformly assembled by pseudo-randomly selecting subsets of feature vector components, that is, trees are assembled in randomly picked subspaces that preserve the maximum precision of training data and increase the accuracy of generalization as it increases in complexity [73].

4.7. Statistical Measures

To evaluate the performance of the proposed predictor and compare with the existing predictors, few measures such as sensitivity (Sn), specificity (Sp), accuracy (Acc), precision (Pre) and Matthews correlation coefficient (MCC) were employed in this work.
On the other hand, specificity assesses the proportion of correctly identified number of students failed. A specificity of 1 demonstrates an accurate predictor which is able to predict negative instance of the dataset (number of students failed) whereas a specificity equal to 0 shows that the predictor is unable to identify the number of students failed. The metric for specificity is defined as:
S e n s i t i v i t y = P + P + + P
where, P + is number of students passed predicted correctly and P represents the number of students passed incorrectly classified by the predictor
On the other hand, specificity assesses the proportion of correctly identified number of students failed. A specificity of 1 demonstrates an accurate predictor which is able to predict a negative instance of the dataset (number of students failed), whereas specificity equal to 0 shows that the predictor is unable to identify the number of students failed. The metric for specificity is defined as:
S p e c i f i c i t y = F + F + + F
where, F + is the number of students failed predicted correctly and F represents the number of incorrectly classified students failed by the predictor.
For a predictor to correctly distinguish between positive samples and negative samples, the accuracy of the predictor is evaluated. A predictor with an accuracy equal to 1 shows an accurate predictor, whereas a zero accuracy means the predictor is completely incorrect. Accuracy is calculated as:
A c c u r a c y = P + + F + P + F
where P and F are the total numbers of passed and failed students, respectively.
Precision is another assessment measure of the predictor, defined as the ratio of the number of correctly identify students passed over sum of correctly classified passed and failed students.
P r e c i s i o n = P + P + + F +
The final statistical measure used in this paper is the Matthews correlation coefficient (MCC). It shows the value of the correlation coefficient between predicted and observed instances. The MCC metric is calculated as:
M C C = ( F + × P + ) ( F × P ) ( P + + P ) ( P + + F ) ( F + P ) ( F + + F )
A best predictor is the one that achieves high performance in the five statistical measures discussed. However, it should perform better at least in some of the measures compared to the existing predictors. A predictor that is unable to predict passed or failed students correctly cannot be used for prediction.

4.8. Validation Scheme

The effectiveness of a new predictor needs to be assessed with a validation method. Two of the most commonly used ones are the jackknife and n-fold validation scheme [23,73]. In the validation phase, an independent test set has to be used to assess the predictor. The jackknife validation is less arbitrary than the n-fold cross-validation and provides unique results for a dataset. As per the literature [74,75], the same validation scheme (n-fold cross-validation) technique was used in this study. The n-fold cross-validation technique was carried out in the following steps listed in Table 3 and shown in Figure 4.
In this study, 6-, 8- and 10-fold cross-validations was conducted to assess iEWS predictor and recorded the result.

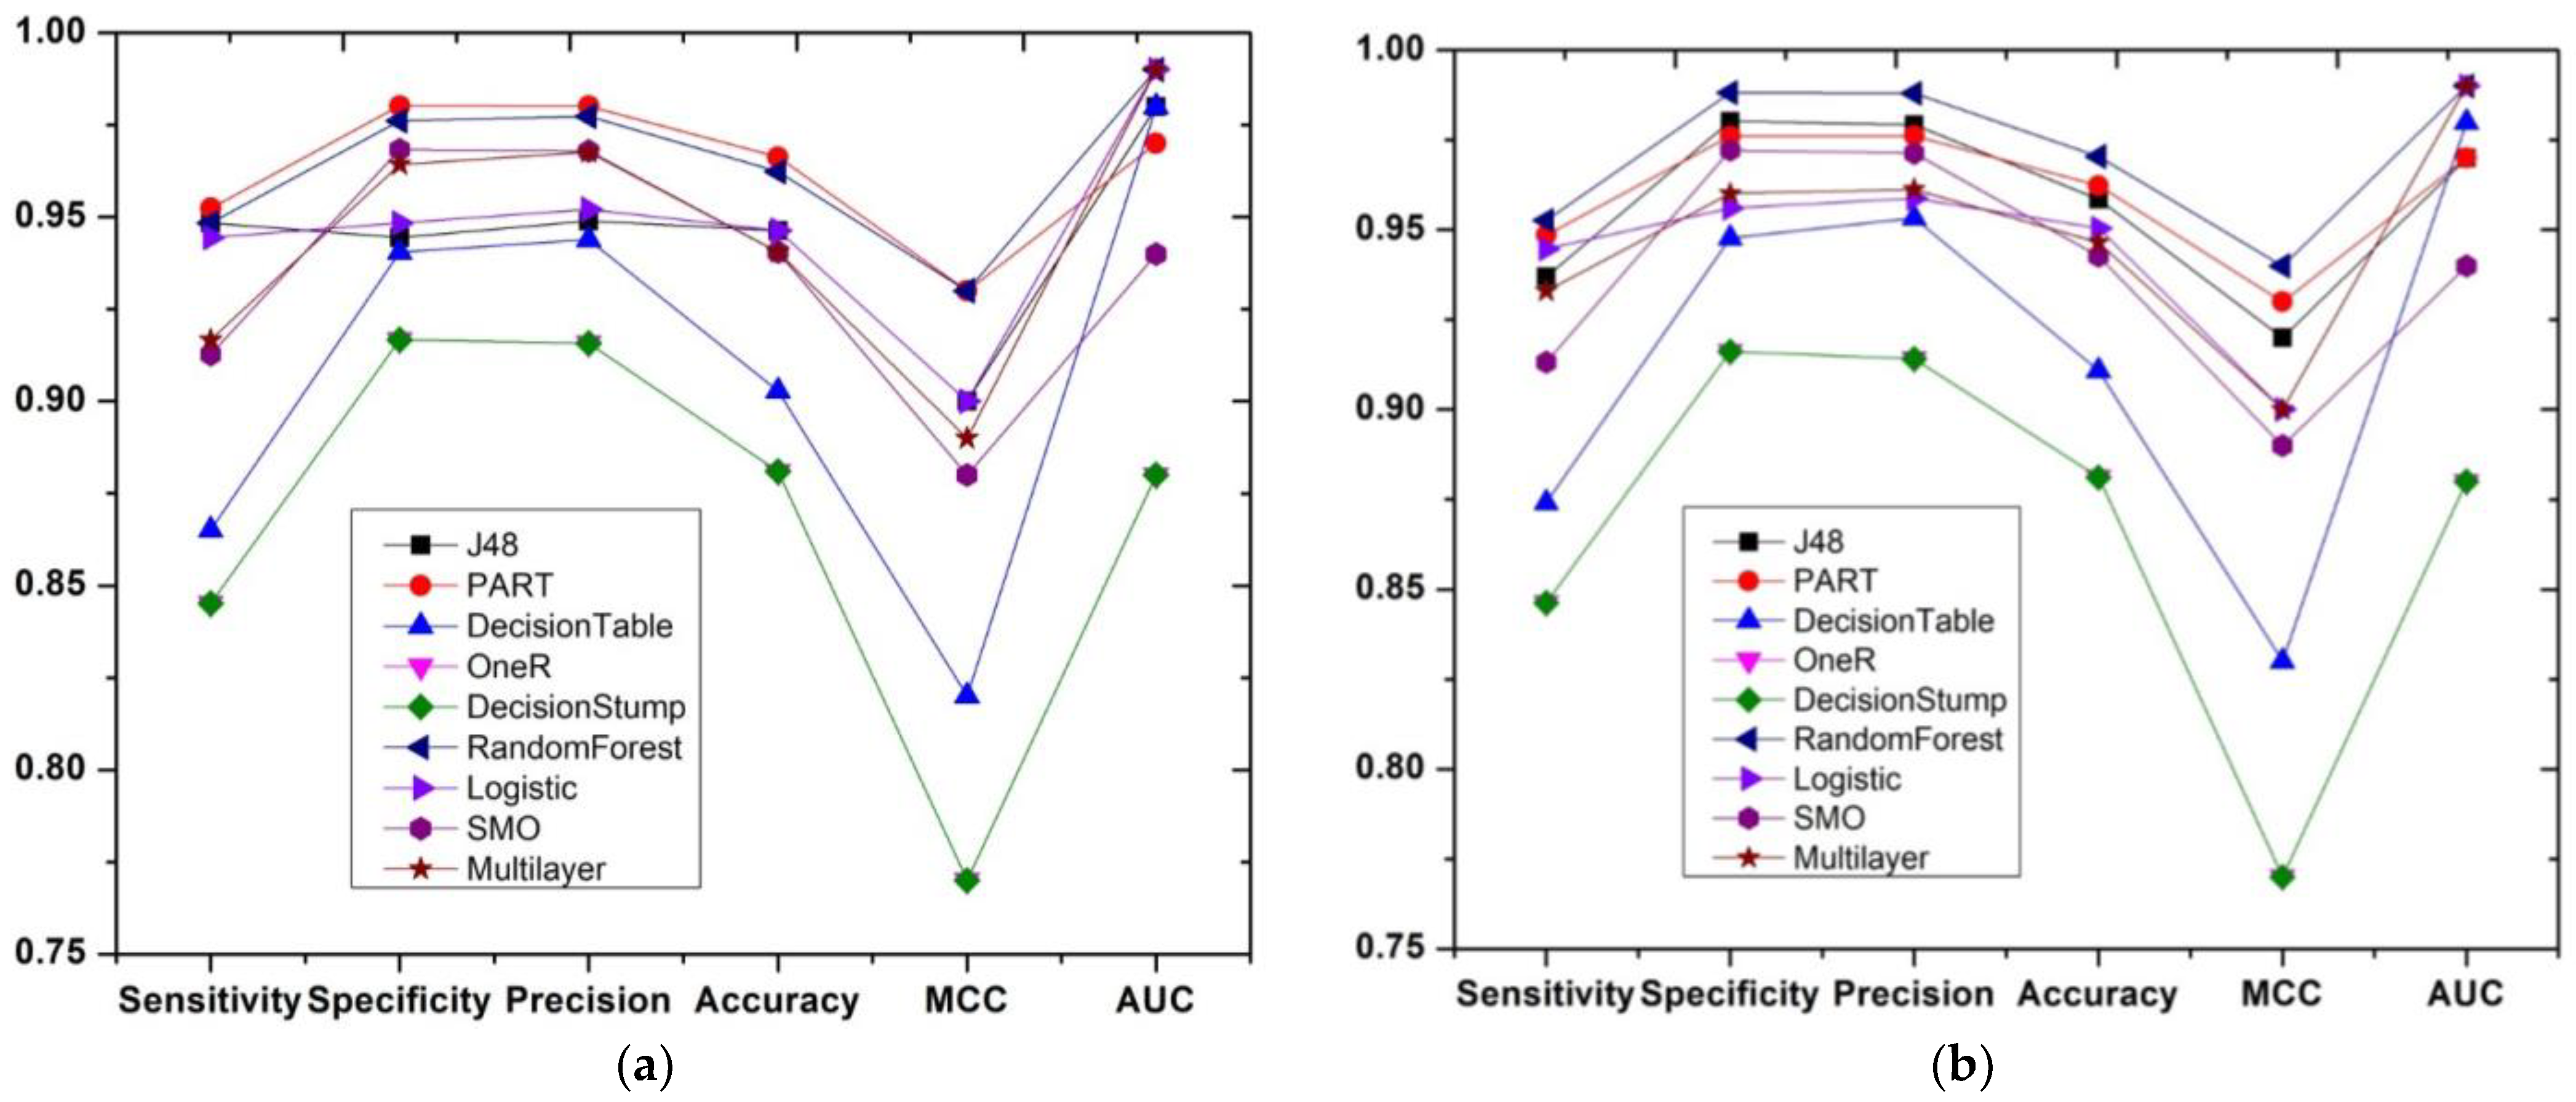
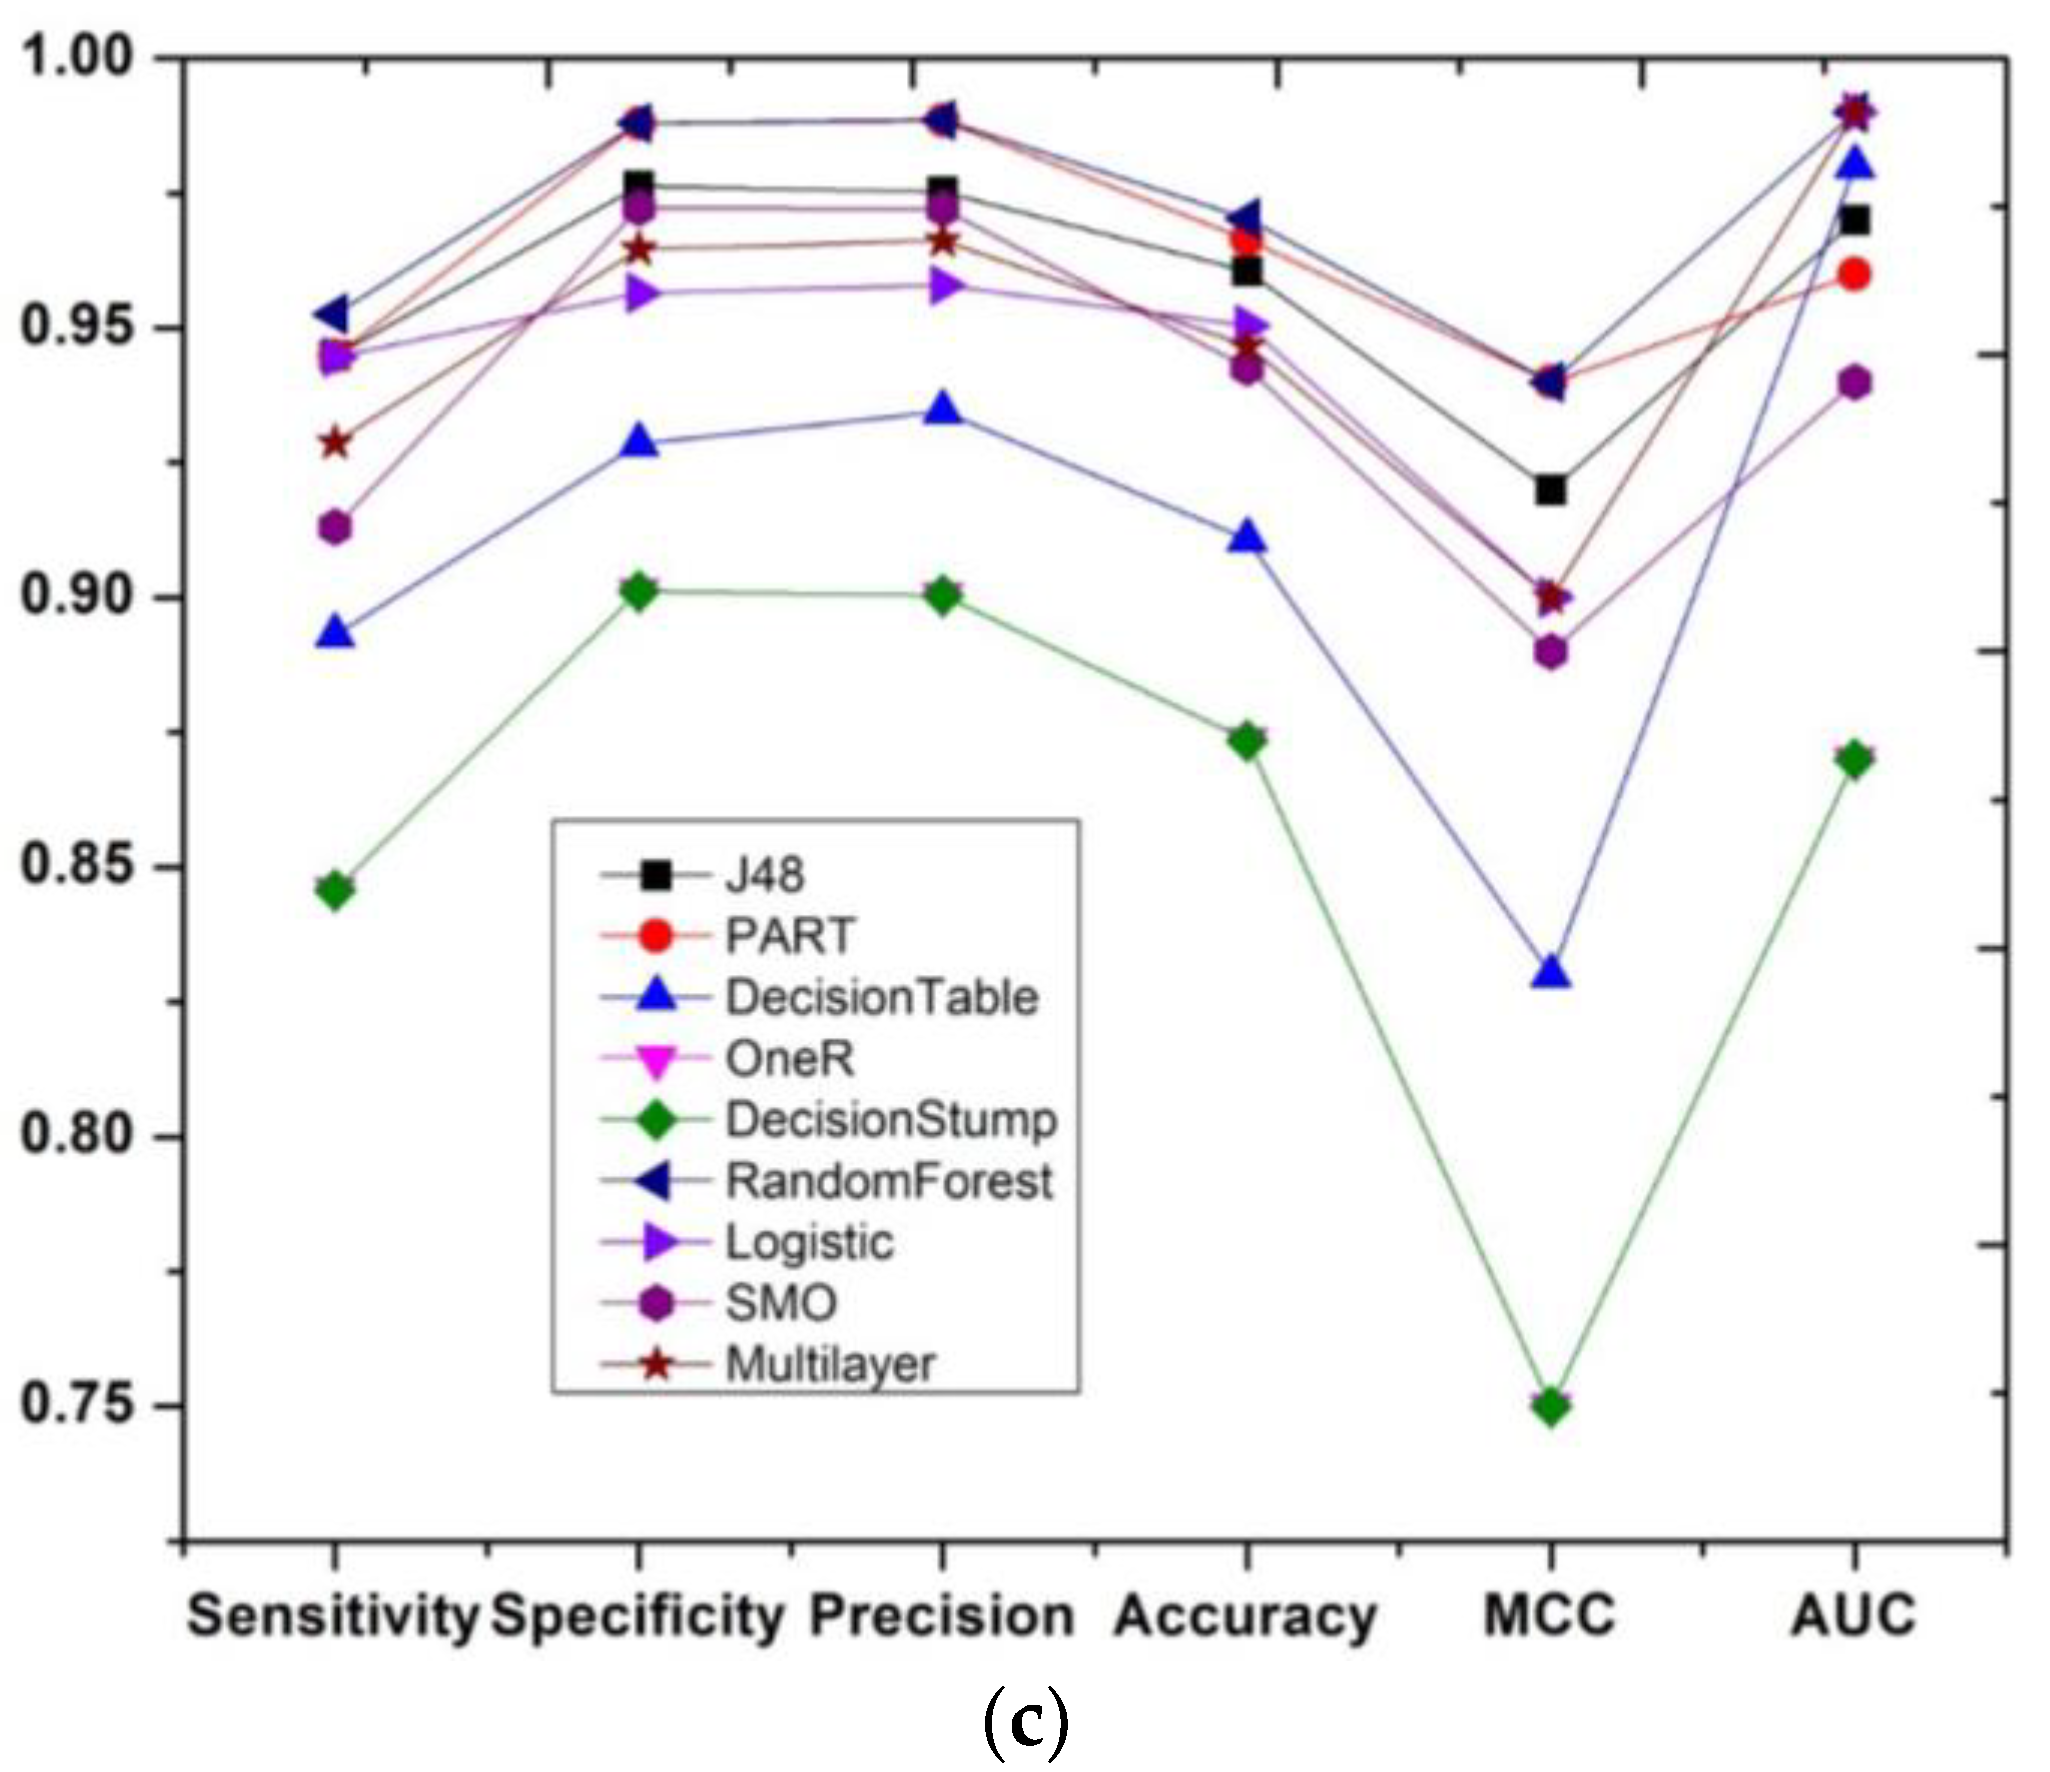
5. Results and Discussion

In order to verify the performance of any proposed predictor, it has to be assessed using different measures. The five statistical metrics: accuracy, sensitivity, specificity, precision and Matthews correlation coefficient, which are normally used, were used in this study [29,36,37,48,70]. This section presents the results of the proposed predictor.

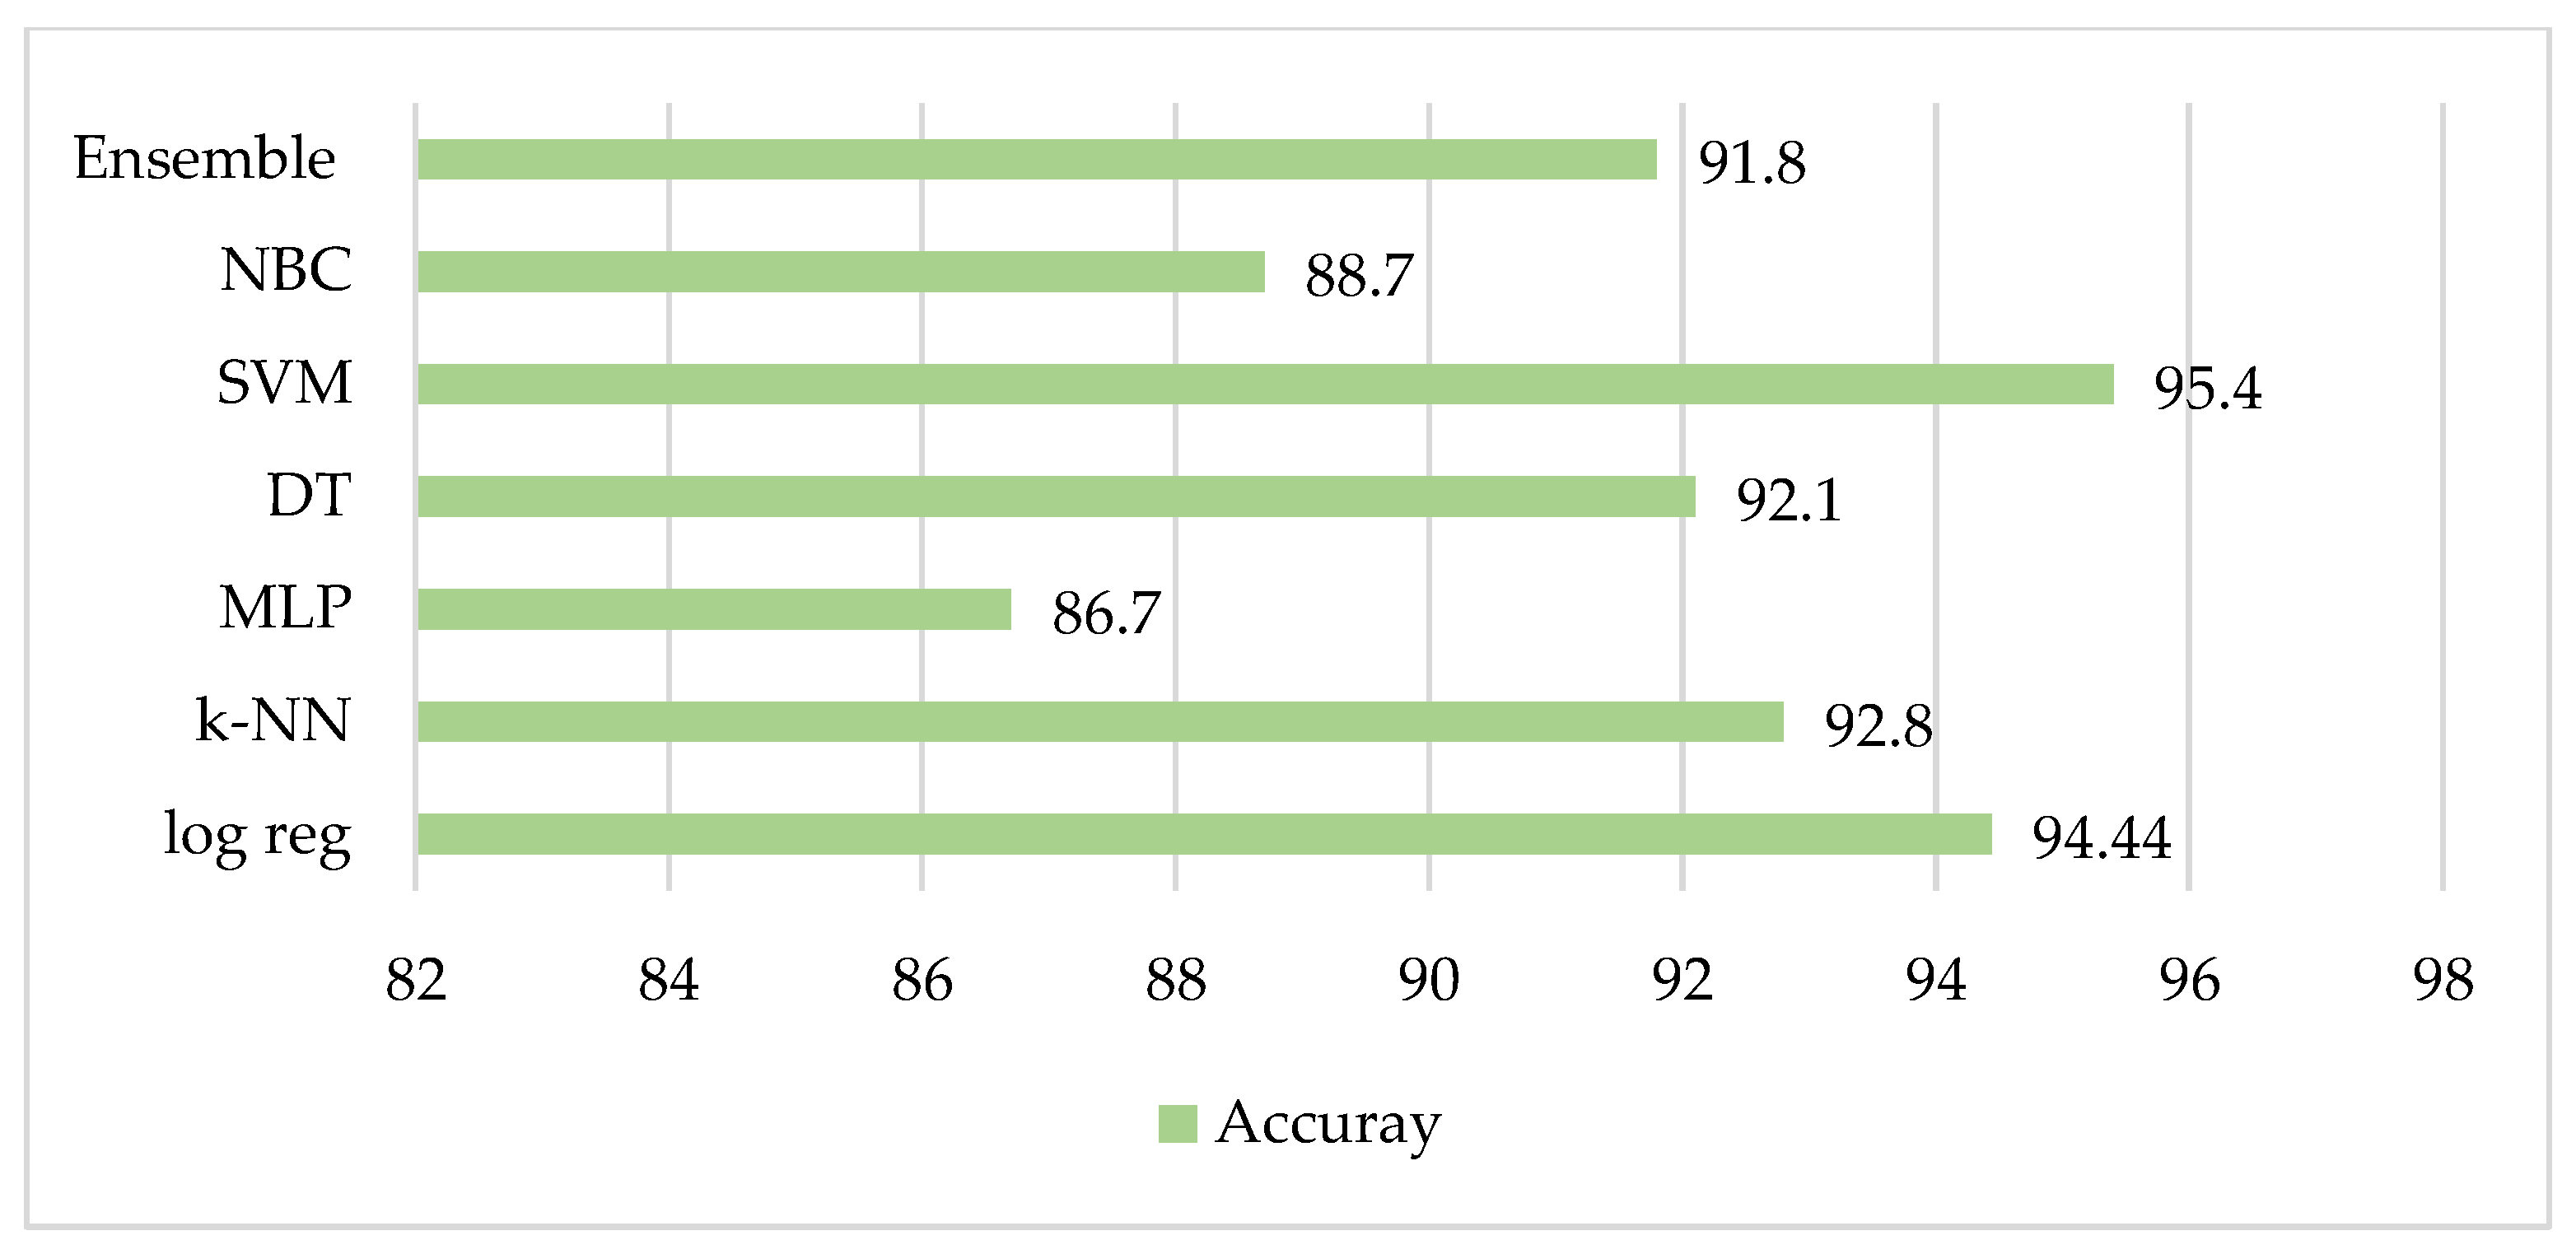
5.1. Comparison with Statistical Analysis

In the previous study [20], a statistical model was developed with an accuracy of 60.8%. It is worth noting that the same dataset was used to develop an iEWS predictor and the accuracy was compared [20]. In comparison to the old EWS model, this new iEWS predicted the accuracy of 97%, which is an improvement of at least 36.2%. Accuracy of prediction was 97% in week 6, 98% in week 8 and 98.4% in week 10.
Furthermore, the main advantage of the proposed iEWS is that it can predict whether a student can pass or fail so the corrective measures can be taken as early as possible. The model was able to identify and predict the student’s performance just by analysing the three attributes (i.e., avgcomprate, avglogin, and courseworkscore). It is worth noting that out of nine different classification tools, RF predicted the best performance (accuracy) with the given attributes. Therefore, weeks 6, 8, and 10 datasets are employed to develop the model. It was seen that week 6 showed very promising results for which the sensitivity, specificity, precision, accuracy, MCC for iEWS for 6-, 8- and 10-fold cross-validation trials were calculated.

5.2. iEWS Prediction with RF

The aim of Moodle-based EWS is to monitor the learning progress of students in a course and to identify at-risk students as early as possible so teachers can implement strategies to assist those students. The early prediction in week 6 (which very high accuracy) of the semester by the proposed iEWS shows a promising tool that can be used by HEIs to intervene and assist the more vulnerable students. This prediction uses significant features of average completion rate, average login frequency and coursework from EWS plugin in this first year IT course.
The effective use of RF classifier in EWS also contributes to the outcome. In short, the combination of EWS data + RF classifier play a significant role in predicting whether students pass or fail the course. The results for Week 6 are given in Figure 5 with three different folds. A huge improvement in accuracy for proposed iEWS by at least 36.2% is seen over the statistical model in [20]. It is also observed that iEWS predictor recorded high sensitivity, specificity, precision and MCC, implying its great performance. The promising results show the ability of the proposed iEWS predictor to correctly identify students passing and failing the course as early as week 6 of the semester. Consequently, using an RF-based model has the potential to accelerate educational development, and the efficiency of education may be shown to increase dramatically. By effectively and efficiently using RF methods in the context of teaching and learning, education will be transformed, radically altering teaching, learning, and research. Educators that use digital tools will acquire a better knowledge of how their students are developing with their studies, allowing them to intervene early and increase student performance and retention.
It is worth noting that the features and classifier used for this study may not work for other courses as the online presence and activities differ in courses. The more online activities a course would have, the better the ability for prediction, as the activities will contribute to the completion rate and coursework of EWS. A similar study was carried out to predict at-risk students in a course using standards-based grading where they created a specific course predictive model to identify at-risk student in week 5 [31]. The common tool used in this study was SVM, K-NN and Naive Bayes classifier. The Naïve Bayes classifier had the best results among the seven testing models. The different accuracy of the prediction model used are showed in Figure 6.
In most cases, the EWS report relied on midterm grades [35]. At this point, it is often too late into the term and students either cannot cope or drop out of the course. This has been one of the drawbacks of EWS. For this reason, improving the accuracy of EWS and predicting performance much earlier is of great importance. In iEWS, RF classification is used, which predicted more accurately and early in the semester. In this study, since the EWS was introduced in the course in week 4, the earliest prediction could be made in week 6. However, if EWS is engaged in a course much earlier, detection could be even sooner.
As discussed earlier, the proposed model is able to predicate the students’ performance as early as week 6 of the semester, with an accuracy of 97.03%. Furthermore, most literature studies propose self-developed models to predict the student performance, but they have failed to mention how early in the semester the prediction of student performances were made. However, the proposed model enabled sustainability in education by providing a iEWS for students as well as for educators. It also saves energy, time, and resources while predicating the students’ performance as early as possible.

6. Conclusions

The tendency of students to procrastinate and fall under at-risk categories is often reported by numerous academics as a significant factor that negatively influences student success in higher education blended courses, making its prediction a very useful task for universities and students alike. In this context, this research conducts a different approach, i.e., an AI-based predictor that can predict students’ performance as early as possible in the era of the SDGs from a systems perspective. The use of ICT tools contributes to an excellent learning environment among students and learning pedagogies. Such tools were heavily involved in the current education system which uplifted and connected the whole society.
In this work, an AI approach is applied to the same model, the RF classifier model was developed with week 6 EWS data and an accuracy of 97.03% was achieved. An AI platform is designed with LMS and EWS, and the RF classifier is applied with respective sensitivity, specificity and precision. All methods appeared to be sensitive to the increment in the number of classes. RF, with an accuracy of 97.03%, showed a better performance using categorical features compared to other classification methods (see Figure 5). When comparing the accuracy of prediction of student performance using iEWS with that determined through a statistical analysis, it proved higher by more than 35%. In future, this work can be expanded by using a different predictive method and feature vectors of different lengths from different courses. Moreover, different hybrid feature vectors can be created using pre-education grade, students’ submission, logins, gender, location of origin, and social interaction behaviour to examine the effect of various time-related indicators on the EWS and at-risk student’s predication as earliest possible.
This research objective process can help all those involved in education and sustainability collaborate more effectively, allowing educational institutions to develop a clear vision of what sustainability means to them, and work towards transforming individuals, groups, organisations, communities, and systems by developing the skills needed to transition to a more sustainable future. One of the most significant effects of digitisation in the coming decades will undoubtedly be in the field of virtual education. The development and delivery of course content and curricula will be drastically altered as a result of the digitisation of education. Curricula will need to reflect this digitally capable culture to ensure pupils remain engaged in learning, given the increased digital awareness and competency of students, even those as young as pre-school age. Curricula with more flexibility, standardisation, and even globalisation have the potential to promote equitability and give more options.
In broad terms, sustainability in education is an attempt to reconcile growing a quality learning environment with socio-economic objectives. The framework established to address the requirement to contextualise the function of ESD helps both educators and students to see the wider picture and grasp the role of education in sustainable development. During the COVID-19 outbreak, these experimental findings demonstrate that the suggested prediction model satisfies the required accuracy, precision, and recall factors for forecasting the behavioural elements of teaching and e-learning for students in virtual education systems. Its phases should be thought of as conceptual, since greater specificity will be heavily influenced by the setting, institutional capability, challenge, timing, and resources available to the educational redesign process.

Author Contributions

Conceptualization, A.J.; methodology, A.A.C.; software, V.S.; validation, A.A.C. and V.S.; formal analysis, V.S.; investigation, A.A.C. and K.A.M.; resources, A.J.; data curation, A.J.; writing—original draft preparation, A.A.C., V.S. and K.A.M.; writing—review and editing, A.A.C., A.J. and V.S.; visualization, A.J.; supervision, A.J.; project administration, A.J.; funding acquisition, A.J. and K.A.M. All authors have read and agreed to the published version of the manuscript.

Funding

This research project is funded by The University of the South Pacific (USP) under the Pacific Islands Forum Secretariat grant.

Institutional Review Board Statement

Not applicable.

Informed Consent Statement

Not applicable.

Data Availability Statement

Data is contained within the article.

Acknowledgments

Authors would like to acknowledge the support from the School of Information Technology, Engineering, Mathematics and Physics (STEMP) and Research Office.

Conflicts of Interest

The authors declare no conflict of interest.

Abbreviations

The following abbreviations are used in this manuscript:
ANNArtificial Neural Network
DMData Mining
DNNDeep Neural Network
EQEEquitable Quality Education
ESDEducation for Sustainable Development
EWSEarly Warning System
HEIHigher Education Institutions
iEWSIntelligent Early Warning System
KNNK-nearest neighbors
LMSLearning Management Systems
RFRandom Forest
SDGsSustainable Development Goals
SVMSupport Vector Machine

References

  1. United Nations. Sustainable Development Goals. Available online: http://www.undp.org/content/undp/en/home/sustainable-development (accessed on 15 October 2021).
  2. Messner, D.; Nakicenovic, N.; Zimm, C.; Clarke, G.; Rockström, J.; Aguiar, A.P.; Boza-Kiss, B.; Campagnolo, L.; Chabay, I.; Collste, D.; et al. The Digital Revolution and Sustainable Development: Opportunities and Challenges-Report Prepared by The World in 2050 Initiative; International Institute for Applied Systems Analysis (IIASA): Laxenburg, Austria, 2019. [Google Scholar]
  3. Kioupi, V.; Voulvoulis, N. Education for sustainable development: A systemic framework for connecting the SDGs to educational outcomes. Sustainability 2019, 11, 6104. [Google Scholar] [CrossRef] [Green Version]
  4. Jayaprakash, S.M.; Moody, E.W.; Lauría, E.J.; Regan, J.R.; Baron, J.D. Early alert of academically at-risk students: An open source analytics initiative. J. Learn. Anal. 2014, 1, 6–47. [Google Scholar] [CrossRef] [Green Version]
  5. Petruzzellis, L.; Romanazzi, S. Educational value: How students choose university: Evidence from an Italian university. Int. J. Educ. Manag. 2010, 24, 139–158. [Google Scholar] [CrossRef]
  6. Young, M.F.; Slota, S.; Cutter, A.B.; Jalette, G.; Mullin, G.; Lai, B.; Simeoni, Z.; Tran, M.; Yukhymenko, M. Our princess is in another castle: A review of trends in serious gaming for education. Rev. Educ. Res. 2012, 82, 61–89. [Google Scholar] [CrossRef] [Green Version]
  7. Islam, A.A.; Mok, M.M.C.; Gu, X.; Spector, J.; Hai-Leng, C. ICT in higher education: An exploration of practices in Malaysian universities. IEEE Access 2019, 7, 16892–16908. [Google Scholar] [CrossRef]
  8. Tseng, H.; Yi, X.; Yeh, H.T. Learning-related soft skills among online business students in higher education: Grade level and managerial role differences in self-regulation, motivation, and social skill. Comput. Hum. Behav. 2019, 95, 179–186. [Google Scholar] [CrossRef]
  9. Sharma, B.; Nand, R.; Naseem, M.; Reddy, E.V. Effectiveness of online presence in a blended higher learning environment in the Pacific. Stud. High. Educ. 2020, 45, 1547–1565. [Google Scholar] [CrossRef]
  10. Rodrigues, H.; Almeida, F.; Figueiredo, V.; Lopes, S. Mapping key concepts of e-learning and educational-systematic review through published papers. In Proceedings of the 11th Annual International Conference of Education, Research and Innovation, Seville, Spain, 12–14 November 2018; pp. 8949–8952. [Google Scholar]
  11. Chand, A.A.; Lal, P.P.; Chand, K.K. Remote learning and online teaching in Fiji during COVID-19: The challenges and opportunities. Int. J. Surg. 2021, 92, 106019. [Google Scholar] [CrossRef] [PubMed]
  12. Sharma, B.N.; Reddy, P.; Reddy, E.; Narayan, S.S.; Singh, V.; Kumar, R.; Naicker, R.; Prasad, R. Use of Mobile Devices for Learning and Student Support in the Pacific Region. In Handbook of Mobile Teaching and Learning; Zhang, Y., Cristol, D., Eds.; Springer: Berlin/Heidelberg, Germany, 2019. [Google Scholar]
  13. Sharma, B.; Kumar, R.; Rao, V.; Finiasi, R.; Chand, S.; Singh, V.; Naicker, R. A mobile learning journey in Pacific education. In Mobile Learning in Higher Education in the Asia-Pacific Region; Springer: Singapore, 2017; pp. 581–605. [Google Scholar]
  14. Singh, V. Android based student learning system. In Proceedings of the 2015 2nd Asia-Pacific World Congress on Computer Science and Engineering (APWC on CSE), Suva, Fiji, 2–4 December 2015; IEEE: New York, NY, USA; pp. 1–9. [Google Scholar]
  15. Denning, P.J.; Lewis, T.G. Intelligence May Not Be Computable: A hierarchy of artificial intelligence machines ranked by their learning power shows their abilities--and their limits. Am. Sci. 2019, 107, 346–350. [Google Scholar] [CrossRef]
  16. Zhao, Y.; Liu, G. How do teachers face educational changes in artificial intelligence era. Adv. Soc. Sci. Educ. Humanit. Res. 2018, 300, 47–50. [Google Scholar]
  17. Zawacki-Richter, O.; Marín, V.I.; Bond, M.; Gouverneur, F. Systematic review of research on artificial intelligence applications in higher education–where are the educators? Int. J. Educ. Technol. High. Educ. 2019, 16, 39. [Google Scholar] [CrossRef] [Green Version]
  18. Kumar, N.M.; Krishna, P.R.; Pagadala, P.K.; Kumar, N.S. Use of smart glasses in education-a study. In Proceedings of the 2018 2nd International Conference on I-SMAC (IoT in Social, Mobile, Analytics and Cloud)(I-SMAC) I-SMAC (IoT in Social, Mobile, Analytics and Cloud)(I-SMAC), Coimbatore, India, 30–31 August 2018; IEEE: New York, NY, USA; pp. 56–59. [Google Scholar]
  19. Kumar, N.M.; Singh, N.K.; Peddiny, V.K. Wearable smart glass: Features, applications, current progress and challenges. In Proceedings of the 2018 Second International Conference on Green Computing and Internet of Things (ICGCIoT), Bangalore, India, 16–18 August 2018; IEEE: New York, NY, USA; pp. 577–582. [Google Scholar]
  20. Jokhan, A.; Sharma, B.; Singh, S. Early warning system as a predictor for student performance in higher education blended courses. Stud. High. Educ. 2019, 44, 1900–1911. [Google Scholar] [CrossRef]
  21. Pierrakeas, C.; Koutsonikos, G.; Lipitakis, A.D.; Kotsiantis, S.; Xenos, M.; Gravvanis, G.A. The variability of the reasons for student dropout in distance learning and the prediction of dropout-prone students. In Machine Learning Paradigms; Springer: Cham, Switzerland, 2020; pp. 91–111. [Google Scholar]
  22. Hochachka, W.M.; Caruana, R.; Fink, D.; Munson, A.R.T.; Riedewald, M.; Sorokina, D.; Kelling, S. Data-mining discovery of pattern and process in ecological systems. J. Wildl. Manag. 2007, 71, 2427–2437. [Google Scholar] [CrossRef]
  23. Dutt, A.; Ismail, M.A.; Herawan, T. A systematic review on educational data mining. IEEE Access 2017, 5, 15991–16005. [Google Scholar] [CrossRef]
  24. Romero, C.; Ventura, S.; Espejo, P.G.; Hervás, C. Data mining algorithms to classify students. In Proceedings of the Educational Data Mining 2008, The 1st International Conference on Educational Data Mining, Montreal, QC, Canada, 20–21 June 2008. [Google Scholar]
  25. Buenaño-Fernandez, D.; Villegas-CH, W.; Luján-Mora, S. The use of tools of data mining to decision making in engineering education—A systematic mapping study. Comput. Appl. Eng. Educ. 2019, 27, 744–758. [Google Scholar] [CrossRef] [Green Version]
  26. Buenaño-Fernández, D.; Gil, D.; Luján-Mora, S. Application of machine learning in predicting performance for computer engineering students: A case study. Sustainability 2019, 11, 2833. [Google Scholar] [CrossRef] [Green Version]
  27. Avramidis, E.; Skidmore, D. Reappraising learning support in higher education. Res. Post-Compuls. Educ. 2004, 9, 63–82. [Google Scholar] [CrossRef]
  28. Wolff, A.; Zdrahal, Z.; Nikolov, A.; Pantucek, M. Improving retention: Predicting at-risk students by analysing clicking behaviour in a virtual learning environment. In Proceedings of the Third International Conference on Learning Analytics and Knowledge, Leuven, Belgium, 8–13 April 2013; pp. 145–149. [Google Scholar]
  29. Marbouti, F.; Diefes-Dux, H.A.; Madhavan, K. Models for early prediction of at-risk students in a course using standards-based grading. Comput. Educ. 2016, 103, 1–15. [Google Scholar] [CrossRef] [Green Version]
  30. Howard, E.; Meehan, M.; Parnell, A. Contrasting prediction methods for early warning systems at undergraduate level. Internet High. Educ. 2018, 37, 66–75. [Google Scholar] [CrossRef] [Green Version]
  31. Hu, Y.H.; Lo, C.L.; Shih, S.P. Developing early warning systems to predict students’ online learning performance. Comput. Hum. Behav. 2014, 36, 469–478. [Google Scholar] [CrossRef]
  32. Romero, C.; Ventura, S. Educational data mining: A review of the state of the art. IEEE Trans. Syst. Man Cybern. Part C Appl. Rev. 2010, 40, 601–618. [Google Scholar] [CrossRef]
  33. Casillas, A.; Robbins, S.; Allen, J.; Kuo, Y.L.; Hanson, M.A.; Schmeiser, C. Predicting early academic failure in high school from prior academic achievement, psychosocial characteristics, and behavior. J. Educ. Psychol. 2012, 104, 407. [Google Scholar] [CrossRef] [Green Version]
  34. Agaoglu, M. Predicting instructor performance using data mining techniques in higher education. IEEE Access 2016, 4, 2379–2387. [Google Scholar] [CrossRef]
  35. Gašević, D.; Dawson, S.; Rogers, T.; Gasevic, D. Learning analytics should not promote one size fits all: The effects of instructional conditions in predicting academic success. Internet High. Educ. 2016, 28, 68–84. [Google Scholar] [CrossRef] [Green Version]
  36. Calvo-Flores, M.D.; Galindo, E.G.; Jiménez, M.P.; Piñeiro, O.P. Predicting students’ marks from Moodle logs using neural network models. Curr. Dev. Technol.-Assist. Educ. 2006, 1, 586–590. [Google Scholar]
  37. Azcona, D.; Casey, K. Micro-analytics for student performance prediction. Int. J. Comput. Sci. Softw. Eng. 2015, 4, 218–223. [Google Scholar]
  38. Ognjanovic, I.; Gasevic, D.; Dawson, S. Using institutional data to predict student course selections in higher education. Internet High. Educ. 2016, 29, 49–62. [Google Scholar] [CrossRef] [Green Version]
  39. Andriessen, J.; Sandberg, J. Where is education heading and how about AI. Int. J. Artif. Intell. Educ. 1999, 10, 130–150. [Google Scholar]
  40. Vasileva-Stojanovska, T.; Malinovski, T.; Vasileva, M.; Jovevski, D.; Trajkovik, V. Impact of satisfaction, personality and learning style on educational outcomes in a blended learning environment. Learn. Individ. Differ. 2015, 38, 127–135. [Google Scholar] [CrossRef]
  41. Basavaraju, P.; Varde, A.S. Supervised learning techniques in mobile device apps for Androids. ACM SIGKDD Explor. Newsl. 2017, 18, 18–29. [Google Scholar] [CrossRef]
  42. Amrieh, E.A.; Hamtini, T.; Aljarah, I. Mining educational data to predict student’s academic performance using ensemble methods. Int. J. Database Theory Appl. 2016, 9, 119–136. [Google Scholar] [CrossRef]
  43. Bendangnuksung, P.P. Students’ performance prediction using deep neural network. Int. J. Appl. Eng. Res. 2018, 13, 1171–1176. [Google Scholar]
  44. Okubo, F.; Yamashita, T.; Shimada, A.; Ogata, H. A neural network approach for students’ performance prediction. In Proceedings of the Seventh International Learning Analytics & Knowledge Conference, Vancouver, BC, Canada, 13–17 March 2017; pp. 598–599. [Google Scholar]
  45. Shahiri, A.M.; Husain, W. A review on predicting student’s performance using data mining techniques. Procedia Comput. Sci. 2015, 72, 414–422. [Google Scholar] [CrossRef] [Green Version]
  46. Sikder, M.F.; Uddin, M.J.; Halder, S. Predicting students yearly performance using neural network: A case study of BSMRSTU. In Proceedings of the 2016 5th International Conference on Informatics, Electronics and Vision (ICIEV), Dhaka, Bangladesh, 13–14 May 2016; IEEE: New York, NY, USA; pp. 524–529. [Google Scholar]
  47. Oladokun, V.O.; Adebanjo, A.T.; Charles-Owaba, O.E. Predicting students academic performance using artificial neural network: A case study of an engineering course. Bull. Educ. Res. 2008, 40, 157–164. [Google Scholar]
  48. Ramesh, V.A.M.A.N.A.N.; Parkavi, P.; Ramar, K. Predicting student performance: A statistical and data mining approach. Int. J. Comput. Appl. 2013, 63, 35–39. [Google Scholar] [CrossRef]
  49. Osmanbegovic, E.; Suljic, M. Data mining approach for predicting student performance. Econ. Rev. J. Econ. Bus. 2012, 10, 3–12. [Google Scholar]
  50. Jishan, S.T.; Rashu, R.I.; Haque, N.; Rahman, R.M. Improving accuracy of students’ final grade prediction model using optimal equal width binning and synthetic minority over-sampling technique. Decis. Anal. 2015, 2, 112. [Google Scholar] [CrossRef]
  51. Arsad, P.M.; Buniyamin, N. A neural network students’ performance prediction model (NNSPPM). In Proceedings of the 2013 IEEE International Conference on Smart Instrumentation, Measurement and Applications (ICSIMA), Kuala Lumpur, Malaysia, 25–27 November 2013; IEEE: New York, NY, USA; pp. 1–5. [Google Scholar]
  52. Gray, G.; McGuinness, C.; Owende, P. An application of classification models to predict learner progression in tertiary education. In Proceedings of the 2014 IEEE International Advance Computing Conference (IACC), Gurgaon, India, 21–22 February 2014; IEEE: New York, NY, USA; pp. 549–554. [Google Scholar]
  53. Wang, T.; Mitrovic, A. Using neural networks to predict student’s performance. In Proceedings of the International Conference on Computers in Education, Auckland, New Zealand, 3–6 December 2002; IEEE: New York, NY, USA; pp. 969–973. [Google Scholar]
  54. Hämäläinen, W.; Vinni, M. Comparison of machine learning methods for intelligent tutoring systems. In Proceedings of the International Conference on Intelligent Tutoring Systems, Jhongli, Taiwan, 26–30 June 2006; Springer: Berlin/Heidelberg, Germany; pp. 525–534. [Google Scholar]
  55. Mayilvaganan, M.; Kalpanadevi, D. Comparison of classification techniques for predicting the performance of students academic environment. In Proceedings of the 2014 International Conference on Communication and Network Technologies, Sivakasi, India, 18–19 December 2014; IEEE: New York, NY, USA; pp. 113–118. [Google Scholar]
  56. Sembiring, S.; Zarlis, M.; Hartama, D.; Ramliana, S.; Wani, E. Prediction of student academic performance by an application of data mining techniques. In Proceedings of the International Conference on Management and Artificial Intelligence IPEDR, Bali, Indonesia, 1–3 April 2011; Volume 6, pp. 110–114. [Google Scholar]
  57. Mishra, T.; Kumar, D.; Gupta, S. Mining students’ data for prediction performance. In Proceedings of the 2014 Fourth International Conference on Advanced Computing & Communication Technologies, Rohtak, India, 8–9 February 2014; pp. 255–262. [Google Scholar]
  58. Natek, S.; Zwilling, M. Student data mining solution–knowledge management system related to higher education institutions. Expert Syst. Appl. 2014, 41, 6400–6407. [Google Scholar] [CrossRef]
  59. Naren, J. Application of data mining in educational database for predicting behavioural patterns of the students. Int. J. Comput. Sci. Inf. Technol. 2014, 5, 4649–4652. [Google Scholar]
  60. Bunkar, K.; Singh, U.K.; Pandya, B.; Bunkar, R. Data mining: Prediction for performance improvement of graduate students using classification. In Proceedings of the 2012 Ninth International Conference on Wireless and Optical Communications Networks (WOCN), Indore, India, 20-22 September 2012; pp. 1–5. [Google Scholar]
  61. Holmes, G.; Donkin, A.; Witten, I.H. Weka: A machine learning workbench. In ANZIIS’94-Australian New Zealnd Intelligent Information Systems; IEEE: New York, NY, USA, 1994; pp. 357–361. [Google Scholar]
  62. Witten, I.H.; Frank, E.; Trigg, L.E.; Hall, M.A.; Holmes, G.; Cunningham, S.J. Weka: Practical Machine Learning Tools and Techniques with Java Implementations. In Proceedings of the ICONIP/ANZIIS/ANNES’99 International Workshop “Future Directions for Intelligent Systems and Information Sciences”, Dunedin, New Zealand, 22–23 November 1999; pp. 192–196. [Google Scholar]
  63. Bhargava, N.; Sharma, G.; Bhargava, R.; Mathuria, M. Decision tree analysis on j48 algorithm for data mining. Int. J. Adv. Res. Comput. Sci. Softw. Eng. 2013, 3, 1114–1119. [Google Scholar]
  64. Ali, S.; Smith, K.A. On learning algorithm selection for classification. Appl. Soft Comput. 2006, 6, 119–138. [Google Scholar] [CrossRef]
  65. Qian, Y.; Liang, J.; Li, D.; Zhang, H.; Dang, C. Measures for evaluating the decision performance of a decision table in rough set theory. Inf. Sci. 2008, 178, 181–202. [Google Scholar] [CrossRef]
  66. Muda, Z.; Yassin, W.; Sulaiman, M.N.; Udzir, N.I. Intrusion detection based on k-means clustering and OneR classification. In Proceedings of the 2011 7th International Conference on Information Assurance and Security (IAS), Melacca, Malaysia, 5–8 December 2011; IEEE: New York, NY, USA; pp. 192–197. [Google Scholar]
  67. Ayinde, A.Q.; Adetunji, A.B.; Bello, M.; Odeniyi, O.A. Performance Evaluation of Naive Bayes and Decision Stump Algorithms in Mining Students’ Educational Data. Int. J. Comput. Sci. Issues 2013, 10, 147. [Google Scholar]
  68. Peng, C.Y.J.; Lee, K.L.; Ingersoll, G.M. An introduction to logistic regression analysis and reporting. J. Educ. Res. 2002, 96, 3–14. [Google Scholar] [CrossRef]
  69. Platt, J. Sequential Minimal Optimization: A Fast Algorithm for Training Support Vector Machines; Microsoft: Washington, DC, USA, 1998; Available online: https://web.iitd.ac.in/~{}sumeet/tr-98-14.pdf (accessed on 15 October 2021).
  70. Gardner, M.W.; Dorling, S.R. Artificial neural networks (the multilayer perceptron)—A review of applications in the atmospheric sciences. Atmos. Environ. 1998, 32, 2627–2636. [Google Scholar] [CrossRef]
  71. Breiman, L. Random forests. Mach. Learn. 2001, 45, 5–32. [Google Scholar] [CrossRef] [Green Version]
  72. Chan, J.C.W.; Paelinckx, D. Evaluation of Random Forest and Adaboost tree-based ensemble classification and spectral band selection for ecotope mapping using airborne hyperspectral imagery. Remote Sens. Environ. 2008, 112, 2999–3011. [Google Scholar] [CrossRef]
  73. Ho, T.K. The random subspace method for constructing decision forests. IEEE Trans. Pattern Anal. Mach. Intell. 1998, 20, 832–844. [Google Scholar]
  74. Xue, Y.; Chen, H.; Jin, C.; Sun, Z.; Yao, X. NBA-Palm: Prediction of palmitoylation site implemented in Naive Bayes algorithm. BMC Bioinform. 2006, 7, 458. [Google Scholar] [CrossRef] [Green Version]
  75. Paliwal, M.; Kumar, U.A. Neural networks and statistical techniques: A review of applications. Expert Syst. Appl. 2009, 36, 2–17. [Google Scholar] [CrossRef]
Figure 1. Steps in data mining.
Sustainability 14 02377 g001
Figure 2. Lists of the common methods and attributes used in EWS as predictive tools.
Sustainability 14 02377 g002
Figure 3. iEWS Architecture.
Sustainability 14 02377 g003
Figure 4. n-fold cross-validation technique.
Sustainability 14 02377 g004
Figure 5. iEWS prediction for (a) 6-fold, (b) 8-fold, and (c) 10-fold.
Sustainability 14 02377 g005aSustainability 14 02377 g005b
Figure 6. Different level of accuracy of the prediction model [29].
Sustainability 14 02377 g006
Table 2. iEWS process flow.
1Students and teachers interact with the course activities.
2All interactions are recorded on Moodle Database.
3EWS data are calculated using Moodle DB and recorded in EWS DB.
4EWS data are extracted, and data prepressing is done (Data cleaning and EWS features are extracted).
5EWS features are used to develop the iEWS predictor.
6The iEWS predictor is tested with the test data.
7If iEWS predicts a student to fail, then teacher sets strategies for these students.
Table 3. Steps for cross-validation approach.
1Split pre-processed data set into n folds of approximately equal sample size with similar positive and negative samples in each.
2Separate one of the folds as an independent test set and use the other n-1 folds as training data.
3Train the model with training data and adjust the parameters of the predictor
4Use the independent test set (2) to validate the predictor by computing all the statistical measures
5Repeat steps 1 to 4 for other folds until n folds for validation and calculate the average of each statistical measure for n-folds and record the result
Publisher’s Note: MDPI stays neutral with regard to jurisdictional claims in published maps and institutional affiliations.

