
Analysis of Relationship between Road Geometry and Automated Driving Safety for Automated Vehicle-Based Mobility Service


Abstract
:1. Introduction
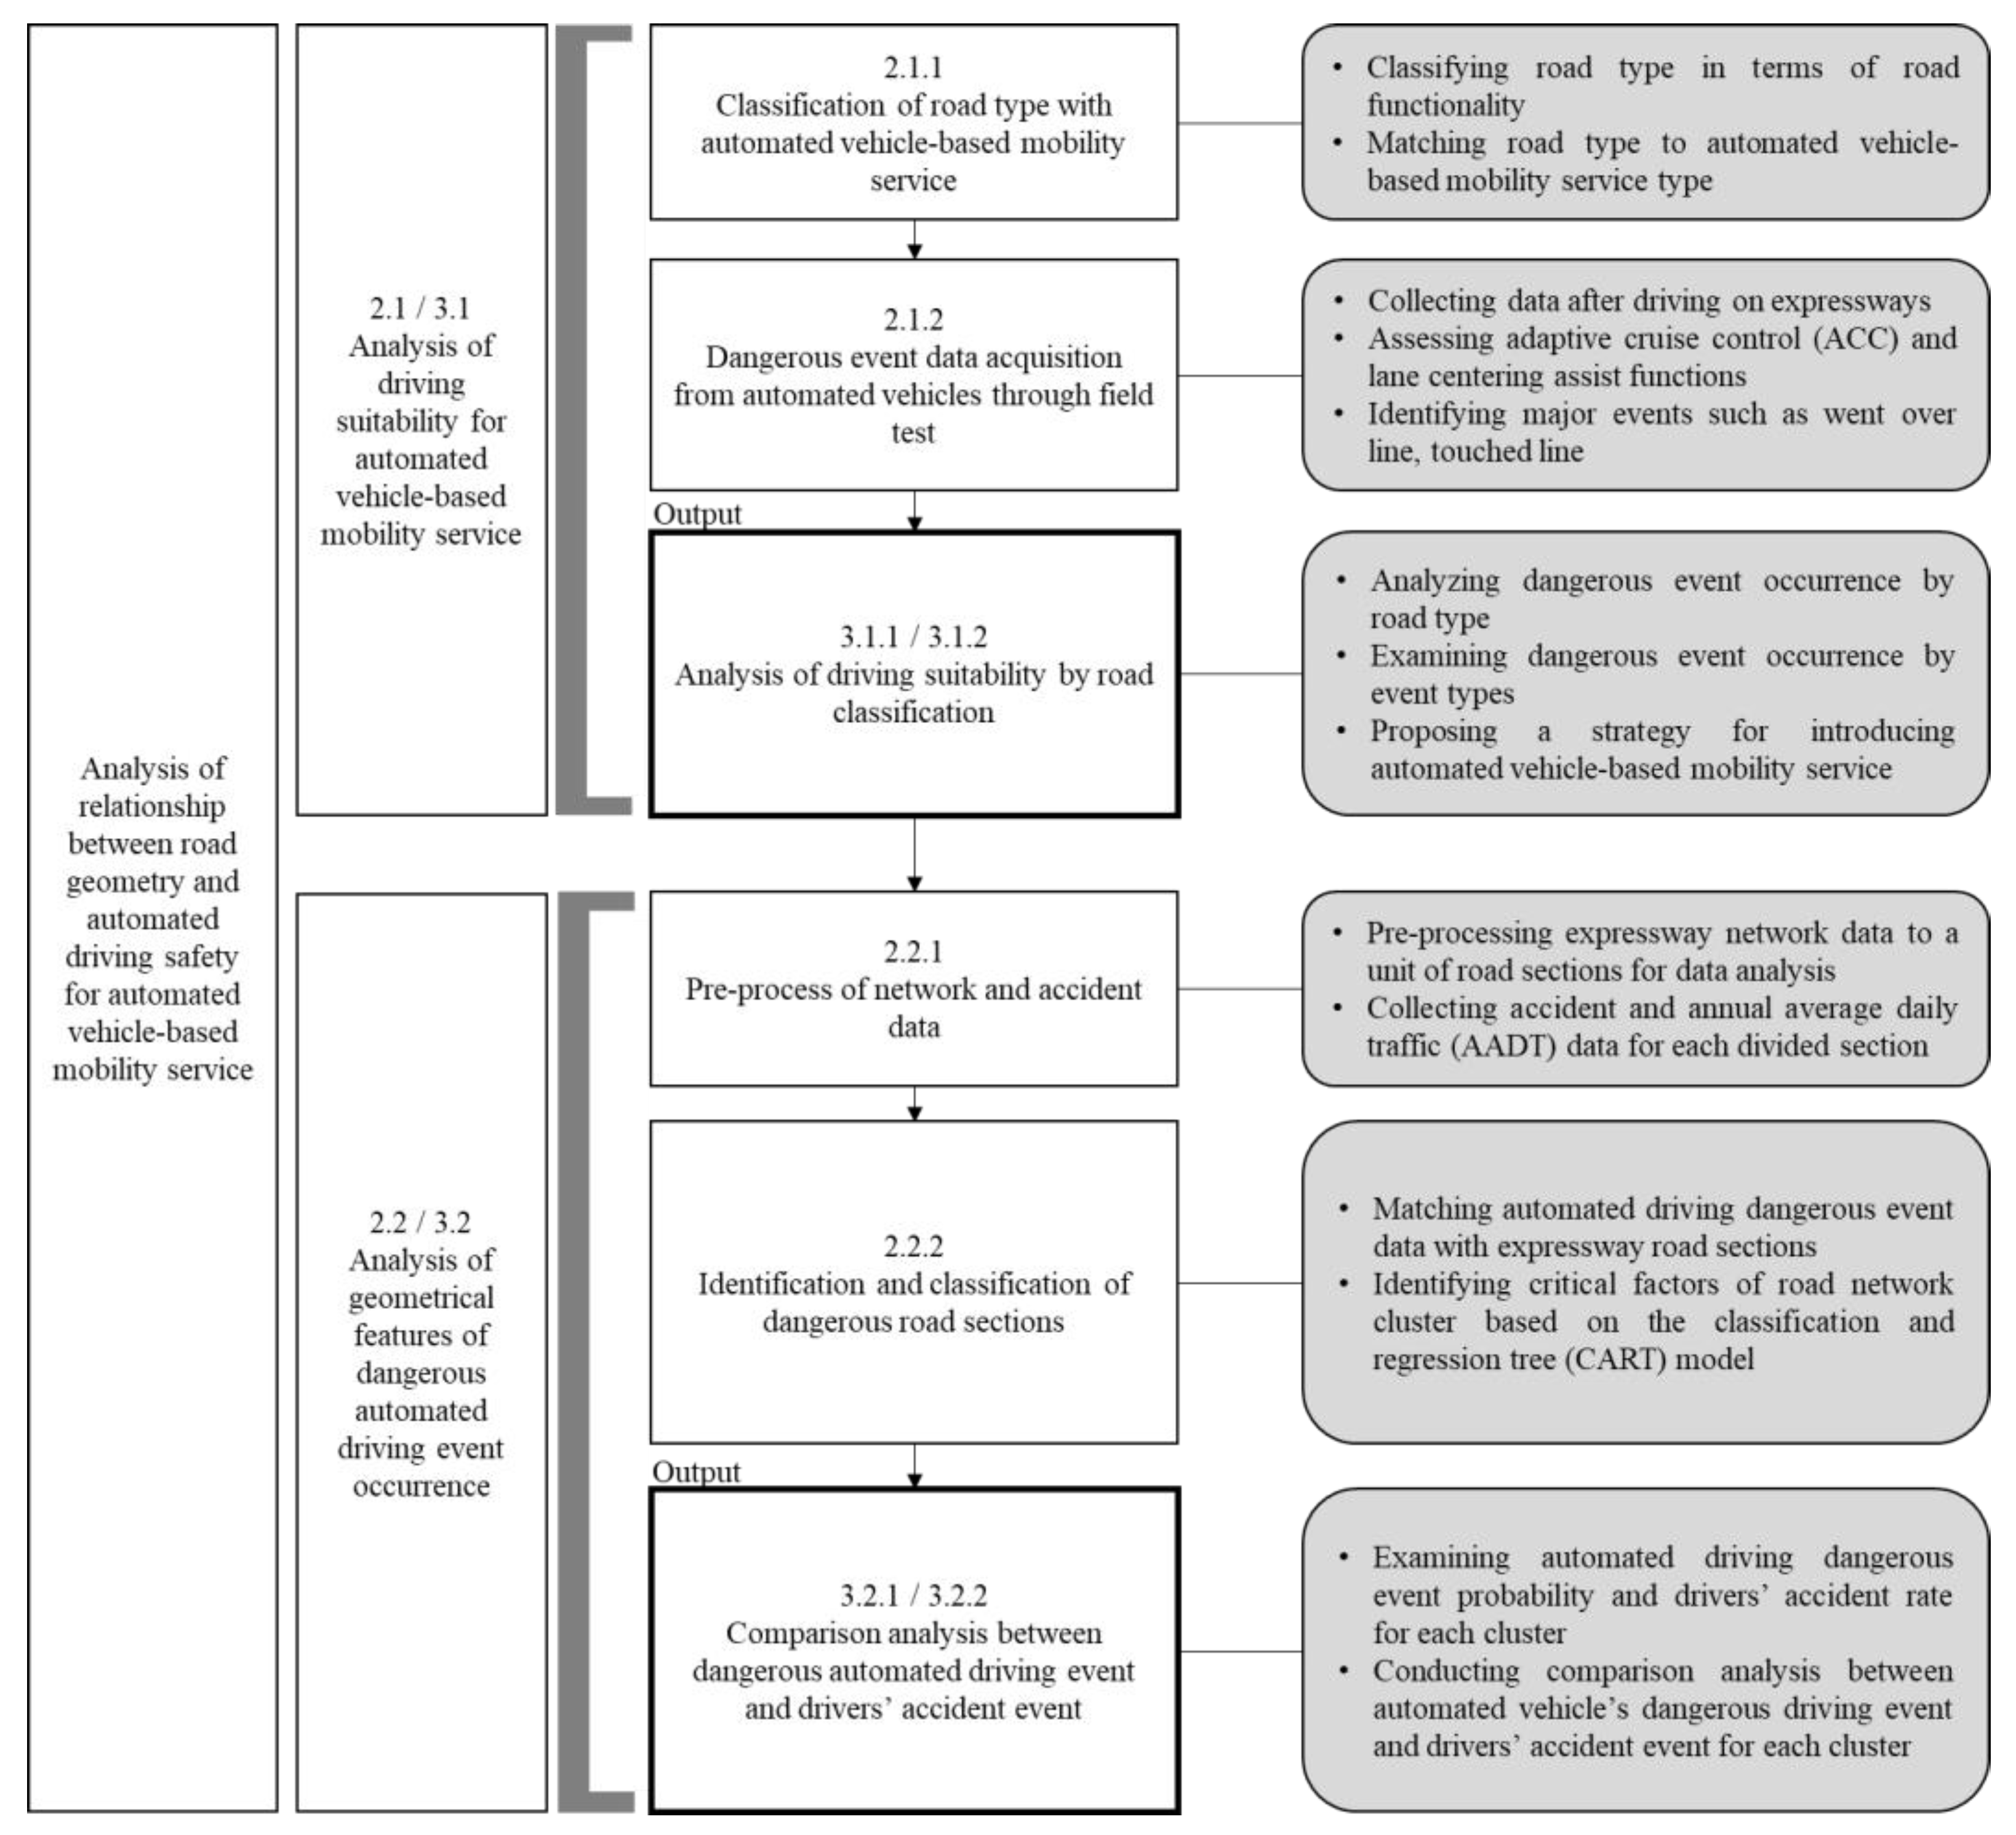
2. Methodology
2.1. Driving Suitability Analysis Method
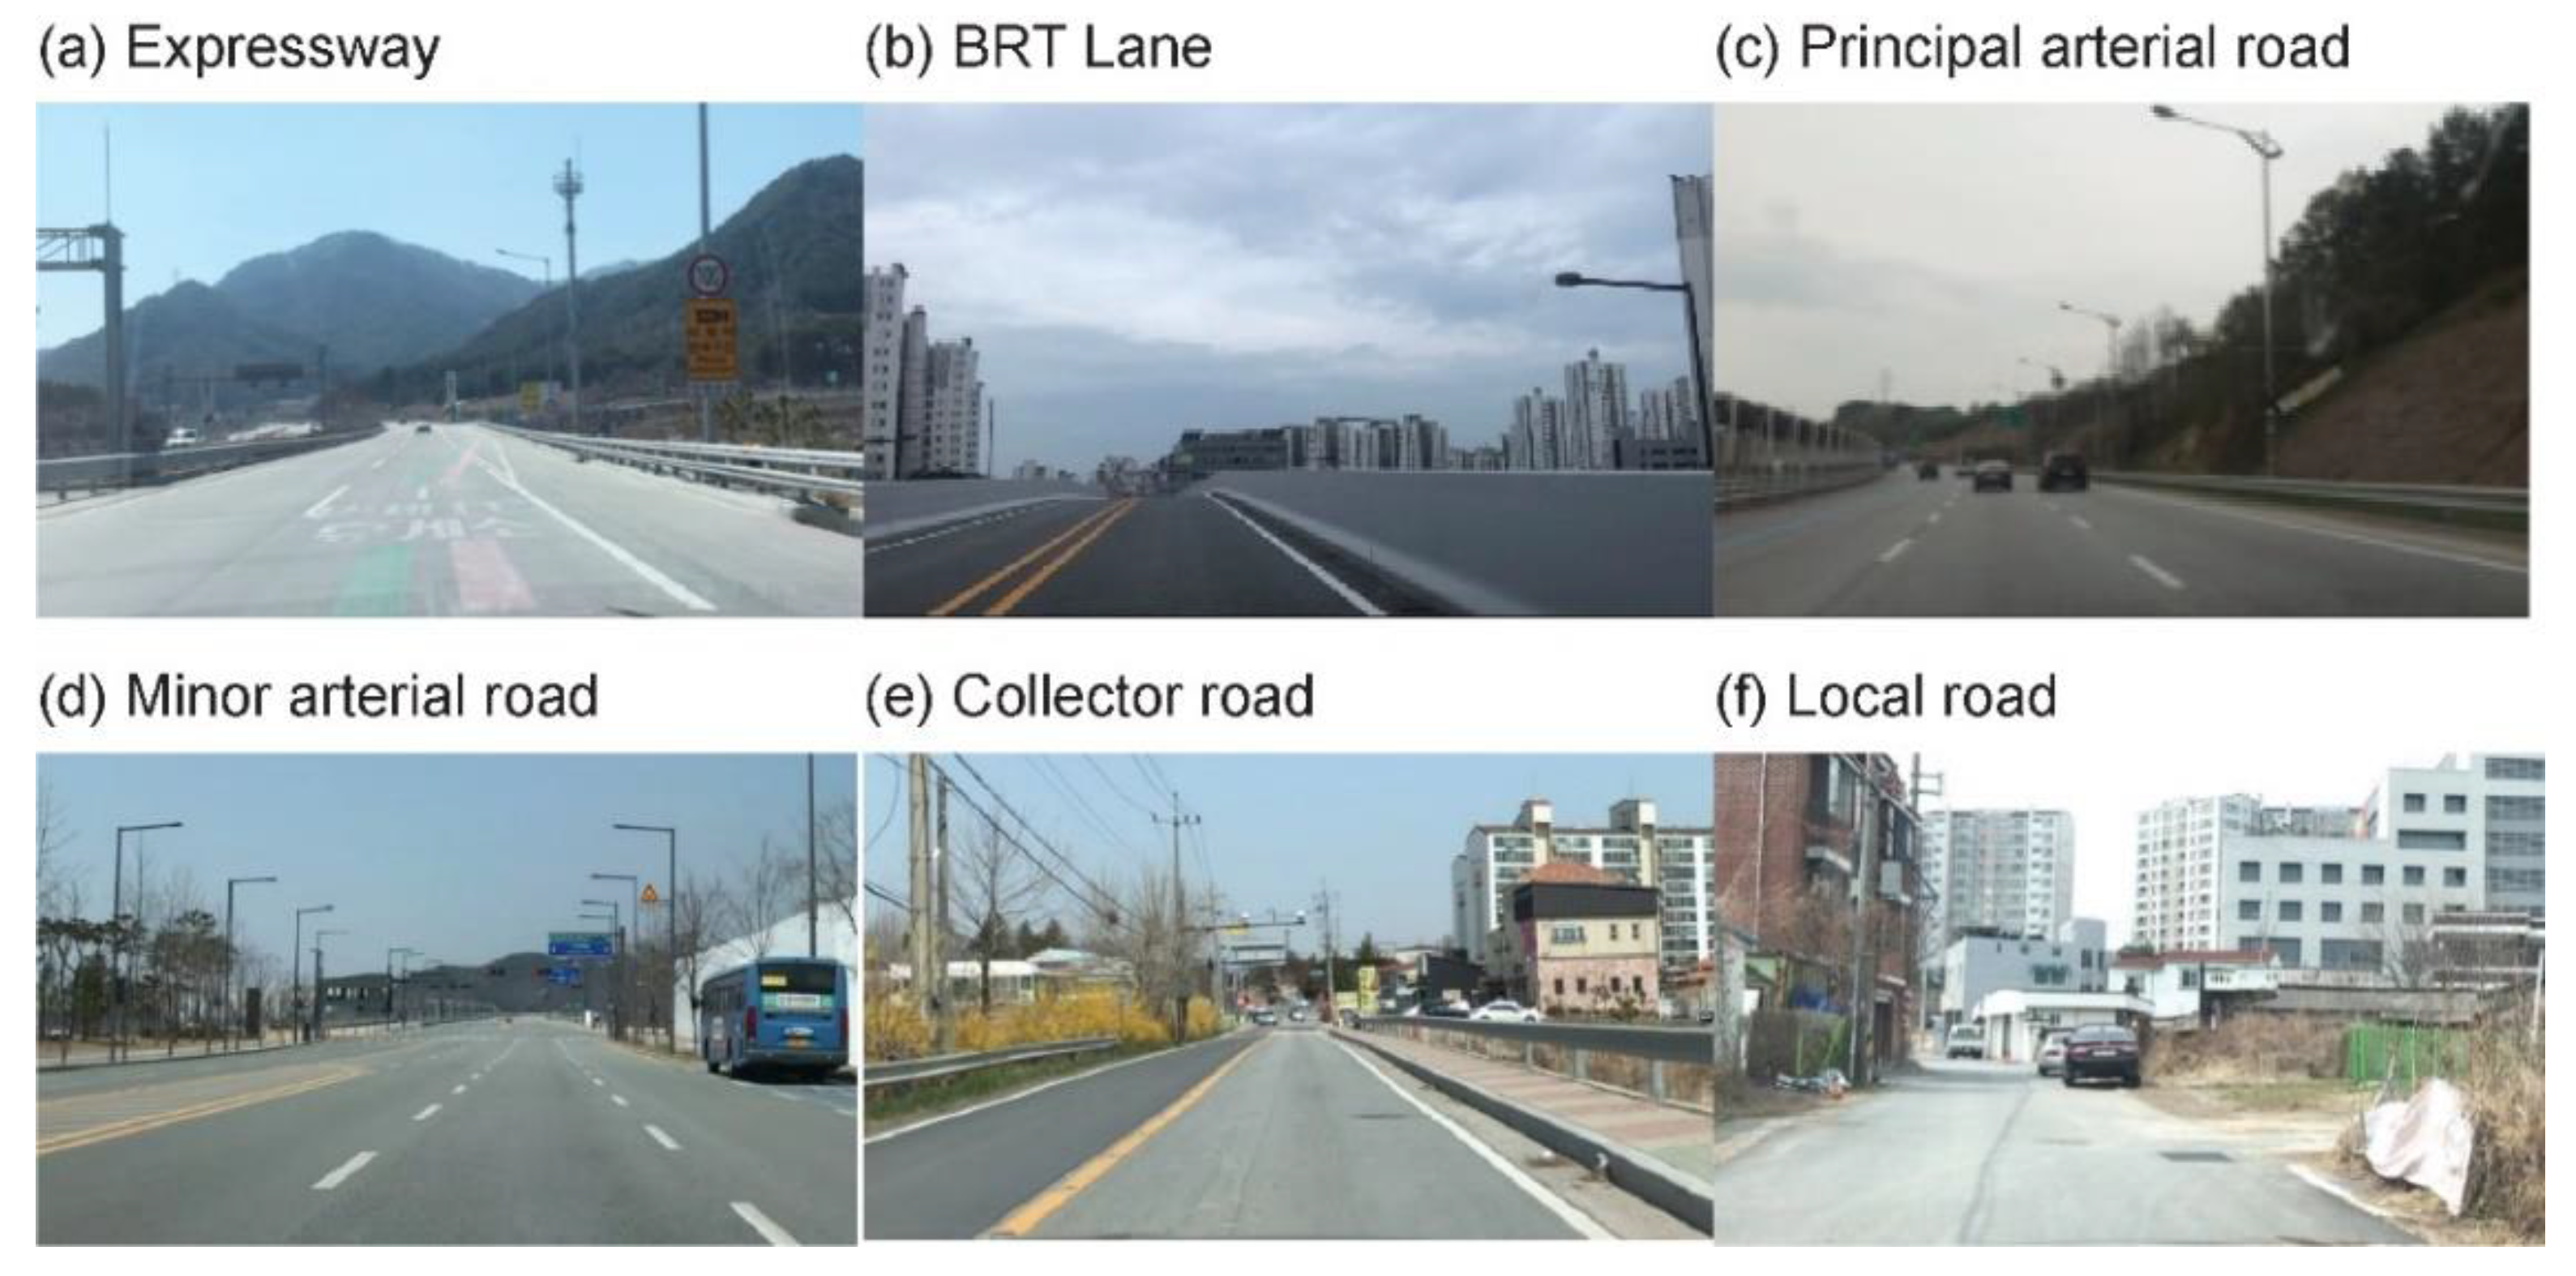
2.1.1. Classifying Roads by AVM Service
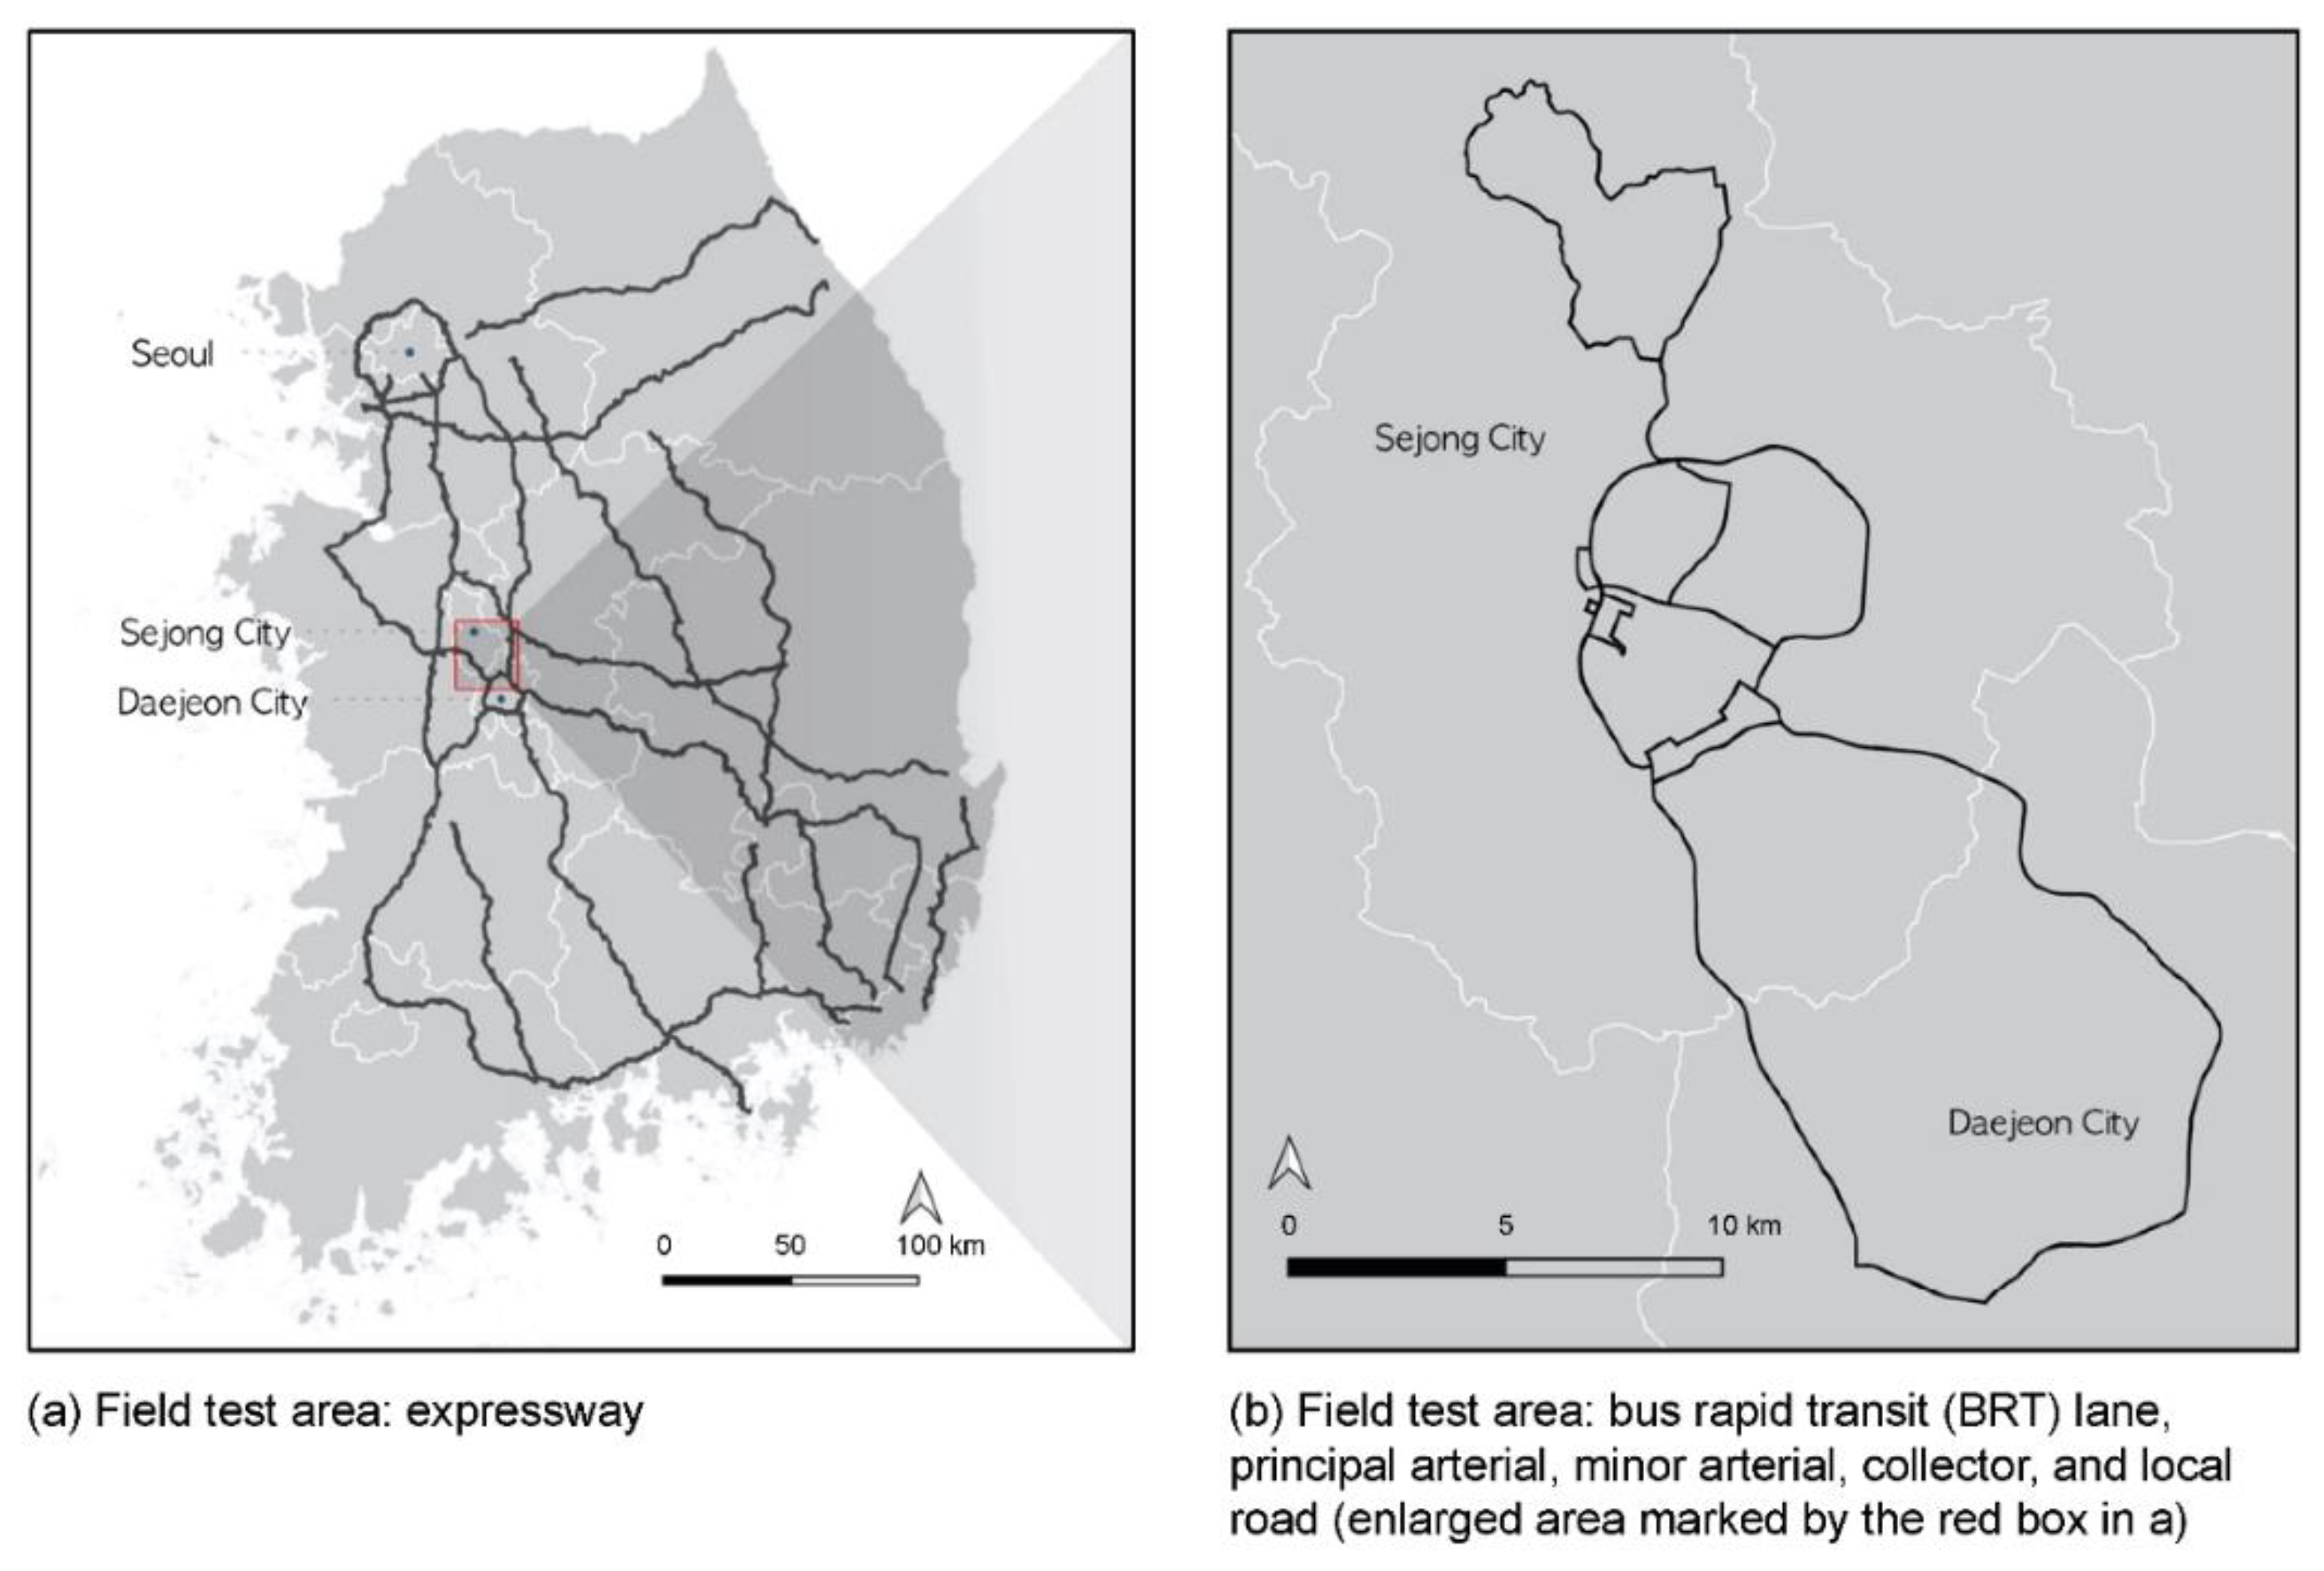
2.1.2. Obtaining Dangerous Event Data from Automated Vehicles through Field Tests
2.2. Geometrical Features of the Dangerous Event Occurrence
2.2.1. Preprocessing the Network and Accident Data
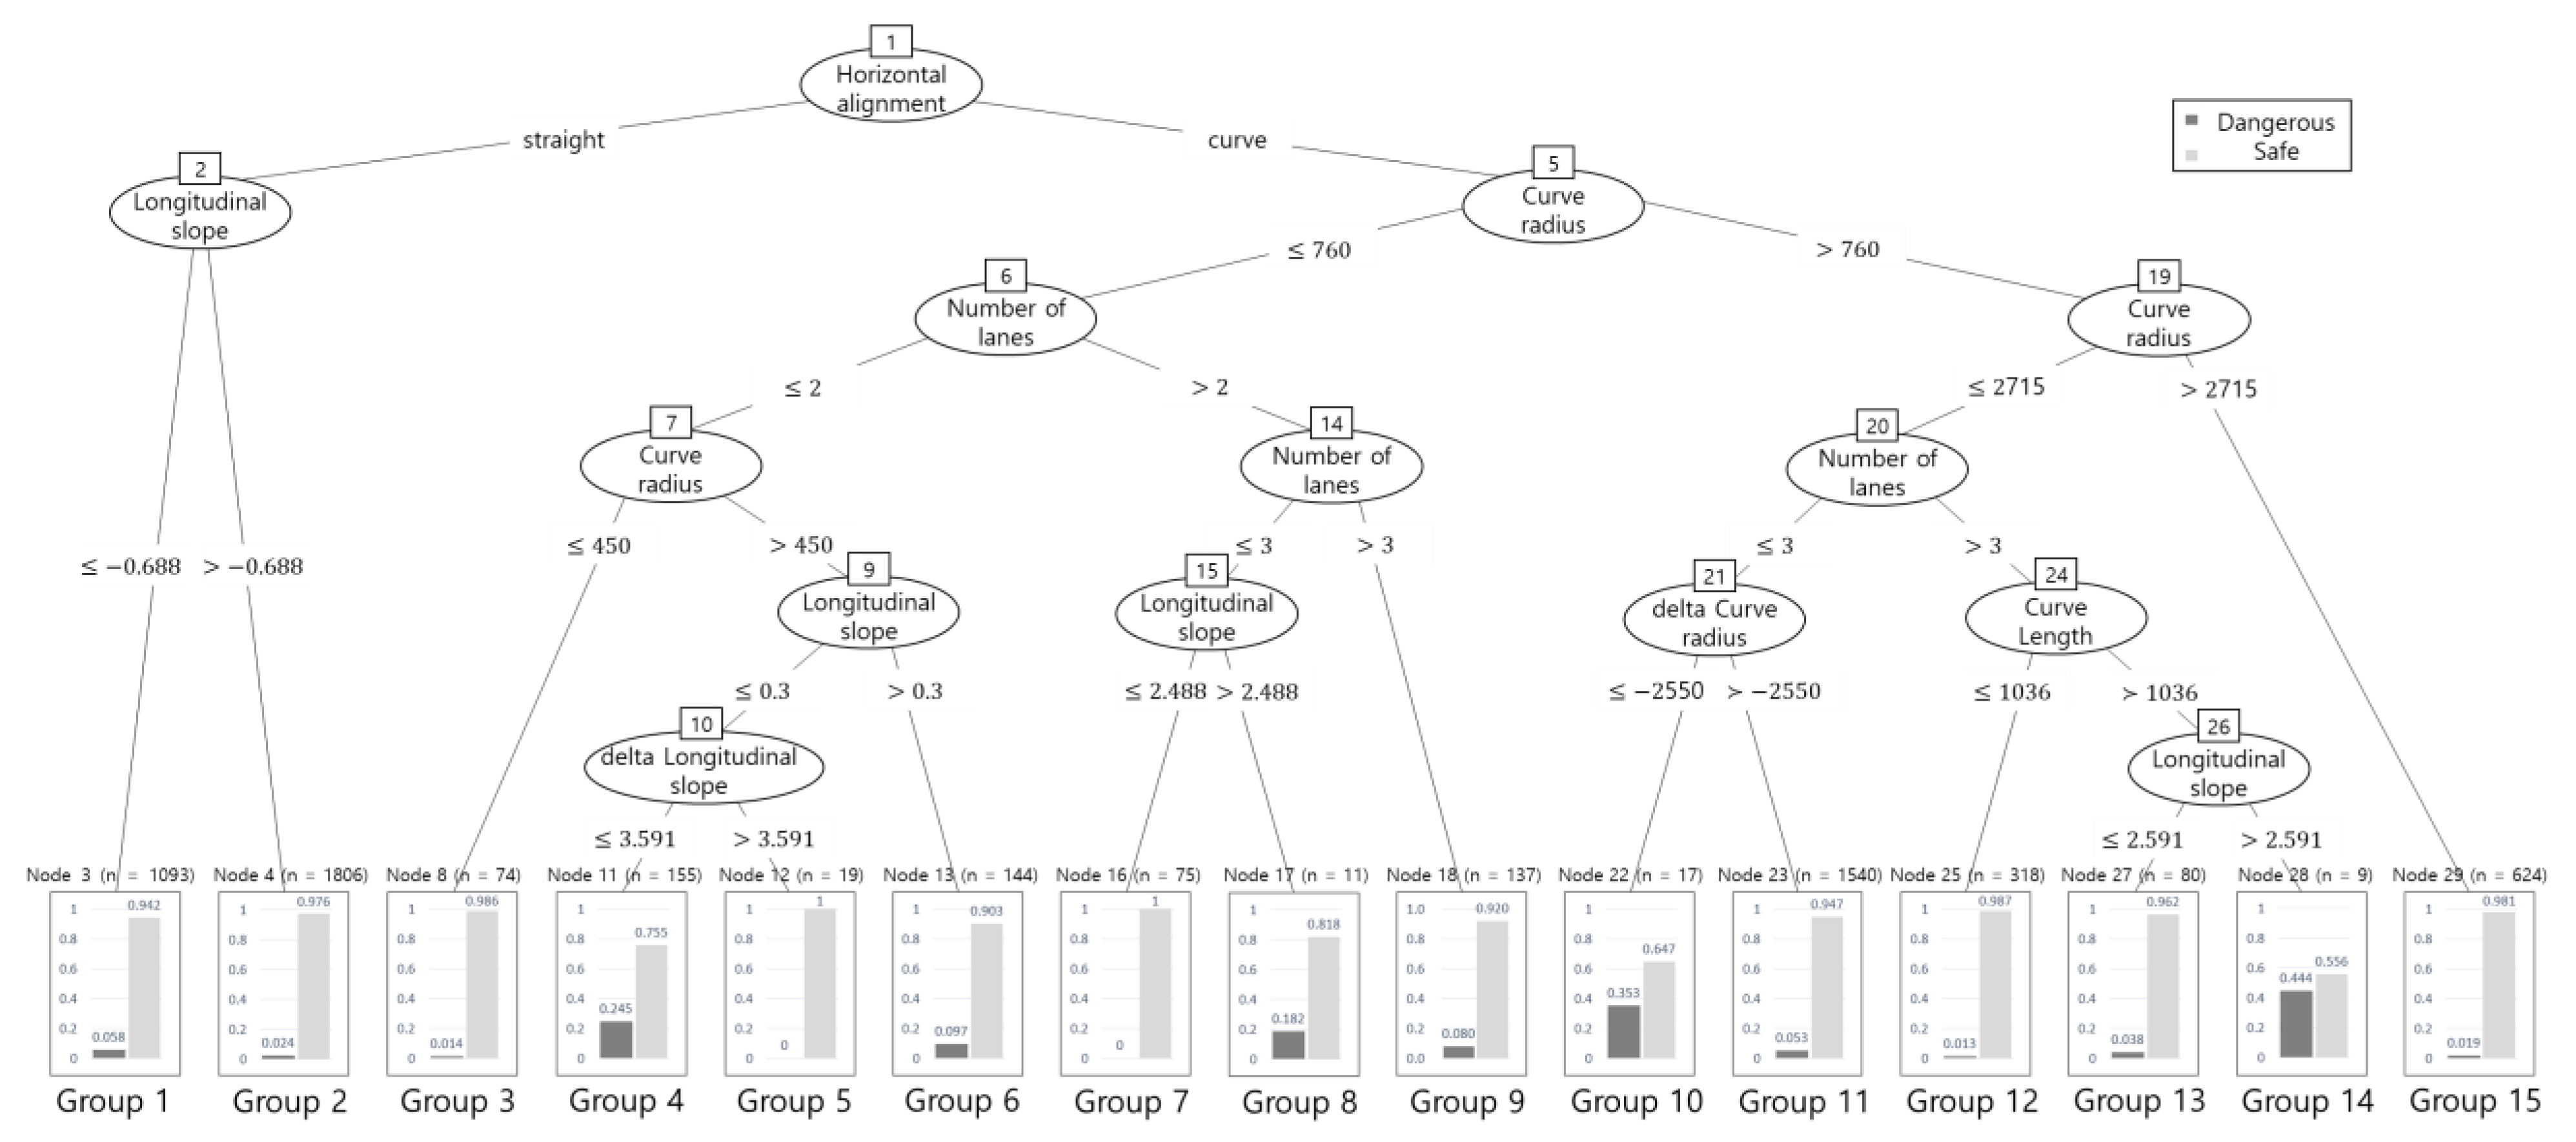
2.2.2. Identifying and Classifying the Dangerous Road Sections
3. Results
3.1. Driving Suitability Result and Analysis for AVM Service
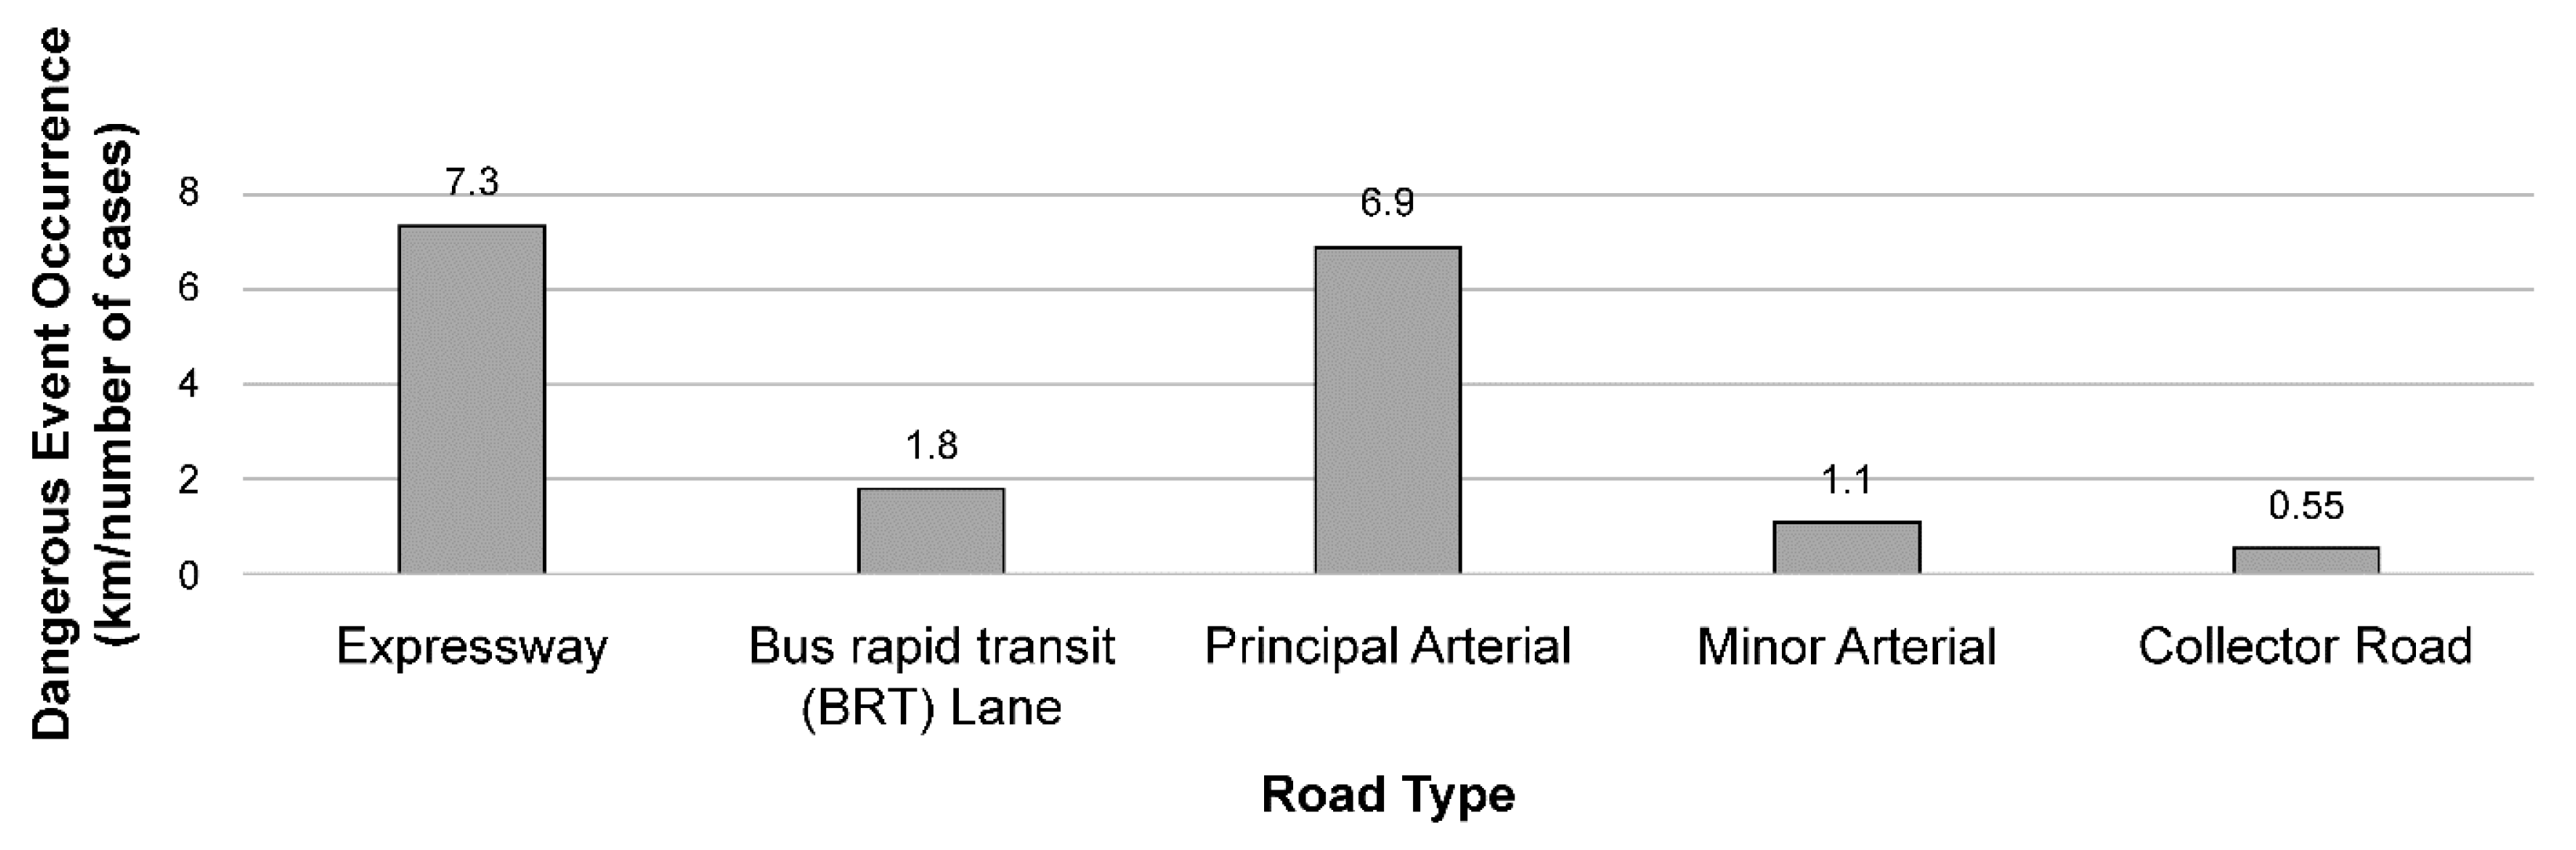
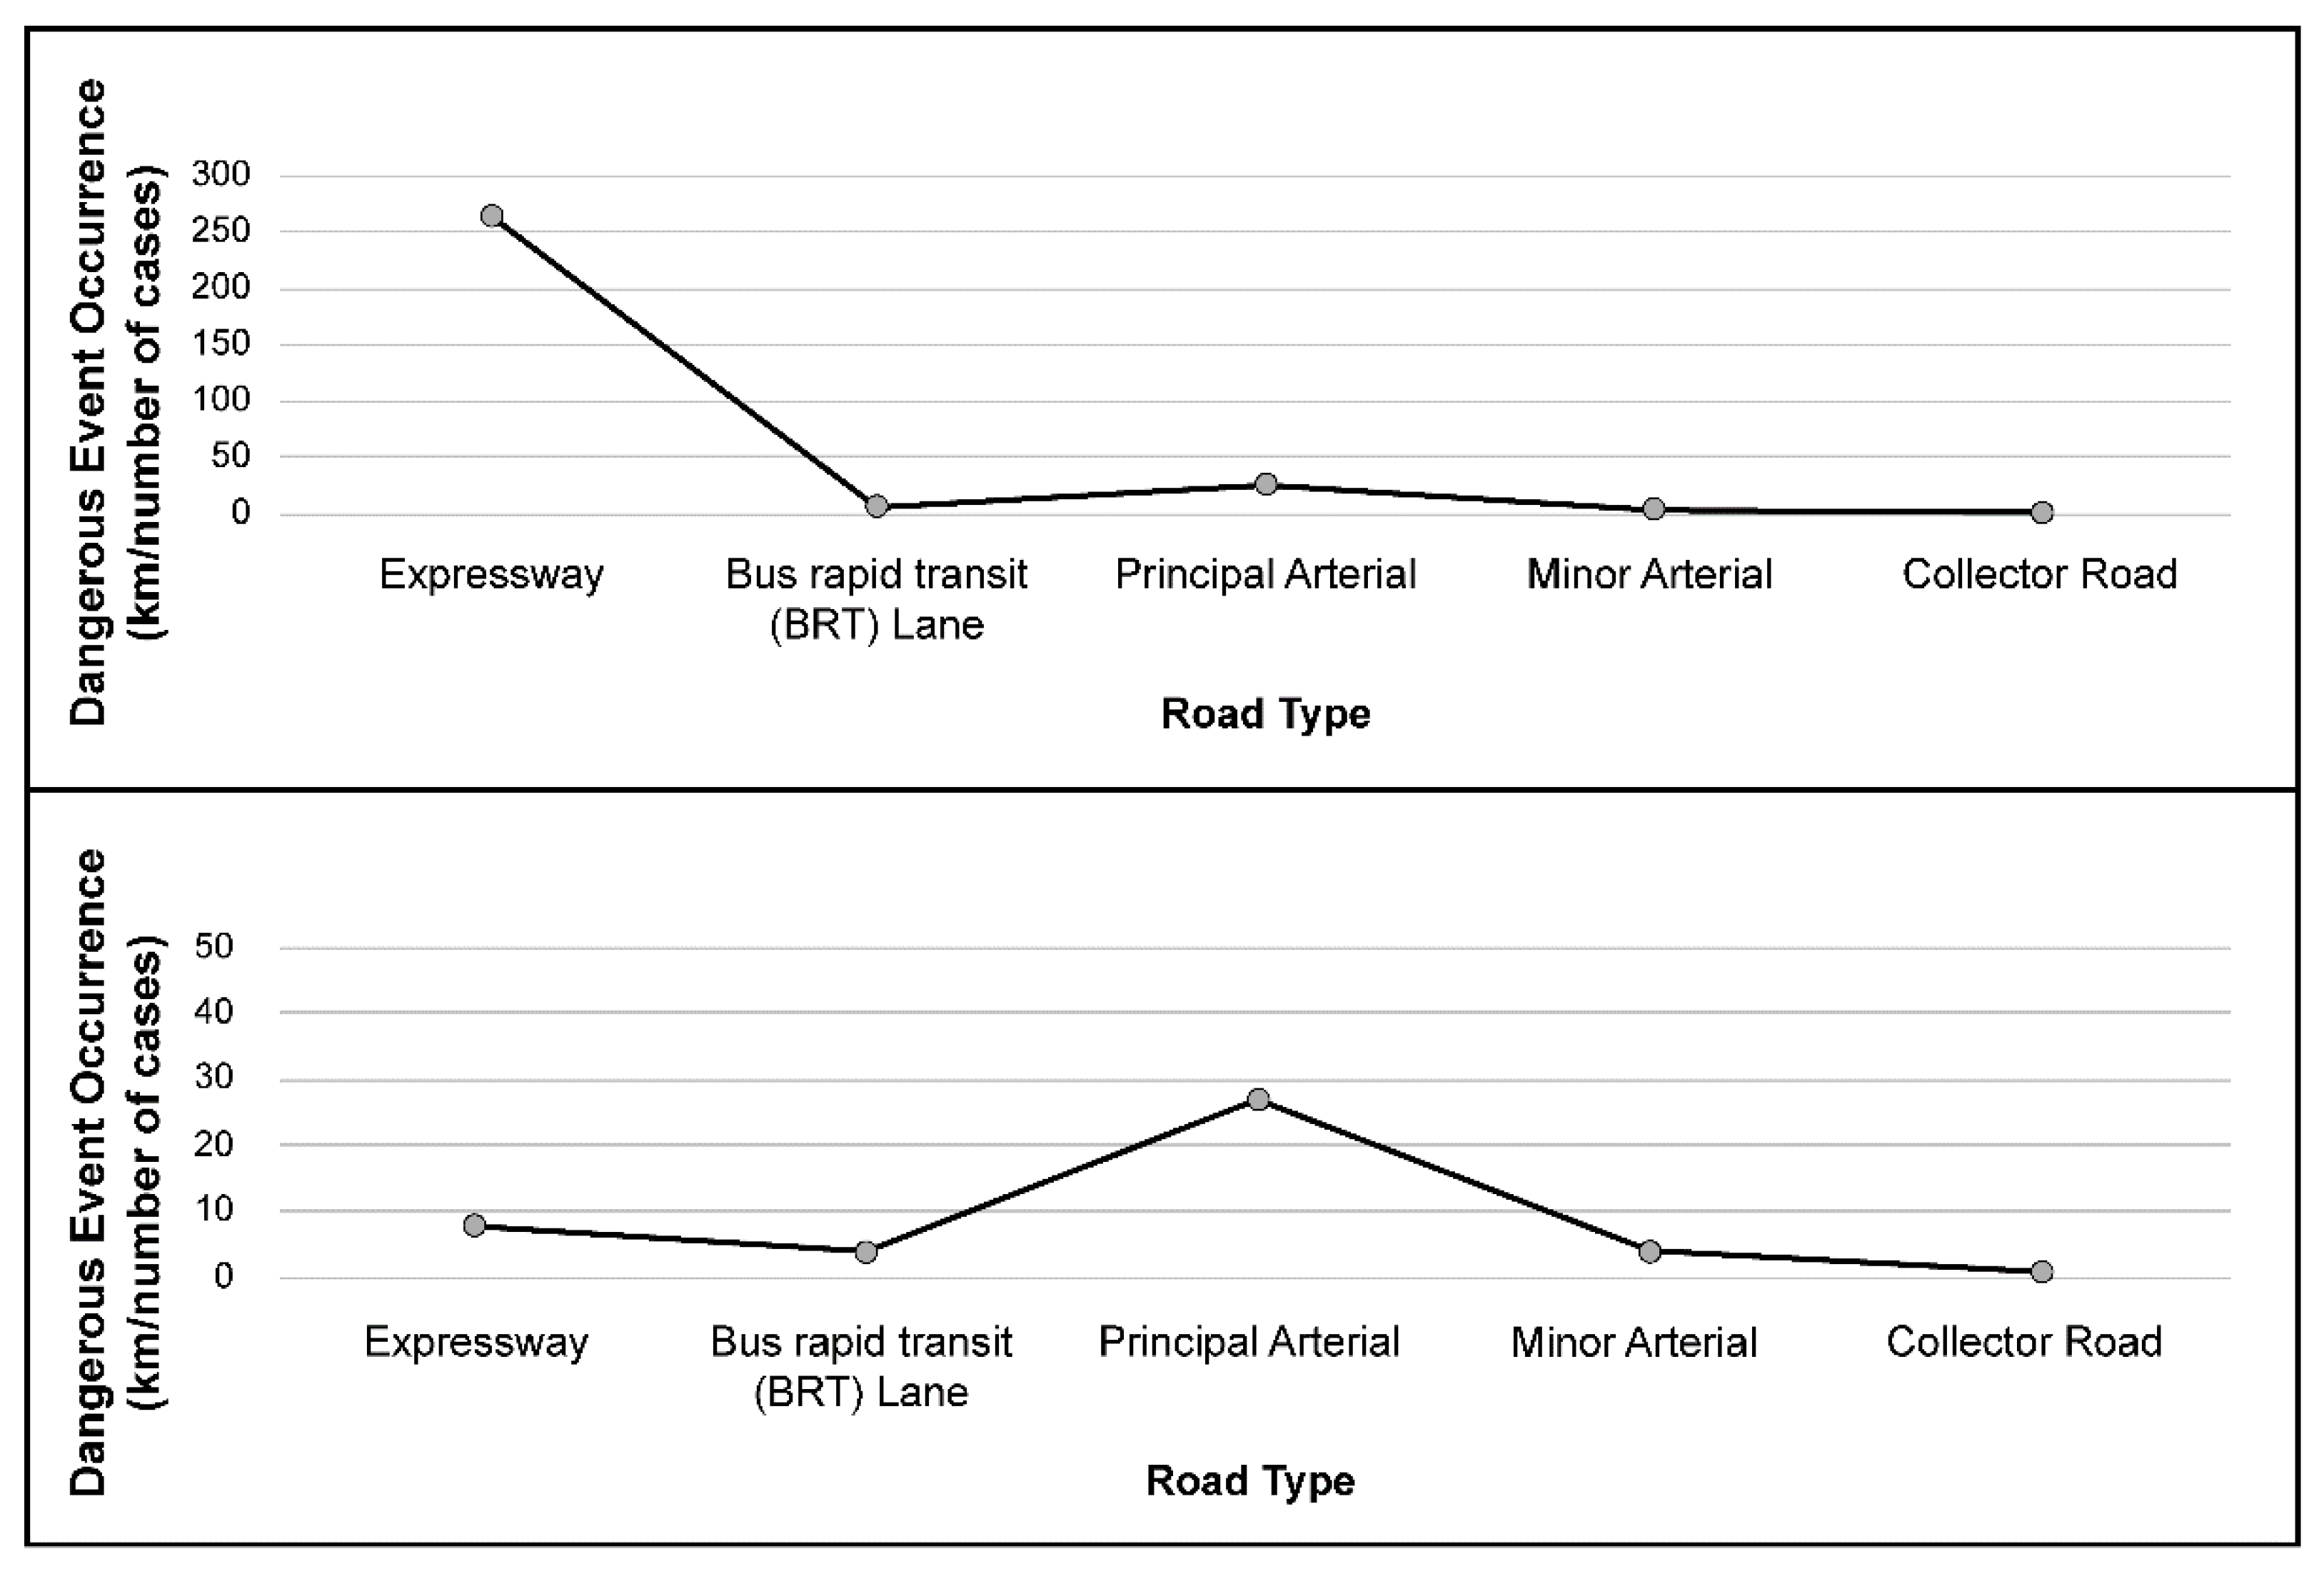
3.1.1. Analyzing Dangerous Event Occurrence by Road Type
3.1.2. Proposing a Strategy for Introducing the AVM Service
3.2. Geometrical Features of Dangerous AV Driving Event Occurrence
3.2.1. Analyzing the AV Dangerous Driving Events
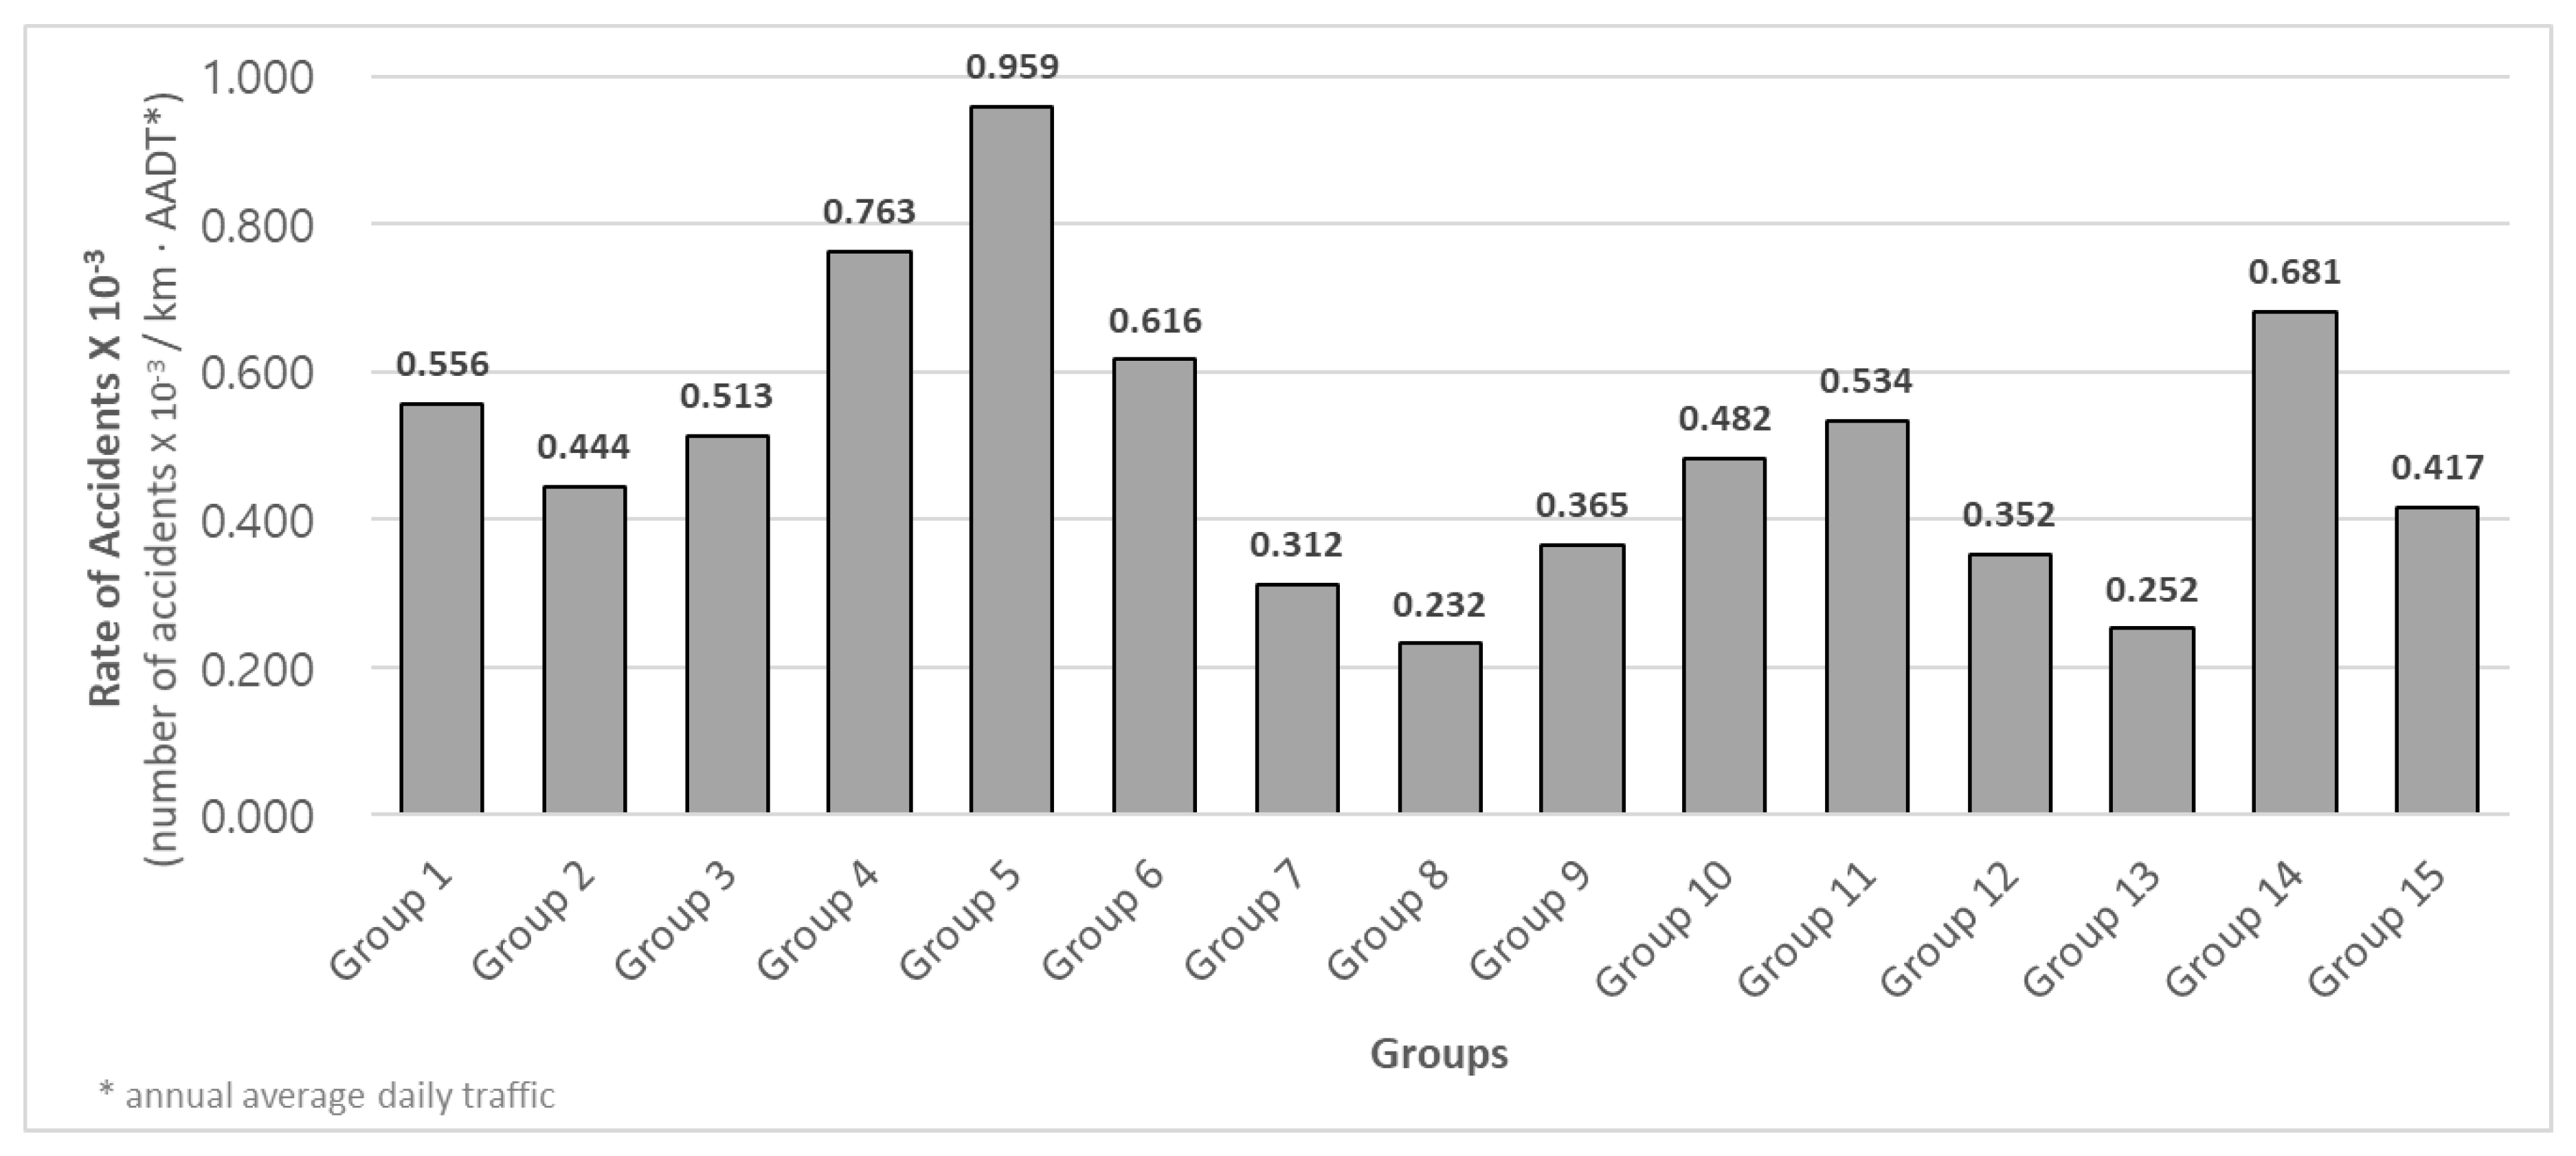
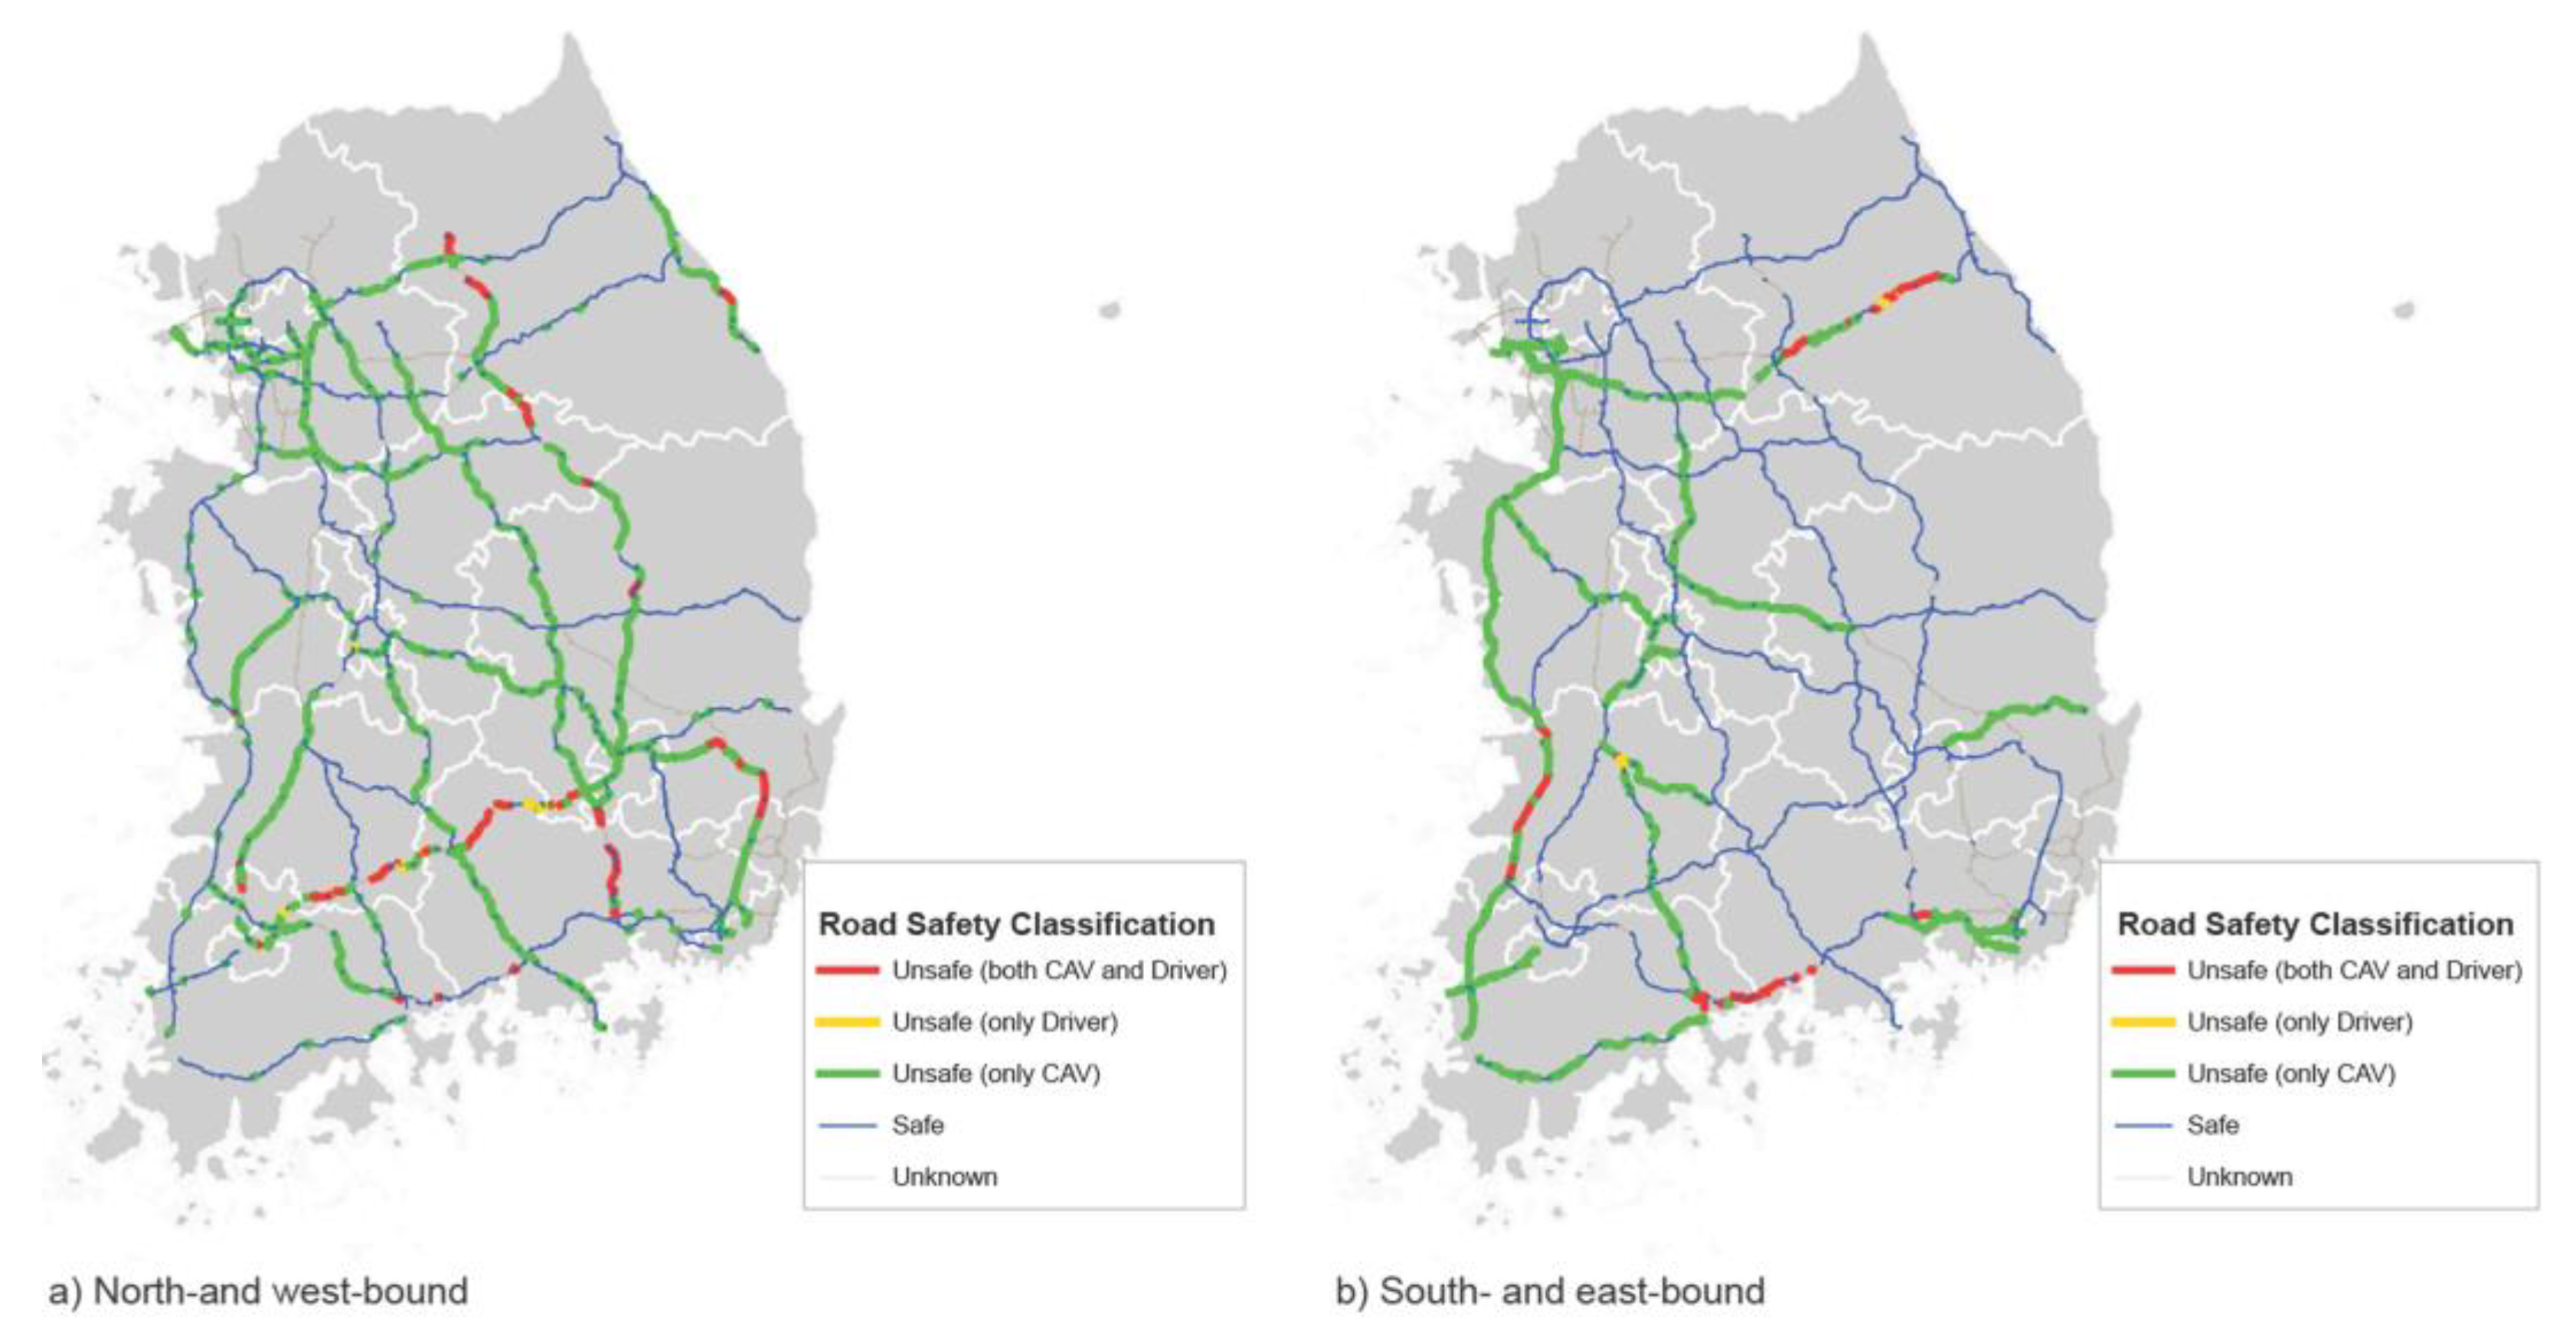
3.2.2. Comparing Dangerous AV Driving Events with Driver Accident Events
3.3. Discussion
4. Conclusions
Author Contributions
Funding
Institutional Review Board Statement
Informed Consent Statement
Data Availability Statement
Conflicts of Interest
References
- Shaheen, S.; Bansal, A.; Chan, N.; Cohen, A. Mobility and the Sharing Economy: Industry Developments and Early Understanding of Impacts. 2017. Available online: https://escholarship.org/uc/item/96j5r729 (accessed on 13 February 2022).
- Stocker, A.; Shaheen, S. Shared Automated Mobility: Early Exploration and Potential Impacts. Road Veh. Autom. 2018, 4, 125–139. [Google Scholar]
- Lazarus, J.; Shaheen, S.; Young, S.E.; Fagnant, D.; Voege, T.; Baumgardner, W.; Fishelson, J.; Lott, J.S. Shared Automated Mobility and Public Transport. Road Veh. Autom. 2018, 141–161. [Google Scholar] [CrossRef] [Green Version]
- Stark, K.; Gade, K.; Heinrichs, D. What does the future of automated driving mean for public transportation? Transp. Res. Rec. 2019, 2673, 85–93. [Google Scholar] [CrossRef]
- Iclodean, C.; Cordos, N.; Varga, B.O. Autonomous shuttle bus for public transportation: A review. Energies 2020, 13, 2917. [Google Scholar] [CrossRef]
- Tak, S.; Woo, S.; Park, S.; Kim, S. The City-Wide Impacts of the Interactions between Shared Autonomous Vehicle-Based Mobility Services and the Public Transportation System. Sustainability 2021, 13, 6725. [Google Scholar] [CrossRef]
- Wang, J.; Rajamani, R. The impact of adaptive cruise control systems on highway safety and traffic flow. Proc. Inst. Mech. Eng. Part D J. Automob. Eng. 2004, 218, 111–130. [Google Scholar] [CrossRef]
- Van Arem, B.; Van Driel, C.J.; Visser, R. The impact of cooperative adaptive cruise control on traffic-flow characteristics. IEEE Trans. Intell. Transp. Syst. 2006, 7, 436. [Google Scholar] [CrossRef] [Green Version]
- Zhao, J.; Oya, M.; El Kamel, A. A safety spacing policy and its impact on highway traffic flow. In Proceedings of the 2009 IEEE Intelligent Vehicles Symposium, Xi’an, China, 3–5 June 2009; pp. 960–965. [Google Scholar]
- Talebpour, A.; Mahmassani, H.S. Influence of connected and autonomous vehicles on traffic flow stability and throughput. Transp. Res. Part C Emerg. Technol. 2016, 71, 143–163. [Google Scholar] [CrossRef]
- Yu, H.; Tak, S.; Park, M.; Yeo, H. Impact of autonomous-vehicle-only lanes in mixed traffic conditions. Transp. Res. Rec. 2019, 2673, 430–439. [Google Scholar] [CrossRef]
- Makridis, M.; Mattas, K.; Ciuffo, B. Response time and time headway of an adaptive cruise control. An empirical characterization and potential impacts on road capacity. IEEE Trans. Intell. Transp. Syst. 2019, 21, 1677–1686. [Google Scholar] [CrossRef]
- Makridis, M.; Mattas, K.; Anesiadou, A.; Ciuffo, B.; OpenACC. An open database of car-following experiments to study the properties of commercial ACC systems. Transp. Res. Part C Emerg. Technol. 2021, 125, 103047. [Google Scholar] [CrossRef]
- Shang, M.; Stern, R.E. Impacts of commercially available adaptive cruise control vehicles on highway stability and throughput. Transp. Res. Part C Emerg. Technol. 2021, 122, 102897. [Google Scholar] [CrossRef]
- Makridis, M.; Mattas, K.; Ciuffo, B.; Re, F.; Kriston, A.; Minarini, F.; Rognelund, G. Empirical study on the properties of adaptive cruise control systems and their impact on traffic flow and string stability. Transp. Res. Rec. 2020, 2674, 471–484. [Google Scholar] [CrossRef] [Green Version]
- Insurance Institute for Highway Safety IIHS Examines Driver Assistance Features in Road, Track Tests. 2018. Available online: https://www.iihs.org/news/detail/iihs-examines-driver-assistance-features-in-road-track-tests (accessed on 13 February 2022).
- American Automobile Association. Evaluation of Active Driving Assistance Systems. 2020. Available online: https://www.repairerdrivennews.com/wp-content/uploads/2022/02/E.1.-Research-Report-Evaluating-ADA-FINAL-7-13-20.pdf (accessed on 13 February 2022).
- Society of AutomotiveEngineers (SAE). SAE J3016 Taxonomy and Definitions for Terms Related to Driving Automation Systems for On-Road Motor Vehicles RATIONALE. 2021. Available online: https://www.sae.org/standards/content/j3016_202104/ (accessed on 13 February 2022).
- Xiaoxia Baidu Tests Driverless Cars on Expressway in Shanxi. Available online: http://www.xinhuanet.com/english/2019-01/23/c_137768368.htm (accessed on 13 February 2022).
- Union Internationale des Transports Publics Shared Personalised Automated Connected vEhicles (SPACE): SmartShuttle. Available online: https://space.uitp.org/initiatives/smartshuttle-sion-av-switzerland (accessed on 13 February 2022).
- MOVECIT. Guidelines for Developing a Mobility Plan. 2017. Available online: https://www.interreg-central.eu/Content.Node/Movecit/Guidelines-for-developing-mobility-plan.pdf (accessed on 13 February 2022).
- Capital Region Planning Commission. Surface Transportation Block Grant Program Project Scoring Guide. 2017. Available online: https://www.fhwa.dot.gov/specialfunding/stp/ (accessed on 13 February 2022).
- Buhrmann, S.; Wefering, F.; Rupprecht, S. Guidelines for Developing and Implementing a Sustainable Urban Mobility Plan 2nd Edition. 2019. Available online: https://www.eltis.org/mobility-plans/sump-guidelines (accessed on 2 February 2022).
- Federal Highway Administration (FHWA). Highway Functional Classification Concenpts, Criteria and Procedures. 2013. Available online: https://dot.sd.gov/media/documents/HwyFunctionalClassification.pdf (accessed on 13 February 2022).
- Paraphantakul, C. Review of Worldwide Road Classification Systems. In Proceedings of the 9th National Transportation Conference, Bangkok, Thailand; 2014; pp. 20–21. [Google Scholar]
- Tak, S.; Kim, H.; Kang, K.; Lee, D. A Study on the Introduction for Automated Vehicle-based Mobility Service Considering the Level Of Service of Road Infrastructure. J. Korea Inst. Intell. Transp. Syst. 2019, 18, 19–33. [Google Scholar] [CrossRef]
- The Korea Expressway Corporation Expressway Data. Available online: http://data.ex.co.kr (accessed on 13 February 2022).
- Federal Highway Administration. Road Safety Information Analysis:A Manual for Local Rural Road Owners. 2011. Available online: https://safety.fhwa.dot.gov/local_rural/training/fhwasa1210/lrro_data.pdf (accessed on 13 February 2022).
- Molugaram, K.; Rao, G.S.; Shah, A.; Davergave, N. Statistical Techniques for Transportation Engineering; Butterworth-Heinemann. 2017. Available online: https://www.sciencedirect.com/book/9780128115558/statistical-techniques-for-transportation-engineering (accessed on 2 February 2022).
- De’ath, G.; Fabricius, K.E. Classification and regression trees: A powerful yet simple technique for ecological data analysis. Ecology 2000, 81, 3178–3192. [Google Scholar] [CrossRef]
- Cong, C.; Tsokos, C. Theory and applications of decision tree with statistical software. Age 2009, 58, 250. [Google Scholar]
- Pappalardo, G.; Cafiso, S.; Di Graziano, A.; Severino, A. Decision tree method to analyze the performance of lane support systems. Sustainability 2021, 13, 846. [Google Scholar] [CrossRef]
- Kotu, V.; Deshpande, B. Predictive Analytics and Data Mining: Concepts and Practice with Rapidminer; Morgan Kaufmann. 2014. Available online: https://www.sciencedirect.com/book/9780128014608/predictive-analytics-and-data-mining (accessed on 2 February 2022).
- Elvik, R. International transferability of accident modification functions for horizontal curves. Accid. Anal. Prev. 2013, 59, 487–496. [Google Scholar] [CrossRef] [Green Version]
- Zegeer, C.V.; Stewart, J.R.; Council, F.M.; Reinfurt, D.W.; Hamilton, E. Safety effects of geometric improvements on horizontal curves. Transp. Res. Rec. 1992, 1356, 11–19. [Google Scholar]
- Hang, Z.; Teng, S. Influence of Traffic Safety on Road Alignment Design. In Proceedings of the ICTIS 2011: Multimodal Approach to Sustained Transportation System Development: Information, Technology, Implementation, Wuhan, China, 30 June–2 July 2011; pp. 1280–1285. [Google Scholar]
- Khoury, J.; Amine, K.; Abi Saad, R. An initial investigation of the effects of a fully automated vehicle fleet on geometric design. J. Adv. Transp. 2019, 2019. [Google Scholar] [CrossRef]
- Wang, S.; Yu, B.; Ma, Y.; Liu, J.; Zhou, W. Impacts of different driving automation levels on highway geometric design from the perspective of trucks. J. Adv. Transp. 2021, 2021, 5541878. [Google Scholar] [CrossRef]
- Turoń, K.; Kubik, A.; Chen, F. When, What and How to Teach about Electric Mobility? An Innovative Teaching Concept for All Stages of Education: Lessons from Poland. Energies 2021, 14, 6440. [Google Scholar] [CrossRef]


| Service Type | ||||||||
|---|---|---|---|---|---|---|---|---|
| S1 AV Fixed-Route Transit Service (Dedicated) | S2 AV Fixed-Route Transit Service (Non-Dedicated) | S3 AV On-Demand Transit Service (Group) | S4 AV On-Demand Transit Service (By-Pass) | S5 AV Paratransit (On-Demand): Urban | S6 AV Paratransit (On-Demand): (Rural) | S7 AV Taxi | ||
| Road Type | BRT Lane | ○ | ||||||
| Expressway | ○ | ○ | ○ | ○ | ||||
| Principal arterial | ○ | ○ | ○ | ○ | ○ | |||
| Minor arterial | ○ | ○ | ○ | ○ | ||||
| Collector | ○ | ○ | ○ | |||||
| Local | ○ | ○ | ||||||
| AV (Prob. of Dangerous Event) | Human-Driven Vehicle (Rate of Accidents) | |
|---|---|---|
| Group 1 | 0.058 | 0.556 |
| Group 2 | 0.024 | 0.444 |
| Group 3 | 0.014 | 0.513 |
| Group 4 | 0.245 | 0.763 |
| Group 5 | 0 | 0.959 |
| Group 6 | 0.097 | 0.616 |
| Group 7 | 0 | 0.312 |
| Group 8 | 0.182 | 0.232 |
| Group 9 | 0.080 | 0.365 |
| Group 10 | 0.353 | 0.482 |
| Group 11 | 0.053 | 0.534 |
| Group 12 | 0.013 | 0.352 |
| Group 13 | 0.038 | 0.252 |
| Group 14 | 0.444 | 0.681 |
| Group 15 | 0.019 | 0.417 |
Publisher’s Note: MDPI stays neutral with regard to jurisdictional claims in published maps and institutional affiliations. |
© 2022 by the authors. Licensee MDPI, Basel, Switzerland. This article is an open access article distributed under the terms and conditions of the Creative Commons Attribution (CC BY) license (https://creativecommons.org/licenses/by/4.0/).
Share and Cite
Tak, S.; Kim, S.; Yu, H.; Lee, D. Analysis of Relationship between Road Geometry and Automated Driving Safety for Automated Vehicle-Based Mobility Service. Sustainability 2022, 14, 2336. https://doi.org/10.3390/su14042336
Tak S, Kim S, Yu H, Lee D. Analysis of Relationship between Road Geometry and Automated Driving Safety for Automated Vehicle-Based Mobility Service. Sustainability. 2022; 14(4):2336. https://doi.org/10.3390/su14042336
Chicago/Turabian StyleTak, Sehyun, Sari Kim, Hwapyeong Yu, and Donghoun Lee. 2022. "Analysis of Relationship between Road Geometry and Automated Driving Safety for Automated Vehicle-Based Mobility Service" Sustainability 14, no. 4: 2336. https://doi.org/10.3390/su14042336