Article

Farm-Level Technical Efficiency and Its Determinants of Rice Production in Indo-Gangetic Plains: A Stochastic Frontier Model Approach

1
College of Economics and Management, Northwest A&F University, Xianyang 712100, China
2
School of Economics and Management, Yantai University, Yantai 264005, China
*
Author to whom correspondence should be addressed.
Sustainability 2022, 14(4), 2267; https://doi.org/10.3390/su14042267
Submission received: 14 January 2022 / Revised: 6 February 2022 / Accepted: 14 February 2022 / Published: 16 February 2022
(This article belongs to the Special Issue Agrifood Production and Conservation Agriculture)

Abstract

:
This research was conducted to explore the factors affecting the technical efficiency (TE) of rice producers and its determinants at the farm level. We used a multi-stage sampling procedure to collect cross-sectional data from 800 rice growers in the Uttar Pradesh state of India, and a stochastic frontier model (SFA) was applied. The results showed that the mean technical efficiency was 72%, suggesting scope for a substantial increment in rice productivity exists while using the current level of inputs and technologies. Furthermore, the MLE results revealed that labor, irrigation, and hybrid seeds had a constructive impact on technical efficiency, while experience and tenure status showed a negative impact on technical efficiency. As unraveled by the results of the study, it can be concluded that the technical efficiency of rice farmers can be improved through timely access to credit and agricultural information delivered to them via extension services. The study, therefore, recommends that the government provide subsidized agrochemicals and focus on developing a robust network of extension services throughout the local districts for proper dissemination of inputs. About 12% of India’s rice is produced in the Uttar Pradesh state. So, this study could be an essential tool for the agriculture sector, which could help to solve rice productivity problems for future generations.

1. Introduction

Rice is considered among the most widely produced and consumed cereal crops worldwide. Globally, 11% of cultivable land is used for rice cultivation and one third of the world’s population consumes rice to fulfil their daily food requirements [1]. It is a key source of food for almost one-third of the world’s population, and rice is grown on 11% of the world’s cultivated land. The world’s largest rice exporters in 2019–2020 were India, followed by Thailand, Vietnam, and others [2]. Rice is crucial to India’s food security, and it is the driving force behind the country’s grain supply [3]. Opening up the agricultural sector to international trade has worsened the situation, and that increase in pressure on Indian farmers has driven them to work even harder [4]. It is believed that being an important grain crop, rice has served as a staple food for remote regions of eastern India, which are considered as the most vulnerable areas of the country. Eastern India’s rice-producing area is approximately 26.79 million hectares, which contributes to around 62% of the country’s whole area under rice cultivation and provides almost 47.5% of the total production requirements of the country [5]. The Green Revolution brought new farming technologies to India’s attention in the late twentieth century, which greatly enhanced agricultural production and reduced famine. After the Green Revolution, in the eastern rice-growing areas of India, the rate of dissemination of modern technologies was quite slow, which eventually resulted in reduced agricultural output in the region [6,7].
As shown in Supplementary Figure S1, Asia produces 90% of the world’s rice, which is consumed as a staple food by the majority of the human population. India has the largest rice area and ranks second in terms of production after China. Paddies are cultivated on an area of 43.79 million hectares, with a production and productivity of 112.75 metric tons and 2.57 tons/ha, respectively, in India [8]. However, the productivity of rice in India still has been relatively low compared to other Asian countries, such as, Thailand, Malaysia, Philippines, Vietnam, Japan, South Korea, and China, where rice productivity in 2015 was recorded as 2.81 tons/ha, 4.04 tons/ha, 4.08 tons/ha, 5.89 tons/ha, 6.51 tons/ha, 6.51 tons/ha, and 6.55 tons/ha, respectively [9]. According to the USDA report, production of rice in China and India has dropped by 0.36 and 0.02% in 2019–2020 as compared to 2018–2019 [10]. Plant epidemics cause around a 20–40% reduction in the overall crop production internationally [11]. The issue has aggravated due to emerging breeds of plant epidemics and infections, climate variations, limited clean water supply, and cultivatable land [12,13]. The development of sustainable agricultural production systems is encouraged to fulfil the United Nations’ Sustainable Development Goals (SDGs) of ending hunger and improving human well-being with minimum environmental impact. This development is required in mechanized large-scale production systems and smallholder farms in the developing world [14]. Supplementary Figure S2 shows India’s area-wise rice production of the past decade.
Uttar Pradesh (UP) is generally divided into four zones—Western, Central, Eastern, and Bundelkhand. Rice is the major crop of UP, which covers about 36.5% of the total gross-cropped area in Uttar Pradesh. UP is blessed with the fertile Indo-Gangetic plains and, given the size of the state’s geographical area, it is a significant contributor to the food security of the nation. About 12% of India’s rice is produced by the state, [15,16] indicated some districts of subtropical Trans and Upper Gangetic plains are highly vulnerable due to prevailing socio-economic conditions and increased environmental pressure affecting the productivity of the wheat and paddy crops. When district-wise yield of rice productivity over the years is considered, there is a lot of fluctuations noticed in between different zones of the state, as shown in Supplementary Figure S3. The province of Uttar Pradesh does not function well, despite having ample resources. For this reason, researchers are working to identify the various factors that lead to low productivity and reduced production. The available literature demonstrates that a variety of factors influence the production and selection of diverse crops. Crop selection, seed quality and variety selection, soil fertility, water availability, marketing information, high-quality pesticides and fertilizers, tenure status, risk management, labor, institutional, and environmental aspects, as well as crop management techniques and practices are all possible considerations based on the literature. A change in any of the aforementioned factors can have an effect on crop productivity [17]. Several research studies shed light on this subject, including the following: [17,18,19,20,21,22,23,24]. According to the aforementioned research, the rice crop is extremely important. Since rice is associated with food, the economy, and as the principal source of income for a sector of the farming community, there is a considerable difference in rice production among Uttar Pradesh’s districts and among farmers’ productivity. To address existing gaps, this study examined the technical efficiency of Uttar Pradesh farmers’ rice production. We used stochastic frontier analysis to estimate the effect of explanatory factors on technical efficiency, as [24,25] did (SFA).The technical efficiency term was initially familiarized by Michael Farrell in the middle of 19th century and the term generally captures the capability of an individual to operate on the frontier isoquant [26]. This type of efficiency can be assessed in a relative way, which simply indicates the deviation of an individual from the preeminent performer of a representative peer group [27]. Some studies have been conducted to measure the technical efficiency and its relationship with farmers socioeconomic characteristics [28] and most of them revealed that education and farming experience influence the technical efficiency of the firms as these tools make the individuals aware of everything necessary and useful in the production of any crop.
The main objective of this study was to measure the technical efficiency (hereafter, TE) of rice production in Uttar Pradesh. Additionally, the study was also trying to identify the core influencing factors of TE to explain the possibilities of increasing the productivity and profitability of rice by increasing efficiency at the provincial level. The findings from this study are considered beneficial to those involved in farm and national decision-making. It is critical to have accurate assessments of the technical efficiency level and inefficiency factors. The findings of this study will advise rice growers about improving farm management strategies. Planners and policymakers can also use the findings of this study to develop appropriate policies to enhance rice in Uttar Pradesh and India in general

2. Materials and Methods

In terms of soil fertility and presence of perennial rivers, the Indo-Gangetic plains are one of the prominent areas for rice cultivation and contributed a lot in earlier phases of the Green Revolution in India. Uttar Pradesh’s economy is based on agriculture where 47% of the population is directly dependent on agriculture for their livelihood. The state has a population of around 16.17% of India’s total population. In terms of geography, it occupies the fifth place following Rajasthan, Madhya Pradesh, Maharashtra, and Andhra Pradesh, covering 7.3% of India’s land. Overall, it covers an area of 240,928 km2. Farmers make up 65.9% of the total work force, while 5.6% are industrial workers [29]. The attempt to develop agriculture in a multi-faceted way is swinging. Several essential initiatives have been done, such as the extension of irrigation facilities, the timely delivery of fertilizer, insecticides, and high-yield seeds, to promote high-yield seed use and continual advice services on farming. Figure 1 shows the 75 districts of Uttar Pradesh, comprising 4 districts (Bijnor, Mathura, Mirzapur, and Varanasi) from different ecological zones, which formed the study area.

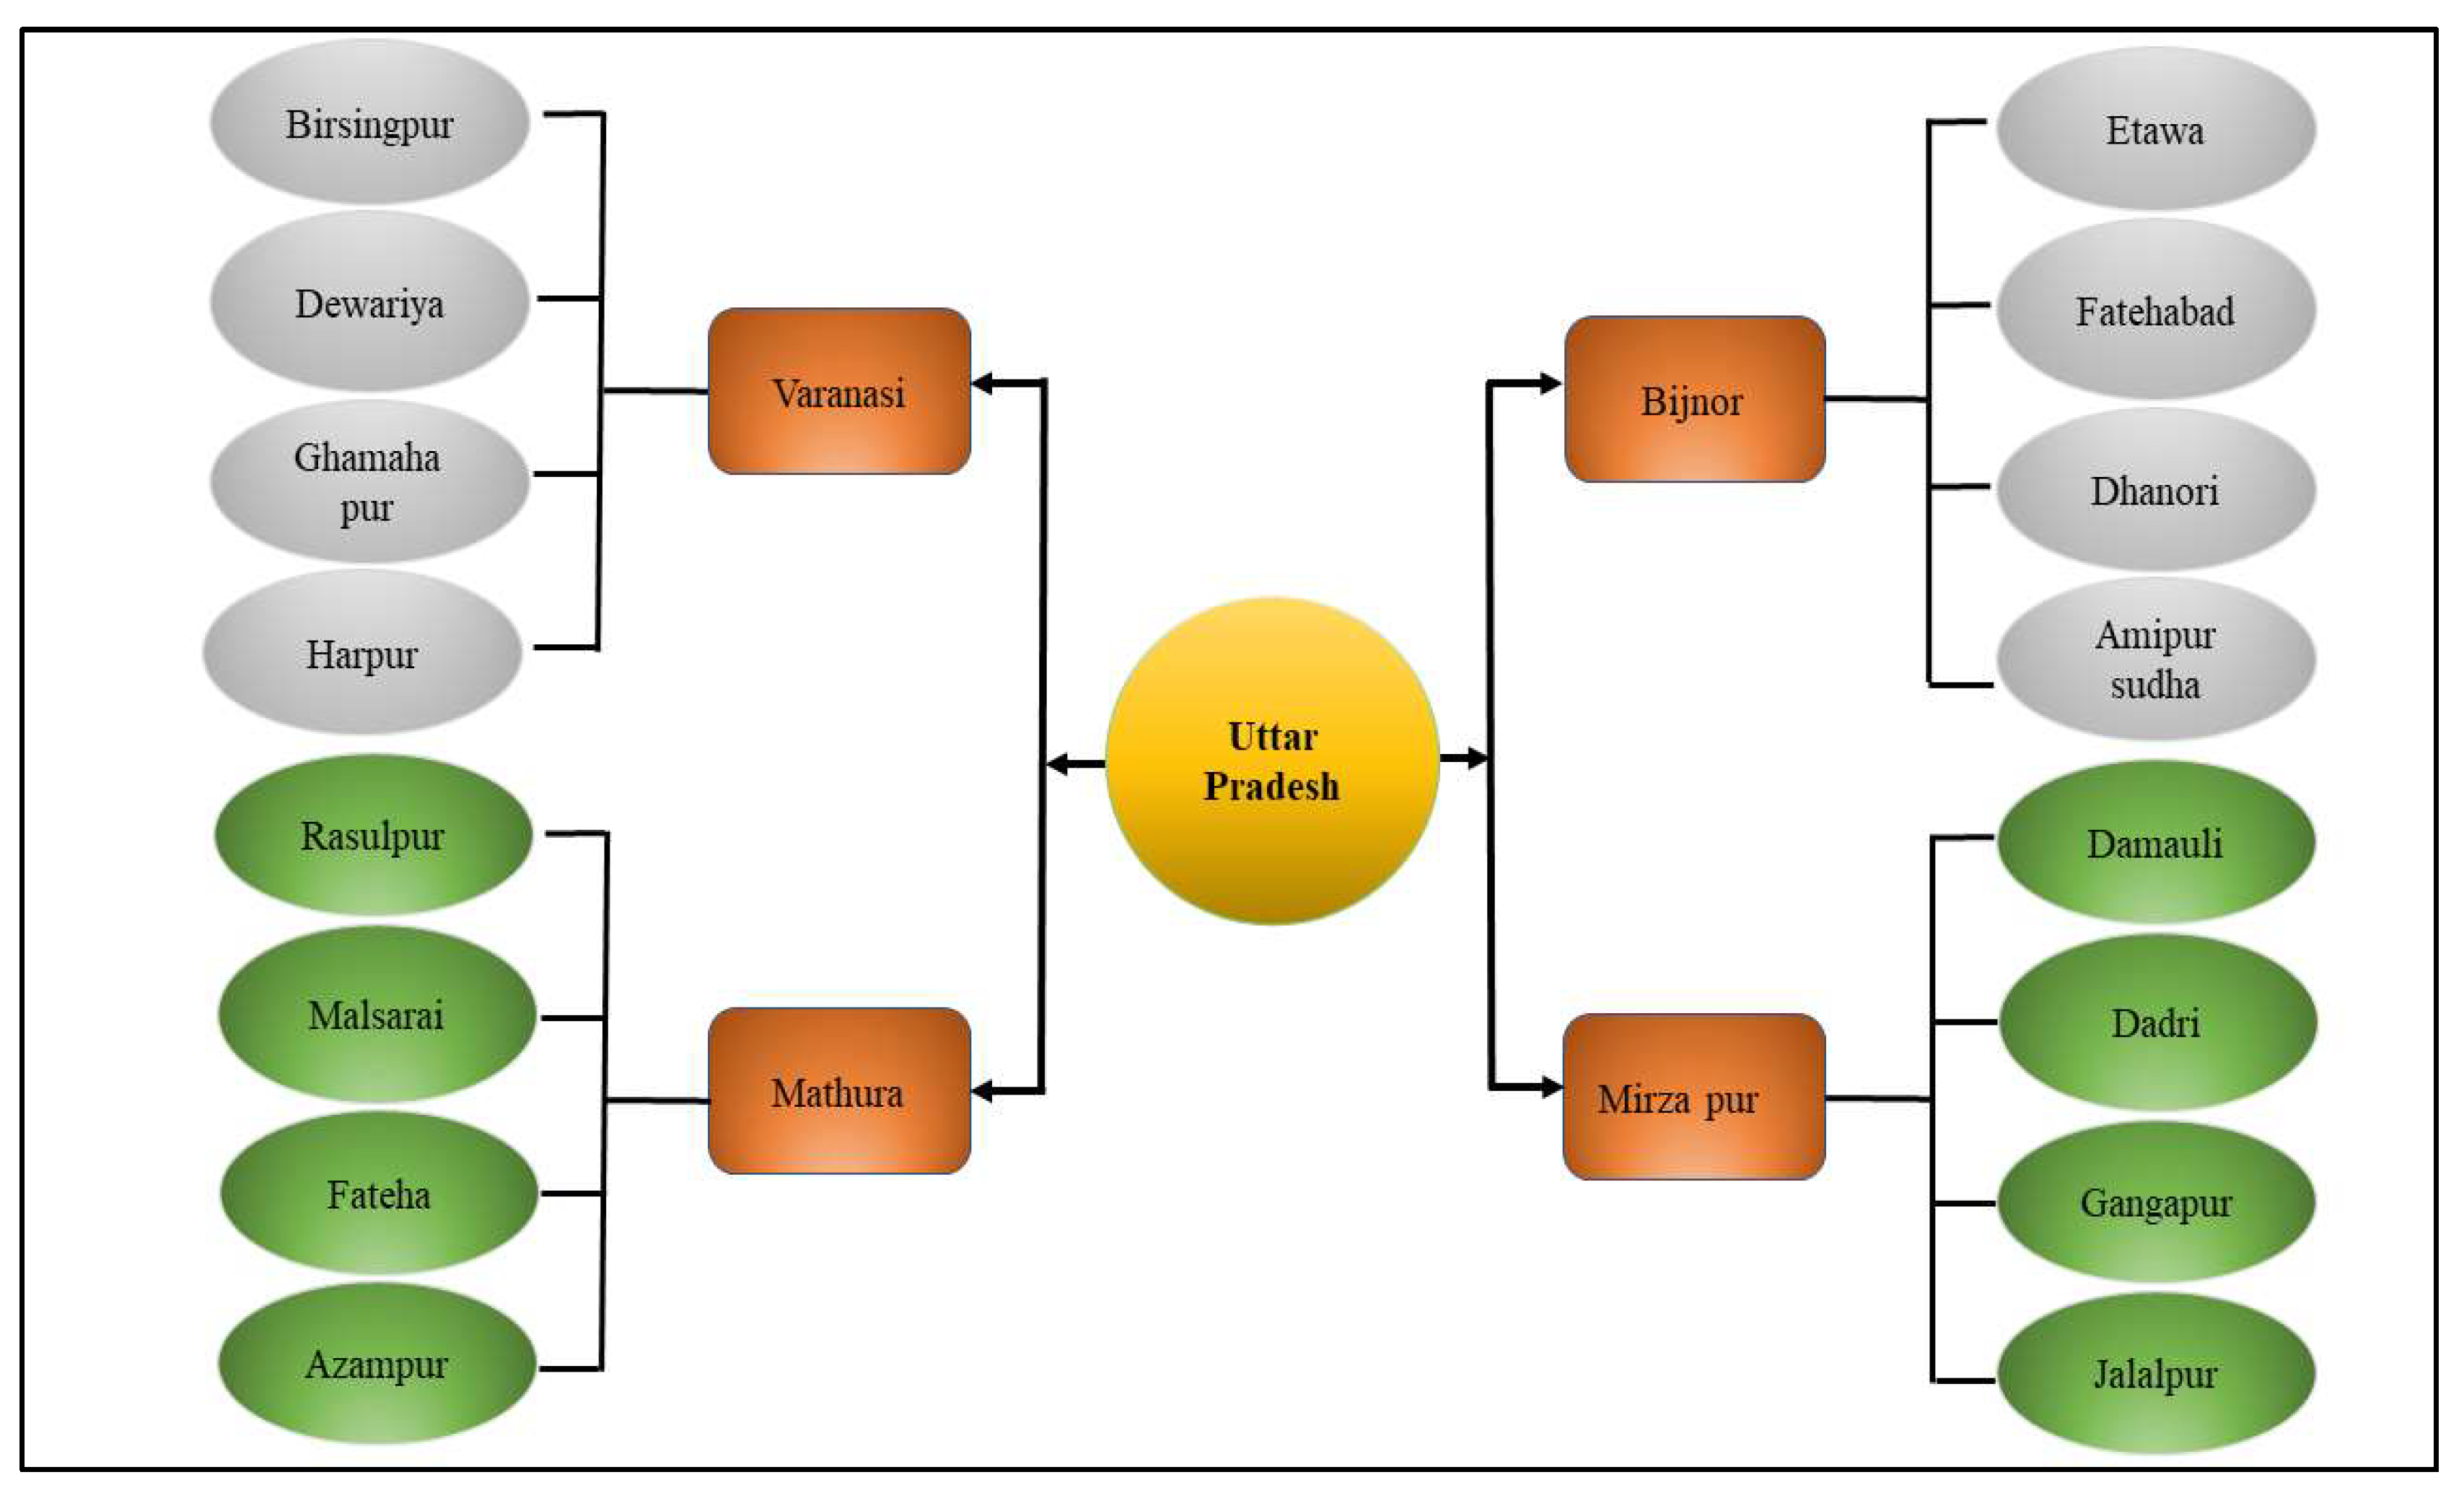
2.1. Sampling Procedure

The multistage technique was employed in the district for the farmer’s sample, shown in Figure 2. The first phase in this method is to divide the district of Uttar Pradesh into four districts, which were Varanasi, Mathura, Mirzapur, and Bijnor, respectively. In the second phase, four towns were selected from each district: Birsingpur, Dewariya, Ghamahapur, Harpur, Rasulpur, Malsarai, Fateha, Azampur Damauli, Dadri, Gangapur, Jalalpur, Etawa, Fatehabad, Dhanori, and Amipur sudha. In the last phase, 200 rice growers were chosen randomly from each town by means of the proportional allocation technique [30], as follows:
n i = N i N × n
where n i —rice farmers selected from i t h district; n—total rice farmers in sample, N i —total rice farmers in selected village; N—total rice farmers in all selected villages.

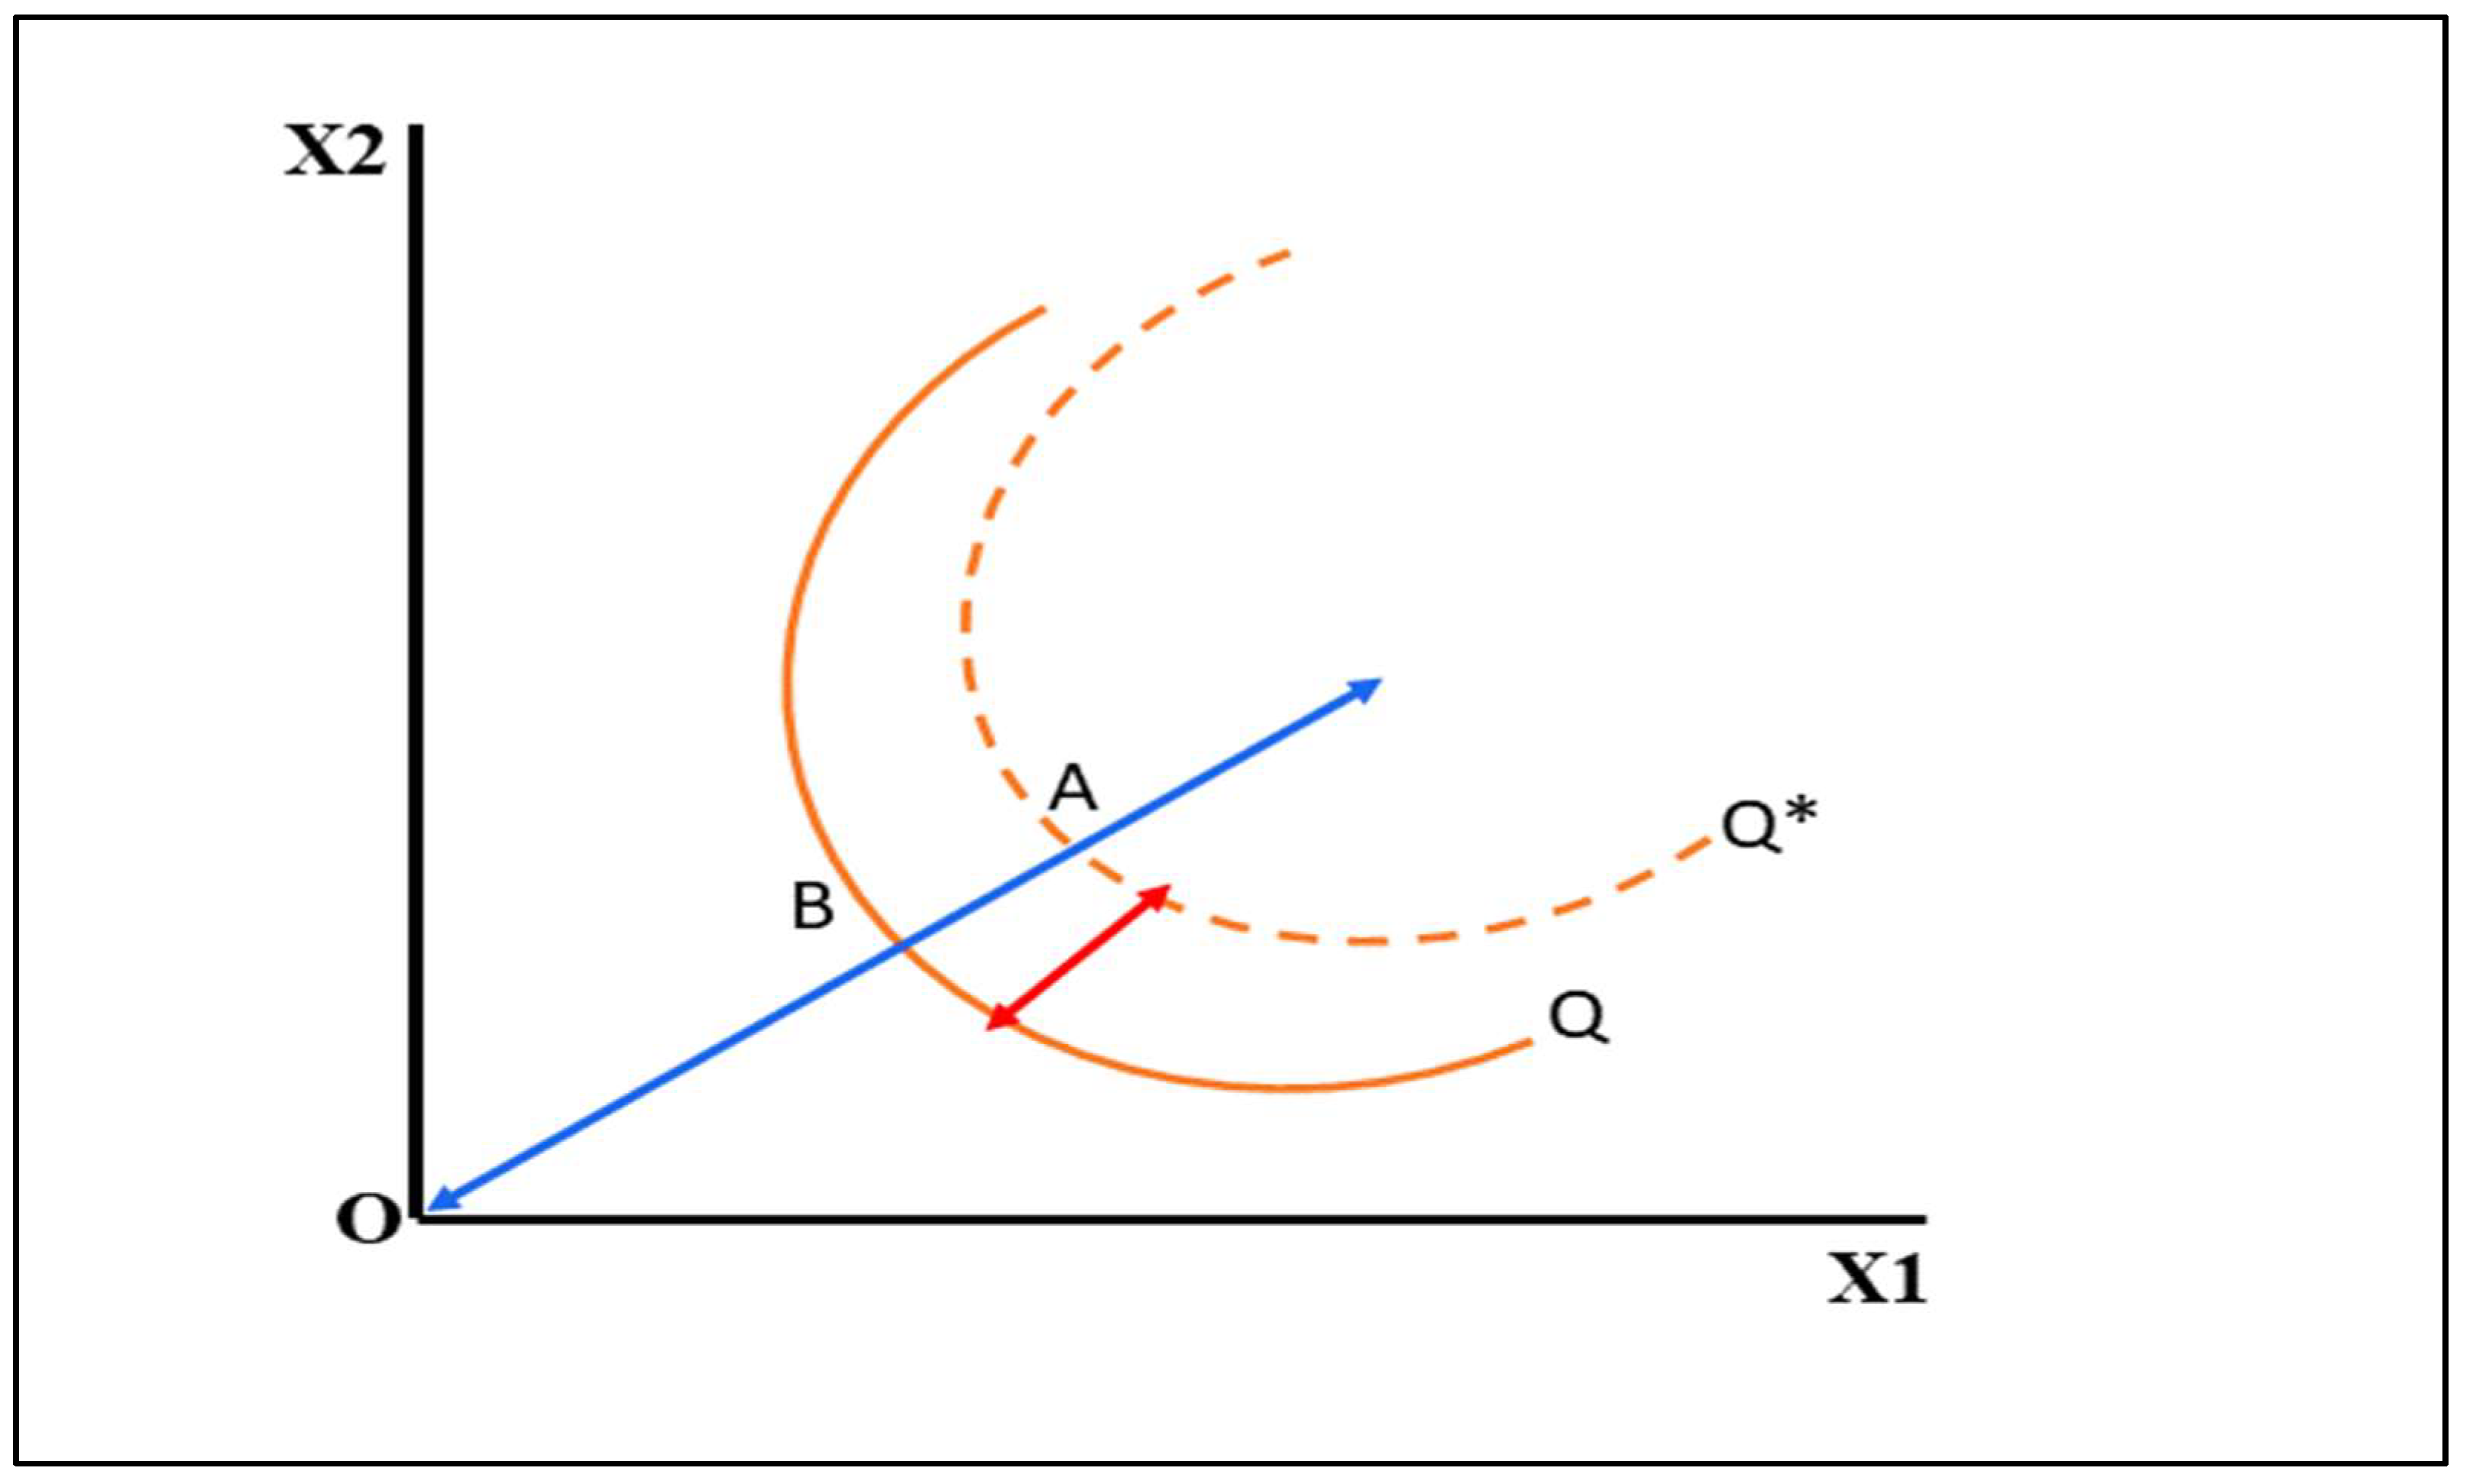
2.2. Theoretical Basis of Technical Efficiency

Generally, efficiency is divided into two components i.e., technical and allocative. Technical efficiency refers to achieve the maximum possible output with the existing technology while allocative efficiency refers to the ability of firms to equate the marginal products of the allocated inputs with their relative prices. The authors of [26,31,32,33] defined allocative efficiency as an ability of the firms to equate the marginal value product (MVP) to the marginal factor cost (MFC). The company attempts to maximize production in the neoclassical sense though curtailing the price of inputs. This needs the company to try to accomplish a technically efficient allocation. To put it another way, with the same quantity of inputs, the firm should be able to generate higher output with the technology it has [34]. Figure 3 illustrates an isoquant plot, showing the different input combinations, providing the same outcome. The input combination generates the Q* output. The firm is technically efficient at this input level. However, due to technical inefficiency, the aggregation of input at point A may provide the output Q at location B, which is the result of the input combination at point A. Input–output or output–output measures can be used to assess technological inefficiency [34].
To obtain the observed output at point B using the input and output measure, the level of inputs at A must be contracted [35]. To be more precise, inputs can be lowered by the proportion AB/OA, which is an estimate of technical inefficiency. The technical efficiency of the input–output may therefore be measured as 1-AB/OA = OB/OA. On the other hand, the output measurement concentrates on how Q* can be produced by the same inputs utilized to make Q. Technical inefficiency is calculated as (Q*Q)/Q*. The output–output technical inefficiency is defined mathematically as
Q = f ( x ) e x p ( μ )
where ‘l’, a quantity measuring technical inefficiency, is greater than or equal to zero, and ‘ x ’is the input vector.
As evidenced by the literature review, two methodologies are typically employed to evaluate a firm’s technical efficiency. The non-parametrical and mathematical (Data Envelopment Analysis) approach of the DEA and the SFM (Stochastic Frontier model) approach focused on a model that was developed at the deterministic frontier of [36]. The DEA methodology assists with various outputs and inputs in the production process. Because it is a non-parametric approach, it is less in sensitivity to deal with the error term’s specification because it lacks the capacity to distinguish between inefficiency and noise while estimating technical efficiency [37]. In comparison, the SFM approach elucidates the relationship between a single output and multiple input [38], and as a parametric approach, it is quite capable of differentiating the effects of inefficiency from the noise term as shown in Figure 4, which generating more accurate estimates of the output and inputs relationship.
According to Kopp et al. [33], the author’s imposed a very restricted assumption among the few concepts of a deterministic frontier that only firm inefficiency are responsible for the deviation from the observed level; however, Schmidt (1985–1986) argued this, and concluded that statistical noise always had an impact on the performance of the firms calculated by these models [39], and used a stochastic frontier production model to resolve this conflict and avoid the random effect on efficiency.
Y j = f ( X i j   ,   ) + ε
where Y j is the output achieved by the j t h firm,   X i j is the i t h variable utilized by the j t h firm, is the parameters to be assessed by the model, and   ε is the error term of the model. The key component of the SFM technique is that it is a particular error term that consists of two parts, such as the technical inefficiency and the random error of the individual [39]. The term error of the model is specified as follows.
ε = v u
According to [40,41], both terms are independent of one another; “u” signifies an individual’s technical inefficiency or, more simply, the difference between the observed and frontier level output, which is half normally distributed and always greater than 0 (u > 0), while the “ v ” term of the composed error represents random factors, which are beyond the control of an individual and is normally distributed on each side. ( < v < ).

2.3. Specification of Frontier Model

The stochastic frontier model estimates rice production’s technical efficiency. This procedure quantifies the influence of the technical inefficiency that rice growers cannot control. Because of its benefits of ease of interpretation and estimation, to measure the technical efficiency in this research, the Cobb–Douglas production function is suitable. The elastic functional form also resolves multicollinearity. We may describe the SFA equation for the analysis as given below:
l n Y i = i = 0 n β i l n X i + ε i  
where Y i is the yield of rice in kg per acre; X 1 is the tractor used for hours during rice cultivation in the acres; X 2 is the laborers’ working hours on the rice fields till rice cultivation;   X 3 is the chemical fertilizer, i.e., DAP or urea, used in kilogram; X 4 is the number of irrigations applied to the rice field per season;   X 5 is the seed rate used in kg per acre; ε i is the composed error term; l n is the natural logarithm; β 0 is the intercept of the model; and β i   is the equation parameters.

2.4. Estimation of the Stochastic Frontier Model

The maximum likelihood estimation (MLE) methodology was used to quantify the SFA [40]. The main purpose of the maximum likelihood principle is to choose the parameter estimates (β, σ2 ε) to boost the probability of obtaining the data:
l n L = n 2 l n [ π 2 ] n 2 l n σ 2 + i = 1 n l n [ 1 F ( ε i γ σ ) 1 γ ] 1 2 σ 2 i = 1 n ε i 2
ε i = Y i X i β v    
where σ2v and σ2 u are the variances used in the equations for v and u, respectively; further, σ2ε = σ2 v + σ2 u, and γ = σu/σv. The MLEs of β, γ, and σ2ε, where the rate of the likelihood function was at its peak, were attained by adjusting the first-order partial derivatives with respect to β, γ, and σ2ε as equal to zero and solving these non-linear equations at the same time. Non-linear optimization algorithm can be applied to calculate the optimum values of the variables.

2.5. Estimation of Technical Efficiency and Technical Inefficiency of Individual Rice Growers

To calculate the technical efficiency (TE) and inefficiency (TI) of rice growers the following formula was used:
                            T E i = Y i Y i *                
where   Y i - i t h is the rice grower observed yield; Y i * - i t h is the rice grower frontiers yield; and T E i is the technical efficiency of the i t h rice grower ranges in between 0 to 1.
The formula used to calculate the technical inefficiency (TI) of individual rice growers is given below.
T I i = 1 T E i        
where T I i = 1 ( Y i Y i * ) is the i t h rice growers’ technical inefficiency, and its range lies between 0 and 1.

3. Results

3.1. Summary of the Statistics Variables

A summary of the statistics variables in the model is shown in the Table 1. The mean value of rice yield was 1555.66 kg/ac for hybrid seed growers. The mean values of tractor time used by rice growers was 27.20 h/ac (1 hectare = 2.47 acres). The average of labor working h/ac was 41.5 h. The amount of hybrid seed used was 0.48 kg/ac. The average values of chemical used was 19.13 L/ac. The pesticides usage and irrigation inputs are generally included in application frequency. The application frequency of the water irrigation was 39. Demographic characteristics, such as farming experience, age, education level, tenancy status, and primary source of income, influence the inefficiency of a farming community in the production process [42]. The statistics showed that rice growers in the study area had an average age of 58.3 years. Most of the sampled rice growers were literate with an average education level of 7.97 years. On average, the sampled farmers had experience in rice farming of 43.07 years. On average, 18% of the rice growers were owners while the remaining were tenants and about 66% of them attended government agriculture extension services and training programs. The average value of the loan received variable was 12%.

3.2. Cost Production

Table 2 shows the total cost of producing rice crop per acre resulted from totaling the transportation and on-field production cost, whereas the on-field cost is the sum of the fixed cost (land rent) and variable cost (cost on variable inputs such as tractor, labor, seed sown, urea, chemicals, irrigation, and marketing cost, etc.). Tractor was used to prepare the seed bed for sowing.
The average cost of the tractors used by the sampled farmers was USD 217.48 with the unit cost of USD 8.00 and it contributed about 44.86% to the total cost. Laborers in the study area were used to perform certain activities, such as sowing of seeds, seedlings’ raising and transplantation, irrigation, chemicals, urea application, harvesting, threshing, etc. The average wage rate on a daily basis in the study area was recorded as USD 0.50 and the total cost of labor on average was calculated as USD 20.80. Rice growers in the study area used certified seed for production and it contributed 1.39% to the total cost with an average of USD 6.75/ac. Chemicals such as pesticides and weedicides, along with fertilizers such as urea, were applied to enhance the rice production. The average cost incurred on both the inputs were recorded as USD 40.41 and USD 39.87 with their average application of 2.85 L and 98.53 kg, respectively, contributing about 16.54% to the total cost. Frequent irrigation is required to irrigate the rice crop as it is quite water intensive, and all the sampled farmers used canal water for irrigation. The variable was measured in numbers and the average cost incurred on it was USD 8.26, sharing about 1.70% of the total cost. The average rent of land was calculated as USD 141.52/ac. Land rent was highest among all the other costs and contributed almost 29.19% to the total cost. Marketing cost includes the cost of the rice bags, loading, unloading, and transportation; but, as all the sampled farmers sold both their main and by-product at their relative farms, this cost was not too much. The average marketing cost was recorded as USD 9.66 and it contributed 1.99% to the aggregate cost of the rice crop. The cost incurred at the farm level for rice production was calculated as USD 475.10, which contributed about 97.8% to the total cost of USD 484.76/ac.

3.3. Maximum Likelihood Estimation Results of Technical Efficiency and Inefficiency Model

3.3.1. Estimation of Technical Efficiency Model

Table 3 contains the production function estimation results. It shows the result of the full sample and class-specific sample. The maximum likelihood is statistically significant at the 1% significance level. The estimated coefficients along with their z-statistics and p-values showed that all the regressors had a significantly increasing effect on the rice productivity. Based on this, the author estimated a translog production form. Our results revealed that labor, chemical, and hybrid seed variables have a highly positive and significant impact on the productivity of rice. In turn, the tractor and irrigation variables had a statistically non-significant effect.

3.3.2. Estimation of Technical Inefficiency Model

Table 4 shows the parameter estimates of the relationship between the technical inefficiency (TIE) and respondents’ socioeconomic and demographic factors. The dependent variable of the inefficiency function is the evaluated TIE; therefore, for the TIE evaluation, a negative evaluation coefficient indicates that the relevant variable has a constructive impact on TE, and a positive evaluation means that the variable has a negative impact on TE. Our results revealed that the variable extension visit, education and the credit variable had a positive and statistically significant impact on rice productivity.

3.4. Profitability Ratio

Table 5 represents the profitability ratio and gross and net return from rice farming per acre (ac) in the study area. The average rice grain yield in the study area was recorded as 1556.66 kg/ac, resulting an average revenue of USD 870.70 while the average revenue of rice crop’s by-product was calculated as USD 222.00. The gross and net revenues of the rice growers per acre were calculated as USD 1092.71 and USD 607.95, respectively. The sampled rice growers were reasonably profitable as the profitability ratio of 1.25 revealed that a single rupee investment on rice farming created a profit of Rs. 1.25, which is far greater than its competitive seasonal maize crop.

3.5. Ranges of Technical Efficiency

Figure 5 illustrates the rice farmers’ technical efficiency in the selected districts of the Uttar Pradesh state under the frontier below 100% or 1. The mean technical efficiency level is approximately 62%. A huge variation range was observed in the scores of the technical efficiencies of the rice growers, with 162 (20.25%), ranging between 61–70 percent as the highest score. A total of 115 (14.37%) respondents of the total selected sampled were 71–80 percent efficient. Likewise, 140 (17.5%) respondents were 51–60 percent efficient. The least portions, 133 (16.62%), 130 (16.25%), and 120 (15%), consist of farmers with efficiency levels 31–50, 81–90, and 91–100 percent, respectively. A main reason behind these fluctuations in the ranges of individual technical efficiency is maybe the differences in their financial status, and our study suggests it can be improved by proper utilization of existing input factors and providing access to credit.

4. Discussion

Multiple studies’ results have revealed a positive relationship between socio-economic variables and technical efficiency [43]. In 2020, a case study in Andhra Pradesh, India, was conducted by [44], who estimated the farm-level technical efficiency of paddy production. The results of the study showed that rice productivity in the area can be improved by modern technologies, frequent training, and experience-sharing mechanisms, with efficient resource management practices. In an overview of rice farmer efficiency studies, [45] reported that the average technical output in the Assam region was 69%, indicating that the technical efficiency has a major impact on growing growth. This appears to be affected by the technicality of the proportion of land used to grow rice while age, labor, and education are factors influencing inefficiency. For this purpose, to increase yields, it is important to evaluate the output and productivity of domestic rice production, both in terms of labor, seed use, paddy fields, fertilizer, and the technology used. To increase productivity in production, the degree of efficiency, and inefficiency in the inputs and outputs used, is very important to identify. In [46,47], studies on rice farming in Korea were conducted, which examined the efficiency and determinants of farm productivity. The results of these studies indicate that the technical efficiency of rice production is negatively influenced by age, schooling, labor, and property. The estimated coefficients along with their z-statistics and p-values showed that all the regressors had a significantly increasing effect on the rice productivity, except for the no. of irrigation. The estimated 0.28 coefficient for labor working hours was positive and highly significant (α = 0.000), ranked as the highest among all the other coefficients. A 1% increase in the used labor force reduces the productivity by −0.03. The results depict a non-linear relationship between technical efficiency and the number of laborers working on farmland. The possible reason behind this is, most of the of farmers have a well-equipped machinery system on their farm. So, therefore, an increase in the number of labors working on farm would decrease the productivity. Our results are consistent with the findings of [4]. The estimated coefficients for the tractor variable had a positive but non-significant impact on rice production. We found that the coefficient for the tractor used by rice growers had a positive but non-significant impact on TE. Farmers used a variety of pesticides, insecticides, and herbicides to mitigate the harmful impact of insects and pests on rice productivity. As a result, different farmers have adopted a combination of chemicals. As a result, we created a dummy variable to indicate if a farmer employed any of the abovementioned chemicals, which are coded 1 and 0 otherwise. The coefficient of the chemical is non-significant, but the coefficient chemical square was significant, and its magnitude is 0.00. This may be due to overuse of pesticides while the farmer is in the irrational stage III of production [48], where MVP < MFC. It is needed to reduce the use of pesticide in the research area to the point where the marginal value of the product is in equilibrium with the marginal factor cost MVP = MFC. These results are consistent with [27,49,50,51]. Our study revealed that an increase in the chemicals’ application can increase rice productivity by 0.06%. The reason for this is that chemicals are much more important in agriculture’s efficiency because they control the pests, herbs, and harmful weeds that affect the productivity of crops by competing with them for essential nutrients and water [52]. The results are in line with [53]. We used the irrigation frequency that the farmers used throughout the season. As a result, we have used irrigation and irrigation squared to estimate its non-linear effect on rice production. Irrigation is significant at 5%, while irrigation squared is significant at 1% in our study, which indicates that the more the rice farm is irrigated, the more productive it would be because rice is a highly water-intensive crop and requires more water than any other crop. The results of the study for irrigation are supported by the findings of [54], who observed the same positive and significant effect of irrigation on rice yield. The hybrid seed parameter had a significant and positive impact on the TE of the rice growers. The coefficient value of the hybrid seed was 0.16 and it shows a 1% level of significance. The reason behind this degree of impact is the farmers are using tractors and other machinery for land ploughing, which cause an increment in the productivity of rice, if the farmers use seeds of good quality and fertilizers on farmland.
The variable age has shown a positive impact and experience has shown a negative relationship with technical efficiency, but both have non-significant impacts on technical efficiency. Our study shows that the impact of the education variable is highly positive and significant and revealed a 1% level of significance. Farm’s technical efficiency can be improved by education, extended schooling, and live demonstrations. Farmers can enhance their ability of information acquisition and utilization of new and improved technology. Hence, educated farmers were more efficient than the farmers without basic education. This is because highly educated farmers are more technically efficient and able to carry all agricultural activities in a more sophisticated way. Our result is in line with the previous research conducted on Indian rice farmers by [3,46].
The impact of the extension service variable was highly positive and significant. Extension services must be expanded to those famers who do not maintain any extension contacts, which is possible if new members are included in each new training proposed by the Department of Agriculture. Hence, government should strengthen the structure of the extension machinery, so that farmers can improve their skills and practice to apply available agricultural technology more efficiently through extension service, seminars, and live demonstration, which is consistent with the research of [55,56]. The experience variable had no significant impact, even though it is negative. The main reason behind this, is maybe the farmers cultivated new varieties of rice, having no prior experience of it, hence resulting in a decrement in technical efficiency. This result is consistent with the findings of [57]. Tenancy status of the rice growers were treated as a dummy variable in the model and the coefficient inferred that the farmers who were tenants and relying only on agriculture as their primary income source were technically more efficient as compared to others, but the results of the variables was insignificant. Generally, the tenants incur more variable costs in a production process as they face a higher economic burden of paying annual land rent, making them more responsible to fight on their behalf and get some tremendous amount of yield. Other authors [49,58,59,60] found the same impact of tenure status on technical inefficiency.
Comparing the mean technical efficiency from this study with other studies revealed that the mean technical efficiency is not far from the findings of [45,56,61,62], with a mean technical efficiency of 68, 69, 72.8, and 77%, respectively. The average technical efficiency recorded from this study is higher than the one recorded by [63,64], with an average technical efficiency of 54 and 64%, respectively. Similarly, the average technical efficiency recorded from this study is higher than the one recorded by [65,66,67], with an average technical efficiency of 82, 89.5, and 91%, respectively.

5. Conclusions

This study used stochastic frontier techniques to evaluate the technical efficiency (TE) and its determinants on rice production in the Uttar Pradesh state, India. A set of structured questionnaires was used to collect primary data about the farming practices and socioeconomic characteristics of 800 rice farmers. The mean technical efficiency score was 72. There is substantial potential for enhancing rice productivity via efficient management and utilization of existing resources and technologies. We found evidence of the need for agricultural households to improve their technical efficiency by 28%. The results of the MLE estimation suggest that the variables hybrid seed, irrigation, and chemicals have a significant positive impact on TE. From the assessment of the determinants of technical efficiency, we found common predictors relevant to the socio-economic characteristic of rural farm households; these include tenure status and experience. Rice farming in the study area was reasonably profitable, with a profitability ratio of 1.25.
In terms of policy and recommendation. We found that hybrid seed and increased use of chemicals would increase the rice productivity. However, smallholder farmers have limited resources. Government subsidies on some specific products will reduce the farmer’s limitation in applying better input in the rice fields. Microfinance institutions and commercial banks are the primary sources of credit for farmers purchasing machinery. In contrast, because India lacks an agricultural bank to support credit schemes for the purchase of farm machinery and equipment, farmers have been forced to use their own savings or borrow from existing financial institutions or dealers to purchase new machines, often at relatively higher interest rates. Thus, the Indian government must prioritize this issue and implement appropriate solutions to ensure that every household farmer has easy access to loans.
We hope this study can provide useful information to the planners in pursuit of agricultural development as rice continues to be a dominant crop in the state. This study’s findings provide a springboard for policymakers seeking to improve productivity in Uttar Pradesh, which may aid future generations in resolving the rice productivity issue.

Supplementary Materials

The following supporting information can be downloaded at: https://www.mdpi.com/article/10.3390/su14042267/s1, Figure S1: Top 10 rice producing countries in the world. Figure S2: Production of rice between 2010–2019. Figure S3: District-wise yield of rice in Uttar Pradesh.

Author Contributions

R.b.S.C.: conceptualization, data curation, formal analysis, investigation, software, methodology, writing—original draft, writing—review and editing; A.K.: data curation, formal analysis, investigation, software, writing—review and editing; X.L.: investigation, software, methodology. writing—review and editing; X.X.: funding acquisition, investigation, methodology, project administration, supervision. All authors have read and agreed to the published version of the manuscript.

Funding

The authors are grateful for the financial support from The National Social Science Fund of China, Project No. 21BJY187.

Institutional Review Board Statement

Not applicable.

Informed Consent Statement

Not applicable.

Data Availability Statement

Not applicable.

Acknowledgments

The survey was sponsored and supported by my supervisor, Xia Xianli. We thank Aftab Khan for his valuable help in technical assistance. We are also thankful to the farmers of Uttar Pradesh for providing the information through the questionnaires.

Conflicts of Interest

The authors declare no conflict of interest.

References

  1. Pramanick, B.; Brahmachari, K.; Kar, S.; Mahapatra, B. Can foliar application of seaweed sap improve the quality of rice grown under rice–potato–greengram crop sequence with better efficiency of the system? J. Appl. Phycol. 2020, 32, 3377–3386. [Google Scholar] [CrossRef]
  2. FAO. Statistical Yearbook; FAO: Rome, Italy, 2021. [Google Scholar] [CrossRef]
  3. Samarpitha, A.; Vasudev, N.; Suhasini, K. Technical, economic and allocative efficiencies of rice farms in Nalgonda district of Telangana state. Econ. Aff. 2016, 61, 365–374. [Google Scholar] [CrossRef]
  4. Reddy, A.; Sen, C. Technical inefficiency in rice production and its relationship with farm-specific socio-economic characteristics. Indian J. Agric. Econ. 2004, 59, 259–267. [Google Scholar]
  5. Singh, V.K.; Gautam, P.; Nanda, G.; Dhaliwal, S.S.; Pramanick, B.; Meena, S.S.; Alsanie, W.F.; Gaber, A.; Sayed, S.; Hossain, A. Soil Test Based Fertilizer Application Improves Productivity, Profitability and Nutrient Use Efficiency of Rice (Oryza sativa L.) under Direct Seeded Condition. Agronomy 2021, 11, 1756. [Google Scholar] [CrossRef]
  6. Walker, T.S.; Ryan, J.G. Village and Household Economics in India’s Semi-Arid Tropics; Johns Hopkins University Press: Baltimore, MA, USA, 1990. [Google Scholar]
  7. Wu, W. Estimation of technical efficiency and output growth decomposition for small-scale rice farmers in Eastern India. J. Agribus. Dev. Emerg. Econ. 2020, 10, 139–156. [Google Scholar] [CrossRef]
  8. GOI. Agricultural Statistics at a Glance 2018; Ministry of Agriculture and Farmers Welfare, Directorate of Economics and Statistics: New Delhi, India, 2018.
  9. United States Department of Agriculture(USDA). F.A.S. Commodity Intelligence Report; USDA: Washington, DC, USA, 2015.
  10. United States Department of Agriculture(USDA). E.R.S. Rice Outlook; USDA: Washington, DC, USA, 2020.
  11. Cai, H.; Yan, T. Technology efficiency or allocation efficiency: The inverse relationship in China’s cereal production. China Agric. Econ. Rev. 2019, 11, 237–252. [Google Scholar] [CrossRef]
  12. Song, G.; Xiao, J.; Yu, Y.; Shen, L. A techno-economic assessment of SNG production from agriculture residuals in China. Energy Sources Part B Econ. Plan. Policy 2016, 11, 465–471. [Google Scholar] [CrossRef]
  13. Tiep, N.C.; Wang, M.; Mohsin, M.; Kamran, H.W.; Yazdi, F.A. An assessment of power sector reforms and utility performance to strengthen consumer self-confidence towards private investment. Econ. Anal. Policy 2021, 69, 676–689. [Google Scholar] [CrossRef]
  14. Chuong, H.N. Determinants of efficiency in rice production of farmers in Viet Nam rural. Sci. Technol. Dev. J.-Econ. Law Manag. 2020, 4, 715–722. [Google Scholar] [CrossRef]
  15. Mishra, M.K.; Sisodia, B.V.S.; Tripathi, R.K.; Ravita; Kumar, L.; Tanwar, N. Growth rate and trend analysis of rice crop in Uttar pradesh. Plant Arch. 2020, 20, 213–218. [Google Scholar]
  16. Choudhary, B.B.; Sirohi, S. Understanding vulnerability of agricultural production system to climatic stressors in North Indian Plains: A meso-analysis. Environ. Dev. Sustain. 2022. [Google Scholar] [CrossRef]
  17. Mbam, B.; Edeh, H. Determinants of farm productivity among smallholder rice farmers in Anambra State, Nigeria. J. Anim. Plant Sci. JAPS 2011, 9, 1187–1191. [Google Scholar]
  18. Joshi, G.; Bauer, S. Farmers’ choice of the modern rice varieties in the rainfed ecosystem of Nepal. J. Agric. Rural. Dev. Trop. Subtrop. JARTS 2006, 107, 120–138. [Google Scholar]
  19. Akinbile, L. Determinants of productivity level among rice farmers in Ogun State, Nigeria. In Proceedings of the African Crop Science Conference, El-Minia, Egypty, 27–31 October 2007; pp. 1339–1344. [Google Scholar]
  20. Ayoola, J.; Dangbegnon, C.; Daudu, C.; Mando, A.; Kudi, T.; Amapu, I.; Adeosun, J.; Ezui, K. Socio-economic factors influencing rice production among male and female farmers in Northern Guinea Savanna Nigeria: Lessons for promoting gender equity in action research. Agric. Biol. J. N. Am. 2011, 2, 1010–1014. [Google Scholar] [CrossRef]
  21. Jirarud, S.; Suwanmaneepong, S.; Mankeb, P. Farmer and Farm Characteristics Affecting Rice Production on Large Agricultural Plot Scheme: A Case of Khlong Khuean District, Chachoengsao Province, Thailand. Int. J. Agric. Technol. 2016, 12, 1821–1831. [Google Scholar]
  22. Osanyinlusi, O.I.; Adenegan, K.O. The determinants of rice farmers’ productivity in Ekiti State, Nigeria. Greener J. Agric. Sci. 2016, 6, 49–58. [Google Scholar] [CrossRef] [Green Version]
  23. Tanko, M.; Iddrisu, A.; Alidu, A.F. Determinants of rice yield in Northern region of Ghana, the role of policy. Asian J. Agric. Ext. Econ. Sociol. 2016, 9, 1–11. [Google Scholar] [CrossRef]
  24. Ayedun, B.; Adeniyi, A. Determinants of rice production of small-scale farmers in mono-cropping and intercropping systems in Nigeria. Acta Sci. Nutr. Health 2019, 3, 75–85. [Google Scholar]
  25. Cabrera, V.E.; Solis, D.; Del Corral, J. Determinants of technical efficiency among dairy farms in Wisconsin. J. Dairy Sci. 2010, 93, 387–393. [Google Scholar] [CrossRef] [Green Version]
  26. Farrell, M.J. The measurement of productive efficiency. J. R. Stat. Soc. Ser. A Gen. 1957, 120, 253–281. [Google Scholar] [CrossRef]
  27. Ali, S.; Khan, M. Technical efficiency of wheat production in district Peshawar, Khyber Pakhtunkhwa, Pakistan. Sarhad J. Agric. 2014, 30, 433–441. [Google Scholar]
  28. Kadiri, F.; Eze, C.; Orebiyi, J.; Lemchi, J.; Ohajianya, D.; Nwaiwu, I. Technical efficiency in paddy rice production in Niger Delta Region of Nigeria. Glob. J. Agric. Res. 2014, 2, 33–43. [Google Scholar]
  29. GOUP. Government of Uttar Pradesh. Available online: https://up.gov.in/Social-Demography.pdf (accessed on 22 November 2021).
  30. Cochran, W.G. Sampling Techniques, 3rd ed.; Wiley: Hoboken, NJ, USA, 1977. [Google Scholar]
  31. Zieschang, K.D. A note on the decomposition of cost efficiency into technical and allocative components. J. Econom. 1983, 23, 401–405. [Google Scholar] [CrossRef]
  32. Schmidt, P.; Lovell, C.K. Estimating technical and allocative inefficiency relative to stochastic production and cost frontiers. J. Econom. 1979, 9, 343–366. [Google Scholar] [CrossRef]
  33. Kopp, R.J.; Diewert, W.E. The decomposition of frontier cost function deviations into measures of technical and allocative efficiency. J. Econom. 1982, 19, 319–331. [Google Scholar] [CrossRef]
  34. Koopmans, T.C. Efficient allocation of resources. Econom. J. Econom. Soc. 1951, 19, 455–465. [Google Scholar] [CrossRef]
  35. Kumbhakar, S.C.; Lovell, C.K. Stochastic Frontier Analysis; Cambridge University Press: Cambridge, UK, 2003. [Google Scholar]
  36. Aigner, D.J.; Chu, S.-F. On estimating the industry production function. Am. Econ. Rev. 1968, 58, 826–839. [Google Scholar]
  37. Batiese, G.E. Frontier production functions and technical efficiency: A survey of empirical applications in agricultural economics. Agric. Econ. 1992, 7, 185–208. [Google Scholar] [CrossRef]
  38. Khai, H.V.; Yabe, M. Technical efficiency analysis of rice production in Vietnam. J. ISSAAS 2011, 17, 135–146. [Google Scholar]
  39. Bravo-Ureta, B.E.; Rieger, L. Dairy farm efficiency measurement using stochastic frontiers and neoclassical duality. Am. J. Agric. Econ. 1991, 73, 421–428. [Google Scholar] [CrossRef]
  40. Green, W. Maximum Likelihood Estimation of frontier production function. J. Econom. 1980, 13, 27–56. [Google Scholar] [CrossRef]
  41. Aigner, D.; Lovell, C.K.; Schmidt, P. Formulation and estimation of stochastic frontier production function models. J. Econom. 1977, 6, 21–37. [Google Scholar] [CrossRef]
  42. Shahid, M.; Khalid, S.; Murtaza, B.; Anwar, H.; Shah, A.H.; Sardar, A.; Shabbir, Z.; Niazi, N.K. A critical analysis of wastewater use in agriculture and associated health risks in Pakistan. Environ. Geochem. Health 2020, 1–20. [Google Scholar] [CrossRef]
  43. Kalra, B.; Mondal, B.; Sarangi, A. Technical efficiency of wheat and paddy farms in irrigated saline environment in Haryana State, India: An assessment. Afr. J. Agric. Res. 2015, 10, 637–644. [Google Scholar]
  44. Paul, K. Farm level technical efficiency of paddy production in Andhra Pradesh: An empirical evidence from the cost of cultivation survey data. Econ. Aff. 2020, 65, 335212. [Google Scholar]
  45. Mazumder, R.; Gupta, M. Technical efficiency and its determinants in backward agriculture: The case of paddy farmers of Hailakandi district of Assam. J. Reg. Dev. Plan. 2013, 2, 35–53. [Google Scholar]
  46. Bhattacharyya, A.; Mandal, R. A generalized stochastic production frontier analysis of technical efficiency of rice farming: A case study from Assam, India. Indian Growth Dev. Rev. 2016, 9, 114–128. [Google Scholar] [CrossRef]
  47. Seok, J.H.; Moon, H.; Kim, G.; Reed, M.R. Is aging the important factor for sustainable agricultural development in Korea? Evidence from the relationship between aging and farm technical efficiency. Sustainability 2018, 10, 2137. [Google Scholar] [CrossRef] [Green Version]
  48. Debertin, D.L. Agricultural Production Economics; UKnowledge: Lexington, KY, USA, 2012. [Google Scholar]
  49. Sania Shaheen, S.; Fatima, H.; Khan, M. Technical Efficiency analysis of rice production in Pakistan under dry and puddle conditions: A case study of selected Districts of Punjab province, Pakistan. Sarhad J. Agric 2017, 33, 447–458. [Google Scholar] [CrossRef]
  50. Oni, S.I.; Oyewo, M.A. Gas flaring, transportation and sustainable energy development in the Niger-Delta, Nigeria. J. Hum. Ecol. 2011, 33, 21–28. [Google Scholar] [CrossRef]
  51. Ahmad, B.; Hassan, S.; Bakhsh, K. Factors affecting yield and profitability of carrot in two districts of Punjab. Int. J. Agric. Biol. 2005, 7, 794–798. [Google Scholar]
  52. Hewitt, H.G. Do we need new fungicides? Outlooks Pest Manag. 2004, 15, 90. [Google Scholar] [CrossRef]
  53. Sekhon, M.; Mahal, A.K.; Kaur, M.; Sidhu, M. Technical Efficiency in Crop Production: A Region-wise Analysis §. Agric. Econ. Res. Rev. 2010, 23, 367–374. [Google Scholar]
  54. Ibrahim, M.I.; Jan, S.A.; Shah, A.H.; Abbasi, F.M.; Abdul, M.; Uzma, K.; Abdul, Q.; Mohammad, I.; Naushad, A.; Rabbani, M.A. Estimating quantitative traits based phenotypic diversity in diverse rice germplasm. Fresenius Environ. Bull. 2019, 28, 2074–2084. [Google Scholar]
  55. Ali, I.; HUO, X.-X.; Khan, I.; Ali, H.; Khan, B.; Khan, S.U. Technical efficiency of hybrid maize growers: A stochastic frontier model approach. J. Integr. Agric. 2019, 18, 2408–2421. [Google Scholar] [CrossRef]
  56. Narala, A.; Zala, Y. Technical Efficiency of Rice Farms under Irrigated Conditions in Central Gujarat §. Agric. Econ. Res. Rev. 2010, 23, 375–381. [Google Scholar]
  57. Kuppannan, P.; Coimbatore Ramarao, R.; Samiappan, S.; Malik, R.P.S. Estimating technical and irrigation water productivities in rice production in Tamil Nadu, India. Irrig. Drain. 2017, 66, 163–172. [Google Scholar] [CrossRef]
  58. Ahmad, M.; Chaudhry, G.M.; Iqbal, M.; Khan, D.A. Wheat productivity, efficiency, and sustainability: A stochastic production frontier analysis [with comments]. Pak. Dev. Rev. 2002, 41, 643–663. [Google Scholar] [CrossRef] [Green Version]
  59. Shehu, J.; Iyortyer, J.; Mshelia, S.; Jongur, A. Determinants of yam production and technical efficiency among yam farmers in Benue State, Nigeria. J. Soc. Sci. 2010, 24, 143–148. [Google Scholar] [CrossRef]
  60. Taraka, K.; Latif, I.; Shamsudin, M.N. A Nonparametric Approach to Evaluate Technical Efficiency of Rice Farms in Central Thailand. Southeast Asian J. Econ. 2010, 22, 1–14. [Google Scholar]
  61. Buriro, A.; Khooharo, A.A.; Ghulam, T. Technical efficiency of rice production Sindh, Pakistan: A statistical analysis. Sci. Int. 2015, 27, 6225–6230. [Google Scholar]
  62. Heriqbaldi, U.; Purwono, R.; Haryanto, T.; Primanthi, M.R. An analysis of technical efficiency of rice production in Indonesia. Asian Soc. Sci. 2015, 11, 91. [Google Scholar] [CrossRef]
  63. Koirala, K.H.; Mishra, A.K.; Mohanty, S. Determinants of rice productivity and technical efficiency in the Philippines. In Proceedings of the Southern Agricultural Economics Association (SAEA) > 2014 Annual Meeting, Dallas, TX, USA, 1–4 February 2014. [Google Scholar]
  64. Vortia, P.; Nasrin, M.; Bipasha, S.K.; Islam, M. Extent of farm mechanization and technical efficiency of rice production in some selected areas of Bangladesh. GeoJournal 2021, 86, 729–742. [Google Scholar] [CrossRef]
  65. Chang, H.H.; Wen, F.I. Off-farm work, technical efficiency, and rice production risk in Taiwan. Agric. Econ. 2011, 42, 269–278. [Google Scholar] [CrossRef]
  66. Hasnain, M.N.; Hossain, M.E.; Islam, M.K. Technical efficiency of Boro rice production in Meherpur district of Bangladesh: A stochastic frontier approach. Am. J. Agric. For. 2015, 3, 31–37. [Google Scholar] [CrossRef] [Green Version]
  67. Ogundele, O.O.; Okoruwa, V.O. Technical Efficiency Differentials in Rice Production Technologies in Nigeria; SAIA: Johns Creek, GA, USA, 2006. [Google Scholar]
Figure 1. Map of Uttar Pradesh.
Sustainability 14 02267 g001
Figure 2. Sampling procedure of the respondents.
Sustainability 14 02267 g002
Figure 3. Diagrammatic illustration of technical efficiency.
Sustainability 14 02267 g003
Figure 4. Illustration of the DEA and SFA model.
Sustainability 14 02267 g004
Figure 5. Individual efficiency of the respondents.
Sustainability 14 02267 g005
Table 1. Descriptive statistics of the variables.
Variable NameDefinition MeanSD
YieldYield of rice in kilogram per acre1555.661.01
TractorTractor used by rice grower in hours per acre27.201.03
LaborWorking hours of labor on the rice field till harvest41.631.05
ChemicalChemical used on the rice field in liters19.131.09
IrrigationNumbers of times field has been irrigated per season38.741.01
AgeWhat is age of the respondent in 2020?58.030.42
EducationHow many years did the interviewee go to school?7.970.09
ExperienceHow many years of experience do respondent have?43.070.42
Hybrid seedHas hybrid seed is used by respondent on rice field? If yes = 1, otherwise = 00.480.02
ExtensionRespondent has attended training programs and
other services offered by government. If yes = 1, otherwise = 0
0.660.02
T. StatusLand is taken on a lease or farming on his own land?
If yes = 1, otherwise = 0
0.180.01
CreditHas the respondent gotten any kind of financial help from the government? If yes = 1, otherwise = 00.120.01
Source: Author’s own estimation from the data.
Table 2. Cost of rice production (per acre).
ParticularsUnitCost/Unit (USD)QuantityTCPercent
TractorHrs.8.0027.2217.4844.86
LaborHrs.0.5041.6320.804.29
Seed sownKgs.1.076.336.751.39
UreaKgs.0.4098.5439.878.22
ChemicalsLiters14.182.8540.418.34
IrrigationNo.0.52168.261.70
Land rentUSD141.521141.5229.19
Production costUSD--475.1098.01
Marketing cost---9.661.99
Total Cost---484.76100.00
Source: Author’s own estimation from the data.
Table 3. Estimation results for the translog production frontier (maximum likelihood).
VariableCoefficientStandard-Errorz-Statisticsp-Value
lnTractor0.030.021.390.17
lnLabour0.280.093.020.00
lnChemical0.000.001.490.14
lnIrrigartion−0.710.36−2.000.05
lnTractor20.000.00−1.580.11
lnLabour2−0.030.01−3.480.00
lnChemical20.000.003.470.00
lnIrrigation20.100.052.110.03
Hybrid seed0.160.0130.550.00
Constant7.940.6212.790.00
Source: Author’s own estimation from the data.
Table 4. MLE results of the technical inefficiency effect model.
VariableCoefficientStandard Error
lnAge−0.40 *0.36
lnEducation−0.16 ***0.03
lnExperience0.410.36
Extension Visit−1.59 *0.34
Tenure Status0.13 **0.16
Credit−36.271440.83
Constant3.295.25
lnSigv2−6.85 **0.21
MLE of Variance Parameters
Sigma-squared0.003 **0.00
Gamma2.4080.008
Lamda0.724
Wald chi2 (9) = 1350.84
Prob > chi2 = 000
log likelihood = 1131.691
***, ** and * represents significance at the 1%, 5%, and 10% level. Source: Author’s own estimation from the data.
Table 5. Profitability ratio, gross, and net return from rice farming.
ParticularsYieldRevenue TRTCNRProfitability
Main product1555.66870.701092.71484.76607.951.25
By-product222.00
(TR, TC, and NR indicates total production revenue, total cost, and net return, respectively).
Publisher’s Note: MDPI stays neutral with regard to jurisdictional claims in published maps and institutional affiliations.

