Article

Analyzing the Implementation of Lean Methodologies and Practices in the Portuguese Industry: A Survey

by
Carla M. A. Pinto
1,2,
Jorge Mendonça
1,*,
Lurdes Babo
3,
Francisco J. G. Silva
1,4 and
José L. R. Fernandes
1
1
ISEP—School of Engineering, Polytechnic of Porto, 4200-072 Porto, Portugal
2
CMUP—Center for Mathematics, University of Porto, 4169-007 Porto, Portugal
3
CEOS.PP and Porto Accounting and Business School, Polytechnic of Porto, 4265-004 São Mamede de Infesta, Portugal
4
INEGI—Instituto de Ciência e Inovação em Engenharia Mecânica e Engenharia Industrial, 4200-465 Porto, Portugal
*
Author to whom correspondence should be addressed.
Sustainability 2022, 14(3), 1929; https://doi.org/10.3390/su14031929
Submission received: 17 January 2022 / Revised: 30 January 2022 / Accepted: 6 February 2022 / Published: 8 February 2022
(This article belongs to the Collection New Frontiers in Production Engineering)

Abstract

:
The mass production paradigm on which much of the industry was based has changed. The market is increasingly demanding, requesting diversity and products that are more and more adapted to personal wishes and requirements. This implies producing a greater diversity of products in smaller quantities. Competitiveness is enormous, which forces most companies to be truly effective and efficient, taking care of product quality, delivery time, and final cost. Lean methodologies have been a valuable aid in this field. The diversity of Lean tools has been shown to have answers to the most diverse challenges, and companies are aware of this, increasingly adopting methodologies and processes that aim to progressively reduce waste and adapting their production paradigm to what the market requires. This work intends to provide a vision, as global as possible, of the pathway of Lean implementation in the Portuguese industry. For this purpose, a survey was carried out with a significant sample of Portuguese industrial companies from a wide range of activity sectors. The data collected through the survey were treated statistically, and then a SWOT analysis of the results was performed, which provided a collection of precious information on the evolution of industrial companies in Portugal.

1. Introduction

Market demands have changed in recent decades, forcing companies to quickly adapt to new production paradigms [1]. The growing competitiveness between companies in the same sector increased the need for companies to look for differentiating factors to act in the market. This induced the improvement of the quality and diversity of products and a reduction in the waste that usually exists throughout the production processes. Companies tried to increase as much as possible their effectiveness and efficiency [2]. The later are pivotal factors for the permanence of any industrial company in the current market. In this context, Lean tools have shown to be a valuable aid. Initially developed in Japan to adapt automobile production to market needs after World War II, Lean methodologies were adopted in the 1970s and 1980s by the American industry, having gained particular prominence worldwide with the launch of the book, The Machine That Changed the World [3]. Currently, Lean thinking has literally invaded both industry and service sectors, eager to eliminate waste and make companies economically healthier. One of the factors that has strongly contributed to this vast dissemination is the diversified set of tools that fall under the Lean thinking, which can be applied individually or together, depending on the specific needs of each company [4]. From the most basic tools such as the 5S (Sort, Set in order, Shine, Standardize, Sustain), to more complex tools like VSM (Value Stream Mapping), among others, they allow for the identification and analysis of problems, enabling them to be later overcome. However, the success of its application implies that top management makes the entire structure of the company aware, and that everyone has the objective of properly applying these tools and contributing to the company’s improvement [5]. There are many successful stories, though this success is not global. Winning stories are found through case studies in several sectors, from the health care services to the industry.
Moreover, Lean methodologies have been associated in recent decades with other equally powerful and necessary tools, such as Six Sigma and Sustainability [6,7,8]. In fact, the purposes of these concepts can be perfectly coherent. The Six Sigma methodology provides a set of five steps that essentially aim to analyze a quality problem in a process and find solutions for it, implementing and creating the necessary cycle to solidify the problem’s resolution through constant monitoring [9]. This methodology contributes to the reduction of quality problems, i.e., reduction in the generation of non-conforming products, which is in line with Lean thinking, and reducing waste. On the other hand, when Lean is associated with Sustainability, it has commonly assumed the name Lean-Green, and it also aims to reduce waste, especially that which impacts the environment, such as reducing energy consumption [10]. Lean thinking has also been increasingly associated with ergonomics at work. In fact, there have been studies that prove the connection between a better positioning in the workstation and the performance that a worker can perform on his workstation [11,12]. Thus, there has been a growing interest in improving workstations in order to make the workers’ work easier, which translates into greater productivity, that is, the reduction of wasted time and greater satisfaction in performing functions. More recently, Lean thinking has also been strongly linked to the concept of Smart Manufacturing, or Industry 4.0, as this concept aims to make production as flexible as possible, which strongly reduces waste both in terms of the process and throughout the logistics involving the different stages of production [13]. In [14], the authors perform a systematic review of the integration of four continuous improvement tools (CI), namely Lean, Len Six Sigma (LSS), Kaizen, and Sustainability, and of frameworks of Industry 4.0, from 1989 until 2015. A general framework is then proposed to combine CI strategies and technologies supporting Industry 4.0, to be applied to a wide range of industries. Are incorporated the essential differentiators of the four CI above, namely waste elimination and process optimization from Lean, the excellence of product quality from LSS, production upgrade through CI from Kaizen, and ecofriendly products and minimization of environmental waste from Sustainability. The realization of the Internet of Things and Cyber-Physical Systems aids in connecting the real world with virtual setups, which boosts monitoring and control of manufacturing systems and product development. It is thus possible to see that extremely positive developments have been carried out on several fronts and using different methodologies, so that the effectiveness and efficiency of processes could be vastly improved, both in the industry and in the services sector. Automotive assembly lines and companies that produce components for the automotive industry are in a sector that has consistently applied Lean methodologies as well as its most diverse developments, as it is a highly competitive industry where it is necessary to be constantly thinking of reducing waste and applying the most diverse Lean tools for this purpose. Next, some examples of theoretical and practical developments related to the application of Lean methodologies in various sectors of industry and services are reviewed. Rosa et al. [15] investigated Bowden cables production lines usually applied in automotive vehicles, with a view to increasing their efficiency, allowing these lines to meet the new levels of demand required by the market. In a first phase, they applied the VSM tool to identify the places where it was most urgent to act, then applied a PDCA (Plan-Do-Check-Act) cycle to implement the solutions identified as likely to be applied to improve processes. Through this study, it was possible to increase productivity by 41%, requiring a low investment, which had a return in 4 months of activity. The lines thus came to comply with the new demand requirements, with no need to replicate the line to match that demand. Also based on similar production lines for Bowden cables, Rosa et al. [16] applied the SMED tool in order to minimize setup time in the production of different references for those cables, as there is a tendency to reduce the quantity of cables associated with each reference and order and there is a growing number of references to be produced. The study allowed saving around 58.3% in the weekly time consumed in setups, which was time that reverted to productive time, thus increasing production. Also, in a company that produces pipes for air conditioning systems for automobiles, Antoniolli et al. [17] applied the standard work tool and obtained significant productivity gains, which translated into an increase of 16% in the OEE, going from 70% to 86%, thereby reaching the world reference standard established by Nakajima (85%) [18]. Sivaraman et al. [19] also used Lean tools, this time in conjunction with the DMAIC (Six Sigma) methodology to improve the efficiency of an assembly line of engines for motor vehicles. After identifying the problems, measuring waste, seeking and implementing solutions, and correspondingly monitoring the improvements introduced, it was possible to register an increase in the efficiency of the assembly line of 7%. In turn, Yuik and Puvanasvaran [20] sought to develop a framework for using Lean tools, which could be applied generically in the metalworking industry. The framework was also based on a Lean tool, PDCA. The framework essentially aimed to help SME practitioners to implement Lean tools quickly and effectively, trying to take full advantage of them in terms of efficiency of the production process. Also in the metalworking sector, Pinto et al. [21] applied some pillars of the TPM (Total Productive Maintenance) methodology in a machining sector consisting of CNC lathes and CNC milling machines, having achieved a 23% decrease in breakdowns for CNC lathes and 38% for CNC milling machines. Thus, it was possible to induce a 5% increase in the OEE of this sector of the company due to the increase in equipment availability. Using the Level Scheduling and Takt-time tools, Klašnja et al. [22] promoted a detailed analysis of a harness production line, using those tools and developing a redefinition of the line. It was possible to obtain a better balance of the different tasks performed along the line, showing that it is perfectly possible to use Lean tools to increase the productivity of manufacturing lines. Correia et al. [23] promoted an in-depth study of an assembly line of complex electronic products (surveillance cameras) subject to low order volumes and high model variability, with a view to increasing ergonomics and productivity. Initially applying VSM to identify all tasks and corresponding times and sequence, they then applied Lean Line Balancing (LLB), also known as Lean Line Design (LLD), which promoted a significant improvement in line efficiency through a better balance of activities on the line. It was also registered that after this phase, other Lean tools should be applied, namely Standard Work, SMED, 5S, and TPM, with a view to eliminating some of the wasted time identified in the production line. Based on the textile sector, which is normally highly pressured in terms of competitiveness and produces many components with low added value, Neves et al. [24] carried out a multifaceted study that aimed to increase the efficiency of trimming production lines. Applying tools such as the PDCA cycle, 5S, and 5W2H, together with other tools normally linked to quality improvement such as Pareto’s Diagrams and Ishikawa’s Diagram, it was possible to reduce the time allocated to certain tasks and increase the availability of equipment, achieving a 10% increase in worker availability, which translates into very high productivity gains for the sector. On the other hand, Martins et al. [25] used only the SMED tool to increase the efficiency of a set of three electron beam welding equipment. After a very exhaustive study of the internal and external tasks, it was possible to verify that the tasks that could be external were already external, and thus, to improve the efficiency of the process it would be necessary to make some slight modifications to the equipment, which induced a decrease of 50% in the time needed to perform the setup. In addition, the application of the SMED methodology also allowed for the identification of the causes responsible for the generation of some quality problems, eliminating them almost entirely through actions taken to reduce setup time. It was, thus, a successful work on two different fronts.
SWOT analysis has been a widely used tool in the assessment of situations intended to be improved, or in which there has already been an intervention and the aim is to verify the implemented improvements. However, having already been used in completely different situations, such as those reported below, the tool has shown its multifaceted character. In fact, Zhou et al. [26] successfully used the SWOT analysis to develop a selection model for the suitable strategy of prefabrication implementation in rural areas, proving the versatility of the tool in decision models. Indeed, facing four different strategies with different grades of aggressivity and describing the positive and negative factors regarding the four fields of the SWOT analysis, it was possible to define and select the best strategy regarding the faced objectives. However, Rocha and Caldeira-Pires [27] also used this tool, but to analyze how the Environmental Product Declaration promotion could be carried out. The objective is different, but the principle used to carry out the analysis is exactly the same: a brainstorming is carried out where all the strengths, weaknesses, opportunities, and threats are listed, allowing them to consider the best solution or situation among the different sets listed, or just become aware of the situation or state of a particular process or system. In this regard, it is important that all ideas are extremely objective and perfectly accepted as consensual by the group that is preparing this SWOT analysis, and the constitution of the group and the mentality that should preside over the brainstorming are very important to the final result. Cui et al. [28] used SWOT analysis to assess which key factors are taken into account in terms of need, location, and requirements when planning to build new underground pedestrian systems. The consistent analysis of the different ideas that resulted from the respective brainstorming allowed a greater discussion to be established around what is important when such a system starts to be planned and gave rise to guidelines that will allow for assessment of when such a system is really necessary and what its requirements are. In order to eliminate ambiguities, Phadermrod et al. [29] applied an Importance-Performance Analysis (IPA) to identify SWOT based on customer satisfaction surveys. This analysis was later applied in a case study in a higher education institutions in Thailand, revealing a high reliability of results in the assessment of the institution’s situation, thus validating the application of the IPA to SWOT analyses and drastically reducing the subjectivity that is often related to ideas resulting from brainstorming.
Some studies resorted to SWOT analysis to identify the best Lean implementation practices. In particular, Sodhi and colleagues [30] conducted a detailed SWOT analysis and identified LSS (Lean Six Sigma) as the best waste management technique in Indian manufacturing organizations. Abu et al. [31] performed a systematic literature review on Lean manufacturing in wood and furniture SME and used a SWOT analysis to establish an extensive list of major factors influencing the strengths, weaknesses, opportunities, and threats, helping better decision making in organizations. Abu et al. [31] found that although industrials are familiar with Lean concepts and methodologies, their implementation in the area of wood and furniture is still low. In line with this, Tomioka et al. [32] revised publications over a period of 10 years and applied SWOT analysis to launch main conclusions about the implementation of Lean philosophy in Brazilian manufacturing. Several internal and external factors conditioning success in this emerging industry were identified.
Even though several gaps and problems concerning Lean deployments were found in Brazilian industry, these authors concluded that Lean tools contribute to the evolution, performance improvement, and competitiveness of the sector. In a different setting, De et al. [33] investigated the combined effect of Lean and sustainability-oriented innovation (SOI) in SMEs. The SWOT tool was used to compare inefficient SMEs with the efficient ones and notice required improvements in less successful companies. Mishra and Chakraborty [34] applied SWOT analysis to examine several possible frameworks for companies struggling to implement a Lean philosophy. This strategic decision-making tool can be used to help companies to choose the framework that provides competitive advantage in the sector.
This work intends to provide a global view of the implementation status of Lean thinking in Portuguese companies. A SWOT analysis is performed, supported by statistically worked data. A corresponding discussion is carried out over the results, trying to contribute to a better perception of the evolution of the Lean practices implementation in Portugal. The results can be further compared with other similar studies to be carried out in other countries, allowing for a comparison between the evolution of the implementation in different countries, dissecting the main reasons for different grades of evolution. A similar but very small study, involving fewer companies, was done in 2011 [35].
The present study was guided by two research questions:
RQ1: What is the pathway of Lean implementation in the Portuguese industry, since 2011?
RQ2: What are the main ongoing challenges and disadvantages for Portuguese companies in the dawn of Industry 4.0 implementation?
This article is divided into five sections. In the first, the theoretical contextualization that supports the development of the work is performed. In the second, the adopted methodology is explained. This is followed in Section 3 by the results and relevant discussion. In Section 4, the SWOT analysis and main outcomes are described. This work ends with the conclusions in which the main ideas drawn from this study are highlighted, and future work is sketched.

2. Materials and Methods

This work intended to investigate the state of the adoption and implementation of Lean tools in the Portuguese industry. The instrument used for this purpose was a survey carried out among companies belonging to diverse sectors of activity.
A quantitative data analysis using descriptive statistics, inferential statistical procedures, and SWOT analysis was performed.

2.1. Population and Sample

The population of the present study consisted of companies operating in Portugal. Firstly, a search on the Internet allowed us to collect a list of firms of interest for the study, and an email was sent to more than 1000 companies. This method proved to be fruitless, and consequently it was decided to select the target audience using the social network of professionals and companies, LinkedIn. In a total of 1045 messages and emails sent, 119 responses were obtained (a percentage of 11.4%). The sample considered in this study was based on a set of 98 companies from different sectors of activity, corresponding to the validated responses to the questionnaire.

2.2. Survey

To collect data, a survey was designed based on several studies related to Lean implementation [36,37,38,39]. This survey was developed taking into account two sets: companies that implemented the Lean methodology and companies that did not. In relation to companies that have implemented the Lean methodology, the intention was to understand the level of evolution and the differences in the implementation models between the various types of companies, the main characteristics and difficulties experienced, and to enumerate the factors most influencing the success of its implementation. In the second set of companies, the main goal was to know the reasons for not implementing the Lean philosophy. The online questionnaire performed in the Google Forms® (Montain View, CA, U.S.A.) application ran online between January and April 2020. This format was chosen because online questionnaires present numerous advantages in terms of cost, time, easiness of administration, data organization, and analysis [40,41]. The data file with the answers obtained was downloaded in MS Excel® (Redmont, WA, U.S.A.) format.
The first two sections of the questionnaire consisted of generic questions aiming at characterizing the respondents and the companies, namely department, years of work and position held in the company. The third section addressed respondents whose companies had already implemented Lean tools. The last question was intended for respondents whose companies did not yet apply the Lean philosophy.

2.3. Methods

The questions asked in the questionnaire were translated into qualitative variables (nominal and ordinal) and quantitative variables containing Likert-type scale questions from 1 to 6, and the Lean impact on companies was measured. The study of companies was grouped in terms of role performed by the respondent, size of the company (turnover and number of employees), sector of activity, years of Lean implementation, phase of Lean progress, company labor market (international or national), and types of support applied in Lean implementation. Based on these groups, statistical tests were carried out to verify any standardization or differentiation.
A quantitative data analysis was performed using descriptive statistics to summarize the information collected, followed by inferential statistical procedures based on non-parametric tests for independent samples, namely Mann–Whitney and Kruskal–Wallis [42,43]. In order to provide a holistic picture of the problem under study, the quantitative data analysis was used as the basis for the SWOT analysis. The SWOT analysis technique is a widely used tool in strategic planning, allowing for the identification of the Strengths, Weaknesses, Opportunities, and Threats for a company [44]. The statistical analysis was completed using Microsoft Excel and IBM SPSS Statistics® (Chicago, IL, U.S.A.) for Macintosh, Version 25.0.

3. Results

This chapter presents the characterization of the sample and the discussion of the results obtained by the application of non-parametric statistical tests for independent samples. These samples result from the response groups identified by company size, function performed, time of activity in the company, time of implementation of Lean methodology, internationalization of the company, training in Lean methodology, certified company, and models of Lean implementation. Mann–Whitney tests (for two groups of independent variables) and Kruskal–Wallis tests (for three or more groups of independent variables) were applied to each variable (item) of each of the questions: “What are the results obtained with the implementing Lean in the company?”, “What are the main difficulties experienced in implementing Lean?” and “What factors do you consider important for the successful implementation of Lean Methodology?“
The tests were performed assuming the non-normality of the variables and considering the null hypothesis of the non-existence of differences in the responses between the groups. By performing a hypothesis test, it was possible to ascertain whether this difference was significant from the test p values or test significance [43].

3.1. Data from the Respondent

The first part of the questionnaire characterizes the sample distributed by the following components: department, years of work, and position held in the company.

3.1.1. Department

Most respondents (22.45%) reported that they belong to the Production department. A proportion of 22.45% belong to “Other” department, followed by 18.37% that belong to the Quality department, 11.22% to the Project Management department, 9.19% to Research and Development, 6.12% to Commercial, and 4.08% to the Finance Department. A very small percentage of respondents belong to the Purchasing (1.02%), Logistics (1.02%), and Sales (1.02%) departments.

3.1.2. Years of Experience and Position in the Company

Most of the respondents (60.20%) have been working in the company for less than 5 years, and 51.02% hold an engineering position. A proportion of 24.49% of respondents occupy Board positions, and the remainder are in Supervision (12.24%) and Management (10.20%) positions.
There is no significant association between “Years of experience” and “Position performed” in the company, as a result of the chi-square test for the association between two variables, (χ2 = 16.918 and p = 0.153). Therefore, the position is independent of the years of experience in the company.

3.2. Characterization of the Company

The second part of the questionnaire focuses on the characterization of the company, according to the points below.

3.2.1. Number of Employees and Turnover

Approximately forty-nine percent (48.97%) of respondents belong to companies with 250 or more employees, 32.65% work in companies with a turnover between 10 million and 50 million euros per year, and 31.63% work in those earning more than 50 million euros annually. The number of employees is significantly associated with the company’s turnover (χ2 = 76.599 and p = 0.000) indicating a possible dependence of turnover on the number of employees (Table 1).
It was observed that a slight majority (51.01%) of the companies participating in this study are LE (Large Enterprises), as they have an annual turnover of more than 50 million euros or a number of employees equal to or greater than 250. The other 48.99% of the companies are outside this group and are Small and Medium Enterprises (SMEs), which include micro, small, and medium enterprises. They employ less than 250 people and simultaneously have an annual turnover that does not exceed 50 million euros or a total annual balance that does not exceed 43 million euros [45].

3.2.2. Company’s Sector of Activity

The automobile industry (16.33%) and the metallurgical industry (10.20%) are the most representative sectors of activity in this study. The most diverse sectors have considerably lower proportions, from “Manufacture of machinery and equipment” (8.16%) and Environment (4.08%) to Banking, Electrical equipment, and Health (2.04%). Indicated by “Other” are the 22 sectors from the most diverse areas, including Aeronautics, Consulting, Market Studies, Information Technology, Services, and Telecommunications, among others.

3.2.3. Activity Sector, Internationalization, Lean Training, and Certification

In this regard, it is observed that the secondary sector, with a proportion of 53.06%, and the tertiary sector, with 38.78%, are the most expressive sectors among the companies present in the sample. Fifty-seven percent of participating companies only operate in the domestic market, and 86% are certified. It should also be noted that 71% of respondents have had training in Lean methodology or Lean tools.

3.2.4. Proportion of Companies That Apply Lean Methodology

This is the key issue in the questionnaire, which separates companies applying the Lean philosophy from those that do not. It was observed that, from the 98 companies participating in the study, 68% were practitioners of the Lean philosophy.

3.3. Factors That Prevent the Implementation of the Lean Philosophy

A key issue in this study was to identify factors preventing Lean implementation in the 32% companies that do not apply it. Most of them (41%) consider that the company’s management is the most impeding factor (Table 2). The answer that stands out right after is “The current system works, and we don’t need Lean” (28%). However, some respondents (24%) mentioned that the Lean implementation is being planned. With a slightly lower percentage of responses (17%) is the employees’ culture. Indeed, the respondents think that with the current employees’ mindset, they would never succeed in implementing Lean.
In the dissertation by Moreira [35], the main factor preventing the introduction of Lean was the Financial Resources of the company, with 45.1%. In the current study, this factor has registered a significant decrease to 3%. In the same study, the factor with the highest percentage of responses was Top Management, with 39.2%. This result is in line with the current study, which supports the idea that the greatest effort for change will have to come from the Company Management.

3.4. Lean Implementation

A specific section of the questionnaire was addressed only to companies that practice the Lean philosophy. The questions were intended to assess the development they have had with its implementation.

3.4.1. Years of Lean Implementation

The vast majority of companies (59.71%) implemented Lean “less than 5 years ago”, 19.41% applied Lean “between 5 and 10 years ago”, and only 17.91% implemented it “more than 10 years ago”. This is a sign that the application of Lean methodology is still relatively recent in Portugal.

3.4.2. Lean Methodology and Lean Tools Application by Department

The departments where the implementation of the Lean methodology is more expressive are Quality (63%) and Logistics (47%), while the Project Management department (10%) is the less experienced. In the middle, one can find Production (32%), Research and Development (27%), Maintenance (19%), Commercial (18%), and Financial (17%), among others (Figure 1).
The 5S tool continues to lead the preferences of the companies, with 87%, similar to what occurred in 2011, when it was the preference of 88.6% of Lean companies [35]. Kaizen was the second option with the highest number of responses; it had an increase from 62.9% to 77% since 2011 [35]. This shows that Kaizen has been progressively used in companies operating in Portugal. The PDCA cycle is the following choice, with 73% of respondents claiming to use it in their companies. In another study carried out by students on Industrial Management and Engineering Master in ISEP – School of Engineering, Polytechnic of Porto, Portugal, between 2001 and 2010, in a small sample of 18 companies, 20 Lean tools were identified as being used in industrial projects, with Kanban as the main choice [46]. Finally, the application of Quality Function Deployment (QFD) was chosen by 18% of respondents. It is also verified that 8% of the companies indicate “Other”, which may suggest the existence of other tools created by the companies themselves (Figure 2).

3.4.3. Stage of Lean Implementation

Most of the companies are at an intermediate phase (44.78%), followed by the advanced and the initial phases, with 26.87% and the 25.38%, respectively. Approximately 3% of the respondents did not indicate the progression stage.
In the aforementioned Lean study in Portugal [35], respondents chose the intermediate stage, with 51%, the advanced stage with 31%, the introduction stage with 9%, and the planning stage with 9%. We remark that, in this study, the number of companies is 98 and in the previous one [35] this number is considerably lower (18), and thus, the comparison is somewhat negligible. Nevertheless, we observe an increase in the number of companies applying Lean, especially those at the initial stages. This and other responses to the questionnaire, namely the one with respect to the need for improvement of Lean practices in their company, with 95% of the respondents saying “yes”, suggest that companies progressively recognize Lean implementation’s benefits for the company as a whole.
Table 3 shows the distribution of the progress of the implementation of Lean methodology by years. It is observed that most of the companies (59.71%) have implemented Lean “less than 5 years ago” and approximately half of these companies are in an intermediate stage. From the perspective of the progress phase, most of the companies (44.78%) are in the “Intermediate” phase. For companies with Lean implemented “For more than 10 years” (17.91%), approximately 58% located in this category are in the “Advanced” stage.
It is verified that there is no significant association between “Years of Lean implementation” and “Stage of Lean implementation”, according to the result of the chi-square test for association between two variables with a significance p > 0.05, (χ2 = 13.770 and p = 0.077), which indicates that the number of years of implementation is independent of the Lean progress stage.
Most of the companies involved in this study (56.72%) are international, with 25.37% in the intermediate phase and 20.90% in the advanced stage of Lean implementation. It is also verified that most of the companies operating within the national market are in an intermediate phase. There is no significant association between “National/International” and “Stage of Lean implementation”, according to the results of the chi-square test for association between two variables, with a significance of p > 0.05, (χ2 = 5.211 e p = 0.136). This indicates that companies’ internationalization is an independent factor of the “Stage of Lean implementation”.
As for the classification of a company as SME or LE, the analysis shows that most of the companies are LE (61.20%), with 29.85% in the Intermediate phase and 25.37% in the Advanced stage of application of Lean methodology (Table 4). SMEs are mostly in the Initial phase of implementation (19.40%). There is a significant association between “SME/LE classification” and “Stage of Lean implementation”, as a result of the chi-square test for association between two variables, with a significance of p < 0.05, (χ2 = 18.510 e p = 0.000). The latter suggests a likely relationship between the classification of SME/LE and the development phase of Lean application.
The previous results are in line with the fact that 61.20% of the companies present in this study that implement Lean methodology are LE, with 46.27% operating in the international market (Table 5). Again, we verified a significant association between these two characteristics (χ2 = 15.363 e p = 0.000). Thus, we perceive the fact that companies with an applied Lean methodology act mainly in the international market, combined with the accentuated “internationalization” in large companies.
The distribution of the three phases of Lean implementation by the three sectors of activity (Table 6) indicates that 61.20% of the companies belong to the Secondary sector, with a percentage of 28.36% in the Intermediate phase. The results of the chi-square test do not reveal any association between these two factors, i.e., the activity sector is independent of the progress phase of the implementation of Lean methodology.
The Mann–Whitney test was applied to identify differences between representatives of companies linked to the tertiary and secondary sectors, since the mixed sector had a very small portion of representatives of companies that apply Lean methodology. Considering these two independent groups, “Secondary” and “Tertiary”, no significant differences were observed in the items related to the results of the implementation of the Lean methodology, or in the difficulties of its implementation.
It appears that there are no significant differences between the perceptions of representatives from different sectors of activity in relation to the most significant results, difficulties, and factors considered important in the implementation of the Lean methodology.

3.4.4. Improvement of Lean Practices

Most respondents think the company needs to further enhance Lean practices (97%), which makes perfect sense for the Lean philosophy as it advocates for continuous improvement. In the study by Moreira [35], 57% of companies operating in Portugal thought they needed to intensify their current Lean practices. Bearing in mind that at that time, in most companies using Lean, the principles and tools had been introduced in the previous 3 years. Furthermore, 37% of respondents thought that there was no need to improve, and the rest replied that they did not know. Thus, we start to see some changes in the mindset of employees from then until the present study.

3.4.5. Lean and Company Competitiveness

Regarding the question “Do you believe that Lean helps to increase the company’s competitiveness?” the answer was unanimous; everyone agreed that Lean helps to increase the company’s competitiveness. In the above-mentioned study [35], 89% answered “yes” and the rest disagreed.

3.4.6. Models to Support the Implementation of the Lean Methodology

As for the models that help in the implementation of the Lean Methodology, it appears that 61.2% is done by the company’s own staff and 32.8% subcontract specialists in the area, which does not invalidate the inclusion of company employees in the help. This was an open question; thus, respondents could describe another model, with “Both” being the answer provided by the remaining participants.

3.4.7. Factors Contributing to the Success of Lean Implementation

Respondents expressed their opinion about the important factors influencing the success of Lean implementation in the company they worked for. They rated each item on a Likert-type scale, where 1 meant a minor factor and 6 meant a high importance factor. A classification score was assigned to each item. This score represents the proportion between the number of points obtained in a given item and the maximum they could obtain (Equation (1)). Figure 3 shows the scores obtained by each item.
S c o r e = t o t a l o f g i v e n p o i n t s m a x o f p o i n t s × 100 %
The item “Support from the company’s Board of Directors” is considered by respondents as the most important factor for the successful implementation of the Lean methodology, obtaining a score of 89.86%. In fact, a large percentage of respondents rated this item as “Extremely important”. This is followed in importance by “Efficient communication between employees” (85.96%) and “Appropriate training of employees and cultural change” (85.56%). Respondents considered the factor “Highly competent employees” with a lesser degree of importance (74%). It should be noted that all items analyzed have mode and median values between 5 and 6, which reflects their significant role for a successful Lean implementing strategy. The results obtained in this questionnaire are in line with the study by Kumar et al. [36] which refers to the added value of the involvement and commitment of the company’s management for the successful implementation of the Lean methodology.
“Support from the company’s Board of Directors” is the only item that presents significant differences between representatives of companies with and without Lean training, as observed from the results of the Mann–Whitney test (U = 103.000 and p = 0.010 < 0.05).
Employees of companies that implement Lean or Lean tools consider this to be a very important topic, with a mean grade of 5.39 and a median of 6. This is significantly higher than the values attributed by representatives of companies that do not apply Lean, who provided a mean grade of 4.43 and a median of 5.
The only factor considered important for the successful implementation of Lean that is sensitive to the fact that a company has been putting it into practice for some time is “Realistic work plan and budget”. This presents significant differences between the groups with different implementation times (H = 7.063 and p = 0.029). Again, the group of companies stands out where the methodology has been implemented for more than 10 years, with the highest mean grade being 5.25.

3.4.8. Results of Lean Implementation

Figure 4 presents the respondents’ opinions on the results obtained with the implementation of Lean in the company where they worked. These responses refer to the question “What are the results of implementing Lean in your company?”. The respondents again used a Likert-type rating scale, and the classification score assigned to each item is defined by Equation (1). It is observed that “Improvement in process quality” with a score of 82%, and “Increased productivity” with a score of 81.58% are the items that present the most relevant results. This is supported by the median value of 5, mode of 6, and means of 4.92 and 4.89, respectively. The items “Efficiency in attracting new customers”, “Improved knowledge of customers”, and “Creation custom products or services” are those that present less significant results, with scores of 63.89%, 63.93%, and 64.29%, respectively. It should be noted that the standard deviation varies between 1.24 and 1.41, reflecting a differentiated variability of scores from item to item.
The Kruskal–Wallis H-test has been also applied to evaluate the effect of the Lean practice time in the company as well as its results. The practice time was distributed into three categories that gave rise to three independent groups (samples): “less than 5 years ago”, “between 5–10 years ago” and “more than 10 years ago”. Statistically significant differences have been observed, with significances lower than 0.05 and/or 0.01 in some of the items, namely, “Efficiency in obtaining new customers “ (H = 6.477 and p = 0.039), “Improved knowledge of customers” (H = 6.320 and p = 0.042), “Quality of customer service” (H = 8.169 and p = 0.017), “Company profit increase” (H = 6.078 and p = 0.048), and “Improved decision-making process” (H = 9.543 and p = 0.008). Effectively, the Lean practice time reveals itself as one of the fundamental points for obtaining significant results. Figure 5 presents the means of these items regarding the three mentioned categories. It is noteworthy that highest means are observed for an implementation time greater than 10 years.
Furthermore, the fact that a company in this study is national or international is not a differentiating characteristic in relation to the results obtained with the implementation of the Lean methodology.

4. SWOT Analysis of Lean Implementation in Portugal

In this section, the S(trengths), W(eaknesses), O(pportunities), and T(hreats) of the Lean philosophy implementation in companies operating in Portugal are analyzed. To the best of our knowledge, few studies have performed a SWOT evaluation of the pathway of Lean implementation in companies operating in Portugal. However, taking into account the size of the present sample, it is evident that this methodology is increasingly used. Thus, an adaptation of the SWOT language was applied to reflect strengths (advantages), weaknesses (disadvantages), opportunities, and threats (ongoing challenges), similar to [47].

4.1. Strengths (Advantages)

As can be seen in the previous section, there are important factors for the success of Lean implementation. In Table 7, the median, mode, mean, and standard deviation of the factors identified by the respondents are depicted. The factor with the highest median and mode is “Support from the company’s Management”. The variability in the answers is similar to all identified factors.
All factors expressed in Table 8 are internal; they are strengths, forces that companies have or can develop that will allow them to be successful in implementing Lean. In Table 8, the median, mode, mean, and standard deviation of the results indicated by the respondents with respect to the implementation of Lean in their company are shown. The results can impart strength or intensify company’s strengths to accomplish an effective Lean implementation. Good results are an additional motivation for management and employees. Increased productivity and improvement in process quality have the best mode and mean values. This suggests that employees need to see these results to continue to be motivated by the Lean philosophy.
It is known that the main Lean strength or advantage is to reduce waste, which, consequently, helps to generate more profit and better productivity for the company. It was exactly the latter, the increase in productivity, that was one of the factors presenting the best classification in the current study, as mentioned above. Another positive factor observed is that most of participants (97%) express that they need to increase the implementation of Lean in the company. One of the main reasons for Toyota’s success is never being satisfied and always wanting to evolve [48]. In terms of the implementation phase, about 45% of the respondents claim to be in an intermediate phase and 28% in an advanced phase of Lean implementation, which shows a good progression in general, when compared to the 2011 study [35]. Multinational companies are the great majority at an advanced stage of implementation. As to the sector of activity, the intermediate progress phase is predominant in companies in the secondary sector.
Another factor with a good score is the improvement in the quality of the process. Lean makes the process very flexible with better standardization, which makes it more agile, balanced (Heijunka), and has less execution time, rationalizing human effort [49,50]. In terms of quality, it makes the process more robust and with fewer errors or defects. The argument is to stop whenever there is a problem and solve it immediately (Jidoka). Visual control is very important to detect problems. With the best choice and best tool practices, the Lean Methodology helps to prevent the eight types of waste [51].
One of the great advantages of Lean is that people become versatile, with a better critical capacity and willing to solve the problems that arise in their daily lives. This characteristic ultimately increases the flexibility of companies [52], which was one of the factors with an average rating of 4.53 in the present study, with a median and mode of 5. The study found a high percentage of respondents from companies in the automobile industry. Almost all admitted having the Lean concept implemented in the company (just over 90%), which is in line with the study carried out by Wu [53]. This study states that most auto-industry companies have already adopted, to some extent, some aspects of Lean.
Among the factors that were given less importance by respondents in this study were “Efficiency in obtaining new customers” and “Improvement in customer knowledge”. These are relevant items to better serve the stakeholders. As a future suggestion for improvement, companies should try to understand and implement a customer relationship framework that can best meet their needs.
Creating a culture of continuous improvement is the best way to achieve success in an organization [54]. The analysis of the responses to the questionnaire allowed us to observe a great evolution in the thinking of Lean practitioners. In particular, regarding the need to improve Lean practices in Portugal, an increased trend was perceived from Lean companies, from 57% in the study of Moreira [35] to 97% of respondents in this study.
In the performed non-parametric tests, it was found that almost all respondents from companies that have had Lean for a longer period attributed a better classification in all factors related to the results of the Lean implementation, which indicates further evolution in these companies.

4.2. Weaknesses (Disadvantages)

In this item, the study started by summarizing the main issues revealed by the responses to the question on the main difficulties experienced in Lean implementation (Figure 6 and Table 9). The presented score is calculated using Equation (1). The analysis of Table 9 shows that “Employees’ resistance” is highly scored, at 71.11%. On the other hand, the “Choice of tools”, with a score of 51.78%, is considered an item of less difficulty in the implementation of the Lean philosophy.
The resistance of employees is the factor with the greatest impact on the difficulties experienced, as reported by the professionals who participated in the study. These perceptions are in agreement with most studies carried out in other countries [55,56,57]. This factor has a greater impact on SMEs and national companies.
Changing the mindset or culture of employees is extremely challenging [55], especially those who have been performing certain tasks for many years and/or have a long life in the company. These workers have an aversion to change, insisting that Lean will not work and no benefits will come from it, either for them or for the company. The most heard excuse is having too much work and not being able to spare time with Lean implementation [56]. It is essential to realize that the shift to a Lean culture does not happen overnight; it requires a holistic, consistent, long-term engagement and a deep organizational transformation most of the time [58]. These points require a good leadership that promotes cultural change in workers. Otherwise, it is proven that this will be one of the paths to failure [48].
In certain cultures, Lean implementation may be easier than in others [55]. It is therefore essential to constantly motivate employees and try to integrate them in the best possible way. Lean principles have been readapted, since its creation, to different requests and organizational cultures, in order to adjust to various realities, and it is its plasticity that makes Lean powerful [56].
It is also added that respondents from companies that did not have Lean implemented claimed that one of the main reasons was the lack of an adequate mindset or culture of employees towards Lean methodology. This reason was also identified in other studies from other countries [59]. According to the authors in [60], the success of Lean implementation depends strongly on employees and their mindsets. The main factor for Toyota’s success with the Lean concept was its highlighted importance of the involvement of its employees and, above all, of what motivated them. Despite the negative weight inherent to this aspect, this does not mean that there cannot be behavioral changes. For a proper implementation, all employees must be integrated into the philosophy, from top management to front-line technicians [48].
Second, in terms of implementation difficulties, respondents mentioned, in similar proportion (66%), the delay in implementing the process and the lack of communication between employees. It is urgent to develop methods that promote greater interaction between employees. Teamwork can help to identify the capabilities of employees, which above all avoids the eighth waste (underutilized people). Another viable solution that has been used in several companies, to break down barriers between departments and facilitate access to information, is the application of a single data-access system for all employees, in a centralized manner. This can be implemented with software like ERP—Enterprise Resource Planning [61].
Another weakness is the commitment of managers, with a score of 62.89%. The good relationship that top management has with its employees is considered very important. Everyone must be part of the continuous improvement process to be successful, which reveals the great importance of the aforementioned Gemba Walk [62]. Only 56% of the respondents admit having practiced Lean in their workplace. This may be related, in part, with the sector of activity of the companies involved in the study—the services sector. They do not feel the need to walk on the shop floor. As the companies live in the digital age, problems tend to be solved off-site. The inclusion of top management focuses a lot on employee motivation, creating conditions for everyone to feel that they can do better every day [48]. SMEs indicate having more difficulties, highlighting the inexperience of leaders in implementing the Lean methodology, which can translate into future Lean failure. These companies must invest in more adequate training methods in order to have the aforementioned change in employees’ mindsets.
Another reported weakness, with a 56.98% score, is budget issues, with SMEs being most deeply affected. This may be related to the turnover, which is usually higher in international companies, or even the lack of experience in Lean presented by SMEs.
Furthermore, results suggest that the groups “SME” and “LE” present significant differences in the items "Resistance of Employees" and “Inexperience of the project team to implement the Methodology”, as shown by the results of the Mann–Whitney test (U = 347.000 e p = 0.033 < 0.05) and (U = 304.000 and p = 0.007 < 0.01), respectively. “Employee resistance” is significantly more difficult for “SME” representatives, with a mean (4.68) that is higher than the mean of “LE” representatives (4.03). In line with this item is the “Inexperience of the Methodology Implementation Project Team” as an equally significant difficulty for the “SME” representatives; with an average score of 4.12, this is also higher than the mean of the “LE representatives”, at 3.15.
Therefore, the size of the company that applies Lean is a differentiating point in the difficulties felt during the implementation, arising from the “Resistance of employees” and “Inexperience of the project team to implement the Methodology” with more significant results in “SMEs”.

4.3. Opportunities

As mentioned by Taiichi Ohno, it is during economic crises that companies with better management methodologies can be distinguished [54]. The Lean Methodology has proven time and time again that it is a very efficient philosophy for improving the quality of management. The COVID-19 pandemic has once again put everyone and everything at stake. Many companies were forced to restructure, making the necessary adaptations to boost their businesses. Sales companies have become more digital to make online shopping easier. As an example, Amazon stands out, registering historical records in purchases [63]. There are companies in the production sector manufacturing products that are considered indispensable at the moment. One example is Zara, one of the well-known Lean companies, which has been making hospital gowns to help fight COVID-19 [64]. Another great example is the wine producer Adega Cooperativa de Vidigueira, Cuba and Alvito, Portugal, which is producing alcohol-based antiseptic gel from wine spirit [65]. The perfume company, Nortempresa Perfume LAB, adapted its factory in Braga, Portugal, to produce 2400 liters of disinfectant gel per day [66]. Many companies have re-adapted to the manufacture of masks, gloves, disinfectants, among other products that could, at the moment, generate added value.
Likert [48] argues that the strategy of using Lean in-product development consolidates a strong capacity for reactivity to market requests and the company’s competitive positioning as a leader in its segment of operation. With the results obtained in this study, it is noted that for the area of creating personalized products or services, Lean has not been so well used, with a score of 64.29% and a median of 4 on a scale from 1 to 6; thus, this COVID-19 pandemic may be an opportunity to be explored.
The Lean application experience allows companies to turn detected weaknesses and threats into opportunities for improvement. The deeper the Lean philosophy is in an organization, the more solutions will be found for the problems that arise and in a shorter period of time [54].

4.4. Threats (Ongoing Challenges)

Threats are external factors, similar to opportunities. Companies have little control over them. In [67], the authors point to liberalization, which relaxes government restrictions, removing international investment. This might cause closure of units and retrenchment due to free flow of capital. Another threat is privatization, when a company’s ownership is moved from the government to the private sphere and there is a profit orientation. The latter might cause reduction of manpower, lay-off, voluntary retirement, transfers, and other kind of measures to reduce the number of employees. Economic recession is another burden to the companies, as well as globalization, promoting an interconnected world, involving people, companies, and governments. Globalization without development induces poverty and unemployment in a country.
In 2018, Prasad et al. [68] performed a SWOT analysis with hybrid modified TOPSIS, to evaluate Lean strategy in the Indian foundry industry. The detailed threats included looming shortage of skilled workers and trained engineers in the field, R&D investment by the companies to increase productivity and reduce pollution, production of sustainable castings during technological and economic challenges, attention to the existence of competitors better equipped with technology and infrastructure to satisfy the market, and fluctuations in raw materials prices in the national and global markets.
In 2018, Jiang [69] described the threats to offsite construction in China, as incomplete policies and standards, lack of acceptance of the market, and poor development conditions for offsite construction.
More recently, in 2021, Abu and co-authors [31] performed a bibliometric and systematic review of the pathways of Lean manufacturing in wood and furniture industries. The identified threats (ongoing challenges) were characterized in different areas, namely (i) lack of competitive strength, (ii) deadlines and pressures, (iii) lack of knowledge (technical, training and/or tangible benefits) and know-how, (iv) small resources (time, capital, labor resources), environmental effects (weather, political, legislative), market demand, obstacles (sustainable financial backing, insurmountable weakness, new regulations, increased trade barriers, emergence of substitute products), and cultural and human attitudinal issues (lack of employee commitment, lack of management support and interest, difficulty in the implementation, backsliding to old ways of work).
To overcome the effect of these factors on the company, one can think of minimizing the company’s weaknesses to respond better to the quest. For example, top management’s short-term thinking, due to lack of knowledge of long-term gains, is an internal weakness that can be minimized. On the other hand, those employees who are more resistant to the Lean philosophy, as already mentioned, may fail due to lack of delivery and affect other employees. It is necessary to overcome entrenched and worn-out positions in processes [56]. Employees unfamiliar with the Lean methodology may think that by improving performance with fewer resources, the company can reduce the number of workers and they may feel their jobs are threatened [70]. Most studies determine that nine of the top ten barriers to change are people-related, including poor communication and employee opposition [71]. This internal weakness can and must be addressed by good communication between management and employees. Any sudden change could induce greater resistance, hence the importance of implementing an incremental process.
Another negative internal factor that could be minimized is the lack of proper training of employees. People with poor training are always a threat due to their difficulty in integrating and accepting cultural changes. Since Lean is a philosophy that defends teamwork, it is evident that this can lead to failure [57]. This internal weakness can be minimized by focusing on training workers who will thus respond more openly and effectively to external threats.
At the moment, the world is still living in a post-COVID-19 pandemic state, with most countries still struggling to vaccinate their populations. Nevertheless, the world is opening up, as is the economy, and companies are awakening from almost 2 years of low or no labor. Opportunities were created during the pandemic, which were recognized by many companies and taken advantage of. Flexibility and speed of response in an organization is crucial, in order to better help in times of need for change and in responding to threats [52].

5. Conclusions

Lean methodology is a management philosophy focused exclusively on process efficiency. The aim is to have better, cheaper, and more agile production or services systems. This methodology contains several frameworks, and each company is responsible for deciding which one is best suited to it and for making the respective adaptations according to the company’s reality. Having a leadership committed to the implementation of Lean is one of the most important factors for its success.
In this work, we performed a SWOT analysis of the Lean methodology implementation in national and international companies operating in Portugal. A questionnaire was prepared and sent to several companies. The questions raised relate to concepts about the application of Lean, the sectors of the company involved in the study, the size of the company, difficulties and threats found, results obtained in terms of products and services, and the implementation phase, among others. A total of 119 individual responses were received from employees from 98 companies, and from different sectors of activity.
The SWOT analysis provided a basis to characterize the companies that apply Lean, in terms of turnover, size, implementation status, and opinion on results obtained, among others. The results are summarized below.
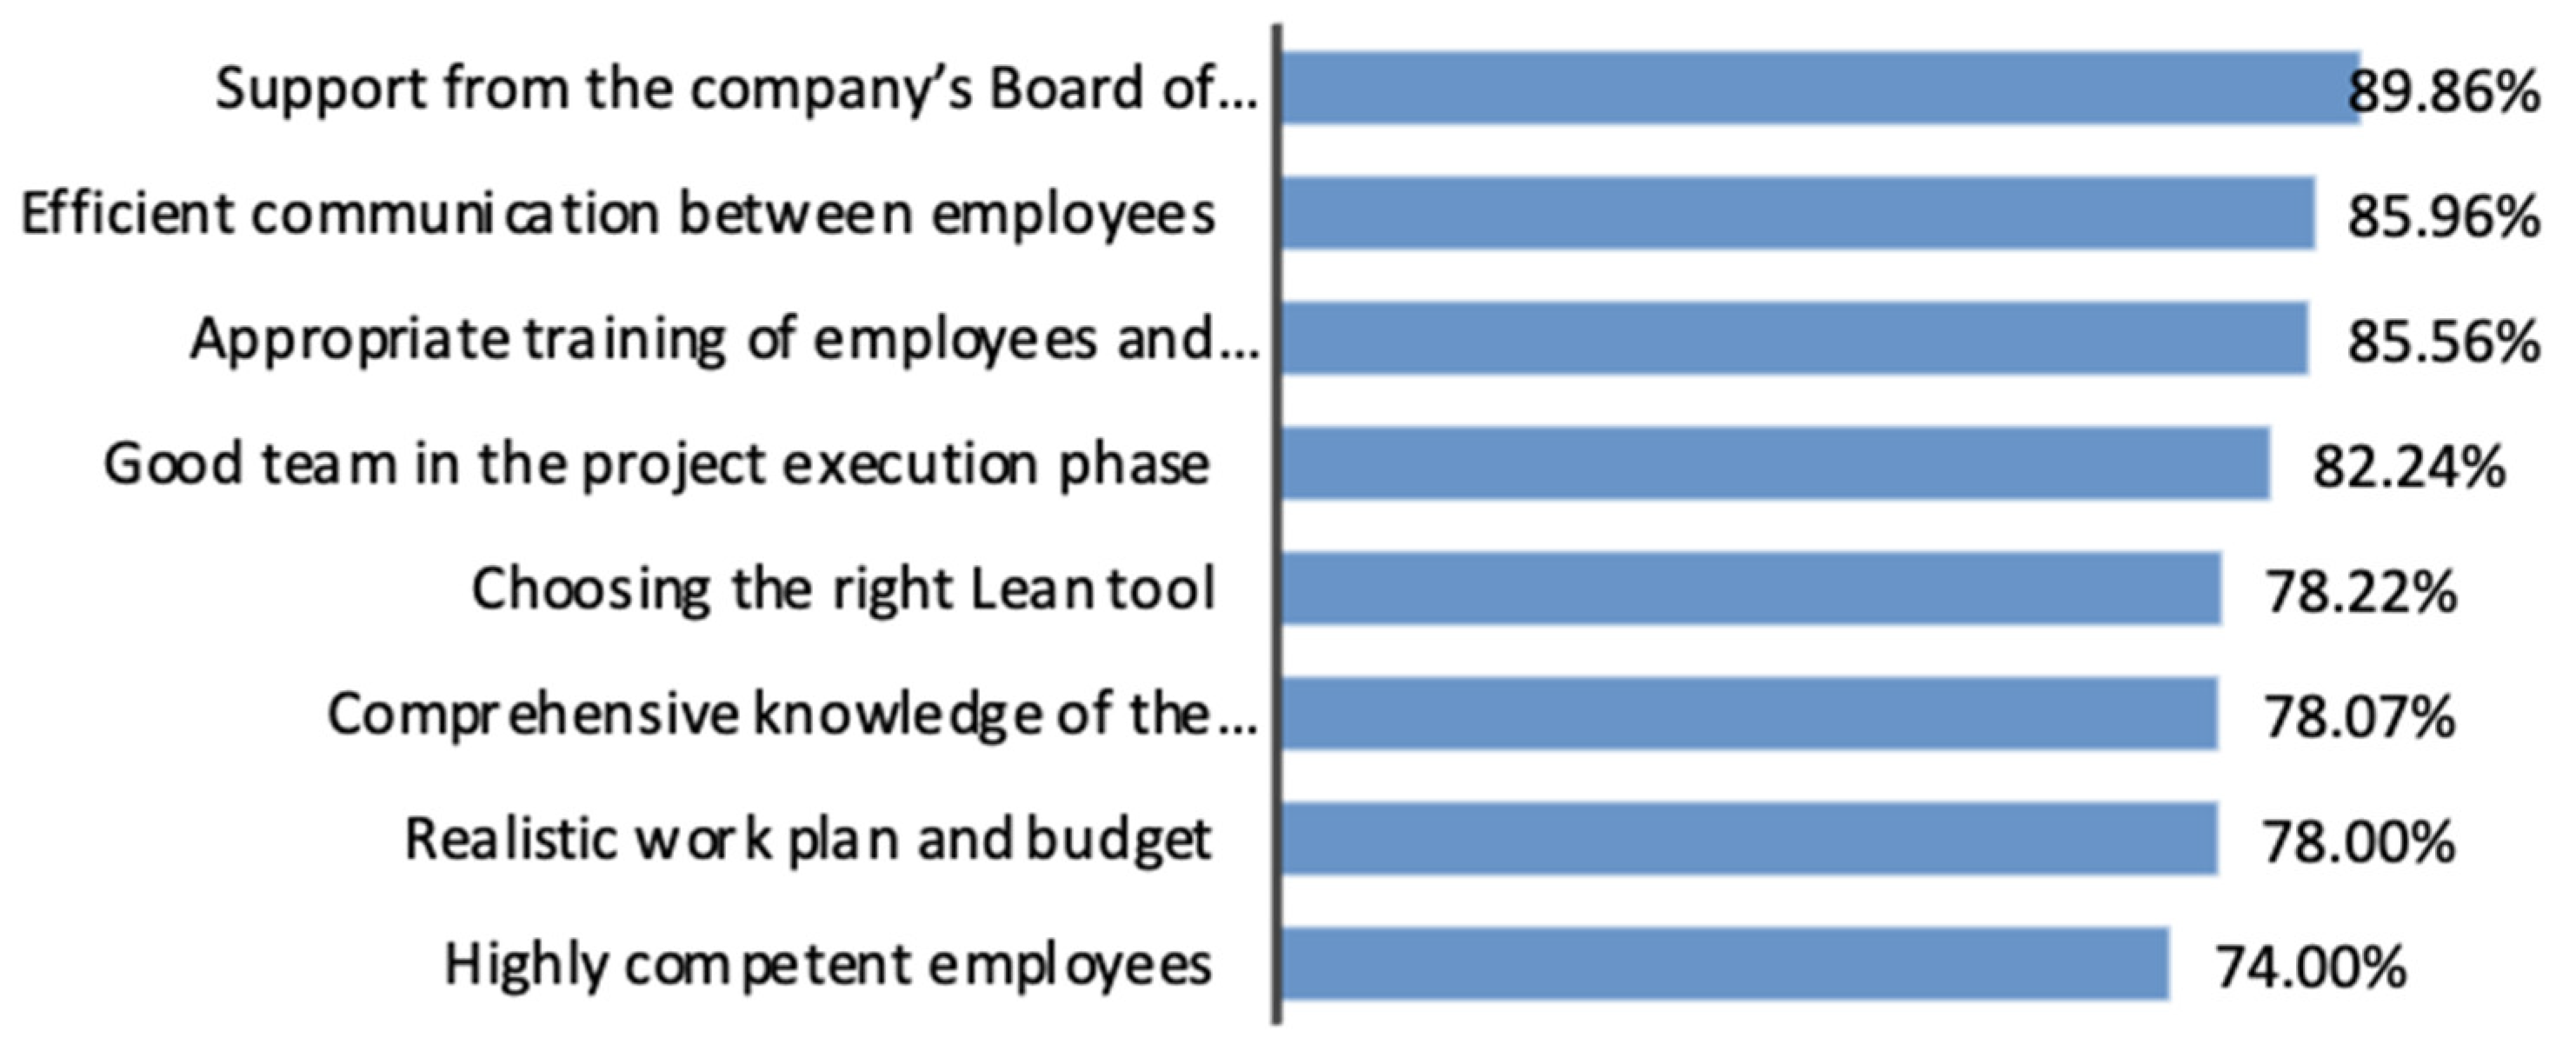
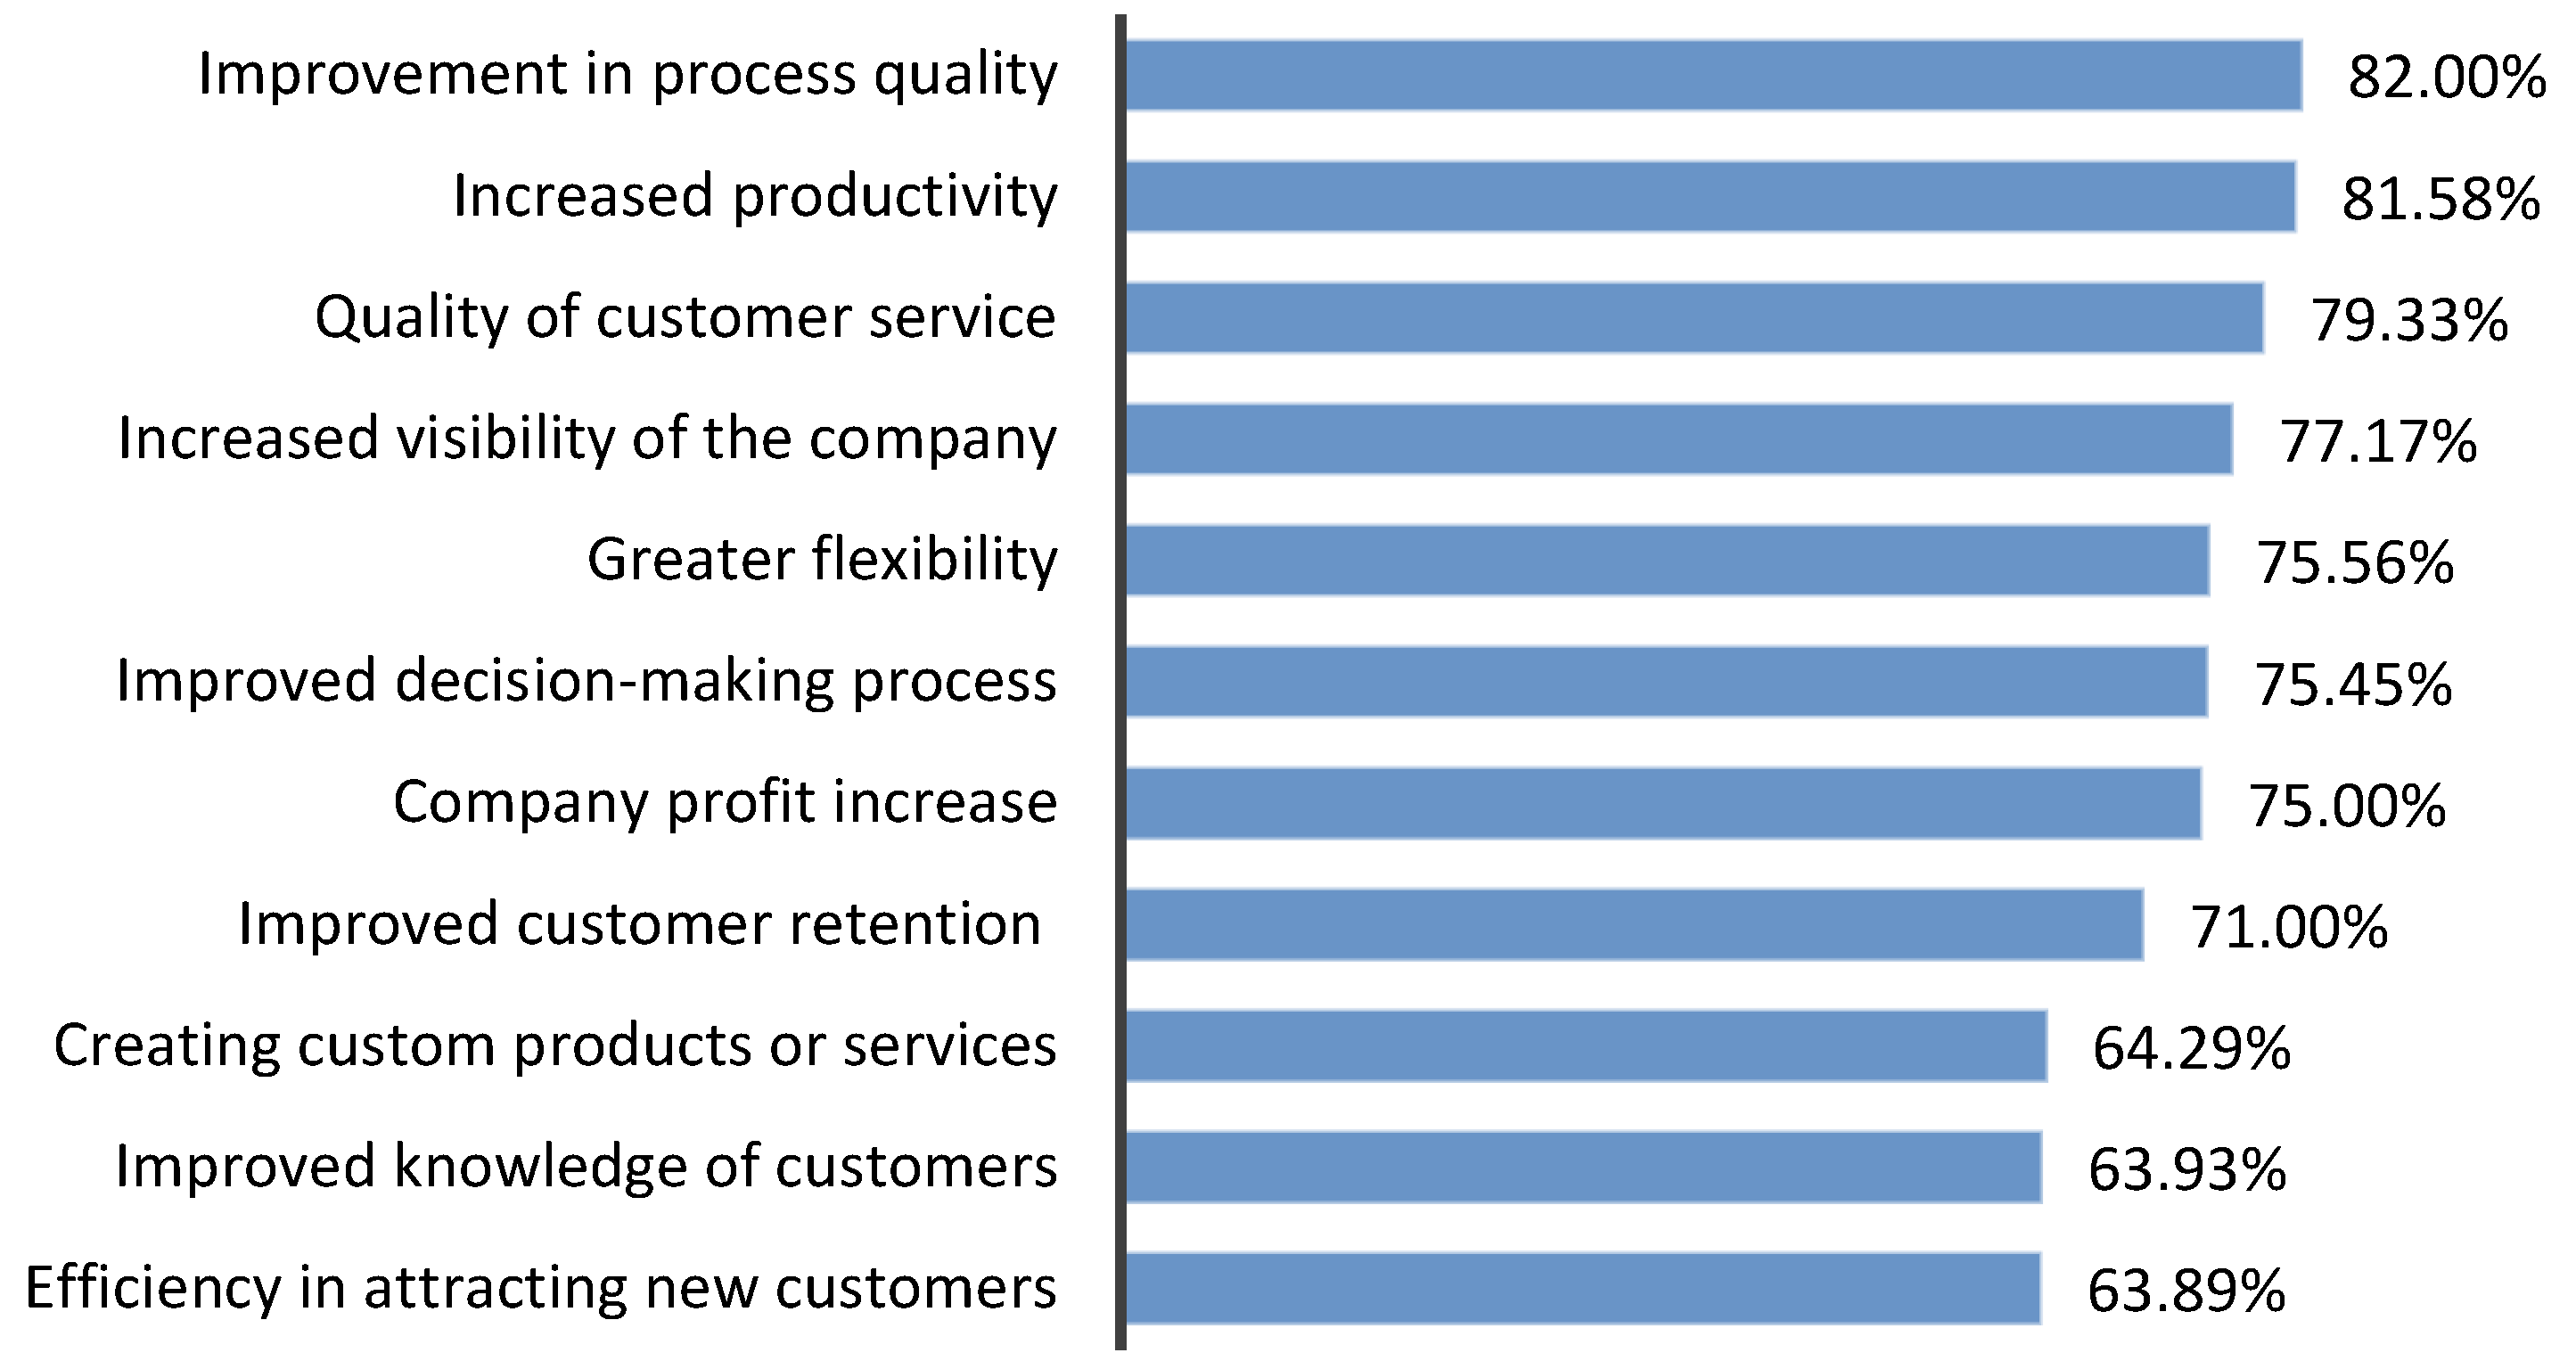
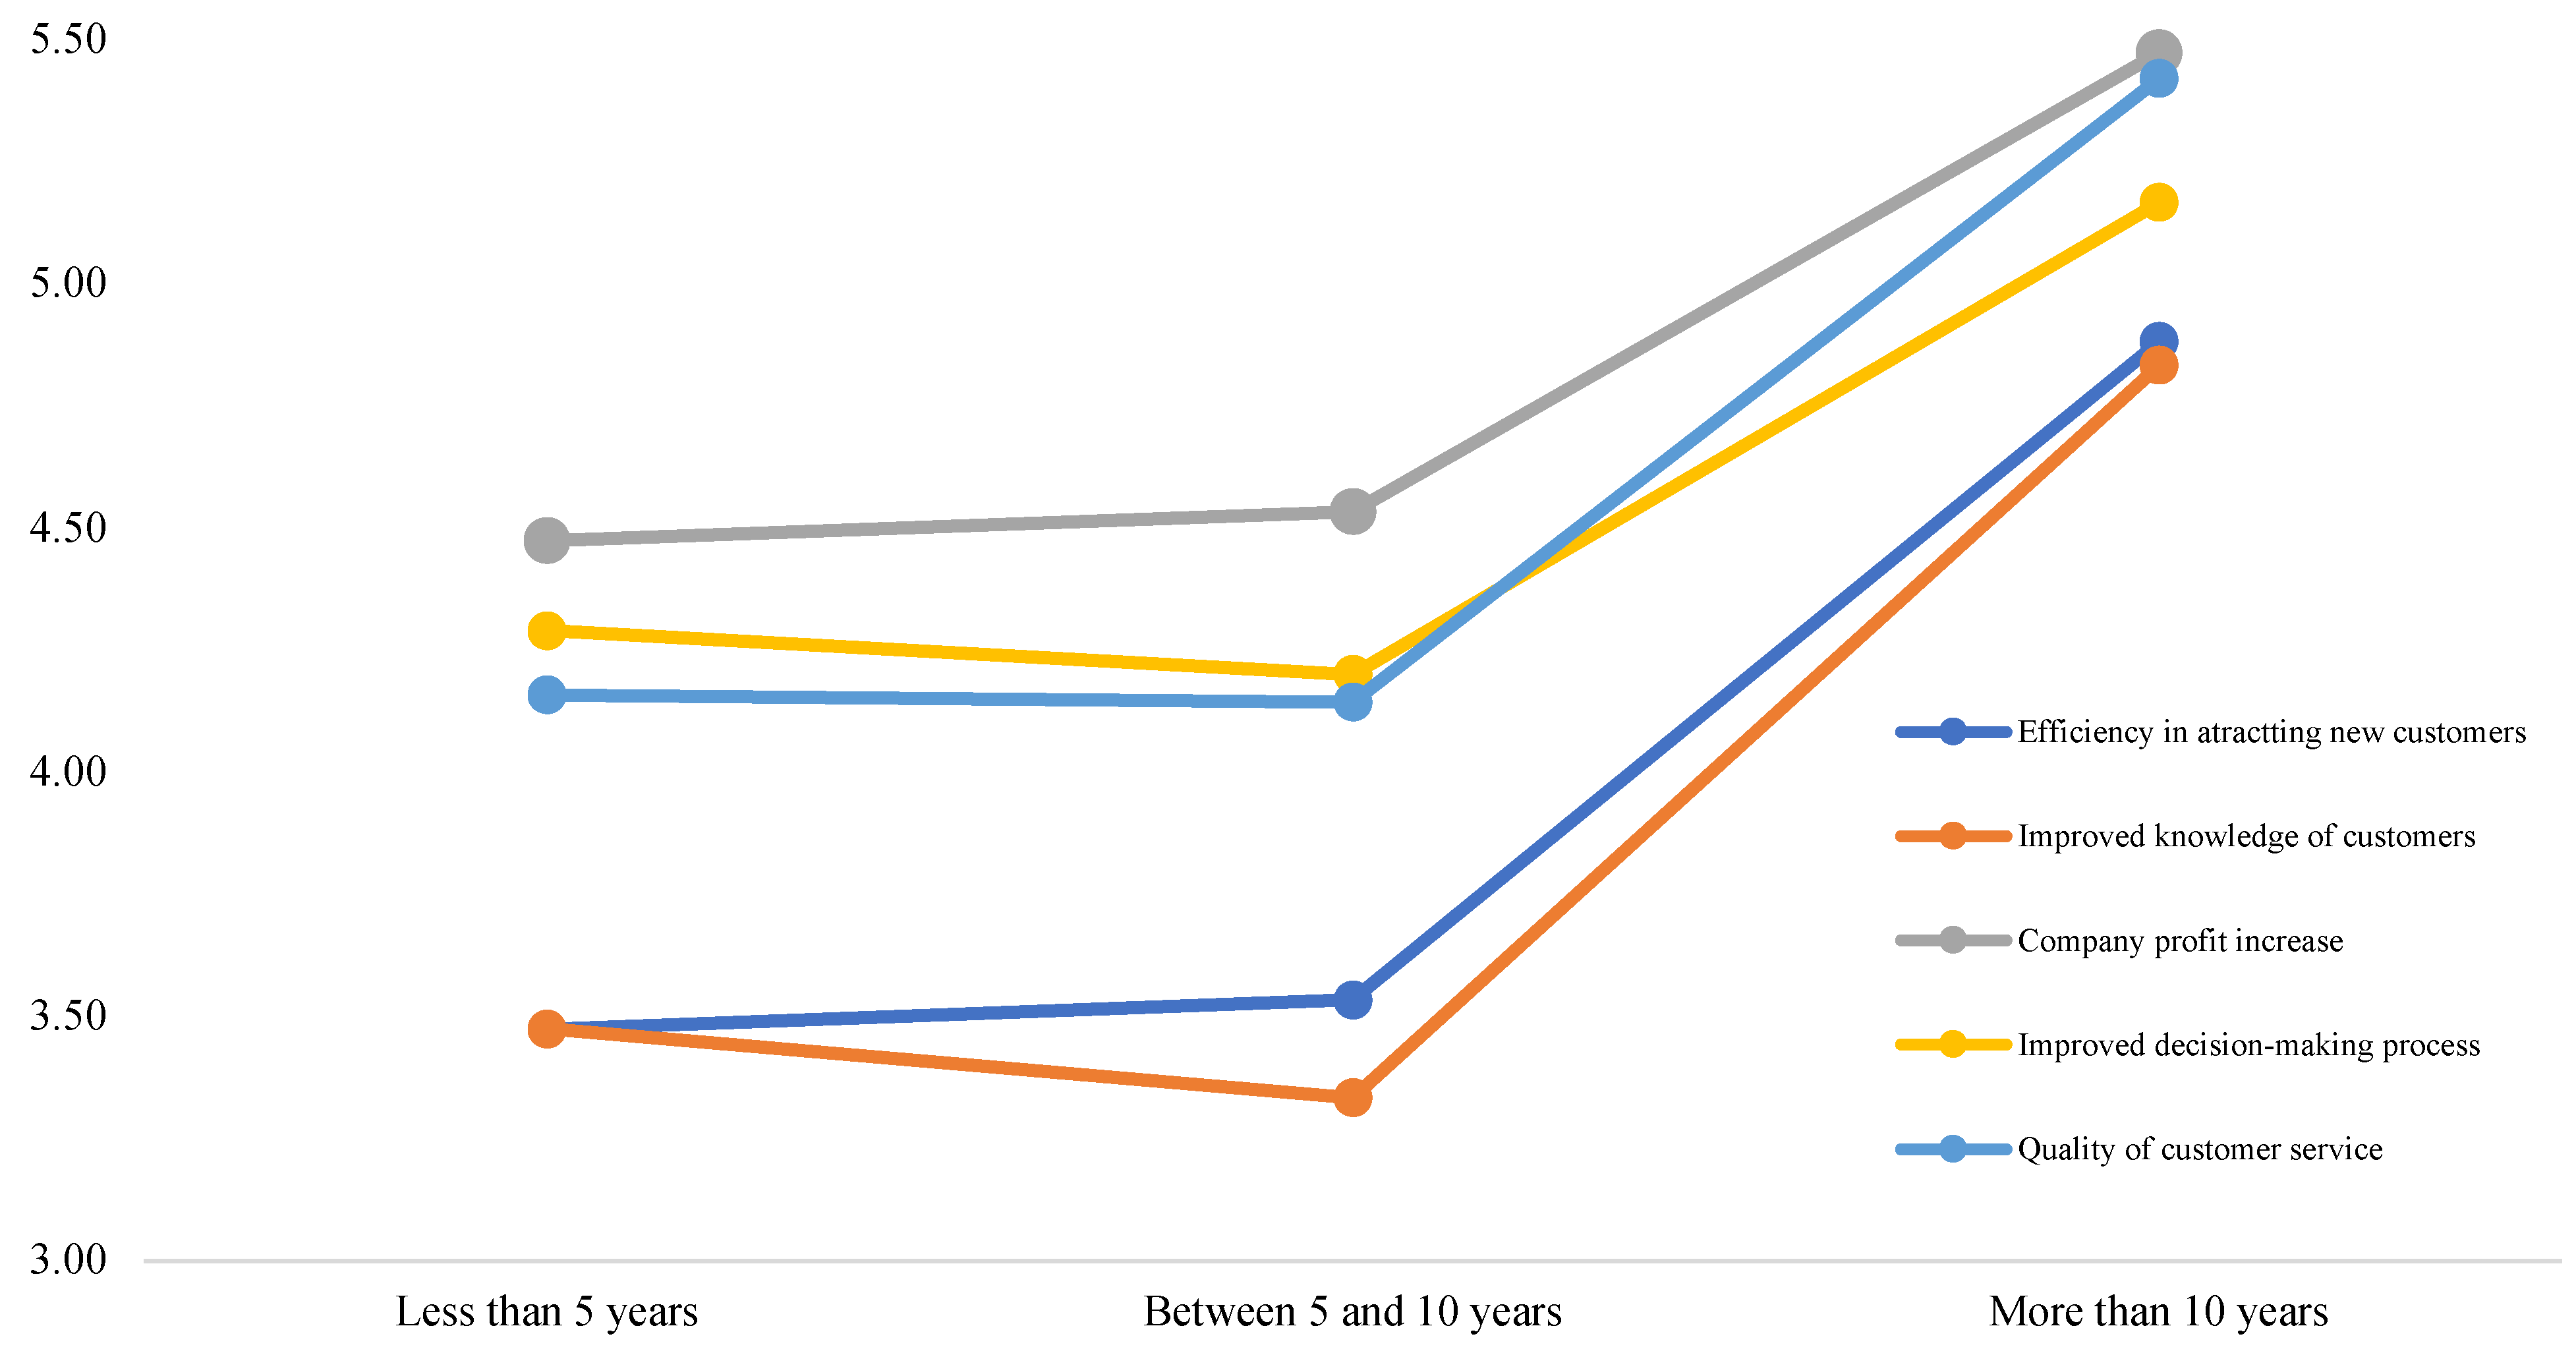
The strengths identified in this study are “Support from the company’s management”, with the highest score (89.86%) being considered the most important factor for the successful implementation of the Lean philosophy. “Efficient communication between employees” (85.96%) is the second most relevant factor, according to respondents. The item “Highly competent employees” presented a lower score of 74%. Regarding causes that intensify these internal forces, the increase in productivity and improvement in the process were the ones that stood out the most in the study. They were given the highest rating by most participants (a mode of 6). The company’s evaluation, greater flexibility, increased company profit, and improvement in the decision-making process are other factors that also scored well, with a median and mode of 5.
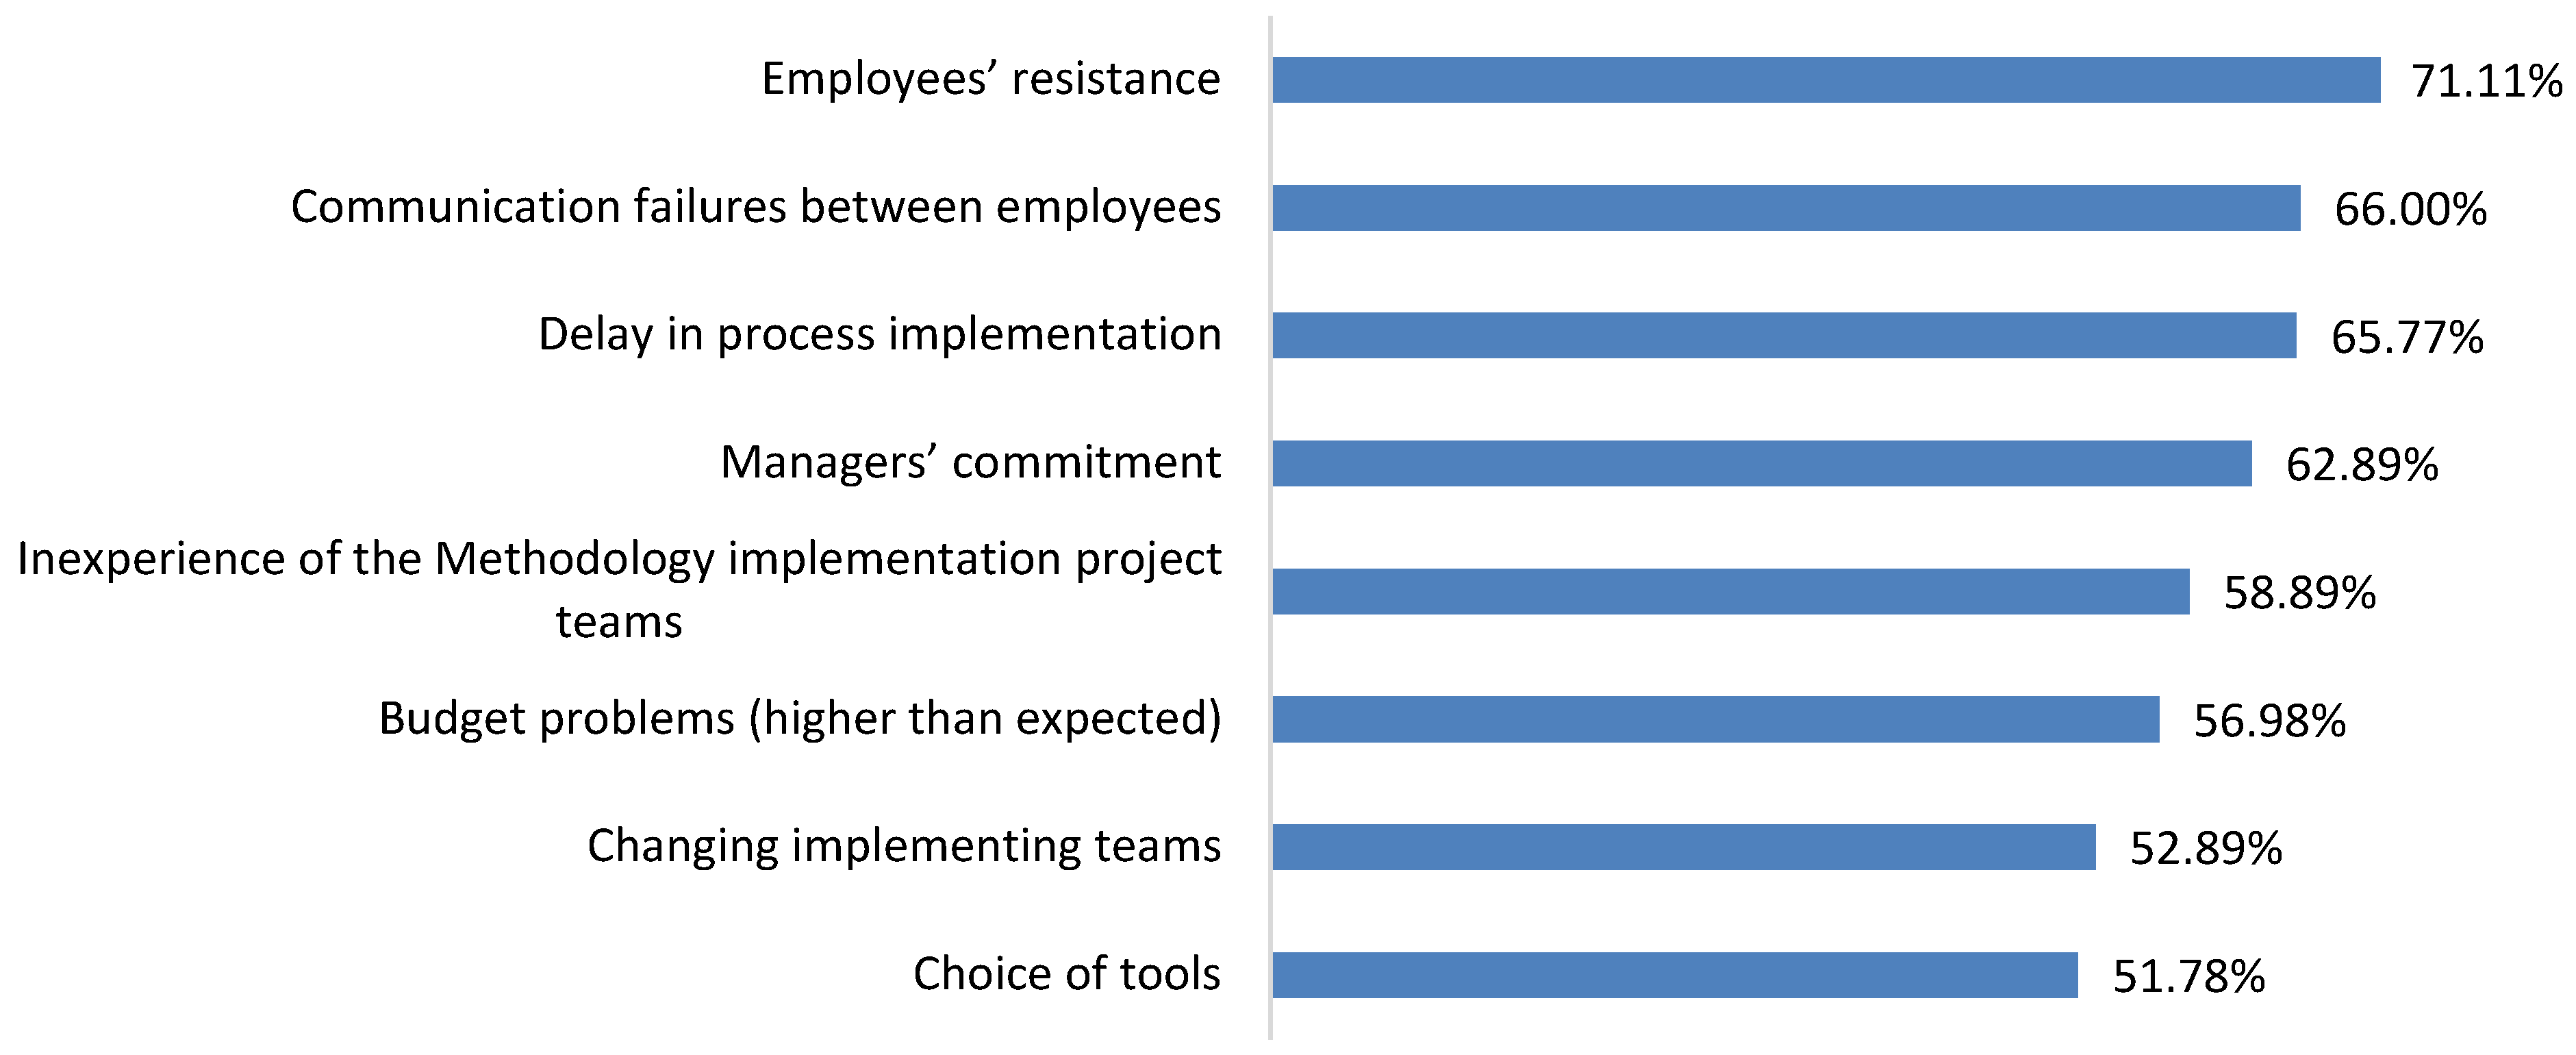
The main weakness indicated by the respondents in the questionnaire was the employees’ resistance to the change process, with a score of 71.11%. Workers resist changing their behavioral patterns, which can be explained by the threat of unemployment. The lack of communication between employees and the delay in implementing the process were the second and third factors with a higher score. Another weakness is the commitment of managers, with a score of 62.89%. The good relationship between top management and its employees is relevant. “Choice of Tools” is considered an item of less difficulty in the implementation of the Lean philosophy (51.78%), preceded by the “Changing implementing teams”, with a score of 52.89%. The results of the non-parametric tests highlighted differences between LE and SMEs in terms of “Employee Resistance” and “Inexperience of the methodology implementation project team”, with SMEs being more negatively affected. Another factor in which differences were observed is management support. This is more relevant in companies that already have Lean implemented. The years of Lean practice are also revealed as one of the fundamental points for obtaining significant results. Finally, a realistic work plan and budget are essential factors for success, namely in the group of companies in which Lean has been practiced for the greatest number of years.
Opportunities—with the COVID-19 pandemic, companies were forced to restructure, making the necessary adaptations to leverage their core businesses. Sales companies became more digital to facilitate online shopping, with Amazon being the most distinguished. Other companies in the production sector, namely clothing, perfume, and wine manufacturing/processing companies, among others, changed their products in order to meet market needs (gloves, masks, etc.). There was an opportunity that was quickly recognized, and companies turned it into assets. The Lean application experience allows companies to turn detected weaknesses and threats into opportunities for improvement. The deeper the Lean philosophy is in an organization, the faster solutions to the problems are found [54].
As threats are external factors, the company has little control over them. The accumulated experience resulting from the application of Lean makes it possible to transform the detected weaknesses and threats into opportunities for improvement. The effects of threats, such as the emergence of competition, changes in norms, or other unforeseen events can be diminished, increasing strengths (internal) and decreasing weaknesses (internal). It should be noted that flexibility and speed of response in an organization is essential to better help in times of need for change and in responding to threats [52].
With the recent economic crisis already disclosed by the European Commission, due to the COVID-19 pandemic, with a forecast of a recession of the Portuguese GDP of 9.8% in 2020, with the eurozone as a whole to fall 8.7% [72], it would make sense to study the effects of this same crisis on the implementation of Lean. Will companies strive to enter a new era of product development with Lean? Or will this opportunity be missed? Living in the Industry 4.0 era, the companies must be focused on the total digitization of physical assets and their integration into digital ecosystems with the various suppliers in the value chain. In [73], a survey is conducted on the challenges of Industry 4.0 in the automotive sector. The authors identify 36 challenges, grouped into four dimensions, i.e., Manufacturing Management (MM), Manufacturing Technology (MT), Manufacturing Strategy (MS), and Workforce & Organizational Management (WOM). The authors identify two pivotal dimensions that need to be considered in Industry 4.0 implementation, namely MT and WOM. Thus, the perfect moment to start applying Lean and move to Industry 4.0 is now!
According to a survey promoted by CIP (Confederation of the Portuguese Industry) and ISCTE’s (High School for Enterprises Sciences and Technologies) Marketing Future Cast Lab, about two-thirds of companies that diversified products and services in response to the pandemic will maintain the changes made in the future. The survey indicates that 19% of companies diversified their offer, especially in the industrial sector, and in 87% of these cases, they did so without recourse to public funding [69]. This flexibility that many companies are adopting may also be an indicator of the implementation of Lean Management.
The approach followed in the study may encourage Portuguese Industry practitioners who still have issues regarding the implementation of Lean or any other continuous improvement tool into their company, to be willing to take a step forward. This study also reviews the importance of the implementation of Industry 4.0 and how the continuous improvement methodologies, IoT, and CPS are crucial for a successful execution. The practitioners must to perform a SWOT analysis for their company and plan their steps towards continuous improvement tools and Industry 4.0 integrations according to their companies’ prioritized weaknesses and threats. Thus, the current study has practical relevance.
From an academic point of view, the methodology used in the current study may provide new insights to future researchers on how to design studies in applications of continuous improvements and Industry 4.0 adoption from other perspectives.
The main limitation is to be able to have a significant sample to study. The companies are somewhat reluctant to reply to questionnaires from academia. This was frustrating and proved fruitless. The next step was to try to select the target audience using the social network of 224 professionals and companies, LinkedIn. Here, we received some replies, but in a total of 1045 messages and emails sent, we only received 119 responses (11.4%). This was a big limitation and was time consuming. In our opinion, though there have been substantial improvements, the need for a tighter relationship between academia and companies is imperative.
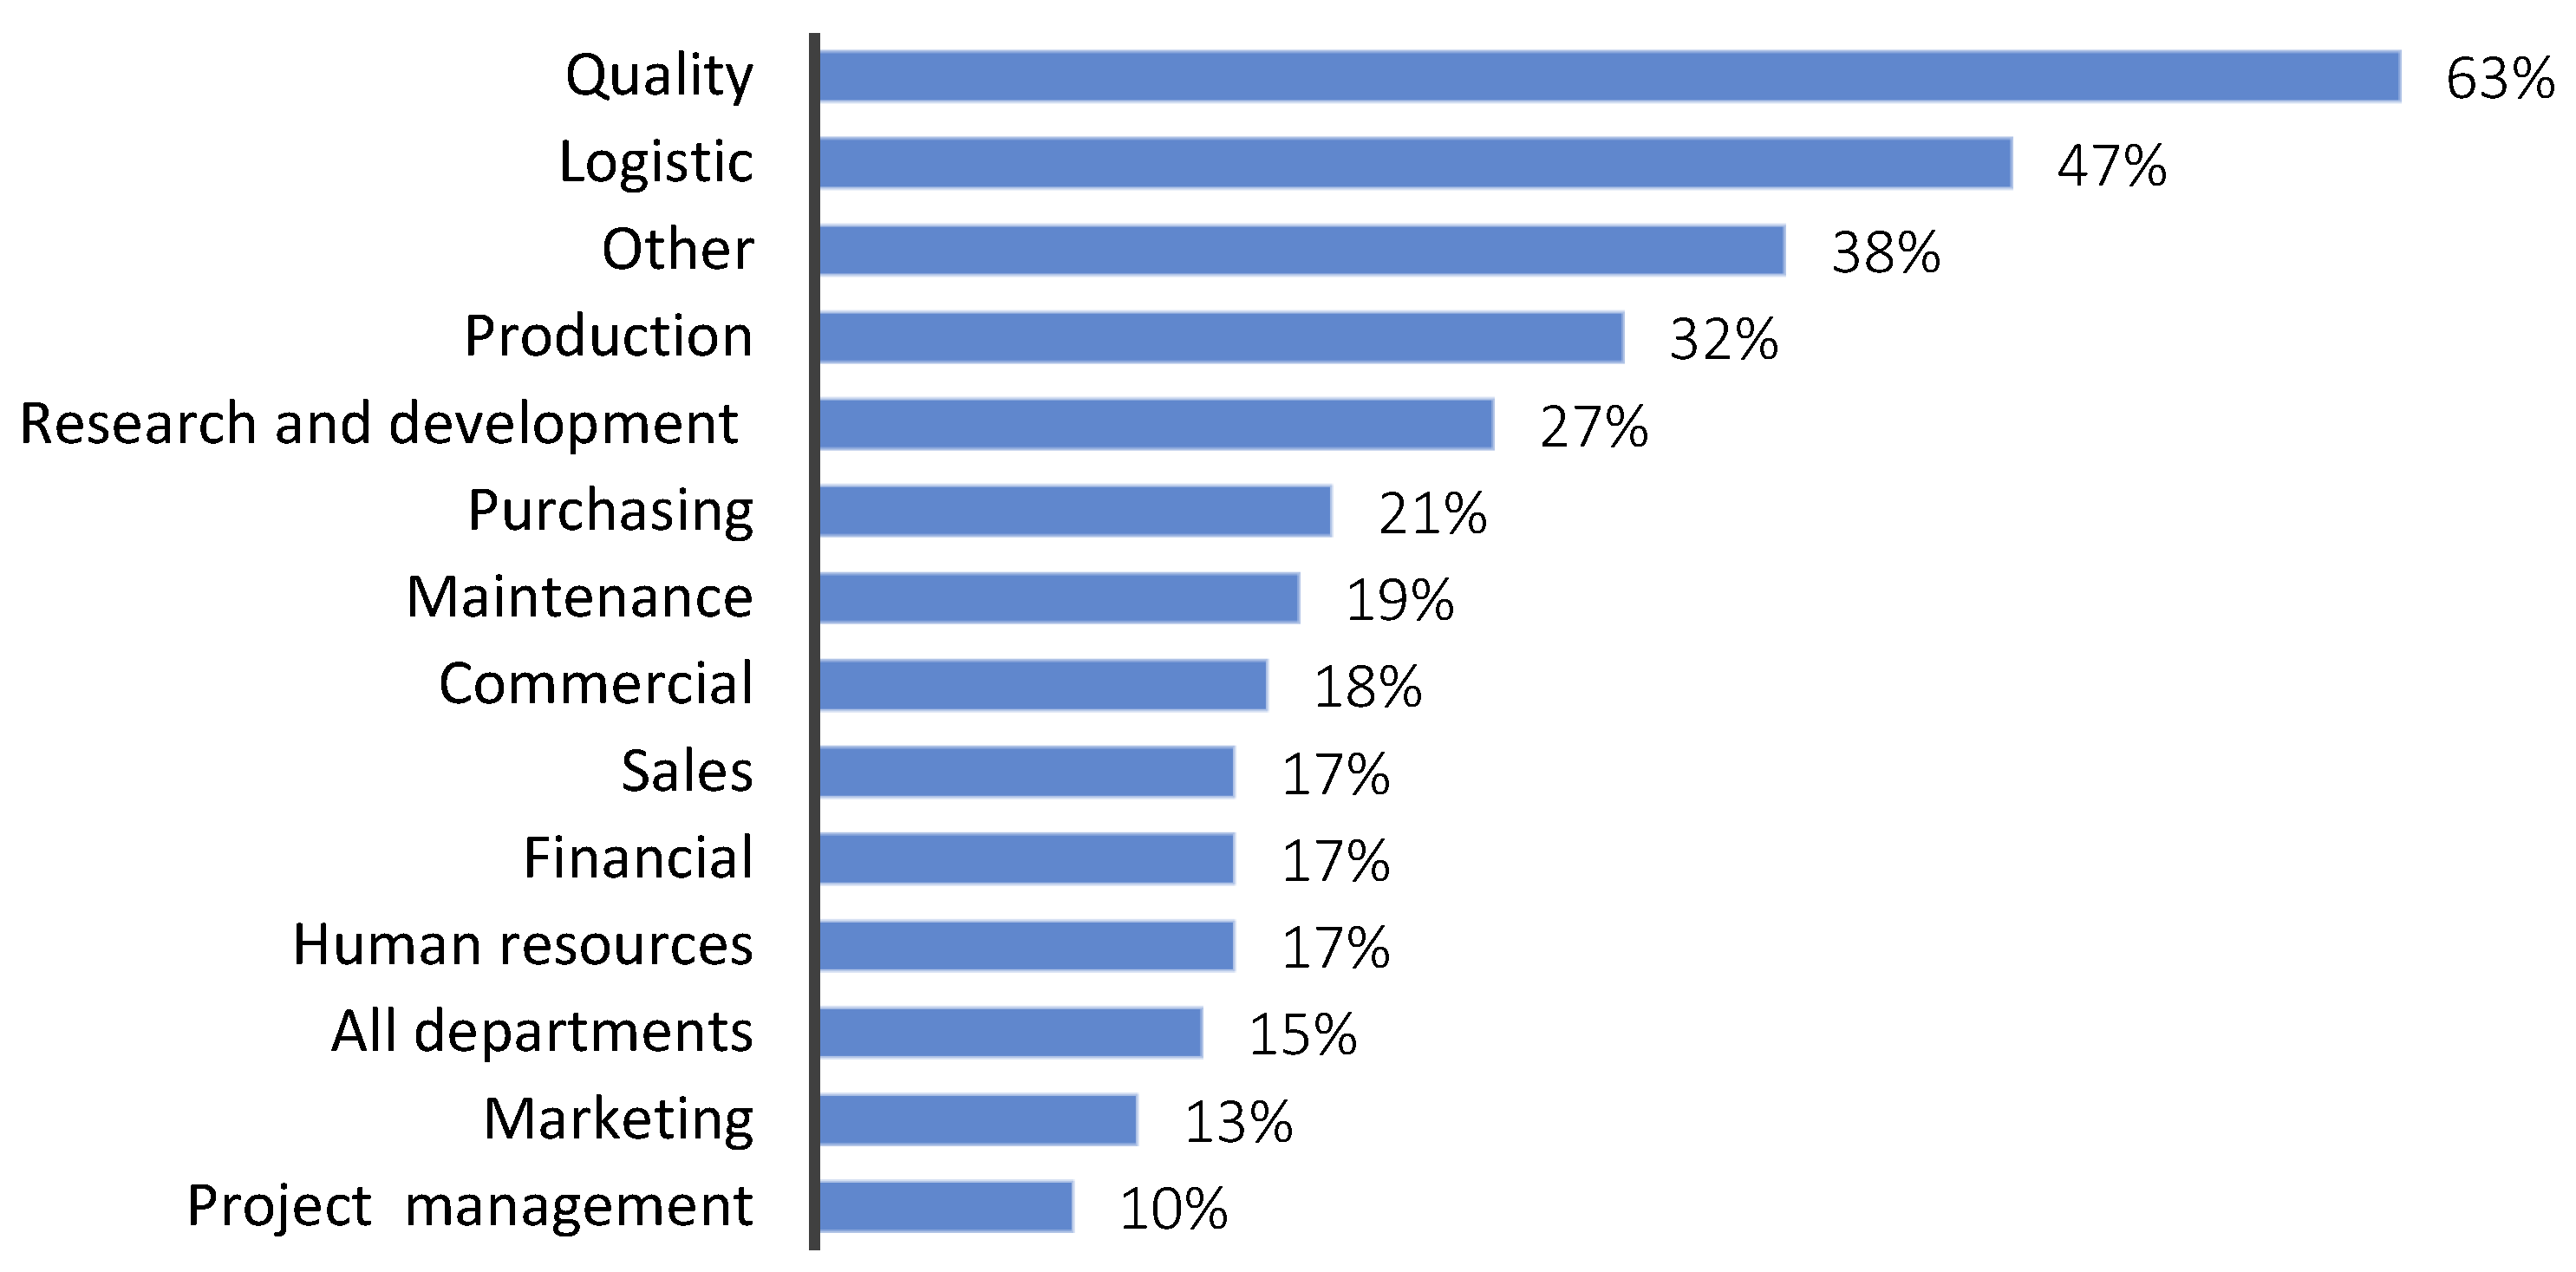
Future research will consider assessing the reasons associated with the implementation of Lean in certain departments of the companies, thereby belittling others, shown empirically to be adequate for it. The performed analysis reveals that Lean is applied only in certain sectors, which irretrievably entails the loss of its potential as a whole. Other future research questions may consider the characterization of the implementation of Industry 4.0 in Portugal.

Author Contributions

All authors contributed equally for the paper. All authors have read and agreed to the published version of the manuscript.

Funding

The author CP was partially supported by CMUP, which is financed by national funds through FCT—Fundação para a Ciência e a Tecnologia, I.P., under the project with reference UIDB/00144/2020.

Institutional Review Board Statement

Not applicable.

Informed Consent Statement

Not applicable.

Data Availability Statement

The data presented in this study are available on request from the 923 corresponding author.

Acknowledgments

F.J.G.S. would like to thank INEGI Research Center due to its continuous support, namely to Jorge Seabra, as well as all remaining CETRIB/INEGI/LAETA teal.

Conflicts of Interest

The authors declare no conflict of interest.

References

  1. Hardcopf, R.; Liu, G.J.; Shah, R. Lean Production and Operational Performance: The Influence of Organizational Culture. Int. J. Prod. Econ. 2021, 235, 108060. [Google Scholar] [CrossRef]
  2. Blume, S.; Herrmann, C.; Thiede, S. Increasing Resource Efficiency of Manufacturing Systems Using a Knowledge-Based System. Procedia CIRP 2018, 69, 236–241. [Google Scholar] [CrossRef]
  3. Womack, J.P.; Jones, D.T.; Roos, D. The Machine That Changed the World; Simon & Schuster: New York, NY, USA, 1990. [Google Scholar]
  4. Rodrigues, J.; Sá, J.C.; Silva, F.J.G.; Ferreira, L.P.; Jimenez, G.; Santos, G. A Rapid Improvement Process through “Quick-Win” Lean Tools: A Case Study. Systems 2020, 8, 55. [Google Scholar] [CrossRef]
  5. Elkhairi, A.; Fedouaki, F.; El Alami, S. Barriers and Critical Success Factors for Implementing Lean Manufacturing in SMEs. IFAC-PapersOnLine 2019, 52, 565–570. [Google Scholar] [CrossRef]
  6. Alhuraish, I.; Robledo, C.; Kobi, A. A Comparative Exploration of Lean Manufacturing and Six Sigma in Terms of Their Critical Success Factors. J. Clean. Prod. 2017, 164, 325–337. [Google Scholar] [CrossRef]
  7. Cherrafi, A.; Garza-Reyes, J.A.; Belhadi, A.; Kamble, S.S.; Elbaz, J. A Readiness Self-Assessment Model for Implementing Green Lean Initiatives. J. Clean. Prod. 2021, 309, 127401. [Google Scholar] [CrossRef]
  8. Vasanthakumar, C.; Vinodh, S.; Vishal, A.W. Application of Analytical Network Process for Analysis of Product Design Characteristics of Lean Remanufacturing System: A Case Study. Clean Technol. Environ. Policy 2017, 19, 971–990. [Google Scholar] [CrossRef]
  9. Costa, T.; Silva, F.J.G.; Pinto Ferreira, L. Improve the Extrusion Process in Tire Production Using Six Sigma Methodology. Procedia Manuf. 2017, 13, 1104–1111. [Google Scholar] [CrossRef]
  10. Cai, W.; Lai, K.-h.; Liu, C.; Wei, F.; Ma, M.; Jia, S.; Jiang, Z.; Lv, L. Promoting Sustainability of Manufacturing Industry through the Lean Energy-Saving and Emission-Reduction Strategy. Sci. Total Environ. 2019, 665, 23–32. [Google Scholar] [CrossRef] [PubMed]
  11. Alves, A.C.; Ferreira, A.C.; Maia, L.C.; Leão, C.P.; Carneiro, P. A Symbiotic Relationship between Lean Production and Ergonomics: Insights from Industrial Engineering Final Year Projects. Int. J. Ind. Eng. Manag. 2019, 10, 243–256. [Google Scholar] [CrossRef]
  12. Brito, M.; Vale, M.; Leão, J.; Ferreira, L.P.; Silva, F.J.G.; Gonçalves, M.A. Lean and Ergonomics Decision Support Tool Assessment in a Plastic Packaging Company. Procedia Manuf. 2020, 51, 613–619. [Google Scholar] [CrossRef]
  13. Pinto, B.; Silva, F.J.G.; Costa, T.; Campilho, R.D.S.G.; Pereira, M.T. A Strategic Model to Take the First Step towards Industry 4.0 in SMEs. Procedia Manuf. 2019, 38, 637–645. [Google Scholar] [CrossRef]
  14. Vinodh, S.; Antony, J.; Agrawal, R.; Douglas, J.A. Integration of Continuous Improvement Strategies with Industry 4.0: A Systematic Review and Agenda for Further Research. TQM J. 2021, 33, 441–472. [Google Scholar] [CrossRef]
  15. Rosa, C.; Silva, F.J.G.; Ferreira, L.P. Improving the Quality and Productivity of Steel Wire-Rope Assembly Lines for the Automotive Industry. Procedia Manuf. 2017, 11, 1035–1042. [Google Scholar] [CrossRef]
  16. Rosa, C.; Silva, F.J.G.; Ferreira, L.P.; Campilho, R. SMED Methodology: The Reduction of Setup Times for Steel Wire-Rope Assembly Lines in the Automotive Industry. Procedia Manuf. 2017, 13, 1034–1042. [Google Scholar] [CrossRef]
  17. Antoniolli, I.; Guariente, P.; Pereira, T.; Ferreira, L.P.; Silva, F.J.G. Standardization and Optimization of an Automotive Components Production Line. Procedia Manuf. 2017, 13, 1120–1127. [Google Scholar] [CrossRef]
  18. Nakajima, S. Introduction to TPM: Total Productive Maintenance; Productivity Press: Boca Raton, FL, USA, 1988. [Google Scholar]
  19. Sivaraman, P.; Nithyanandhan, T.; Lakshminarasimhan, S.; Manikandan, S.; Saifudheen, M. Productivity Enhancement in Engine Assembly Using Lean Tools and Techniques. Mater. Today Proc. 2020, 33, 201–207. [Google Scholar] [CrossRef]
  20. Jia Yuik, C.; Puvanasvaran, P. Development of Lean Manufacturing Implementation Framework in Machinery and Equipment SMEs. Int. J. Ind. Eng. Manag. 2020, 11, 157–169. [Google Scholar] [CrossRef]
  21. Pinto, G.; Silva, F.J.G.; Fernandes, N.O.; Casais, R.; Baptista, A.; Carvalho, C. Implementing a Maintenance Strategic Plan Using TPM Methodology. Int. J. Ind. Eng. Manag. 2020, 11, 192–204. [Google Scholar] [CrossRef]
  22. Klašnja, N.; Sremčev, N.; Vukelić, D.; Simeunović, N.; Lazarević, M. Optimization of Cable Harness Assembly Systems Based on Lean Concept Application. Int. J. Ind. Eng. Manag. 2019, 10, 115–123. [Google Scholar] [CrossRef]
  23. Correia, D.; Silva, F.J.G.; Gouveia, R.M.; Pereira, T.; Ferreira, L.P. Improving Manual Assembly Lines Devoted to Complex Electronic Devices by Applying Lean Tools. Procedia Manuf. 2018, 17, 663–671. [Google Scholar] [CrossRef]
  24. Neves, P.; Silva, F.J.G.; Ferreira, L.P.; Pereira, T.; Gouveia, A.; Pimentel, C. Implementing Lean Tools in the Manufacturing Process of Trimmings Products. Procedia Manuf. 2018, 17, 696–704. [Google Scholar] [CrossRef]
  25. Martins, M.; Godina, R.; Pimentel, C.; Silva, F.J.G.; Matias, J.C.O. A Practical Study of the Application of SMED to Electron-Beam Machining in Automotive Industry. Procedia Manuf. 2018, 17, 647–654. [Google Scholar] [CrossRef]
  26. Zhou, J.; He, P.; Qin, Y.; Ren, D. A Selection Model Based on SWOT Analysis for Determining a Suitable Strategy of Prefabrication Implementation in Rural Areas. Sustain. Cities Soc. 2019, 50, 101715. [Google Scholar] [CrossRef]
  27. Rocha, M.S.R.; Caldeira-Pires, A. Environmental Product Declaration Promotion in Brazil: SWOT Analysis and Strategies. J. Clean. Prod. 2019, 235, 1061–1072. [Google Scholar] [CrossRef]
  28. Cui, J.; Allan, A.; Lin, D. SWOT Analysis and Development Strategies for Underground Pedestrian Systems. Tunn. Undergr. Sp. Technol. 2019, 87, 127–133. [Google Scholar] [CrossRef]
  29. Phadermrod, B.; Crowder, R.M.; Wills, G.B. Importance-Performance Analysis Based SWOT Analysis. Int. J. Inf. Manage. 2019, 44, 194–203. [Google Scholar] [CrossRef] [Green Version]
  30. Sodhi, H.S.; Singh, D.; Singh, B.J. SWOT Analysis of Waste Management Techniques Quantitatively. Int. J. Adv. Oper. Manag. 2020, 12, 103–121. [Google Scholar] [CrossRef]
  31. Abu, F.; Gholami, H.; Saman, M.Z.M.; Zakuan, N.; Sharif, S.; Streimikiene, D. Pathways of Lean Manufacturing in Wood and Furniture Industries: A Bibliometric and Systematic Review. Eur. J. Wood Wood Prod. 2021, 79, 753–772. [Google Scholar] [CrossRef]
  32. Tomioka, A.M.; de Souza Leite, J.; Neves, J.M.S.; Silva, M.L.P. A Filosofia Lean Na Indústria Brasileira: Revisão Da Literatura. Braz. J. Dev. 2020, 6, 11823–11843. [Google Scholar] [CrossRef] [Green Version]
  33. De, D.; Chowdhury, S.; Dey, P.K.; Ghosh, S.K. Impact of Lean and Sustainability Oriented Innovation on Sustainability Performance of Small and Medium Sized Enterprises: A Data Envelopment Analysis-Based Framework. Int. J. Prod. Econ. 2020, 219, 416–430. [Google Scholar] [CrossRef]
  34. Mishra, R.P.; Chakraborty, A. Strengths, Weaknesses, Opportunities and Threats Analysis of Lean Implementation Frameworks. Int. J. Lean Enterp. Res. 2014, 1, 162. [Google Scholar] [CrossRef]
  35. Moreira, F.J.T. Estudo Da Implementação Da Filosofia Lean Na Indústria Portuguesa (In Portuguese). Master’s Thesis, School of Engineering, Polytechnic of Porto, Porto, Portugal, 2011. [Google Scholar]
  36. Kumar, M.; Antony, J.; Douglas, A. Does Size Matter for Six Sigma Implementation? Findings from the Survey in UK SMEs. Total Qual. Manag. 2009, 21, 623–635. [Google Scholar] [CrossRef]
  37. Pinheiro, L.M.P.; De Toledo, J.C. Aplicação Da Abordagem Lean No Processo de Desenvolvimento de Produto: Um Survey Em Empresas Industriais Brasileiras. Gest. Prod. 2016, 23, 320–332. [Google Scholar] [CrossRef]
  38. Livermore, J.A. Factors That Significantly Impact the Implementation of an Agile Software Development Methodology. J. Softw. 2008, 3, 31–36. [Google Scholar] [CrossRef] [Green Version]
  39. Zahraee, S.M. A Survey on Lean Manufacturing Implementation in a Selected Manufacturing Industry in Iran. Int. J. Lean Six Sigma 2016, 7, 136–148. [Google Scholar] [CrossRef]
  40. Madariaga, L.; Nussbaum, M.; Burq, I.; Marañón, F.; Salazar, D.; Maldonado, L.; Alarcón, C.; Naranjo, M.A. Online Survey: A National Study with School Principals. Comput. Human Behav. 2017, 74, 35–44. [Google Scholar] [CrossRef]
  41. Gill, F.J.; Leslie, G.D.; Grech, C.; Latour, J.M. Using a Web-Based Survey Tool to Undertake a Delphi Study: Application for Nurse Education Research. Nurse Educ. Today 2013, 33, 1322–1328. [Google Scholar] [CrossRef]
  42. Mircioiu, C.; Atkinson, J. A Comparison of Parametric and Non-Parametric Methods Applied to a Likert Scale. Pharmacy 2017, 5, 26. [Google Scholar] [CrossRef]
  43. Field, A. Discovering Statistics Using IBM SPSS Statistics, 4th ed.; Carmichael, M., Ed.; Sage Publications Ltd.: Thousand Oaks, CA, USA, 2013. [Google Scholar] [CrossRef]
  44. Jasiulewicz-Kaczmarek, M. SWOT Analysis for Planned Maintenance Strategy-a Case Study. IFAC-PapersOnLine 2016, 49, 674–679. [Google Scholar] [CrossRef]
  45. Economia Finanças. Definição de Grande Empresa, Média Empresa, Pequena Empresa e Microempresa (In Portuguese). Available online: https://economiafinancas.com/2016/definicao-grande-media-pequena-microempresa (accessed on 13 June 2020).
  46. Alves, A.C.; Dinis-Carvalho, J.; Sousa, R.M.; Moreira, F.; Lima, R.M. Benefits of Lean Management: Results Form Some Industrial Cases in Portugal. In 6 Congresso Luso-Moçambicano de Engenharia (CLME’2011); Edições INEGI: Porto, Portugal, 2011; p. 9. [Google Scholar]
  47. Stoller, J.K. A Perspective on the Educational “SWOT” of the Coronavirus Pandemic. Chest 2021, 159, 743–748. [Google Scholar] [CrossRef]
  48. Liker, J. The Toyota Way: Fourteen Management Principles from the World’s Greatest Manufacturer; McGraw-Hill: New York, NY, USA, 2004. [Google Scholar]
  49. Teixeira, P.; Sá, J.C.; Silva, F.J.G.; Ferreira, L.P.; Santos, G.; Fontoura, P. Connecting Lean and Green with Sustainability towards a Conceptual Model. J. Clean. Prod. 2021, 322, 129047. [Google Scholar] [CrossRef]
  50. Ribeiro, P.; Sá, J.C.; Ferreira, L.P.; Silva, F.J.G.; Pereira, M.T.; Santos, G. The Impact of the Application of Lean Tools for Improvement of Process in a Plastic Company: A Case Study. Procedia Manuf. 2019, 38, 765–775. [Google Scholar] [CrossRef]
  51. Gay, C. 8 Wastes of Lean Manufacturing. Available online: https://www.machinemetrics.com/blog/8-wastes-of-lean-manufacturing (accessed on 27 June 2021).
  52. Schonberger, R.J. Japanese Production Management: An Evolution—With Mixed Success. Pap. Knowl. Towar. Media Hist. Doc. 2007, 25, 403–419. [Google Scholar] [CrossRef]
  53. Wu, Y.C. Lean Manufacturing: A Perspective of Lean Suppliers. Int. J. Oper. Prod. Manag. 2003, 23, 1349–1376. [Google Scholar] [CrossRef]
  54. Liker, J.; Hoseus, M. Toyota Culture: The Heart and Soul of the Toyota Way; McGraw-Hill: New York, NY, USA, 2008. [Google Scholar]
  55. Parkes, A. Cultural Conditioning of Lean Management in Great Britain. J. Contemp. Manag. 2016, 15, 49–65. [Google Scholar]
  56. Bhasin, S. An Appropriate Change Strategy for Lean Sucess. Manag. Decis. 2012, 50, 439–458. [Google Scholar] [CrossRef]
  57. Gupta, G.; Mishra, R.P. A SWOT Analysis of Reliability Centered Maintenance Framework. J. Qual. Maint. Eng. 2016, 22, 130–145. [Google Scholar] [CrossRef]
  58. Mutingi, M.; Monageng, R.; Mbohwa, C. Lean Healthcare Implementation in Southern Africa: A SWOT Analysis. Lect. Notes Eng. Comput. Sci. 2015, 2218, 866–869. [Google Scholar]
  59. Eswaramoorthi, M.; Kathiresan, G.R.; Prasad, P.S.S.; Mohanram, P.V. A Survey on Lean Practices in Indian Machine Tool Industries. Int. J. Adv. Manuf. Technol. 2011, 52, 1091–1101. [Google Scholar] [CrossRef]
  60. Drew, J.; McCallum, B.; Roggenhofer, S. Journey to Lean: Making Operational Change Stick; Springer: Berlin/Heidelberg, Germany, 2016. [Google Scholar]
  61. Jacobs, F.R.; Weston, F.C.T. Enterprise Resource Planning (ERP)-A Brief History. J. Oper. Manag. 2007, 25, 357–363. [Google Scholar] [CrossRef]
  62. Dalton, J. Gemba Walks. In Great Big Agile; Apress: Berkeley, CA, USA, 2019; pp. 173–174. [Google Scholar] [CrossRef]
  63. Faria, L.M. COVID-19. Fortuna de Jeff Bezos Aumentou 23.6 mil milhões com a Pandemia (In Portuguese). Available online: https://expresso.pt/coronavirus/2020-04-16-COVID-19.-Fortuna-de-Jeff-Bezos-aumentou-236-mil-milhoes-com-a-pandemia (accessed on 14 June 2020).
  64. Diário de Notícias. Batas protectoras da Zara já chegaram a hospitais (In Portuguese). Available online: https://www.dn.pt/dinheiro/-batas-protectoras-da-zara-ja-chegaram-a-hospitais-12120973.html (accessed on 27 June 2021).
  65. Catarino, A. Produtores de vinho fazem gel desinfetante para hospital de Beja (In Portuguese). Available online: https://www.tsf.pt/portugal/sociedade/produtores-de-vinho-fazem-gel-desinfetante-para-hospital-de-beja-12028081.html (accessed on 22 July 2020).
  66. Pinheiro, S. COVID 19: Antes a Nortempresa fazia perfume, agora produz gel desinfectante (In Portuguese). Available online: https://www.publico.pt/2020/04/08/impar/noticia/COVID-19-nortempresa-fazia-perfume-produz-gel-desinfectante-1911541 (accessed on 26 June 2021).
  67. Rane, A.B.; Sunnapwar, V.K.; Rane, S. Strategies to Overcome the HR Barriers in Successful Lean Implementation. Int. J. Procure. Manag. 2016, 9, 223–247. [Google Scholar] [CrossRef]
  68. Prasad, S.; Khanduja, D.; Sharma, S.K. Integration of SWOT Analysis with Hybrid Modified TOPSIS for the Lean Strategy Evaluation. Proc. Inst. Mech. Eng. Part B J. Eng. Manuf. 2018, 232, 1295–1309. [Google Scholar] [CrossRef]
  69. Jiang, R.; Mao, C.; Hou, L.; Wu, C.; Tan, J. A SWOT Analysis for Promoting Off-Site Construction under the Backdrop of China’s New Urbanisation. J. Clean. Prod. 2018, 173, 225–234. [Google Scholar] [CrossRef]
  70. Achanga, P.; Shehab, E.; Roy, R.; Nelder, G. Critical Success Factors for Lean Implementation within SMEs. J. Manuf. Technol. Manag. 2006, 17, 460–471. [Google Scholar] [CrossRef]
  71. Shook, J. How to Change a Culture: Lessons From NUMMI. MIT Sloan Manag. Rev. 2010, 51, 63–68. [Google Scholar]
  72. CIP. Comunicados De Imprensa CIP (In Portuguese). Available online: http://cip.org.pt/:http://cip.org.pt/COVID-19-informacoes-as-empresas (accessed on 14 July 2020).
  73. Wankhede, V.A.; Vinodh, S. Analysis of Industry 4.0 Challenges Using Best Worst Method: A Case Study. Comput. Ind. Eng. 2021, 159, 107487. [Google Scholar] [CrossRef]
Figure 1. Lean application by department.
Sustainability 14 01929 g001
Figure 2. Lean tools and continuous improvement methodologies applied in companies.
Sustainability 14 01929 g002
Figure 3. Factors supporting successful Lean implementation.
Sustainability 14 01929 g003
Figure 4. Results of Lean implementation.
Sustainability 14 01929 g004
Figure 5. Mean values of “significant results” by Lean practice time (Likert scale 1–6).
Sustainability 14 01929 g005
Figure 6. Difficulties experienced in Lean implementation.
Sustainability 14 01929 g006
Table 1. Number of employees and turnover (M€).
Employees<22–1010–50>50Don’t Know/ReplyTOTAL
1–92.04%0.00%3.06%0.00%0.00%5.10%
10–492.04%5.10%7.14%0.00%4.08%18.36%
50–2490.00%8.16%15.31%2.04%1.02%26.53%
≥2500.00%1.02%7.14%29.59%11.22%48.97%
TOTAL4.08%14.28%32.65%31.63%16.32%98.96% *
* Validated responses.
Table 2. Factors that prevent Lean implementation.
Factors that Prevent Lean Implementation%
Company management41
The current system works and we don’t need Lean28
Lean implementation is currently planned24
Human resources have no mindset or culture17
Financial resources3
Service company, this need not having been identified3
Management’s ignorance of its existence3
I have no idea3
Table 3. Stage of Lean implementation per number of years of implementation.
Years of Lean ImplementationInitialIntermediateAdvancedTOTAL
Less than 5 years20.90%29.85%8.96%59.71%
Between 5 and 10 years2.99%8.96%7.46%19.41%
More than 10 years1.49%5.97%10.45%17.91%
TOTAL25.38%44.78%26.87%97.03% *
* Validated responses.
Table 4. Stage of Lean implementation and classification of the company.
EmployeesInitialIntermediateAdvancedTOTAL
SME19.40%14.93%2.99%37.32%
LE5.98%29.85%25.37%61.20%
TOTAL25.38%44.78%28.36%98.52% *
* Validated responses.
Table 5. PME/LE vs National/International.
NationalInternationalTOTAL
SME28.35%10.45%38.80%
LE14.93%46.27%61.20%
TOTAL43.28%56.72%100%
Table 6. Lean progression stage by sector of activity.
InitialIntermediateAdvancedTOTAL
Secondary14.93%28.36%17.91%61.20%
Tertiary8.96%14.93%7.46%31.34%
Mixed1.49%1.49%2.99%5.97%
TOTAL25.38%44.78%28.36%98.52% *
* Validated responses.
Table 7. Classification of important factors contributing to successful Lean implementation.
FactorsMedianModeMeanStandard Deviation
Support from the company’s Management665.391.10
Good team in the project execution phase565.161.06
Choosing the right Lean tool565.131.04
Highly competent employees554.931.12
Appropriate training of employees and cultural change554.691.16
Efficient communication between employees554.681.10
Realistic work plan and budget554.681.21
Comprehensive knowledge of the company’s reality554.441.03
Table 8. Classification of the Lean implementation results.
ResultsMedianModeMeanStandard Deviation
Improvement in process quality564.921.24
Increased productivity564.891.24
Quality of customer service554.761.18
Increased visibility of the company554.631.24
Greater flexibility554.531.30
Improved decision-making process554.531.31
Company profit increase554.501.25
Improved customer retention554.261.32
Creating custom products or services443.861.37
Improved knowledge of customers443.841.37
Efficiency in attracting new customers443.831.41
Table 9. Main difficulties experienced in Lean implementation.
DifficultiesScore (%)MedianModeMeanStandard Deviation
Employees’ resistance71.11%554.271.28
Communication failures between employees66.00%453.961.35
Delay in process implementation65.77%453.951.28
Managers’ commitment62.89%453.771.43
Inexperience of the methodology implementation project teams58.89%443.531.42
Budget problems (higher than expected)56.98%333.421.31
Changing implementing teams52.89%333.171.46
Choice of tools51.78%343.111.26
Publisher’s Note: MDPI stays neutral with regard to jurisdictional claims in published maps and institutional affiliations.

