
Empowering Local Practitioners to Collect and Report on Anthropogenic Riverine and Marine Debris Using Inexpensive Methods in India

 ,
,  , ,
, ,  , , , , and
Abstract
:1. Introduction
2. Literature Review
3. Materials and Methods
4. Results
4.1. Debris Collection
4.2. Brand Audit
4.3. Workshop
5. Discussion
Supplementary Materials
Author Contributions
Funding
Institutional Review Board Statement
Informed Consent Statement
Data Availability Statement
Acknowledgments
Conflicts of Interest
Appendix A

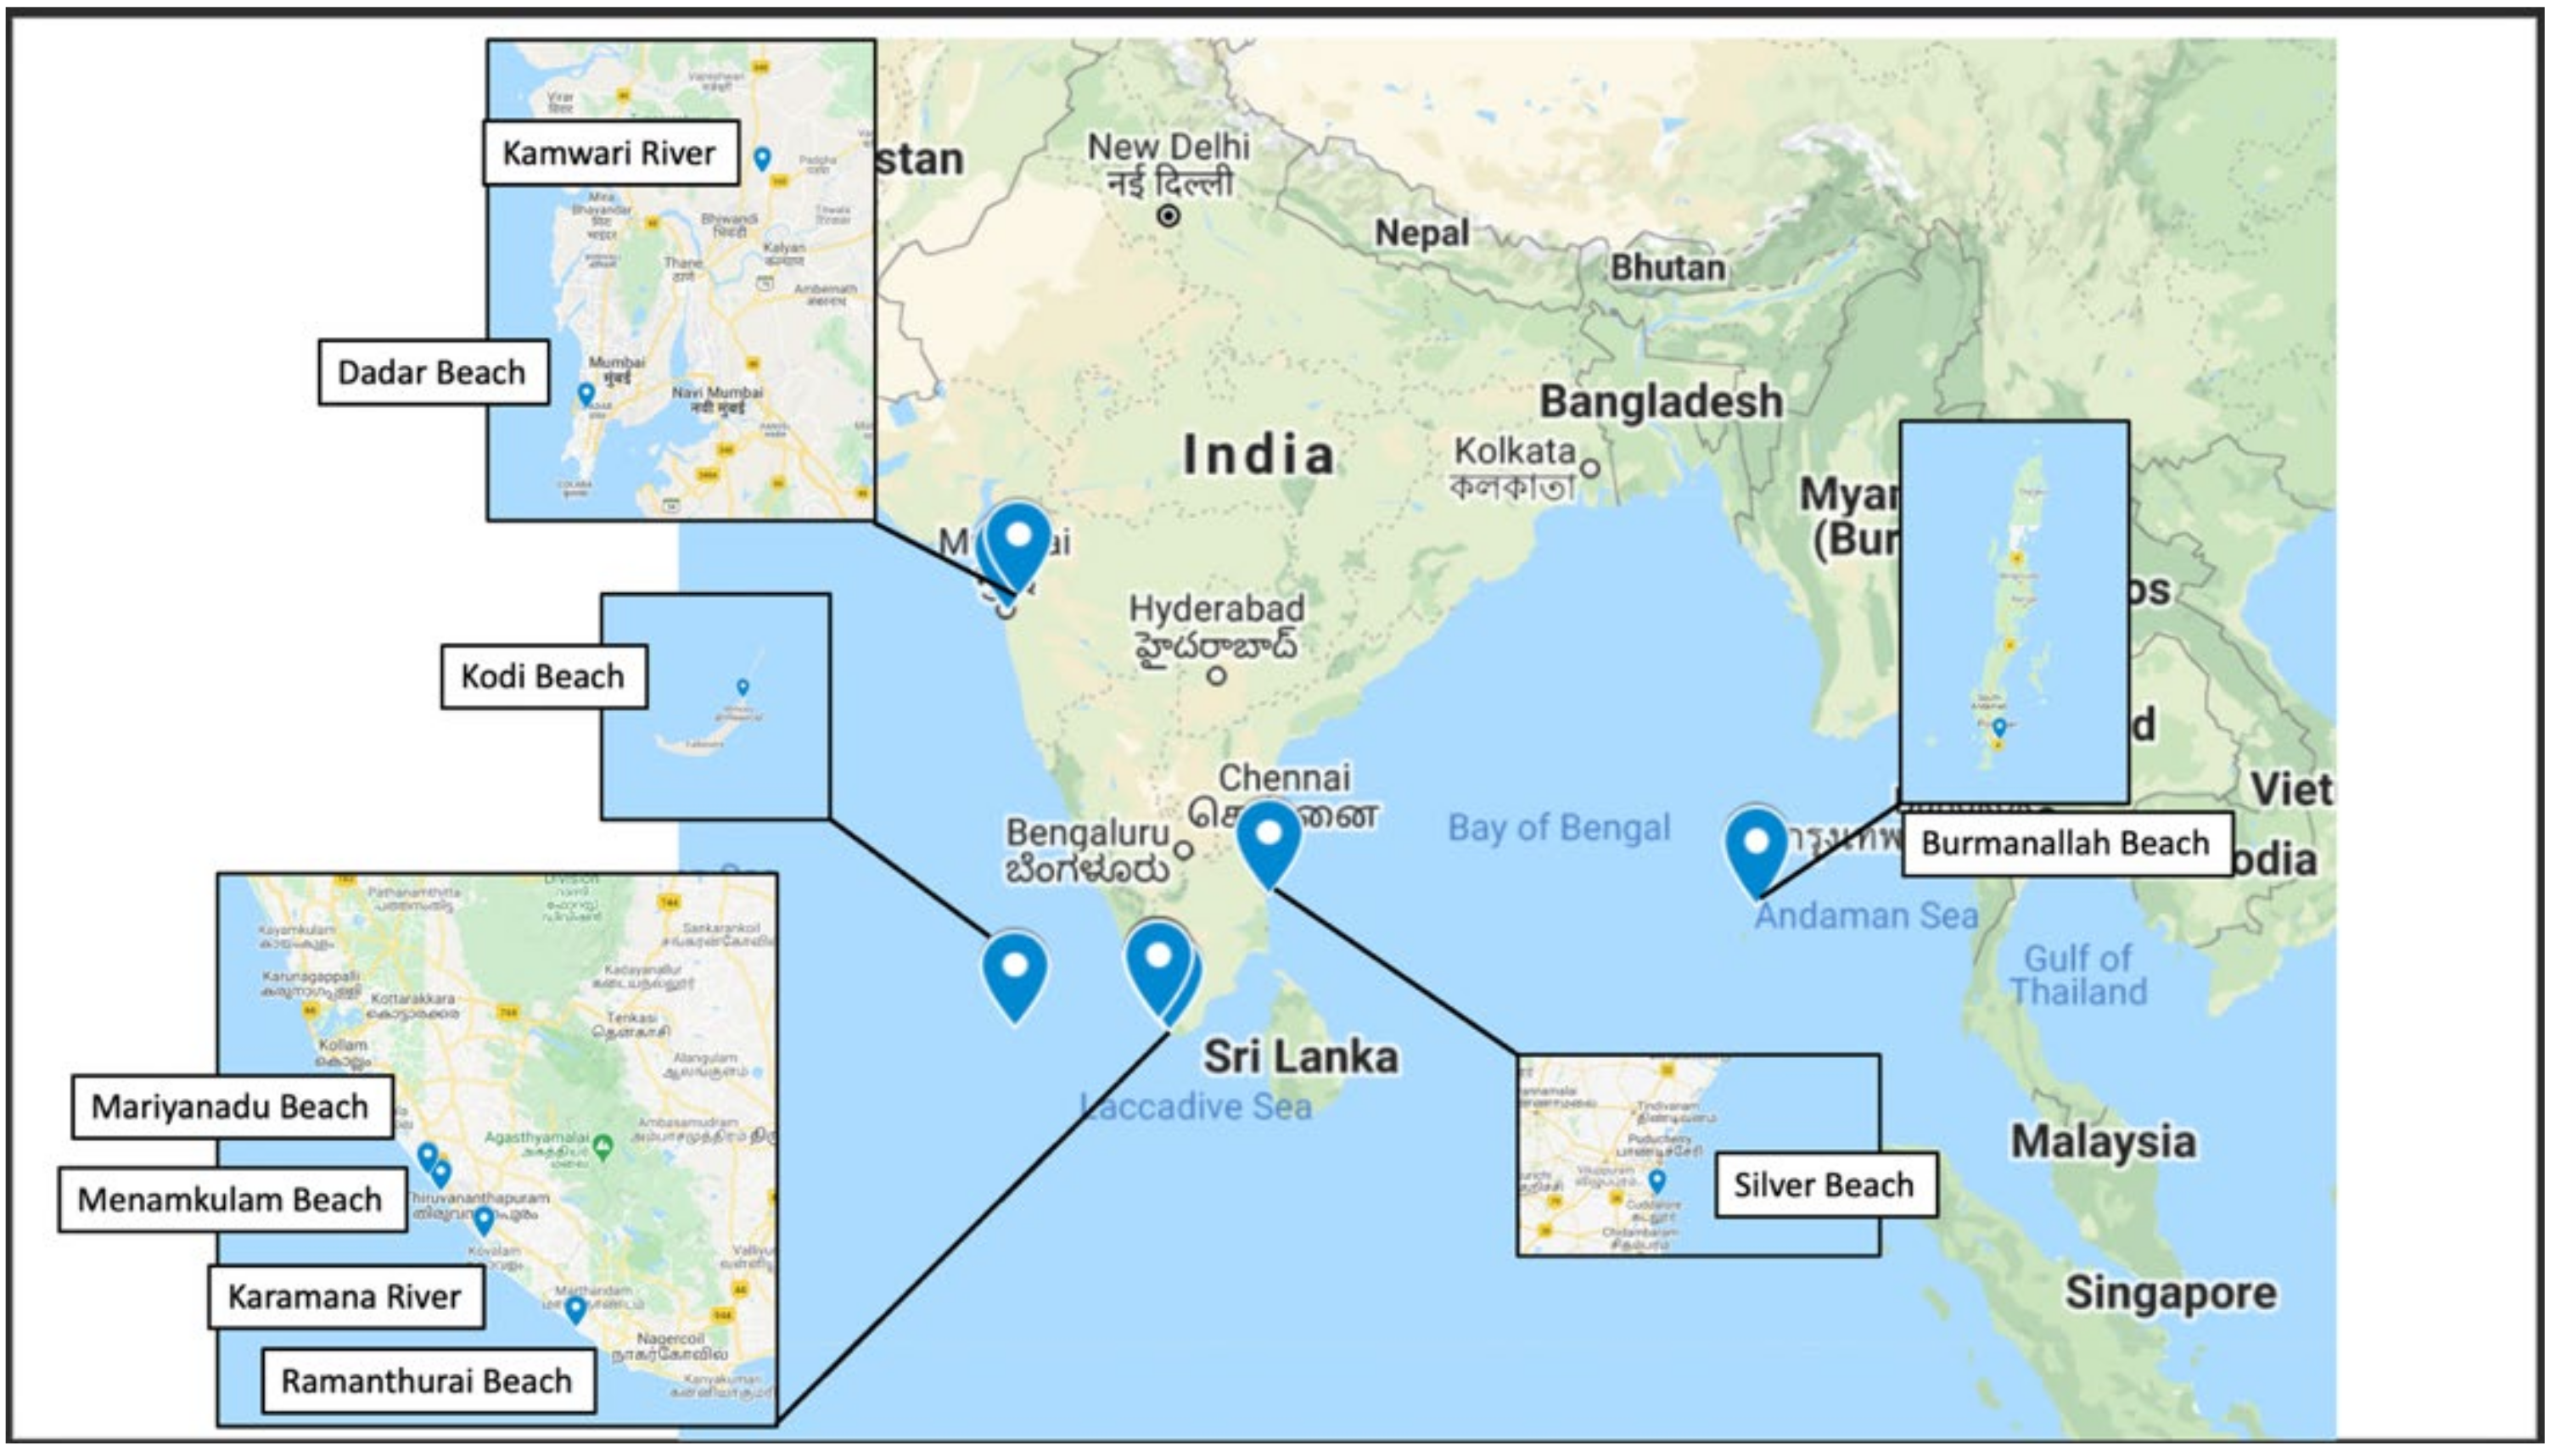
| Menamkulam Beach March | Menamkulam Beach June | Karamana River | Kodi Beach | Burmanallah Beach | Silver Beach | Ramanthurai Beach | Dadar Beach | Kamwari River | Mariyanadu Beach | |||||||||||
|---|---|---|---|---|---|---|---|---|---|---|---|---|---|---|---|---|---|---|---|---|
| Tally | Weight (kg) | Tally | Weight (kg) | Tally | Weight (kg) | Tally | Weight (kg) | Tally | Weight (kg) | Tally | Weight (kg) | Tally | Weight (kg) | Tally | Weight (kg) | Tally | Weight (kg) | Tally | Weight (kg) | |
| PLASTIC | ||||||||||||||||||||
| Hard plastic fragments | 564 | 0.90 | 206 | 26.41 | 3880 | 4.61 | 214 | 7.35 | 18 | 0.08 | 149 | 0.67 | 87 | 1.64 | 3 | 0.03 | ||||
| Foam plastic fragments | 1593 | 0.55 | 2112 | 1.75 | 138 | 1.34 | 101 | 2.46 | 14 | 8.40 | 47 | 0.85 | 29 | 0.06 | 18 | 0.32 | 1060 | 0.42 | ||
| Film plastic fragments | 1838 | 1.75 | 1836 | 8.87 | 404 | 6.35 | 1848 | 9.27 | 281 | 7.00 | 263 | 0.70 | 56 | 0.18 | 11 | 0.14 | 22 | 0.03 | ||
| Food wrappers 1 | 133 | 3.63 | 90 | 0.37 | 725 | 30.80 | 7 | 0.06 | 8 | 0.02 | 33 | 0.08 | 6 | 0.02 | ||||||
| Beverage bottles | 38 | 1.75 | 217 | 10.91 | 191 | 5.77 | 32 | 0.66 | 912 | 49.80 | 2 | 0.01 | 13 | 0.37 | 11 | 1.28 | 17 | 0.65 | ||
| Other jugs or containers | 15 | 0.23 | 38 | 0.67 | 9 | 1.52 | 70 | 14.80 | 3 | 0.02 | 13 | 0.20 | ||||||||
| Bottle or container caps | 203 | 0.80 | 353 | 2.40 | 151 | 0.31 | 351 | 0.91 | 2 | 0.00 | 19 | 0.05 | 20 | 0.15 | 10 | 0.03 | ||||
| Cigar tips | 113 | 0.01 | 1 | 0.00 | ||||||||||||||||
| Cigarettes | 183 | 0.25 | 45 | 0.16 | 13 | 0.00 | 1 | |||||||||||||
| Cigarette lighters | 2 | 0.02 | 5 | 0.08 | 3 | 0.04 | 1 | 0.01 | 1 | 0.00 | 1 | 0.15 | ||||||||
| Bags 2 | 127 | 2.01 | 145 | 7.83 | 2 | 0.02 | 13 | 0.30 | 12 | 1.60 | 14 | 0.24 | ||||||||
| Plastic rope and small net pieces | 778 | 0.55 | 185 | 2.93 | 8 | 0.08 | 1644 | 6.20 | 75 | 29.50 | 517 | 0.97 | 3 | 0.01 | 8 | 0.18 | 2 | 0.32 | ||
| Buoys and floats | 8 | 0.15 | 8 | 0.13 | 6 | 4.20 | 4 | 0.87 | 2 | 0.15 | 7 | 0.08 | ||||||||
| Fishing lures and lines | 4 | 0.06 | 13 | 20.40 | 12 | 0.05 | 3 | 0.30 | 7 | 0.05 | ||||||||||
| Cups (including foamed plastics) | 16 | 0.25 | 74 | 1.17 | 20 | 11.33 | 1 | 0.00 | 18 | 0.08 | 2 | 0.03 | ||||||||
| Plastic utensils | 16 | 0.02 | 3 | 0.05 | 8 | 0.02 | 6 | 0.03 | ||||||||||||
| Straws | 30 | 0.02 | 113 | 1.25 | 9 | 0.041 | 187 | 0.05 | 3 | 0.01 | 7 | 0.00 | 1 | 0.00 | ||||||
| Balloons | 9 | 0.01 | 8 | 0.13 | 1 | 0.00 | 6 | 0.00 | ||||||||||||
| Personal care products | 14 | 0.11 | 3 | 0.05 | 19 | 0.27 | 18 | 0.19 | 14 | 3.00 | 3 | 0.26 | 13 | 0.13 | 1 | 0.00 | ||||
| Other 3 | 83 | 0.52 | 488 | 5.57 | 56 | 5.02 | 1857 | 10.98 | 65 | 2.00 | 3 | 0.01 | 113 | 0.54 | 21 | 0.05 | ||||
| METAL | ||||||||||||||||||||
| Aluminum/tin cans | 1 | 0.59 | 297 | 28.40 | 1 | 0.02 | ||||||||||||||
| Aerosol cans | 1 | 0.05 | ||||||||||||||||||
| Metal fragments | 51 | 1.06 | 2 | 0.02 | 19 | 0.01 | 6 | 0.12 | 2 | 0.02 | ||||||||||
| Aluminum foil | 44 | 0.02 | 57 | 0.04 | 4 | 0.01 | 1 | 0.00 | ||||||||||||
| Other 4 | 59 | 0.25 | 111 | 1.75 | 173 | 0.49 | 3 | 0.01 | ||||||||||||
| GLASS | ||||||||||||||||||||
| Beverage bottles and jars | 48 | 13.85 | 49 | 12.23 | 24 | 12.37 | 90 | 26.50 | 10 | 1.45 | 13 | 3.50 | 2 | 0.85 | ||||||
| Glass fragments | 115 | 1.82 | 15 | 19 | 0.38 | 1 | 0.01 | 5 | 0.01 | 17 | 0.44 | 17 | 0.17 | |||||||
| Other 5 | 11 | 0.17 | 3 | 0.094 | 29 | 2.50 | ||||||||||||||
| RUBBER | ||||||||||||||||||||
| Gloves | 1 | 0.01 | 1 | 0.0005 | 1 | 0.01 | ||||||||||||||
| Rubber fragments | 10 | 9.36 | 25 | 0.70 | 15 | 0.03 | 6 | 0.11 | ||||||||||||
| Rubber bands | 31 | 0.01 | 3 | 0.0012 | 8 | 0.003 | 4 | 0.01 | 2 | 0.00 | 6 | 0.02 | 5 | 0.00 | ||||||
| Other 6 | 7 | 0.13 | 1 | 0.005 | 1 | 0.00 | 27 | 1.25 | ||||||||||||
| PROCESSED TREES | ||||||||||||||||||||
| Cardboard | 517 | 0.70 | 1 | 0.06 | 2 | 0.01 | 3 | 0.55 | ||||||||||||
| Paper 7 | 135 | 0.06 | 6 | 0.01 | 18 | 0.01 | 18 | 0.07 | 23 | 0.15 | 90 | 0.35 | ||||||||
| Paper bags | 4 | 0.01 | 5 | 0.03 | ||||||||||||||||
| Lumber/building materials | 161 | 0.55 | 103 | 1.63 | 31 | 1.56 | 0 | 0.00 | ||||||||||||
| Popsicle sticks | 4 | 0.06 | 0 | 0.00 | ||||||||||||||||
| Matchsticks 8 | 8 | 0.001 | 4 | 0.002 | 1 | 0.001 | ||||||||||||||
| Cigarette packets | 30 | 0.40 | 32 | 0.51 | 18 | 0.17 | 2 | 0.04 | 1 | 0.01 | ||||||||||
| Incense sticks | 7 | 0.01 | 22 | 0.02 | ||||||||||||||||
| Other 9 | 89 | 0.15 | 1 | 3.92 | 3 | 0.01 | 15 | 0.71 | ||||||||||||
| CLOTH, FABRIC, SHOES | ||||||||||||||||||||
| Clothing | 41 | 2.85 | 15 | 0.24 | 25 | 7.84 | 272 | 4.98 | 4 | 0.96 | 9 | 0.12 | 11 | 3.80 | ||||||
| Shoes including flip flops | 54 | 9.71 | 19 | 2.55 | 36 | 5.72 | 64 | 20.20 | 3 | 0.66 | 1 | 0.22 | 5 | 0.46 | ||||||
| Towels or rags | 7 | 1.22 | 1 | 0.83 | 3 | 0.18 | 3 | 1.45 | ||||||||||||
| Non-plastic rope or net pieces | 4 | 0.23 | 0 | 0.00 | 9 | 0.20 | ||||||||||||||
| Other 10 | 2 | 0.03 | 2 | 0.78 | 761 | 3.06 | 3 | 0.09 | 5 | 1.40 | 1 | 0.03 | ||||||||
| NATURAL MATERIALS LEFT BY HUMANS | ||||||||||||||||||||
| Ceremonial flowers | 210 | 1.45 | 30 | 0.13 | ||||||||||||||||
| Herb bunches | 70 | 0.37 | 7 | 0.00 | 12 | 0.03 | ||||||||||||||
| Coconut | 1 | 0.02 | 411 | 15.42 | 8 | 0.25 | 15 | 2.86 | 3 | 0.08 | ||||||||||
| Coir | 1 | 0 | 0.00 | 11 | 0.10 | |||||||||||||||
| Banana leaf | 4 | 0.02 | 6 | 0.17 | 2 | 1.50 | ||||||||||||||
| Other 11 | 8 | 0.05 | 105 | 0.70 | 159 | 0.68 | 42 | 0.07 | ||||||||||||
| MIXED AND OTHER MATERIALS 12 | ||||||||||||||||||||
| 3 | 0.09 | 9 | 0.09 | 14 | 3.59 | 54 | 9.90 | 115 | 12.00 | 35 | 0.11 | 165 | 2.84 | 17 | 0.19 | 20 | 0.67 | |||
References
- Barnes, D.K.; Galgani, F.; Thompson, R.C.; Barlaz, M. Accumulation and fragmentation of plastic debris in global environments. Philos. Trans. R. Soc. B Biol. Sci. 2009, 364, 1985–1998. [Google Scholar] [CrossRef] [PubMed] [Green Version]
- Chen, C.L. Regulation and management of marine litter. In Marine Anthropogenic Litter; Bergmann, M., Gutow, L., Klages, M., Eds.; Springer Nature: New York, NY, USA, 2015; pp. 395–428. [Google Scholar]
- Derraik, J.G. The pollution of the marine environment by plastic debris: A review. Mar. Pollut. Bull. 2002, 44, 842–852. [Google Scholar] [CrossRef]
- Gregory, M.R. Environmental implications of plastic debris in marine settings—Entanglement, ingestion, smothering, hangers-on, hitch-hiking and alien invasions. Philos. Trans. R. Soc. B Biol. Sci. 2009, 364, 2013–2025. [Google Scholar] [CrossRef]
- Laist, D.W. Impacts of marine debris: Entanglement of marine life in marine debris including a comprehensive list of species with entanglement and ingestion records. In Marine Debris; Coe, J.M., Rogers, D.B., Eds.; Springer: New York, NY, USA, 1997; pp. 99–139. [Google Scholar]
- Lechner, A.; Keckeis, H.; Lumesberger-Loisl, F.; Zens, B.; Krusch, R.; Tritthart, M.; Glas, M.; Schludermann, E. The Danube so colourful: A potpourri of plastic litter outnumbers fish larvae in Europe’s second largest river. Environ. Pollut. 2014, 188, 177–181. [Google Scholar] [CrossRef] [Green Version]
- Li, W.C.; Tse, H.F.; Fok, L. Plastic waste in the marine environment: A review of sources, occurrence and effects. Sci. Total Environ. 2016, 566–567, 333–349. [Google Scholar] [CrossRef] [PubMed]
- Newman, S.; Watkins, E.; Farmer, A.; Ten Brink, P.; Schweitzer, J.P. The economics of marine litter. In Marine Anthropogenic Litter; Bergmann, M., Gutow, L., Klages, M., Eds.; Springer Nature: New York, NY, USA, 2015; pp. 367–394. [Google Scholar]
- Reynolds, C.; Ryan, P.G. Micro-plastic ingestion by waterbirds from contaminated wetlands in South Africa. Mar. Pollut. Bull. 2018, 126, 330–333. [Google Scholar] [CrossRef]
- Rochman, C.M. The complex mixture, fate and toxicity of chemicals associated with plastic debris in the marine environment. In Marine Anthropogenic Litter; Bergmann, M., Gutow, L., Klages, M., Eds.; Springer Nature: New York, NY, USA, 2015; pp. 117–140. [Google Scholar]
- Teuten, E.L.; Saquing, J.M.; Knappe, D.R.; Barlaz, M.A.; Jonsson, S.; Björn, A.; Rowland, S.J.; Thompson, R.C.; Galloway, T.S.; Yamashita, R.; et al. Transport and release of chemicals from plastics to the environment and to wildlife. Philos. Trans. R. Soc. B Biol. Sci. 2009, 364, 2027–2045. [Google Scholar] [CrossRef] [PubMed] [Green Version]
- Garcia de Oliveira, B.; Fang, M.M.; Lin, J. All hands on deck: Addressing the global marine plastics pollution crisis in Asia. Chin. J. Environ. Law 2009, 3, 11–46. [Google Scholar] [CrossRef] [Green Version]
- Jambeck, J.R.; Geyer, R.; Wilcox, C.; Siegler, T.R.; Perryman, M.; Andrady, A.; Narayan, R.; Law, K.L. Plastic waste inputs from land into the ocean. Science 2015, 347, 768–771. [Google Scholar] [CrossRef]
- Schmidt, C.; Krauth, T.; Wagner, S. Export of plastic debris by rivers into the sea. Environ. Sci. Technol. 2017, 51, 12246–12253. [Google Scholar] [CrossRef]
- Sridhar, K.R.; Deviprasad, B.; Karamchand, K.S.; Bhat, R. Plastic debris along the beaches of Karnataka, southwest coast of India. Asian J. Water Environ. Pollut. 2007, 6, 87–93. [Google Scholar]
- Kumar, A.A.; Sivakumar, R. Marine debris—The global problem least studied in India. Curr. Sci. 2016, 110, 1153. [Google Scholar]
- Blettler, M.C.; Abrial, E.; Khan, F.R.; Sivri, N.; Espinola, L.A. Freshwater plastic pollution: Recognizing research biases and identifying knowledge gaps. Water Res. 2018, 143, 416–424. [Google Scholar] [CrossRef] [Green Version]
- Willis, K.; Hardesty, B.D.; Kriwoken, L.; Wilcox, C. Differentiating littering, urban runoff and marine transport as sources of marine debris in coastal and estuarine environments. Sci. Rep. 2017, 7, 44479. [Google Scholar] [CrossRef] [PubMed] [Green Version]
- Vince, J.; Hardesty, B.D. Plastic pollution challenges in marine and coastal environments: From local to global governance. Restor. Ecol. 2017, 25, 123–128. [Google Scholar] [CrossRef]
- Blettler, M.C.; Wantzen, K.M. Threats underestimated in freshwater plastic pollution: Mini-review. Water Air Soil Pollut. 2019, 230, 174. [Google Scholar] [CrossRef]
- Islam, M.S. Perspectives of the coastal and marine fisheries of the Bay of Bengal, Bangladesh. Ocean Coast. Manag. 2003, 46, 763–796. [Google Scholar] [CrossRef]
- Kalnasa, M.L.; Lantaca, S.M.O.; Boter, L.C.; Flores, G.J.T.; Van Ryan Kristopher, R.G. Occurrence of surface sand microplastic and litter in Macajalar Bay, Philippines. Mar. Pollut. Bull. 2019, 149, 110521. [Google Scholar] [CrossRef]
- Bouwman, H.; Evans, S.W.; Cole, N.; Yive, N.S.C.K.; Kylin, H. The flip-or-flop boutique: Marine debris on the shores of St Brandon’s rock, an isolated tropical atoll in the Indian Ocean. Mar. Environ. Res. 2016, 114, 58–64. [Google Scholar] [CrossRef] [Green Version]
- Duhec, A.V.; Jeanne, R.F.; Maximenko, N.; Hafner, J. Composition and potential origin of marine debris stranded in the Western Indian ocean on remote Alphonse island, Seychelles. Mar. Pollut. Bull. 2015, 96, 76–86. [Google Scholar] [CrossRef]
- Nash, A.D. Impacts of marine debris on subsistence fishermen an exploratory study. Mar. Pollut. Bull. 1992, 24, 150–156. [Google Scholar] [CrossRef]
- McIlgorm, A.; Campbell, H.F.; Rule, M.J. The economic cost and control of marine debris damage in the Asia-Pacific region. Ocean Coast. Manag. 2011, 54, 643–651. [Google Scholar] [CrossRef]
- Ocean Conservancy and McKinsey Center for Business and Environment. The Ocean Conservancy: Stemming the Tide: Land-based Strategies for a Plastic-Free Ocean. Available online: https://www.mckinsey.com/business-functions/sustainability/our-insights/stemming-the-tide-land-based-strategies-for-a-plastic-free-ocean (accessed on 1 December 2019).
- Kaza, S.; Yao, L.; Bhada-Tata, P.; Van Woerden, F. What a Waste 2.0: A Global Snapshot of Solid Waste Management to 2050; World Bank Publications: Washington, DC, USA, 2018. [Google Scholar]
- Hoornweg, D.; Bhada-Tata, P. What a Waste: A Global Review of Solid Waste Management; World Bank: Washington, DC, USA, 2012; p. 116. [Google Scholar]
- Nigam, R.A.I.I.V. Plastic pellets on the Caranzalem beach sands, Goa, India. Mahasagar 1982, 15, 125–127. [Google Scholar]
- Dharani, G.; Abdul Nazar, A.K.; Venkatesan, R.; Ravindran, M. Marine debris in Great Nicobar. Curr. Sci. 2003, 85, 574. [Google Scholar]
- Reddy, M.S.; Basha, S.; Adimurthy, S.; Ramachandraiah, G. Description of the small plastics fragments in marine sediments along the Alang-Sosiya ship-breaking yard, India. Estuar. Coast. Shelf Sci. 2006, 68, 656–660. [Google Scholar] [CrossRef]
- Duraisamy, A.; Latha, S. Impact of pollution on marine environment—A case study of coastal Chennai. Indian J. Sci. Technol. 2011, 4, 259–262. [Google Scholar] [CrossRef]
- Ganesapandian, S.; Manikandan, S.; Kumaraguru, A.K. Marine litter in the northern part of Gulf of Mannar, southeast coast of India. Res. J. Environ. Sci. 2011, 5, 471–478. [Google Scholar]
- Kaladharan, P.; Vijayakumaran, K.; Singh, V.V.; Asha, P.S.; Sulochanan, B.; Asokan, P.K.; Valsala, K.K.; Veena, S.; Jayasankaran, L.; Bhint, H.M. Assessment of certain anthropogenic interventions and their impacts along the Indian coastline. Fish. Technol. 2012, 49, 32–37. [Google Scholar]
- Jayasiri, H.B.; Purushothaman, C.S.; Vennila, A. Plastic litter accumulation on high-water strandline of urban beaches in Mumbai, India. Environ. Monit. Assess. 2013, 185, 7709–7719. [Google Scholar] [CrossRef]
- Jayasiri, H.B.; Purushothaman, C.S.; Vennila, A. Quantitative analysis of plastic debris on recreational beaches in Mumbai, India. Mar. Pollut. Bull. 2013, 77, 107–112. [Google Scholar] [CrossRef]
- Sulochanan, B.; Bhat, G.S.; Lavanya, S.; Dineshbabu, A.P.; Kaladharan, P. A preliminary assessment of ecosystem process and marine litter in the beaches of Mangalore. Indian J. Geo-Mar. Sci. 2014, 43, 1764–1769. [Google Scholar]
- Veerasingam, S.; Mugilarasan, M.; Venkatachalapathy, R.; Vethamony, P. Influence of 2015 flood on the distribution and occurrence of microplastic pellets along the Chennai coast, India. Mar. Pollut. Bull. 2016, 109, 196–204. [Google Scholar] [CrossRef]
- Veerasingam, S.; Saha, M.; Suneel, V.; Vethamony, P.; Rodrigues, A.C.; Bhattacharyya, S.; Naik, B.G. Characteristics, seasonal distribution and surface degradation features of microplastic pellets along the Goa coast, India. Chemosphere 2016, 159, 496–505. [Google Scholar] [CrossRef]
- Kumar, A.; Sivakumar, R.; Reddy, Y.S.R.; Raja, B.; Nishanth, T.; Revanth, V. Preliminary study on marine debris pollution along Marina beach, Chennai, India. Reg. Stud. Mar. Sci. 2016, 5, 35–40. [Google Scholar]
- Kaladharan, P.; Vijayakumaran, K.; Singh, V.V.; Prema, D.; Asha, P.S.; Sulochanan, B.; Hemasankari, P.; Edward, L.L.; Padua, S.; Veena, S.; et al. Prevalence of marine litter along the Indian beaches: A preliminary account on its status and composition. J. Mar. Biol. Assoc. India 2017, 59, 19–24. [Google Scholar] [CrossRef]
- Sruthy, S.; Ramasamy, E.V. Microplastic pollution in Vembanad Lake, Kerala, India: The first report of microplastics in lake and estuarine sediments in India. Environ. Pollut. 2017, 222, 315–322. [Google Scholar] [CrossRef] [PubMed]
- Vidyasakar, A.; Neelavannan, K.; Krishnakumar, S.; Prabaharan, G.; Priyanka, T.S.A.; Magesh, N.; Godson, P.; Srinivasalu, S. Macrodebris and microplastic distribution in the beaches of Rameswaram Coral island, Gulf of Mannar, southeast coast of India: A first report. Mar. Pollut. Bull. 2018, 137, 610–616. [Google Scholar] [CrossRef] [PubMed]
- Karthik, R.; Robin, R.; Purvaja, R.; Ganguly, D.; Anandavelu, I.; Raghuraman, R.; Hariharan, G.; Ramakrishna, A.; Ramesh, R. Microplastics along the beaches of southeast coast of India. Sci. Total Environ. 2018, 645, 1388–1399. [Google Scholar] [CrossRef]
- Krishnakumar, S.; Srinivasalu, S.; Saravanan, P.; Vidyasakar, A.; Magesh, N.S. A preliminary study on coastal debris in Nallathanni island, Gulf of Mannar biosphere reserve, southeast coast of India. Mar. Pollut. Bull. 2018, 131, 547–551. [Google Scholar] [CrossRef]
- Priya, P.J.; Varunprasath, K. Survey of Wetlands in and around Tiruppur district, Tamil Nadu, India. Annu. Res. Rev. Biol. 2018, 27, 1–13. [Google Scholar] [CrossRef]
- Joy, A.; Anoop, P.P.; Rajesh, R.; Mathew, J.; Mathew, A.; Gopinath, A. Spatial variation of trace element concentration and contamination assessment in the coral reef sediments of Lakshadweep Archipelago, Indian ocean. Mar. Pollut. Bull. 2019, 146, 106–116. [Google Scholar] [CrossRef]
- Manickavasagam, S.; Kumar, S.; Kumar, K.; Bhuvaneswari, G.R.; Paul, T.; Shukla, S.P. Quantitative assessment of influx and efflux of marine debris in a water channel of South Juhu creek, Mumbai, India. Reg. Stud. Mar. Sci. 2020, 34, 101095. [Google Scholar] [CrossRef]
- Daniel, D.B.; Thomas, S.N.; Thomson, K.T. Assessment of fishing-related plastic debris along the beaches in Kerala Coast, India. Mar. Pollut. Bull. 2020, 150, 110696. [Google Scholar] [CrossRef]
- Edward, J.P.; Mathews, G.; Raj, K.D.; Laju, R.L.; Bharath, M.S.; Kumar, P.D.; Arasamuthu, A.; Grimsditch, G. Marine debris—An emerging threat to the reef areas of Gulf of Mannar, India. Mar. Pollut. Bull. 2020, 151, 110793. [Google Scholar] [CrossRef]
- Nelms, S.E.; Duncan, E.M.; Patel, S.; Badola, R.; Bhola, S.; Chakma, S.; Chowdhury, G.W.; Godley, B.J.; Haque, A.B.; Johnson, J.A.; et al. Riverine plastic pollution from fisheries: Insights from the Ganges River system. Sci. Total Environ. 2021, 756, 143305. [Google Scholar] [CrossRef] [PubMed]
- Napper, I.E.; Baroth, A.; Barrett, A.C.; Bhola, S.; Chowdhury, G.W.; Davies, B.F.; Duncan, E.M.; Kumar, S.; Nelms, S.E.; Niloy, N.H.; et al. The abundance and characteristics of microplastics in surface water in the transboundary Ganges river. Environ. Pollut. 2021, 274, 116348. [Google Scholar] [CrossRef]
- Pauly, D. Anecdotes and the shifting baseline syndrome of fisheries. Trends Ecol. Evol. 1995, 10, 430. [Google Scholar] [CrossRef]
- Opfer, S.; Arthur, C.; Lippiatt, S. NOAA Marine Debris Shoreline Survey Field Guide. Available online: https://marinedebris.noaa.gov/noaa-marine-debris-shoreline-survey-field-guide (accessed on 1 December 2019).
- Browne, M.A.; Chapman, M.G.; Thompson, R.C.; Amaral Zettler, L.A.; Jambeck, J.; Mallos, N.J. Spatial and temporal patterns of stranded intertidal marine debris: Is there a picture of global change? Environ. Sci. Technol. 2015, 49, 7082. [Google Scholar] [CrossRef] [Green Version]
- Frias, J.P.G.L.; Nash, R. Microplastics: Finding a consensus on the definition. Mar. Pollut. Bull. 2019, 138, 145. [Google Scholar] [CrossRef]
- Alkalay, R.; Pasternak, G.; Zask, A. Clean-coast index—A new approach for beach cleanliness assessment. Ocean Coast. Manag. 2007, 50, 352. [Google Scholar] [CrossRef]
- Greenpeace. Break Free From Plastic. Branded: In Search of the World’s Top Corporate Plastic Polluters. Available online: https://www.breakfreefromplastic.org/globalbrandauditreport2018/ (accessed on 1 November 2019).
- GAIA. Plastics Exposed. How Waste Assessments and Brand Audits Are Helping Philippine Cities Fight Plastic Pollution; GAIA: Quezon, Philippines, 2019. [Google Scholar]
- Hoon, V.; Padgett, R.R.; Mohammed, K.G.; Asif, K.K. Global Socioeconomic Monitoring Initiative for Coastal Management III Project; CARESS 2020; Site Minicoy Island, Union Territory of Lakshadweep: Kavaratti, India, 2020. [Google Scholar]
- De Vos, A. The Problem of ‘Colonial Science’: Conservation Projects in the Developing World Should Invest in Local Scientific Talent and Infrastructure, Scientific American. 2020. Available online: https://www.scientificamerican.com/article/the-problem-of-colonial-science/ (accessed on 1 October 2021).
- CAG. Efficacy of Single-Use Ban in Chennai. 2021. Available online: https://www.cag.org.in/database/efficacy-single-use-plastic-ban-chennai (accessed on 1 October 2021).

| Type of Material | Tally (%) | Weight in kg (%) |
|---|---|---|
| Plastic | 27,769 (83.0%) | 343.39 (57.3%) |
| Metal | 832 (2.49%) | 32.86 (1.94%) |
| Glass | 468 (1.40%) | 76.34 (5.48%) |
| Rubber | 154 (0.46%) | 11.64 (4.92%) |
| Processed trees | 1354 (4.04%) | 11.75 (3.99%) |
| Cloth, fabric, shoes | 1360 (4.06%) | 69.8 (12.7%) |
| Natural materials left by humans | 1105 (3.30%) | 23.89 (11.6%) |
| Mixed and other materials | 432 (1.29%) | 29.48 (1.96%) |
| Total | 33,474 | 599.15 |
| Site | Date | Area (m2) | Tally | Weight | Debris Density by Count (Pieces/m2) | Clean Coast Index Rating | Debris Density by Weight (g/m2) |
|---|---|---|---|---|---|---|---|
| Menamkulam | 19 March 2019 | 2500 | 7420 | 43.5 | 2.97 | Extremely dirty | 17.4 |
| Menamkulam | 12 June 2019 | 2000 | 6653 | 106.5 | 3.32 | Extremely dirty | 53.25 |
| Karamana | 12 June 2019 | 500 | 1931 | 97.6 | 3.86 | Extremely dirty | 195.2 |
| Kodi Beach | 5 July 2019 | 2240 | 13,541 | 74.3 | 6.05 | Extremely dirty | 33.2 |
| Burmanallah Beach | 21 September 2019 | 5000 | 3135 | 325.10 | 0.63 | Dirty | 65.0 |
| Silver Beach | 21 September 2019 | 1500 | 2158 | 22.1 | 1.44 | Extremely dirty | 14.7 |
| Ramanthurai Beach | 23 September 2019 | 1000 | 381 | 17.9 | 0.38 | Moderate | 17.9 |
| Dadar Beach | 14 October 2019 | 700 | 519 | 5.55 | 0.74 | Dirty | 7.93 |
| Kamwari River | 24 October 2019 | 500 | 677 | 28.3 | 1.35 | Extremely dirty | 56.6 |
| Mariyanadu Beach | 2 January 2020 | 900 | 1488 | 6.23 | 1.65 | Extremely dirty | 6.92 |
Publisher’s Note: MDPI stays neutral with regard to jurisdictional claims in published maps and institutional affiliations. |
© 2022 by the authors. Licensee MDPI, Basel, Switzerland. This article is an open access article distributed under the terms and conditions of the Creative Commons Attribution (CC BY) license (https://creativecommons.org/licenses/by/4.0/).
Share and Cite
Owens, K.A.; Divakaran Sarasamma, J.; Conlon, K.; Kiruba, S.; Biju, A.; Vijay, N.; Subramanian, M.; Asok Vijayamma, S.; Jayadev, A.; Hoon, V.; et al. Empowering Local Practitioners to Collect and Report on Anthropogenic Riverine and Marine Debris Using Inexpensive Methods in India. Sustainability 2022, 14, 1928. https://doi.org/10.3390/su14031928
Owens KA, Divakaran Sarasamma J, Conlon K, Kiruba S, Biju A, Vijay N, Subramanian M, Asok Vijayamma S, Jayadev A, Hoon V, et al. Empowering Local Practitioners to Collect and Report on Anthropogenic Riverine and Marine Debris Using Inexpensive Methods in India. Sustainability. 2022; 14(3):1928. https://doi.org/10.3390/su14031928
Chicago/Turabian StyleOwens, Katharine A., Jaya Divakaran Sarasamma, Katie Conlon, Solomon Kiruba, Alwyn Biju, Niyathi Vijay, Manikandan Subramanian, Smitha Asok Vijayamma, Ayona Jayadev, Vineeta Hoon, and et al. 2022. "Empowering Local Practitioners to Collect and Report on Anthropogenic Riverine and Marine Debris Using Inexpensive Methods in India" Sustainability 14, no. 3: 1928. https://doi.org/10.3390/su14031928