Article

Economic Consequences of the COVID-19 Pandemic: Will It Be a Barrier to Achieving Sustainability?

1
Global Sustainable Development Economic Institute, Sunmoon University, Asan 31460, Korea
2
Department of International Economics and Trade, Global Sustainable Development Economic Institute, Sunmoon University, Asan 31460, Korea
*
Author to whom correspondence should be addressed.
Sustainability 2022, 14(3), 1629; https://doi.org/10.3390/su14031629
Submission received: 17 January 2022 / Revised: 27 January 2022 / Accepted: 28 January 2022 / Published: 30 January 2022
(This article belongs to the Special Issue Economic and Social Consequences of the COVID-19 Pandemic)

Abstract

:
This study quantitatively analyzes the economic impact of the coronavirus disease 2019 (COVID-19) crisis on Korea and other major nations using the standard Global Trade Analysis Project (GTAP) model. Based on the GTAP9a database, we created three scenarios that differed in the severity of the impact of COVID-19, divided the economic shocks witnessed in each scenario into three stages, and applied them at varying degrees to six regions and 10 industry sectors. The results revealed an increase in investments and a decrease in GDP, income, production, and exports, with private household expenditure and export value showing the largest declines in all regions. Under Scenario BA, the export value of the tourism industry decreased by approximately 28%, and private household expenditure on tourism industry imports declined by 33.4% on average across all regions. Conversely, government expenditure increased following the economic recession and increased tax revenue. The results showed similar trends across regions and sectors, with only slight variances according to each region’s economic structural characteristics. By shedding light on proposals and approaches to overcome the global economic crisis amid the ongoing pandemic, this study provides baseline data for devising more practical, detailed response plans and policy directions for potential future calamities.

1. Introduction

The coronavirus disease 2019 (COVID-19), first reported in December 2019 in Wuhan, China, was declared a pandemic, the highest alert level for infectious diseases, by the World Health Organization (WHO) in March 2020. Since then, the pandemic has spread worldwide and become prolonged, with more than 320 million cases and over 5 million deaths as of December 2021. The US; parts of Europe, including the UK; and other major nations have recorded hundreds of millions of cases [1]. To prevent the spread of the virus, countries have implemented social distancing measures, restrictions on movement, and national lockdowns, collapsing the interdependent global value chain and accelerating the severe global economic recession. At the start of the COVID-19 outbreak, the Organization for Economic Co-operation and Development (OECD) reported that the year-over-year real GDP growth rate in Q2 2020 in the US, the EU, and South Korea was −9.49%, −11.9%, and −3.33%, respectively [2]. Furthermore, according to the International Monetary Fund’s (IMF) October 2020 forecast, the global economic growth rate declined to −4.4% [3]. As such, economic-related international organizations such as the IMF and the World Bank have predicted a deep global economic recession, with recovery in the short term proving challenging.
In contrast to past economic crises triggered by excessive debt and the insolvency of financial institutions, this downturn is unique as it was sparked by an infectious disease, an external shock unrelated to the economy. This has precipitated the collapse of local economies. Lower consumption and reduced production activities from economic agents such as households and businesses, income inequality, and enterprises’ reduced reliance on labor has increased household debt [4]. As government infection prevention policies and social safety net programs are critical in responding to the COVID-19 economic crisis [5], experts across diverse fields are actively conducting related studies. Researchers have heavily utilized data from economic studies on past infectious diseases such as severe acute respiratory syndrome (SARS) [6,7] and Middle East respiratory syndrome (MERS) [8,9]. These studies reported that the infectious disease outbreaks led to a decline in the affected region’s GDP, income, and expenditure, especially tourism income, and an increase in unemployment rate. For instance, Evans et al. [10] indicates that the loss of GDP amounted from $2.2 billion to $7.4 billion depended on the Ebola scenarios on West Africa. Jung et al. [8] and Joo et al. [9] reported that about 18% of tourism revenue was lost due to MERS in South Korea. Hanna & Huang [11] concluded that there is a decrease of about 1.5% in GDP in China due to SARS in 2002. Details can be found in Appendix A.
Among early studies on COVID-19, McKibbin and Fernando [12] estimated the pandemic’s worldwide economic impact and found that each region’s loss ranged from 0.7% up to 9.1% of its GDP under seven scenarios. Maliszewska et al. [13] reported that the decline in GDP due to COVID-19 was 2.1% worldwide, 2.5% on average in developing countries, and 1.9% on average in developed countries. Zeshan [14] estimated the production loss of each industry sector due to COVID-19 to analyze the impact on the global value chain, and found that the European Union (EU) and North America suffered the largest production loss and resultant GDP and welfare losses. Studies have also investigated the impact of COVID-19 on specific countries [15] or analyzed economic impact by combining exogenous shock scenarios or two topics including COVID-19 [16,17,18].
However, most prior research that calculated COVID-19′s economic impact did not expect a long-term pandemic, made optimistic assumptions about the pandemic’s decline, or focused on China, the origin of the outbreak. This makes it difficult to portray the pandemic’s current prolonged status and, given the tendency to underestimate or overestimate regional economic repercussions, there are limitations in using such analyses to devise response measures for the COVID-19 economic crisis. It is vital to adopt measures and policies that more practically address the economic crisis by examining the current economic and social changes caused by COVID-19′s prolongation and conducting analyses that account for future uncertainties.
Accordingly, this study empirically analyzes the economic impact of COVID-19 on Korea and other major countries, while considering the prolongation and uncertainty of COVID-19. For instance, the Korean economy faced approximately a 2.5% annual increase in GDP before COVID-19, but now the numbers should be modified. Moreover, people have tended to reduce their consumption due to strong social distancing promoted by the Korean government. Unlike previous diseases, this pandemic changes consumers’ behavior significantly [19]. Sohn et al. [20] also introduced a preference change in domestic tourism. In the financial markets, stock prices have been significantly affected by COVID-19 death cases and also by a stimulus package to increase consumption domestically [21,22]. All of these interwoven economic linkages should be considered by a comprehensive approach to assess impacts of COVID-19 in Korea. For this purpose, we created three scenarios and applied exogenous shocks at varying degrees to reflect different economic recovery trends and forecasts according to the regions surveyed, thereby differentiating this study from previous research. For the analysis, we applied the standard GTAP model, a type of Computable General Equilibrium (CGE) model, based on the Global Trade Analysis Project Database (GTAP DB). By performing a region-specific examination that represents regional economic realities, this study attempts to address the limitations of past research, such as underestimation and overestimation, and produce more precise and detailed results. This study’s findings will serve as important baseline data for devising response plans and preventive systems for various crises to restrict the spread of infection and promote economic recovery within the current protracted COVID-19 pandemic.

2. Model and Data

2.1. GTAP Model

The standard GTAP model used in this study is a type of CGE model. It is a basic analytical model founded on real data generally suited for analyzing impacts before and after policies or economic shocks at a specific point in time. To run this model, a GTAP database, including bilateral trade in goods and services, is needed. In addition, this database also used to be applied in multiregion input-output analysis by conducting global social account matrix (Global SAM) modeling [23]. In contrast to partial equilibrium models limited to a single industry or a specific industry group, or macromodels that describe all production and consumption of a single good, the standard GTAP model can express the economy of several industries that produce many goods [24].
Figure 1a is a schematic of the standard GTAP model’s overall structure, and Figure 1b shows the structure of the production sector. The model has a structure in which six economic agents (regional household, private household, government, producer, global bank, and rest of the world) interact with each other. The solution to the model, based on Walras’s general equilibrium theory [25], is derived from the optimization activities of each agent, including profit maximization, cost minimization, and utility maximization.
The standard GTAP model uses the constant elasticity of substitution (CES) function and the Leontief function. The factors of production are assumed to be fixed proportions so that there is no substitution effect between the two factors in the production process, the constant difference elasticity (CDE) function for private spending, and the Cobb–Douglas function for government spending.
The production sector involves a complex process largely comprising two stages, as shown in Figure 1b. Each factor of production is combined through the CES function to create added value, and domestic and imported goods are combined through the CES function to create composite intermediate goods. The composite added value and composite intermediate goods are then combined through the Leontief function to produce the final product.
Equation (1) shows the CES function used when combining intermediate goods and added value.
Q = A [ δ K ρ + ( 1 δ ) L ρ ] 1 / ρ ,   ( A > 0 )   and   ( 1 ρ , ρ 0 )   and   ( 0 δ 1 )
The Leontief function, which combines the composite intermediate goods and added value at a fixed ratio when producing the final product, is shown in Equation (2).
Q = A [ δ K + ( 1 δ ) L ] ,
where Q is the product, K is the capital, L is the labor, δ is a distribution or share parameter, and ρ denotes substitute parameters. The values provided in GTAP DB were used for the parameters.

2.2. Data and Variables

The GTAP DB used in the study consists of the Version 9a data as of 2011, including data for 140 regions (countries) and 57 industry sectors [23]. The GTAP DB not only provides the economic data for each country, but also the parameters needed to run the GTAP model, such as substitution elasticity. As these parameters are averaged based on a variety of past research, the data for this study were used without modification.
As this study aims to empirically analyze the impact of COVID-19 on the Korean and global economies, we configured six region classifications consisting of Korea (KOR) and five other regions. Despite being a part of Asia, we classified China (CHN) independently because of its large economic size and influence. We configured 10 industry classifications based on the classification criteria specified in the program, GTAPAgg, without segmenting specific industries to examine the impact on the overall economy rather than on specific industries. To simplify the model, skilled and unskilled labor were combined under “Lab,” and the remaining factors of land, capital, and natural resources were combined under “Capital” in the case of production classification.
Table 1 shows the descriptions of the region, industry, and the factor of production classifications according to this study’s objectives. Regions and Sectors are modified from GTAP DB to meet the goal of this research. Detailed figures can be found in Appendix B.

2.3. Scenario Configuration

As the COVID-19 pandemic persists, countries have been implementing response measures and preventive systems, and vaccines have been developed, leading to a recovery trend in the second half of 2020 that has continued into 2021. Nevertheless, there are still many inherent uncertainties and risks, such as COVID-19 reinfections and delays in vaccine distribution.
The World Bank [27], the OECD [2], the IMF [28], and the Bank of Korea [29] predict that although the global economy will continue to recover as a result of increasing vaccinations and strong exports, the recovery rate will greatly differ between developed and developing countries. The economic recovery of countries that have remained stagnant during this protracted pandemic will be determined by vaccination-based herd immunity and active government policy support. Accordingly, it is predicted that the economic recovery discrepancies between developed and developing countries will continue to be substantial in 2022.
Therefore, we created three scenarios reflecting this inherent uncertainty and applied economic shocks to each region at varying degrees to reflect the uneven economic recovery between the countries. We configured each scenario and economic shock based on prior research estimating the global economic impact at the beginning of the COVID-19 pandemic. Table 2 and Table 3 present detailed descriptions of each.
Owing to the prompt distribution and use of vaccines and large-scale financial support policies, CHN and the USA are expected to enter and maintain a favorable economic recovery from early 2021. Among the three groups, they were classified in the first group, to which the smallest economic shock was applied. Meanwhile, though the EU consists of developed countries, it was classified in the second group, along with KOR, because of a stagnant economic recovery caused by delays in vaccine distribution and the spread of infections at the beginning of the year. Finally, the ROA and the ROW mostly comprise Asian and South American countries, and the regions with the most negative economic outlook. As such, we applied the largest economic shock to them.
We configured three scenarios: the baseline scenario (BA) that reflects the current economic recovery trends, a pessimistic scenario (PE) that assumes the conditions will worsen from the baseline, and an optimistic scenario (OP) that assumes the conditions will rapidly improve from the baseline. The degree of economic shock was increased or decreased from the baseline scenario to the same extent for the sensitivity analysis.
Whilst commodity trade has seen a swift recovery since the development of the vaccines, service trade is still recovering slowly because of continued social distancing policies. The United Nations World Tourism Organization (UNWTO) [32] announced that although the downturn in international tourism has improved compared to 2020, there are still substantially fewer international tourists than before the pandemic, and the pace of recovery is slow. Moreover, the UNWTO [32] conducted four surveys over about a year from October 2020 and found that increasingly fewer respondents expected international tourism to recover to 2019 levels within 2022. Therefore, with respect to BA, we increased the export tax on the international tourism industry to 30%, which increases the international prices of the goods or services and reduces the demand for the international tourism industry. Maliszewska et al. [13] found that if the export tax on industries related to international tourism services such as aviation is increased by 50%, then global tourism service exports can be expected to decline by 20–32%. Consequently, considering improved conditions due to rising vaccine distribution, inoculation rates, and loosened restrictions on international travel in certain regions, we set the shock of increased export tax for BA to 30%. We also lowered the shock of reduced demand from that which was used in initial research for tourism demand within a region, given that conditions have improved since the start of the pandemic as governments have stabilized their preventive measures and implemented support policies.
Finally, we reflected the adverse impact on the labor market posed by social measures designed to prevent further infections by reducing the labor supply. In its regular August report, the International Labor Organization (ILO) [30] forecasted that even though the employment-to-population ratio in all regions has been recovering following a decrease in 2020, it will not reach 2019 levels by 2022. Despite a variety of policy support, unemployment rates in nearly all regions are still approximately 1.5% higher than pre-pandemic levels, according to the IMF [3]. Meanwhile, though labor markets across different nations are improving in line with economic recovery, recovery is slower than the consumption and production sectors owing to the nature of labor markets (e.g., the stigma effect). Therefore, considering the recovery since the beginning of the pandemic, we set the shock of reduced labor supply for BA at 3%, the same conservative estimate used by Maliszewska et al. [13].
Overall, this study modified the scenario where significantly higher economic shocks were applied to China, the source of the outbreak, when initially estimating COVID-19’s global economic impact, and further enhanced the scenarios by capturing the discrepancy in recovery between regions as the pandemic persisted.

3. Results

3.1. Aggregated Economic Impact by COVID-19

In all scenarios, all economic indicators except investment decreased, with exports showing the largest decline. Global GDP decreased by approximately 1% in OP, but this decline more than tripled to −3.38% in PE. Exports decreased by −9.75% in PE, indicating that exports will be hit the hardest if the current pandemic worsens in the future. Overall, these results confirmed the negative impact of COVID-19 on the global economy. Results can be found in Figure 2a. The detrimental effects of COVID-19 on the global economy are depicted in Figure 2b by region. While the results greatly vary between each region and scenario, income, exports, and output all decreased. Exports showed the largest decline, from 1.4% in KOR under OP to 11.17% in ROA under PE. KOR had the largest decrease in household expenditure, whereas other regions had the largest decrease in exports.

3.2. Expenditure

The GTAP model divides expenditure by economic agent and further classifies it into expenditure on imported goods and on domestic goods. Firm expenditure is divided into three categories, including not only goods, but also factors of production. Figure 3 is a graph segmenting the rate of change in expenditure within each region by economic agent. Details can be found in Appendix B. Firm expenditure includes only expenditure on goods, excluding the expenditure on factors of production. In all scenarios and regions, government expenditure increased, while household and firm expenditure decreased, with the decline in household expenditure exceeding that of firm expenditure. In terms of regional averages, under BA, household expenditure dropped by 7.7% and firm expenditure by 1.89%, while government expenditure increased by approximately 15%. Within the classified groups, the USA’s reduced rate of expenditure exceeded that of CHN despite applying the same level of shock, the EU’s reduced rate of expenditure was greater than that of KOR, and the ROA showed a higher rate of expenditure than the ROW. The rise in government expenditure can be attributed to two factors: the economic recession and increased export tax. Economic downturns during the COVID-19 pandemic stimulate government spending to recover the economy by boosting reduced private consumption and providing various forms of financial support. Meanwhile, the increased export tax applied as an economic shock raises the government’s tax revenue, which encourages expenditure or compels the government to pay subsidies. Consequently, the rise in government expenditure can be attributed to the export tax increase shock and overall economic downturn. In addition, this result differs depending on the region’s economic conditions and export structure.
To assess the level of decline in private household expenditure in each industry, Figure 4 presents a graph illustrating the rate of change in household expenditure by industry, and between domestic and imported goods. In the case of expenditure on imported goods, the decline in the tourism industry was much greater than that in other industry sectors, and no other large differences in expenditure among the sectors were observed. Under BA, the average reduction rate of household expenditure on imports was –10.46%, in which tourism showed an average reduction rate of about 33%, and the other sectors indicated lower-than-average reduction rates. This sharp decline in household expenditure on tourism imports, can be attributed to the rise in international prices from the increased export tax shock and the corresponding dive in export demand.
As for expenditure on domestic goods, under BA, the average reduction rate among all industries was 7.34%. “Grains and Crops (GnCrp)” showed the smallest decrease under BA at approximately 4.5%, while “Mining and Extraction (MinExtc)” showed the largest decline at about 9%, and the remaining industries showed declines of about 6% to 9%. Industrial goods under “Grains and Crops” mostly comprise essential goods such as rice, barley, and wheat; therefore, the small decrease in expenditure compared to other industries can be attributed to their relatively low elasticity.
Although household expenditure on domestic goods declined overall because of general economic shocks such as reduced labor supply, the reduction rates varied between industries depending on the goods’ characteristics.
We limited the factors of production in the research model to capital and labor. Thus, the firm expenditure on factors of production was further classified into expenditure on capital and labor. Figure 5 shows the rate of change in expenditure. According to the results, the firm expenditure on both capital and labor decreased in all scenarios and regions, although labor expenditure decreased more than capital expenditure. Under BA, labor expenditure decreased by 2.3% and capital expenditure by 2% on average among the regions. The EU showed the largest decline in both labor and capital expenditure, whereas CHN and the USA showed the smallest decline depending on the scenario. The decline in the firm expenditure on labor can be viewed as a direct effect of the reduced labor supply and the decline in expenditure on capital as an indirect effect. As capital and labor are imperfect substitutes, a firm cannot simply increase capital in proportion to the decrease in labor to maintain production volume; also, since these two factors of production are input into production at a certain ratio, a decrease in labor expenditure causes a decrease in capital expenditure.

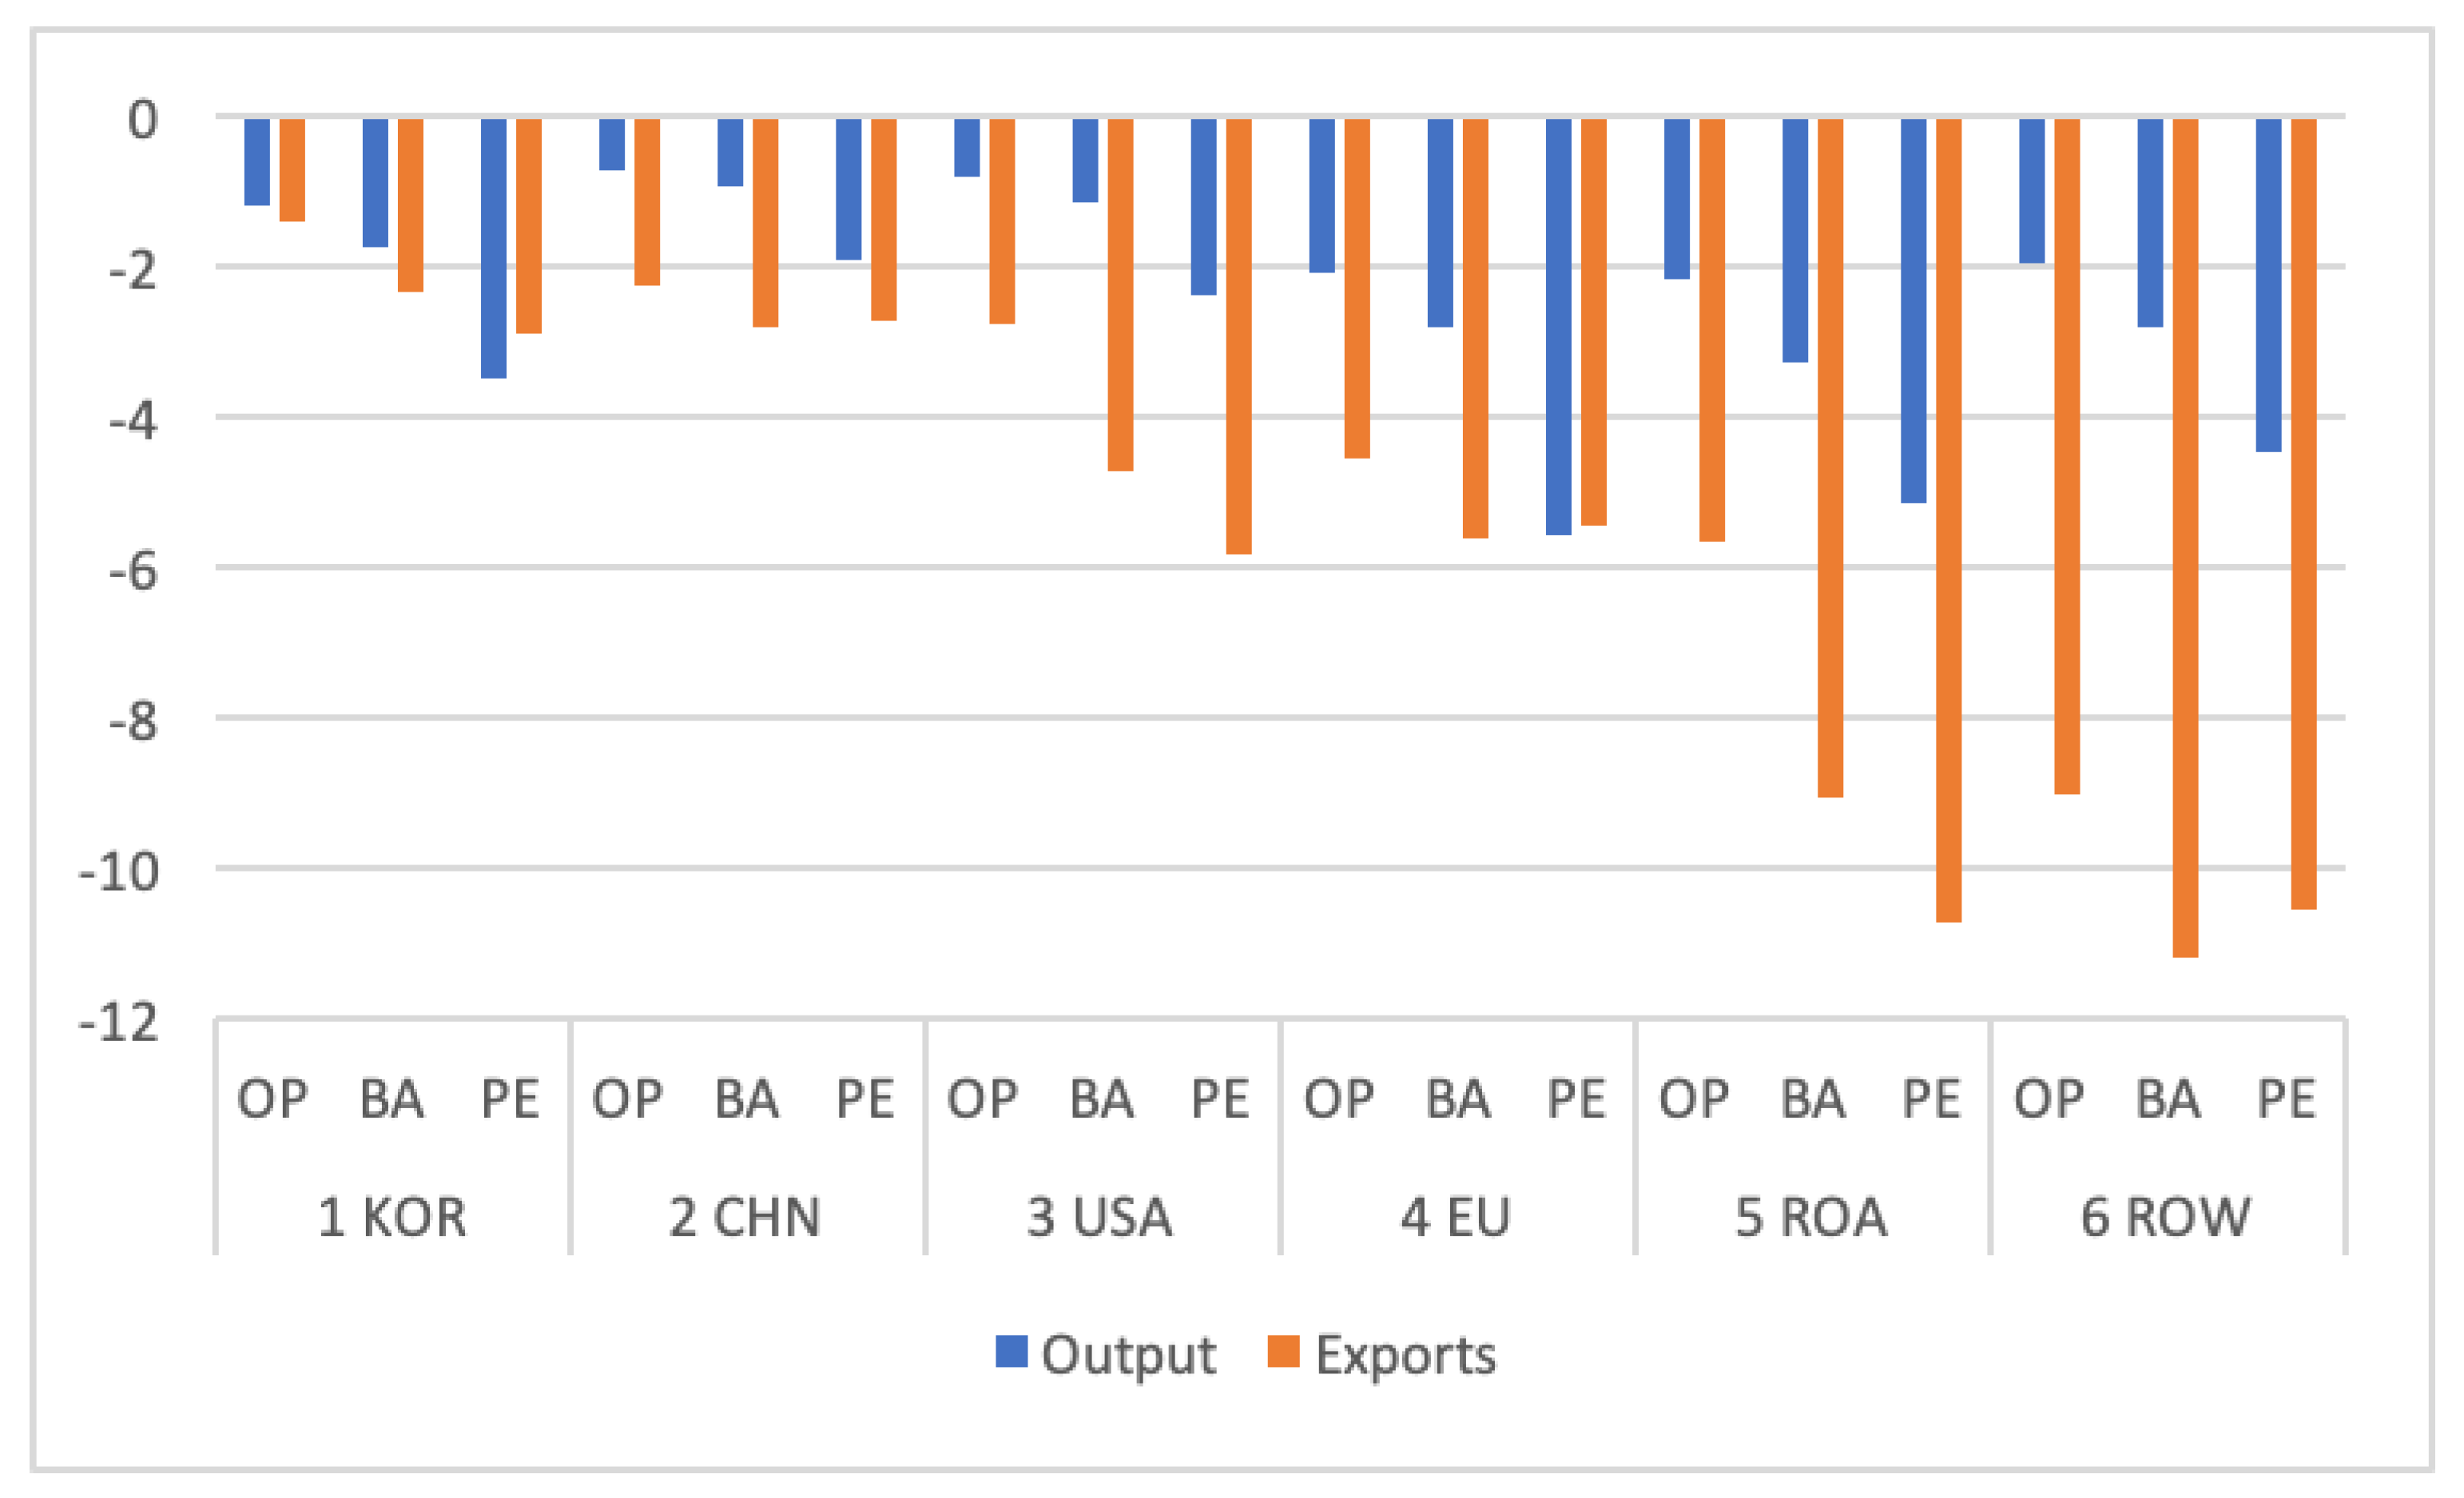
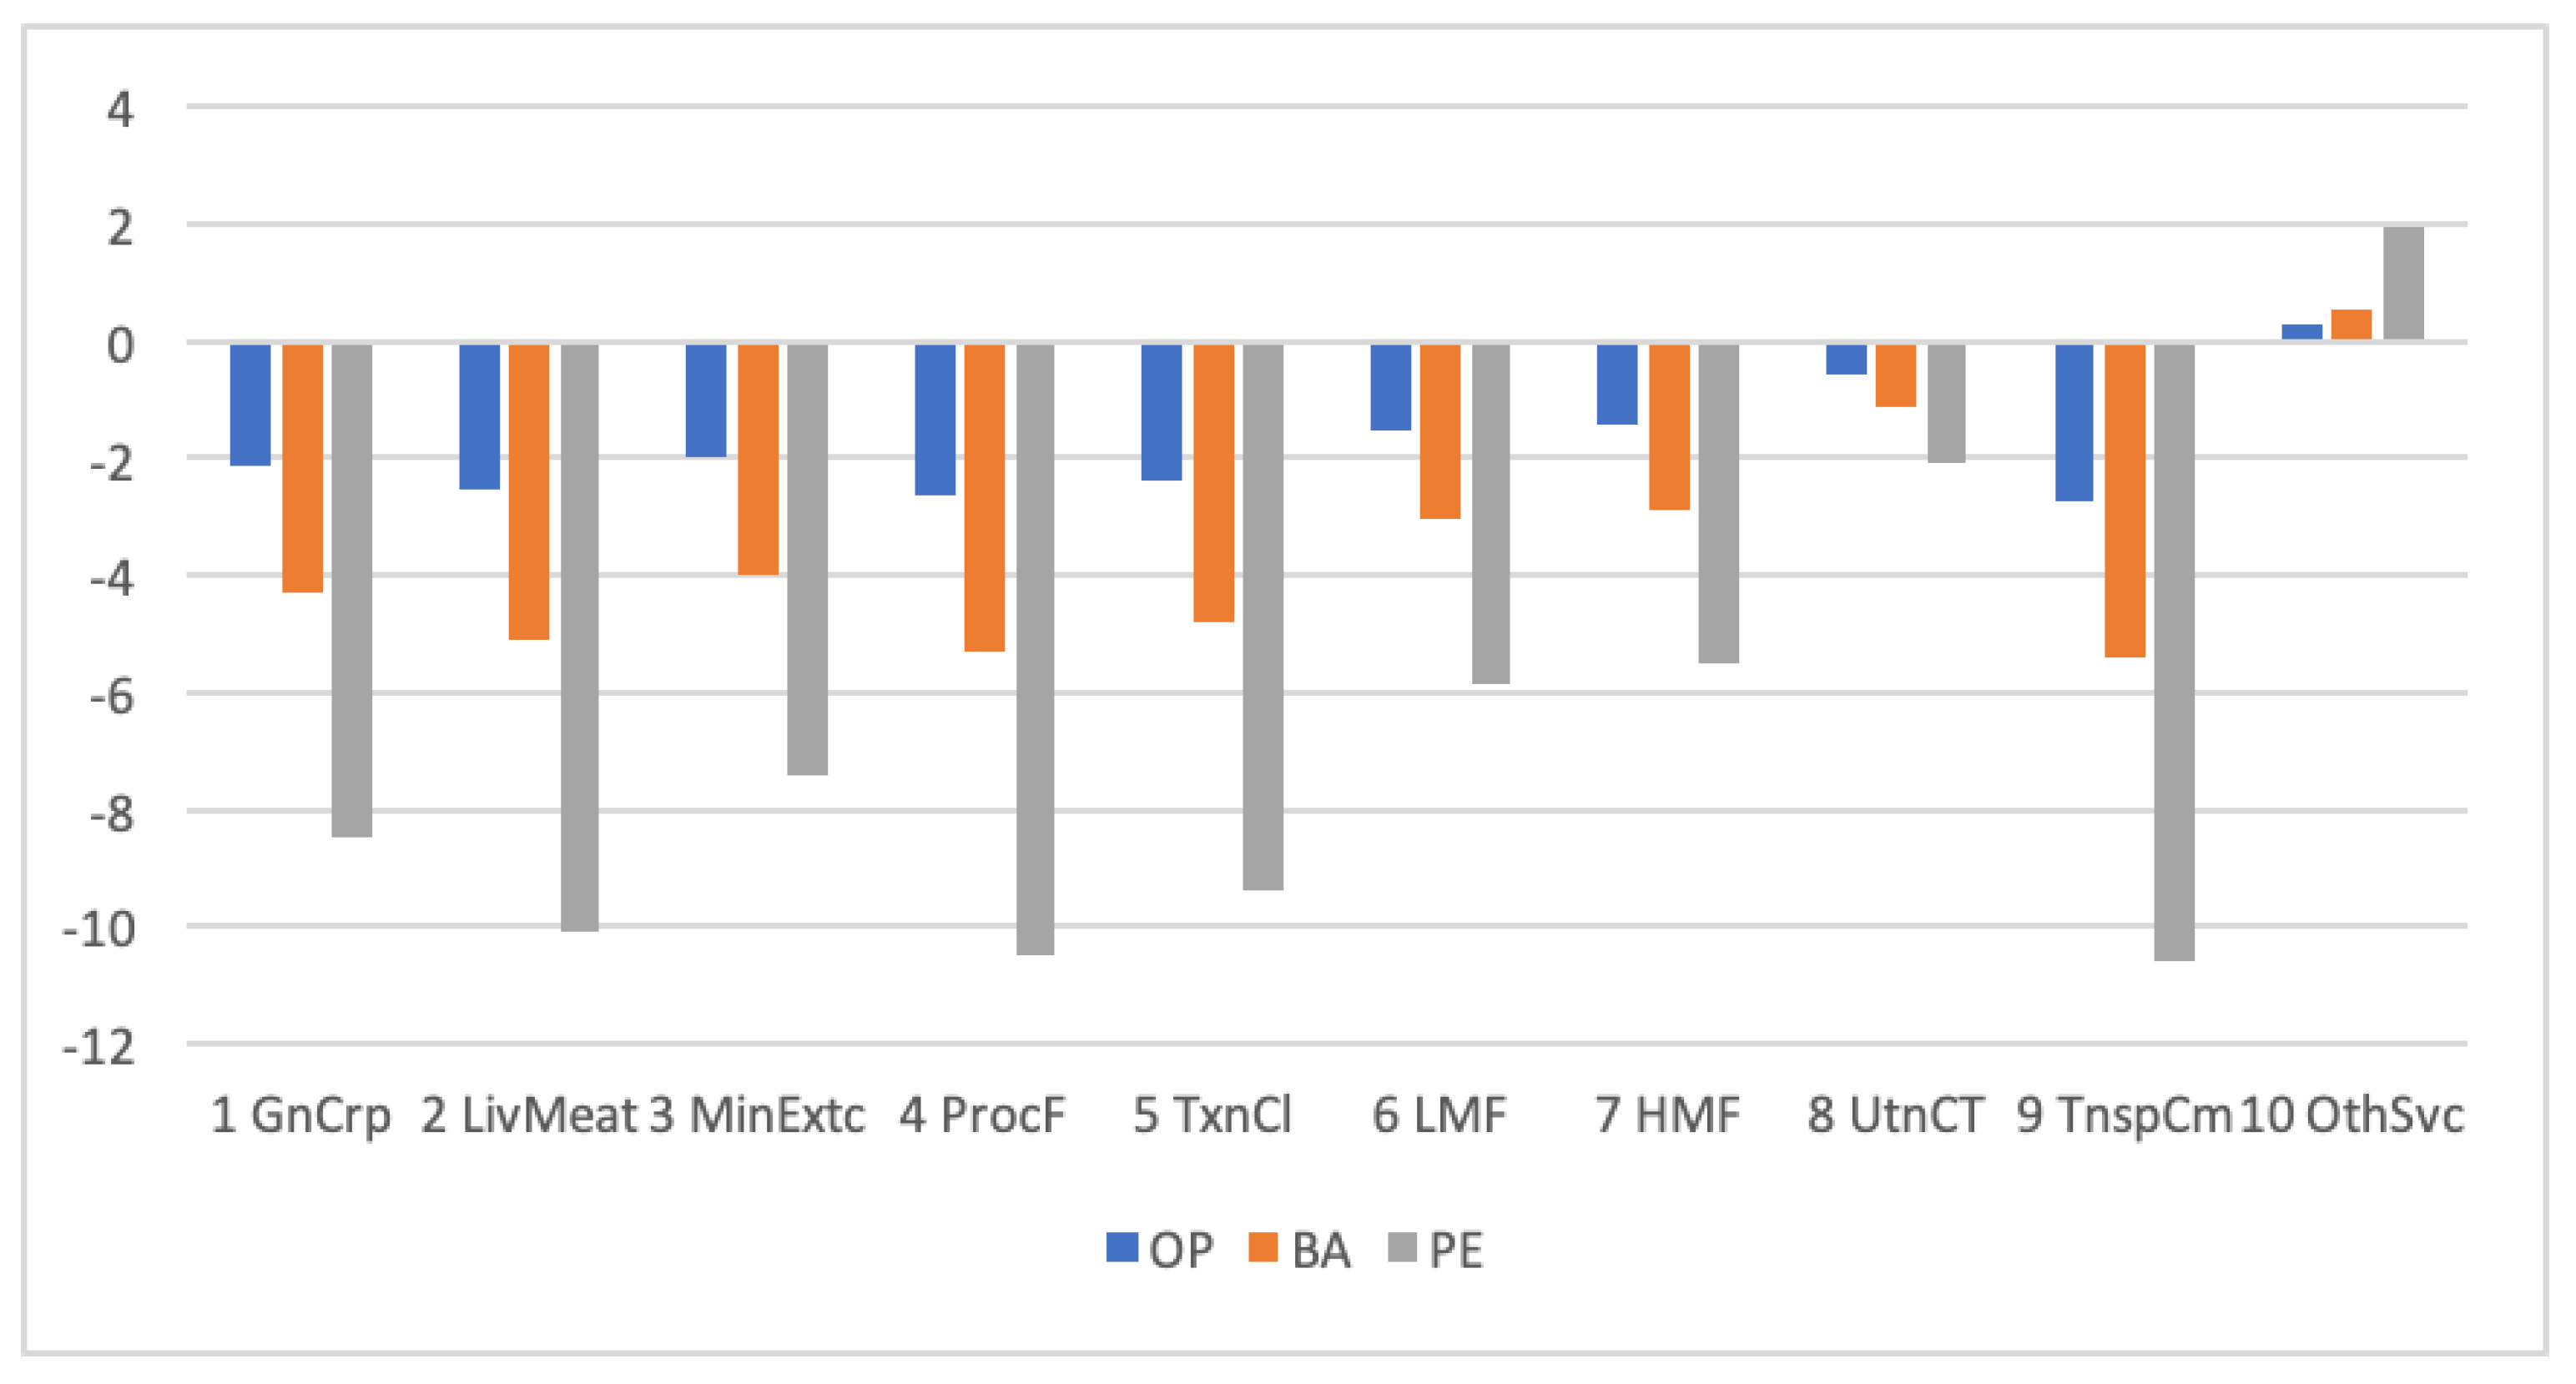
3.3. Output and Exports

The standard GTAP model defines output as the sum of household, firm, government, and export sales and international transportation service exports by market equilibrium conditions, and exports as the sum of export value in each region or industry. Figure 6 is a graph showing the rate of change in output and exports by region in each scenario.
In Figure 7, output declined in all industries except “Other Services.” Tourism showed the largest decline in output at 10.59% under PE, while “Transportation and Communications” showed the smallest decline at around −2%. The decrease in tourism output can be attributed to the steep decline in the industry’s export sales and the drop in international transportation service exports. Notably, in contrast to the other industries, “Other Services” did not show a decline, although the increase was not large. The rise in this sector’s output can be attributed to a substantial increase in government sales compared to the slight decrease in export sales. Under BA, export sales in “Other Services” declined by only about 2%, whereas government sales rose by about 15%. Consequently, the rise in government sales more than offset the drop-in export sales and sales economic agents, which explains the increase in “Other Services” output.
As for exports, regions other than KOR and the EU showed similarly large declines in exports, among which the USA generally showed the largest reduction rate. Under OP, all regions’ exports decreased by less than 3%, whereas under PE, all regions’ exports decreased by around 10%, except KOR’s exports. KOR showed substantially lower reductions in exports than the other regions, ranging from −1.4% to −5.64% depending on the scenario.
In Figure 8, as for the industry-specific rates of change in exports, tourism showed the largest decline among those analyzed, at 55.91%, while “Other Services” showed the smallest decrease at 3.5%. The remaining industries showed rates of change ranging from −2% to −6% under BA. The rapid drop in tourism exports is mainly attributed to the reduced demand due to increased international prices in the industry. The decline in exports for the remaining industries is due to a combination of factors caused by changing market prices in each region, reduced labor supply, and decreased production, which led to varying results, depending on the industrial and economic structural differences between each region.

3.4. Comparison of Research Results

The IMF, OECD, and the World Bank published 2021 reports presenting the percent change of GDP in 2020 relative to 2019, as 2020 provides a forecast of estimates for years following 2021. Despite minor discrepancies between the reports, global GDP in 2020 shrank by approximately 3.4% as compared to 2019, and the GDP of all countries declined year over year, except for China’s GDP, which grew by 2.3%. Table 4 compares the percent change of GDP in 2020 announced by each institution in 2021, the estimates of previous research reported in 2020, and the results of this study.
Most noteworthy is the overestimated economic impact on China by previous studies that initially estimated COVID-19’s global economic impact. They had applied comparatively large economic shocks to China, which is where the pandemic originated, as it had high infection rates at the time. Hence, they predicted that China would suffer the greatest damage from COVID-19. Contrary to expectations, the situation in China quickly stabilized, and as the crisis has drawn out, disparities in recovery have emerged between countries, depending on their distribution of vaccines and government policies. The figures for 2020 GDP relative to 2019 are from a period before the recovery disparity became severe, and measurements for 2021 have not yet been aggregated; hence, the previous results cannot be directly compared with this study’s findings. Nevertheless, this study revised the overestimated economic impact of COVID-19 on China predicted by previous studies.

4. Conclusions and Implications

This study aimed to demonstrate the impact of COVID-19 on the Korean and global economies. Through this, it reflects the current prolonged state of the COVID-19 pandemic aiming to provide baseline data for devising response plans and systems for various crises to promote economic recovery. We applied a multiregion, multi-industry standard GTAP model based on GTAP DB Version 9a as the research method to achieve this study’s objectives. We applied the contraction of the labor market and consumption market, one of the greatest causes of the pandemic-led economic downturn and resulting economic damage in specific industries to the model, and quantitatively and empirically analyzed the effects. In contrast to past research on COVID-19, in this study we applied “reduced labor supply,” “reduced demand in tourism industry within region,” and “increased export tax on tourism-related industries” as economic shocks to six regions and 10 industry sectors at varying degrees, based on three scenarios that differed regarding COVID-19’s severity, and then conducted simulations.
Thus, we were able to present more accurate and detailed results through a region-specific analysis and revise the results of previous studies that overestimated the regional economic impact [12,31], thereby giving this study scholarly significance.
This study’s findings confirmed that COVID-19 negatively affects the global economy and heavily impacts private household expenditure and exports in particular, although the detailed results for each scenario, region, and industry varied. In terms of the global economy, investment increased, while GDP, production, exports, and income decreased, with global exports showing the greatest decline at 9.75%. This is consistent with previous research findings on infectious diseases such as SARS [6,7] and MERS [8,9]. To quantitatively analyze the slump in the international tourism industry, the export tax on the tourism industry was increased. This increased the international price of related goods by a minimum of 15% up to about 60%, thereby reducing the export value of the tourism industry by approximately 14%, 28%, or 56%, depending on the scenario. The increased international price of related goods also resulted in a reduction in private household expenditure on tourism imports by between 16.71% and 66.83% in each region. In general, the greater the degree of the economic shock, the higher the rate of change, and the results also varied slightly according to regional characteristics or industrial and economic structures. Compared to the other countries, such as China and US, South Korea is suffering from real income decreases. As with previous research, the findings of this study will aid in overcoming the global economic crisis in this continuing pandemic, especially considering the persistent concerns regarding the spread of another virus in the future. The findings will also contribute to the development of more practical and detailed response plans and policy directions for various crises. For instance, stimulus checks to increase a domestic demand consumption can be a significant action plan for boosting an economy. The Korean government implemented a series of social distancing measures, lockdown for pubs and bars, and mandatory PCR testing for close contacts. Our findings could open a debate for providing subsidies and compensations for the public.
Despite this study’s scholarly significance and implications, the standard GTAP model carries the same general limitations of CGE models. As a comparative static model, it is difficult to estimate economic impacts over time. Additionally, as it does not adequately establish financial relationships such as those between capital, savings, and investment, it does not sufficiently account for the circulation of financial capital and the role of money and asset prices. Furthermore, to estimate the impact of a sharp decline in international tourism services, we reflected the drop in demand by adjusting the price using an increased export tax shock. However, we could not fully classify and eliminate the impact of increased tax revenue on increased government expenditure. Accordingly, future research should address this gap by applying a dynamic model to estimate the impacts over time. Moreover, as the COVID-19 pandemic draws out and remains uncertain, it is necessary to conduct more detailed research into specific regions and industries. Medical evolution by the pandemic addressed to reveal new business agendas could be a future research direction.

Author Contributions

Y.C. and Y.L. contributed to the design and development of this research. Y.C. constructed CGE program coding and modeling to assess global economic impacts of COVID-19. Y.L. provided economic policy guidelines to build CGE scenarios for the model and supervised this research. Initial manuscript was provided by Y.C. and the bulk of the manuscript was written by H.-j.K. and Y.L. All authors have read and agreed to the published version of the manuscript.

Funding

This research was funded by a National Research Foundation of Korea Grant funded by the Korean Government (NRF-2019S1A5C2A03082527). This work was supported by the Sun Moon University Research Grant of 2014.

Institutional Review Board Statement

Not applicable.

Informed Consent Statement

Not applicable.

Data Availability Statement

Data available in a publicly accessible repository that does not issue DOIs. GTAP datasets were analysed in this study. Data can be found here: https://www.gtap.agecon.purdue.edu/databases/default.asp (15 December 2021).

Acknowledgments

The authors thank the Global Sustainable Development Economic Institute (GSEI) and the Sunmoon University for providing generous in-kind support to continue this research. In addition, the construction comments from three anonymous reviewers greatly helped improve this paper.

Conflicts of Interest

The authors declare no conflict of interest.

Appendix A

Table A1. Literature of infectious diseases in the past.
DiseaseEbolaMERSSARS
AuthorEvans, et al. [10]Jung et al. [8]Joo et al. [9]Hanna & Huang [11]Lee et al. [33]Chou et al. [34]
ScenarioLow Ebola (low speed of transmission)
High Ebola (high speed of transmission)
Using the OLS based on data about credit and debit card purchasesCalculating the difference between the “actual value” and the “projected value”Reduced demand for service products
Reduced FDI
Loss of export orders
Increase in government budget expenditure
Temporary SARS shock
Persistent SARS shock
S1 & S2: Short-run (static) shock
S3 & S4: Long-run (steady-state approach) shock
ResultsIn 2014, the loss of GDP amounted to $2.2 billion in the Low Ebola scenario, and $7.4 billion in the High Ebola scenario
In 2015, the loss of GDP was $1.6 billion in Low Ebola and the loss of GDP was $25.2 billion in High Ebola
Consumer expenditure decreased by 1.24% when the number of deaths increased by a unit (5.14 per week)
Expenditure on eating out, department store and leisure/cultural decreased by 8.24%, 18,01% and 6.87%, respectively.
Online shopping expenditure increased by 5.24%
In 2015, about 18% of tourism revenue was lost, and 4% of total domestic and international tourism revenue was lost
Reduction of $2.6 billion in tourism revenue and the number of travelers by 2.1 million
GDP decreased by about 0.2%
A decrease of about 1.5% in GDP in China (no additional fiscal stimulus)
A decrease of 0.9% in GDP in China with the government’s aggressive fiscal and monetary policies
In 2003:Q2, China’s GDP contracted by over 5% relative to a seasonally adjusted annualized basis
Impact on GDP from temporary shock (%): China (−1.05), South Korea (−0.1), United States (−0.07)
Impact on GDP from persistent shock (%): China (−2.34), South Korea (−0.08), United States (−0.07)
The changes (%) of GDP in S1 & S2: China (−0.13 & −0.2), South Korea (−0.02 & 0.03), EU (−0.01 & 0.01)
The changes (%) of GDP in S3 & S4: China (−0.18 & −1.8), South Korea (0.06 & 0.44), EU (0.14 & 0.96)

Appendix B

Table A2. Rate of change in expenditure by agents and goods.
ScenarioDivision by GoodsPrivate
Expenditure
Government
Expenditure
Firm’s
Expenditure
Firm’s Expenditure
(Primary Factor)
KOROPTotal−2.871.81−0.59Total−1.21
Domestic−2.471.81−0.33Labor−1.41
Imported−5.65−0.83−1.36Capital−0.99
BATotal−5.753.63−1.18Total−2.4
Domestic−4.933.63−0.66Labor−2.83
Imported−11.3−1.38−2.73Capital−1.98
PETotal−11.417.99−2.41Total−4.71
Domestic−9.797.99−1.42Labor−5.55
Imported−22.43−1.66−5.38Capital−3.87
CHNOPTotal−1.612.38−0.25Total−0.48
Domestic−1.512.38−0.2Labor−0.51
Imported−3.841.35−0.68Capital−0.46
BATotal−3.224.75−0.5Total−0.97
Domestic−3.024.77−0.4Labor−1.01
Imported−7.672.71−1.36Capital−0.91
PETotal−6.449.36−1.07Total−1.95
Domestic−6.049.39−0.85Labor−2.06
Imported−15.415.34−3.01Capital−1.82
USAOPTotal−1.935.1−0.37Total−0.55
Domestic−1.895.1−0.25Labor−0.59
Imported−2.534.76−1.13Capital−0.45
BATotal−3.8610.21−0.73Total−1.1
Domestic−3.7710.21−0.51Labor−1.19
Imported−5.059.51−2.27Capital−0.89
PETotal−7.820.21−1.67Total−2.31
Domestic−7.6220.22−1.2Labor−2.49
Imported−10.318.73−4.88Capital−1.85
EUOPTotal−3.473.36−1.17Total−1.51
Domestic−3.133.38−0.85Labor−1.68
Imported−4.972.8−2.16Capital−1.3
BATotal−6.946.73−2.33Total−3.02
Domestic−6.256.75−1.71Labor−3.35
Imported−9.945.61−4.32Capital−2.59
PETotal−13.813.72−4.74Total−5.95
Domestic−12.4313.78−3.49Labor−6.63
Imported−19.7811.54−8.71Capital−5.08
ROAOPTotal−6.0414.56−1.47Total−1.41
Domestic−5.914.57−1.28Labor−1.67
Imported−7.5114.15−2.27Capital−1.14
BATotal−12.0829.12−2.94Total−2.82
Domestic−11.829.13−2.56Labor−3.33
Imported−15.0328.3−4.54Capital−2.27
PETotal−24.1267.05−4.61Total−4.06
Domestic−23.5867.06−3.83Labor−4.77
Imported−3065.43−7.9Capital−3.32
ROWOPTotal−5.8113.82−1.35Total−1.13
Domestic−5.7113.85−1.18Labor−1.14
Imported−6.5313.26−2.09Capital−1.12
BATotal−11.6227.65−2.7Total−2.25
Domestic−11.4227.7−2.36Labor−2.27
Imported−13.0726.52−4.17Capital−2.23
PETotal−23.4562.18−4.35Total−3.27
Domestic−23.0362.28−3.63Labor−2.94
Imported−26.559.7−7.42Capital−3.58

References

  1. Johns Hopkins Coronavirus Resources Center Website. Available online: https://coronavirus.jhu.edu/map.html (accessed on 11 November 2021).
  2. OECD. Economic Outlook, Interim Report. Available online: https://www.oecd.org/economic-outlook/september-2021/ (accessed on 1 March 2021).
  3. International Monetary Fund (IMF). World Economic Outlook: Recovery during a Pandemic-Health Concerns, Supply Disruptions, Price Pressures; International Monetary Fund (IMF): Washington, DC, USA, 2021. [Google Scholar]
  4. Cho, D.H.; Kim, J.J. The Impact of the COVID-19 Pandemic on the Domestic Economy and Future Challenges. J. Humanit. Soc. Sci. 2020, 11, 2597–2612. [Google Scholar]
  5. Choi, B.S.; Park, H.J. The Effects of COVID-19 Diffusion in the Korean Economy: Using SIR-Based Macro-Epidemiological Model. Env. Resour. Econ. 2021, 30, 27–48. [Google Scholar]
  6. Asian Development Bank. SARS: Economic Impacts and Implications. Economics and Research Department Policy Brief Series No. 15; Asian Development Bank: Metro Manila, Philippines, 2003. [Google Scholar]
  7. Siu, A.; Wong, Y.R. Economic Impact of SARS: The Case of Hong Kong. Asian Econ. Pap. 2004, 3, 62–83. [Google Scholar] [CrossRef] [Green Version]
  8. Jung, H.; Park, M.; Hong, K.; Hyung, E. The Impact of an Epidemic Outbreak on Consumer Expenditures: An Empirical Assessment for MERS Korea. Sustainability 2016, 8, 454. [Google Scholar] [CrossRef] [Green Version]
  9. Joo, H.; Maskery, B.A.; Berro, A.D.; Rotz, L.D.; Lee, Y.K.; Brown, C.M. Economic Impact of the 2015 MERS Outbreak on the Republic of Korea’s Tourism-Related Industries. Health Secur. 2019, 17, 100–108. [Google Scholar] [CrossRef] [PubMed]
  10. Estimating the Economic Impact of the Ebola Epidemic: Evidence from Computable General Equilibrium Models. Available online: https://www.gtap.agecon.purdue.edu/resources/res_display.asp?RecordID=4775 (accessed on 10 November 2021).
  11. Hanna, D.; Huang, Y. The Impact of SARS on Asian Economies. Asian Econ. Pap. 2004, 3, 102–112. [Google Scholar] [CrossRef]
  12. McKibbin, W.J.; Fernando, R. The Global Macroeconomic Impacts of COVID-19: Seven Scenarios. Asian Econ. Pap. 2021, 20, 1–30. [Google Scholar] [CrossRef]
  13. The Potential Impact of COVID-19 on GDP and Trade: A Pre-liminary Assessment. Available online: https://papers.ssrn.com/sol3/papers.cfm?abstract_id=3573211 (accessed on 11 November 2021).
  14. Zeshan, M. Double-hit scenario of Covid-19 and global value chains. Environ. Dev. Sustain. 2020, 23, 8559–8572. [Google Scholar] [CrossRef] [PubMed]
  15. Walmsley, T.; Rose, A.; Wei, D. Impacts on the US Macroeconomy of Mandatory Business Closures in Response to the COVID-19 Pandemic. Appl. Econ. Lett. 2020, 28, 1293–1300. [Google Scholar] [CrossRef]
  16. Lahcen, B.; Brusselaers, J.; Vrancken, K.; Dams, Y.; Paes, C.D.S.; Eyckmans, J.; Rousseau, S. Green Recovery Policies for the COVID-19 crisis: Modelling the Impact on the Economy and Greenhouse Gas Emissions. Env. Resour. Econ. 2020, 76, 731–750. [Google Scholar] [CrossRef] [PubMed]
  17. Malliet, P.; Frédéric, R.; Gissela, L.; Hamdi-Cherif, M.; Saussay, A. Assessing Short-Term and Long-Term Economic and Environmental Effects of the COVID-19 Crisis in France. Env. Resour. Econ. 2020, 76, 867–883. [Google Scholar] [CrossRef] [PubMed]
  18. Wittwer, G. The 2019–20 Australian Economic Crisis Induced by Bushfires and COVID-19 from the Perspective of Grape and Wine Sectors. Centre of Policy Studies (CoPS) Working Paper No G-299; Victoria University: Melbourne, Australia, 2020. [Google Scholar]
  19. Jo, H.; Shin, E.; Kim, H. Changes in Consumer Behaviour in the Post-COVID-19 Era in Seoul, South Korea. Sustainability 2021, 13, 136. [Google Scholar] [CrossRef]
  20. Sohn, J.-I.; Alakshendra, A.; Kim, H.-J.; Kim, K.-H.; Kim, H.-D. Understanding the New Characteristics and Development Strategies of Coastal Tourism for Post-COVID-19: A Case Study in Korea. Sustainability 2021, 13, 7408. [Google Scholar] [CrossRef]
  21. Jiang, J.; Park, E.-M.; Park, S.-T. The Impact of the COVID-19 on Economic Sustainability—A Case Study of Fluctuation in Stock Prices for China and South Korea. Sustainability 2021, 13, 6642. [Google Scholar] [CrossRef]
  22. Kim, M.; Lee, S. Can stimulus checks boost an economy under covid-19? evidence from South Korea. Int. Econ. J. 2021, 35, 1–12. [Google Scholar] [CrossRef]
  23. Aguiar, A.; Narayanan, B.; McDougall, R. An Overview of the GTAP 9 Data Base. J. Glob. Econ. Anal. 2016, 1, 181–208. [Google Scholar] [CrossRef]
  24. Corong, E.L.; Hertel, T.W.; McDougall, R.; Tsigas, M.E.; van der Mensbrugghe, D. The Standard GTAP Model, Version 7. J. Glob. Econ. Anal. 2017, 2, 1–119. [Google Scholar]
  25. McDonald, S.; Robinson, S.; Thierfelder, K.E. Globe: A SAM Based Global CGE Model Using GTAP Data; US Naval Academy Department of Economics: Annapolis, MD, USA, 2006. [Google Scholar]
  26. Cameron, B. The production function in Leontief models. Rev. Econ. Stud. 1952, 20, 62–69. [Google Scholar] [CrossRef]
  27. World Bank. Global Economic Prospects. Available online: https://www.worldbank.org/en/publication/global-economic-prospects (accessed on 15 June 2021).
  28. IMF. World Economic Outlook Reports. Available online: https://www.imf.org/en/Publications/WEO (accessed on 20 March 2021).
  29. Bank of Korea. Economic Outlook Report. Available online: https://www.bok.or.kr/eng/bbs/E0000634/view.do?nttId=10064693&menuNo=400069 (accessed on 20 August 2021).
  30. ILO. World Employment and Social Outlook. Available online: https://www.ilo.org/global/research/global-reports/weso/trends2021/lang-en/index.htm (accessed on 20 August 2021).
  31. Narayanan, B.; Villafuerte, J. Estimating the Economic Impact of COVID-19: A Supply Side Analysis. 23rd Annual Con-ference on Global Economic Analysis. 2020. Available online: https://www.gtap.agecon.purdue.edu/resources/res_display.asp?RecordID=6141 (accessed on 15 December 2021).
  32. UNWTO. World Tourism Barometer. Available online: https://www.e-unwto.org/loi/wtobarometereng (accessed on 5 September 2021).
  33. Lee, J.W.; McKibbin, W.J. Globalization and Disease: The Case of SARS. Asian Econ. Pap. 2004, 3, 113–131. [Google Scholar] [CrossRef]
  34. Chou, J.; Kuo, N.F.; Peng, S.L. Potential Impacts of the SARS Outbreak on Taiwan’s Economy. Asian Econ. Pap. 2004, 3, 84–99. [Google Scholar] [CrossRef]
Figure 1. Basic structure of the standard GTAP model. Panel (a) indicates the conceptual structure of the GTAP model; Panel (b) presents an example of the nested production structure in the model.
Sustainability 14 01629 g001
Figure 2. Overall economic impacts of a pandemic. (a) shows aggregated economic impacts in percentage; (b) indicates aggregated economic impacts by regions. Illustrates are provided by authors. GTAP model was conducted by using figures from Table 3 as inputs in the model.
Sustainability 14 01629 g002
Figure 3. Rate of change in expenditure by agents.
Sustainability 14 01629 g003
Figure 4. Rate of change in private household’s expenditure by goods.
Sustainability 14 01629 g004
Figure 5. Rate of change in firms’ expenditure on factors of production.
Sustainability 14 01629 g005
Figure 6. Rate of change in output and exports.
Sustainability 14 01629 g006
Figure 7. Rate of change in sectoral output.
Sustainability 14 01629 g007
Figure 8. Rate of change in sectoral exports.
Sustainability 14 01629 g008
Table 1. Regions, Sectors, and Factor of production used in the GTAP model.
RegionSectorFactor of Production
1. KOR (Korea)
2. CHN (China)
3. USA (United of States)
4. EU (Europe)
5. ROA (Rest of Asia)
6. Rest of the World (ROW)
1. GnCrp (Grains and Crops)
2. LivMeat (Livestock and Meat Products)
3. MinExtc (Mining and Extraction)
4. ProcF (Processed Food)
5. TxnCl (Textiles and Clothing)
6. LMF (Light Manufacturing)
7. HMF (Heavy Manufacturing)
8. UtnCT (Utilities and Construction)
9. TnspCm (Transport and Communication)
10. OthSvc (Other Services)
1. Lab (Labor)
2. Capital (Capital)
Note: The Leontief production function is only considered two factors of production. More details can be found in Cameron [26].
Table 2. Economic situation and outlook for scenarios.
Region and CountryEconomic Situation and Outlook
CHNThere are a few additional confirmed cases
In 2021, the trend of growth has continued, focusing on consumption and exports
USAContinuous implementation of large-scale financial policies
Maintaining a positive recovery with rapid vaccine distribution and vaccination
⇒ The unexpected spread of COVID-19 could have negative impacts on recovery, but a good trend of recovery is expected to continue, focusing on employment and demand
EUThe recession in neighboring countries was caused by a mutant virus from the UK and delayed the supply of vaccines
After 21Q2: augmentation of vaccination rate and relaxation of quarantine measures
KORIn 2021, there was an 11.9% increase in fiscal expenditure
Vaccination progressing quickly
Sporadic mass infection and slow recovery in the employment sector
⇒ Since the first half, the recovery is projected to expand because of consistent vaccination and implementation of fiscal stimulus
ROA & ROWPoor conditions for quick vaccination and mass storage of vaccines, unlike in advanced countries
Financial difficulties in implementing immediate, large-scale reflation measures
⇒ Overall, the economy is expected to recover slowly after the second half
Source: ILO [30]; IMF [28]; OECD [2]; World Bank [27]; and Bank of Korea [29].
Table 3. Comparison of scenarios with previous studies in the early stages of the pandemic.
ScenarioRegionShock
This studyOptimisticCHN & USASupply of labor: −1%
Demand of domestic tourism industry: −2.5%
Export tax on tourism industry: +15%
KOR & EUSupply of labor: −2%
Demand of domestic tourism industry: −5%
ROA & ROWSupply of labor: −3%
Demand of domestic tourism industry: −7.5%
BaselineCHN & USASupply of labor: −2%
Demand of domestic tourism industry: −5%
Export tax on tourism industry: +30%
KOR & EUSupply of labor: −4%
Demand of domestic tourism industry: −10%
ROA & ROWSupply of labor: −6%
Demand of domestic tourism industry: −15%
PessimisticCHN & USASupply of labor: −3%
Demand of domestic tourism industry: −10%
Export tax on tourism industry: +60%
KOR & EUSupply of labor: −6%
Demand of domestic tourism industry: −20%
ROA & ROWSupply of labor: −9%
Demand of domestic tourism industry: −30%
Maliszewska et al. [13]Global
pandemic
ChinaEmployment: −3%
International costs of imports and exports: +25%
Export tax on tourist services: +50%
Demand of targeted services: −15%
ROW1/2 of China
Amplified
global
pandemic
All regionsSame as China in “global pandemic” scenario
Narayanan & Villafuerte [31]Short
containment
ChinaConsumption: −5%
Investment: −5%
Tourism receipts −11.4%
Trade
costs: +1%
ROWConsumption: −2%
Investment: −2%
Tourism receipts −4.4%
Long
containment
ChinaConsumption: −5%
Investment: −6.25%
Tourism receipts −22.9%
Trade
costs: +2%
ROWConsumption −5%
Investment: −6.25%
Tourism receipts −8.9%
Table 4. The percent change of GDP in 2020 relative to 2019.
ScenarioWorldUSChinaSouth Korea
Optimistic−1.03−0.450.44−0.96
Baseline−2.11−0.9−0.11−1.91
Pessimistic−3.38−1.92−0.62−3.92
Publisher’s Note: MDPI stays neutral with regard to jurisdictional claims in published maps and institutional affiliations.

