1. Introduction
By its actions, human society creates negative environmental impacts on the planet. The environmental behaviour of society is limited by conventions, directives, and standards. The Paris Protocol is one of the major international treaties and has already been ratified by 197 countries. The aim of the agreement is to reduce greenhouse gas emissions so that the temperature rise does not exceed an average temperature of 1.5 °C, compared to pre-industrial levels [
1]. Product regulation efforts are made using ISO 14000 (environmental management) life cycle assessment standards. Standards ISO 14044 (Environmental management—Life cycle assessment—Principles and framework) and ISO 14040 (Environmental management—Life cycle assessment—Requirements and guidelines) serve as a guide for the assessment of the individual life stages of a product [
2].
Life cycle assessment (LCA) tools use different approaches and provide diverse results in accordance with environmental impact assessment requirements [
3]. Approaches to environmental impact assessment can be:
Qualitative
Semi-quantitative
Quantitative
Qualitative approaches are used for rapid assessment of environmental impacts without in-depth knowledge of LCA methods. These include, for example, Ecodesign Checklist (evaluation in three criteria), LiDS Wheel (spider web/radar diagram assessing both existing and new products in eight factors), and The Golden Rules (a method designed to compare and assess concepts, for example) [
4,
5,
6]. There are many more methods: Volvos Lists, ABC-Analysis, Philips Fast Five Awareness, Econcept Spiderweb, The Morphological Box and others. Methods based on a qualitative approach are suitable for a quick and indicative evaluation of a product or service. It is possible to assess the early stages of design without knowledge of LCA with qualitative output. Some tools allow for direct evaluation of impacts [
6,
7].
The MECO Matrix is a semiquantitative approach that is based on a simplified LCA method as well as the ERPA Matrix. These methods combine both qualitative and quantitative approaches (direct evaluation of impacts) [
6,
7,
8].
Methods using quantitative inputs are, for example, MET Matrix. This method is used in all phases of the life cycle, including the possibility of comparing impact analyses. It contains more than 1000 items integrated into 3D software [
7,
9]. Input/Output (I/O) allows indirect determination of environmental impacts using economic indicators. It is possible to determine energy and material flows during production and their quantification in economic sectors or in the whole system. The solution through I/O analysis provides a comprehensive environmental overview of the economic entity [
10]. The Oil Point Method (OPM) evaluates the life cycle in phases: materials production, manufacturing processes, transport, use and end of life. It uses Oil Point (OP) units for calculation, where 1 OP equals 45 MJ (1 kg of crude oil). OPM contains OP values of more than 70 materials, 20 production processes, and 5 end of life processes [
11]. LCA software solutions such as OpenLCA, SimaPro, GaBi, and Umberto provide better results than qualitative or semiqualitative approaches, but training and implementation of tools are costly. The undeniable advantage of LCA-based methods is the ability to assess the entire life cycle of a product/service and take steps to improve it. According to the research findings, ecodesign experts no longer focus on product design [
12]. When designing products, the industrial designer is an expert in aesthetics and ergonomics. The use of ecodesign tools by industrial designers, especially quantitative LCA methods, is not common [
13]. With the coming of Industry 4.0, there are demands for the integration of new materials and the optimization of product shapes. This responsibility of the industrial designer is aimed at sustainable production of products [
14]. The design of new products should make targeted use of recycled materials to reduce the use of primary raw materials in high-volume production. Considering the worldwide sales of power tools, it is necessary to optimise products even at this early stage of design. Global sales of power tools are expected to reach USD 48 billion in the year 2027 (an increase of 4.8% in 2020) [
15]. For these reasons, it is essential to focus on sustainable power tool production. Qualitative methods used in the early stages of design do not allow the use of LCA for principled reasons. Quantitative approaches require mass and material characteristics that are not known in the early stages of design. For these reasons, there is no approach/method that provides quantitative data using LCA at the early design stage. Quantitative approaches require weight and material characteristics that are not known. The volumetric approach that could capture product characteristics has not yet been applied, probably due to the time-consuming nature of processing extensive LCA. Can the amount of emissions CO
2 and energy consumption for production be based only on the volume and nature of the product? An important element in the EU is also informing consumers through the “Energy Labels” about energy consumption during the use phase. The missing information on consumption labels is the energy requirements for production, product packaging, and transport. This information could be furnished for power tools, and the consumer could choose a product that is more environmentally friendly. The European Product Database for Energy Labeling (EPREL) takes care of this registration and manufacturers are obliged to log in to the database. An overview of products that are subject to labelling is regulated by Regulation (EU) 2017/1369 of the European Parliament [
16,
17].
The purpose of the present research was to determine the environmental impact of selected power tools in an early stage of design without knowledge of their internal components. Tools and methods based only on qualitative data are available for the assessment of early stage product design. With regard to qualitative input, it was not possible to expect high-quality quantitative outputs. Quantitative approaches require a deep knowledge of LCA and a comprehensive knowledge of the products being analysed (material composition, manufacturing technology, etc.). The new approach will allow the determination of energy requirements and CO2 emissions at different ends of the life cycle based only on the proportions of the volume of the product, its typology, and the location of production. The new method will allow optimization of power tools production, volume proportions, application of production intensity labels, integration of knowledge in circular economy, potential of materials recycling in recycling centres, and shapes optimization by industrial designers. The advantage of the method is the high efficiency of work, without knowledge of LCA, and low requirements for input data (type and volume of product and place of production). The novelty of the method lies in linking a very early stage of product design with the LCA method, which has not been used before. Calculating the impact of EoL variants can be done with a single quantitative variable, namely, the volume of the product under evaluation.
2. Materials and Methods
The materials used were samples of power tools (manufactured between the years 1989 and 2018). These tool samples were analysed in the following basic steps:
Range of examined samples;
3D digitisation of samples;
Material and construction analysis;
LCA method;
LCA simulation of power tools.
2.1. Range of Examined Samples
The research was carried out with handheld power tools, which were obtained in cooperation with the recycling centre ENVIROPOL s. r. o. (Jihlava, Czech Republic). The selection was made without focusing on the type of tool, but considering the overall condition of the tool. A total of 134 pieces of power tools were analysed and subsequently categorised into 10 type groups according to type:
Random orbital sanders (6 pcs.);
Sheet sanders (16 pcs.);
Electric planers (9 pcs.);
Handle jigsaws (24 pcs.);
Belt sanders (7 pcs.);
Percussion drills (17 pcs.);
Circular saws (7 pcs.);
Angle grinders (26 pcs.);
Electric chainsaws (16 pcs.);
Reciprocating saws (6 pcs.).
The flowchart describes a procedure that involves preparing data for LCA and simulation after obtaining the resulting equations (
Figure 1).
2.2. 3D Digitisation of Samples
The volumetric properties of handheld power tools were determined by 3D scanning. Samples were analysed using an EinScan HD Pro handheld 3D scanner and a structural LED light using marking points and contours. Digitisation was performed in manual mode with the setting at medium details with a 0.7 mm accuracy. All 3D data obtained were in STL format and modified in Rhinoceros 7 software with subsequent determination of product volume in ml (accuracy to 0.001 mm
3). Sample of scanned power tools and theirs photographs (
Figure 2).
2.3. Material and Construction Analysis
The examined samples were disassembled into individual parts (bearings, cover, screws, bolts, springs, contacts, gears, etc.). The individual parts of the tool were weighed (Sartorius PMA7500 weight with a tolerance of 0.1 g), entered into MS Excel tables, and described in terms of materials used. Using the weight differences, the individual material properties of the combined parts of the tool, such as power line wires, stators, bearings, and some motion mechanisms, were calculated. To determine the exact quantity of individual materials, the rotors and stators were irreversibly disassembled (
Figure 3). All parts were weighed and further analysed after photographs were taken.
2.4. LCA Method
Life cycle assessment was performed using the OPM method. This LCA method provided a sufficient number of materials, processes, and possible EoLs. Power tools were developed in three EoL variants for each product:
Landfilling (100% of the materials are landfilled);
Combustion (materials that can be transformed into energy);
90% recycling (90% of the materials are linearly recycled).
The phase of the transport was carried out at intervals from (truck = 300 km a truck = 1700 km and van = 500 km) to (truck = 300 km, ship = 14,500 km, truck = 1700 km and van = 500 km). The sea transportation was determined and calculated for approximate distances by
https://sea-distances.org/ (accessed on 29 December 2021). The transport conditions were the same for landfilling, combustion and recycling (phases can be individually optimised). The product packaging material was calculated as cardboard B (200 g/m
2) and PE foil 0.1 mm. The size of the package was derived from the volume of the tool with the addition of 65/50/45 mm around the tool itself, including a horizontal and two vertical filling segments. During machining, 60.4% of the weight loss of the machined material was taken into account [
18]. The use phase was calculated for 1000 h and is not included in the overall calculations.
All 134 tool samples were subjected to LCA by the Oil Point Method (OPM) for end-of-life impacts—landfilling, combustion, 90% recycling—and with the rate of recycling course from 0% to 100%. Recycling rate was set to 45%, in accordance with the EU directive [
19] and turning point requirements for the end-of-life cycle combustion (the point where the amount of energy in combustion is equal to the energy recovered by recycling).
2.5. LCA Simulation of Power Tools
The simulation was based on data acquired from the analysis of individual groups of power tools focused on product volume and production energy requirements. The input data for the simulation were subjected to linear regression (LR) and tested for a normal distribution with a p-value < 0.05. Due to the time-consuming nature of individual LCA, a simulation using the Monte Carlo method was performed. The simulation for n = 1000 steps was used with individual groups of tools in the EoL variants of landfilling, combustion, and 90% recycling. Data from the input analysis with the normal distribution with the standard deviation of the baseline were processed at the test level alpha = 0.05. Subsequent analysis included linear regression to obtain line equations with 95% confidence with p-value < 0.05 (t-Test paired with a two-tailed distribution). The simulation was performed for two output categories with three EoL options:
Analysis of emissions kg CO
2 eq. was applied to countries CZ, PL, EE, SE, TR, BR, CN, IN, US, JP (according to ISO code 3166-1) and the United Kingdom as UK. The countries were selected with respect to different energy mixes. The results obtained from the simulation and energy mixes of individual states (values of kg CO
2 eq. per kWh as of June 2019) were used to calculate the emissions of kg CO
2 eq. [
20].
3. Results
The total weight of 134 pieces of power tools was 310 kg, with more than 9700 individual parts and material groups. Prior to processing with the LCA method, the power tool samples were sequentially photographed and scanned with a 3D scanner to determine the product volume. Product volumes ranged from 757 mL (angle grinders) to 5530 mL (electric chainsaws).
For material analysis the tools were disassembled into individual parts and inventoried for data preparation for LCA. Manufacturing operations were assigned to the given materials and parts (for example, reciprocating saw, see
Table 1). Inventory analysis showed that in the early 1990s, pure ABS was used to cover the products. Later it was composite materials PA6 and PA66 reinforced with between 30% and 50% GF. The construction of balancers and bearings are usually made of zinc alloy and aluminium alloy and steel. Flexible parts such as bearing housings are made of EPDM and PB. Brass and bronze were used for plain bearings and contacts. A significant amount of steel is used in electric motors in stator plates and armature of rotors, and copper in rotor windings, stator, and wires. The essential materials for power tools are steel, composite, copper, and aluminium (Dural), which have a significant impact on LCA calculations.
3.1. LCA Method
The LCA method for each tool contained a total of 402 individual EoL analyses, which were combined into product groups followed by linear regression. In 6 samples from 30 groups of categories the p-value was higher than significance level alpha. The reason for a p-value > 0.05 was the low number of samples analysed in a category, with high variability within a narrow tool volume interval. The dependence of volume and energy requirements on product production is evident despite the non-robust number of samples. There was no dependence of the tool power on the tool volume. However, this power input corresponds to the intended use phase. The use phase of 1000 h ranged between 125 W (1406 MJ = 391 kWh, energy for production compared to the use phase 7.5%) and 2200 W (24,750 MJ = 6875 kWh, energy for production compared to the use phase is 2.4%). The energy requirements for the packaging material were 8.537 MJ ± 0.270 MJ (landfilling), −3.862 MJ ± 0.122 MJ (combustion) and 11.374 MJ ± 0.359 MJ (90% recycling). The energy profiles obtained were unique for each individual sample and were not identical (landfilling, combustion, and 90% recycling).
3.2. Landfilling
The resulting life cycle in landfill mode reported zero values for all materials and EoL, according to the rules of the OPM method of the power tool example. The graph (
Figure 4) represents the energy requirements for production when all tool parts are landfilled (=0% recycling, no action on the integrity of the samples). It was found that a significant proportion of the materials in the tooling are steel, composite, aluminium/Dural, copper and zinc alloy. This proportion depends on the volume and category of the tool.
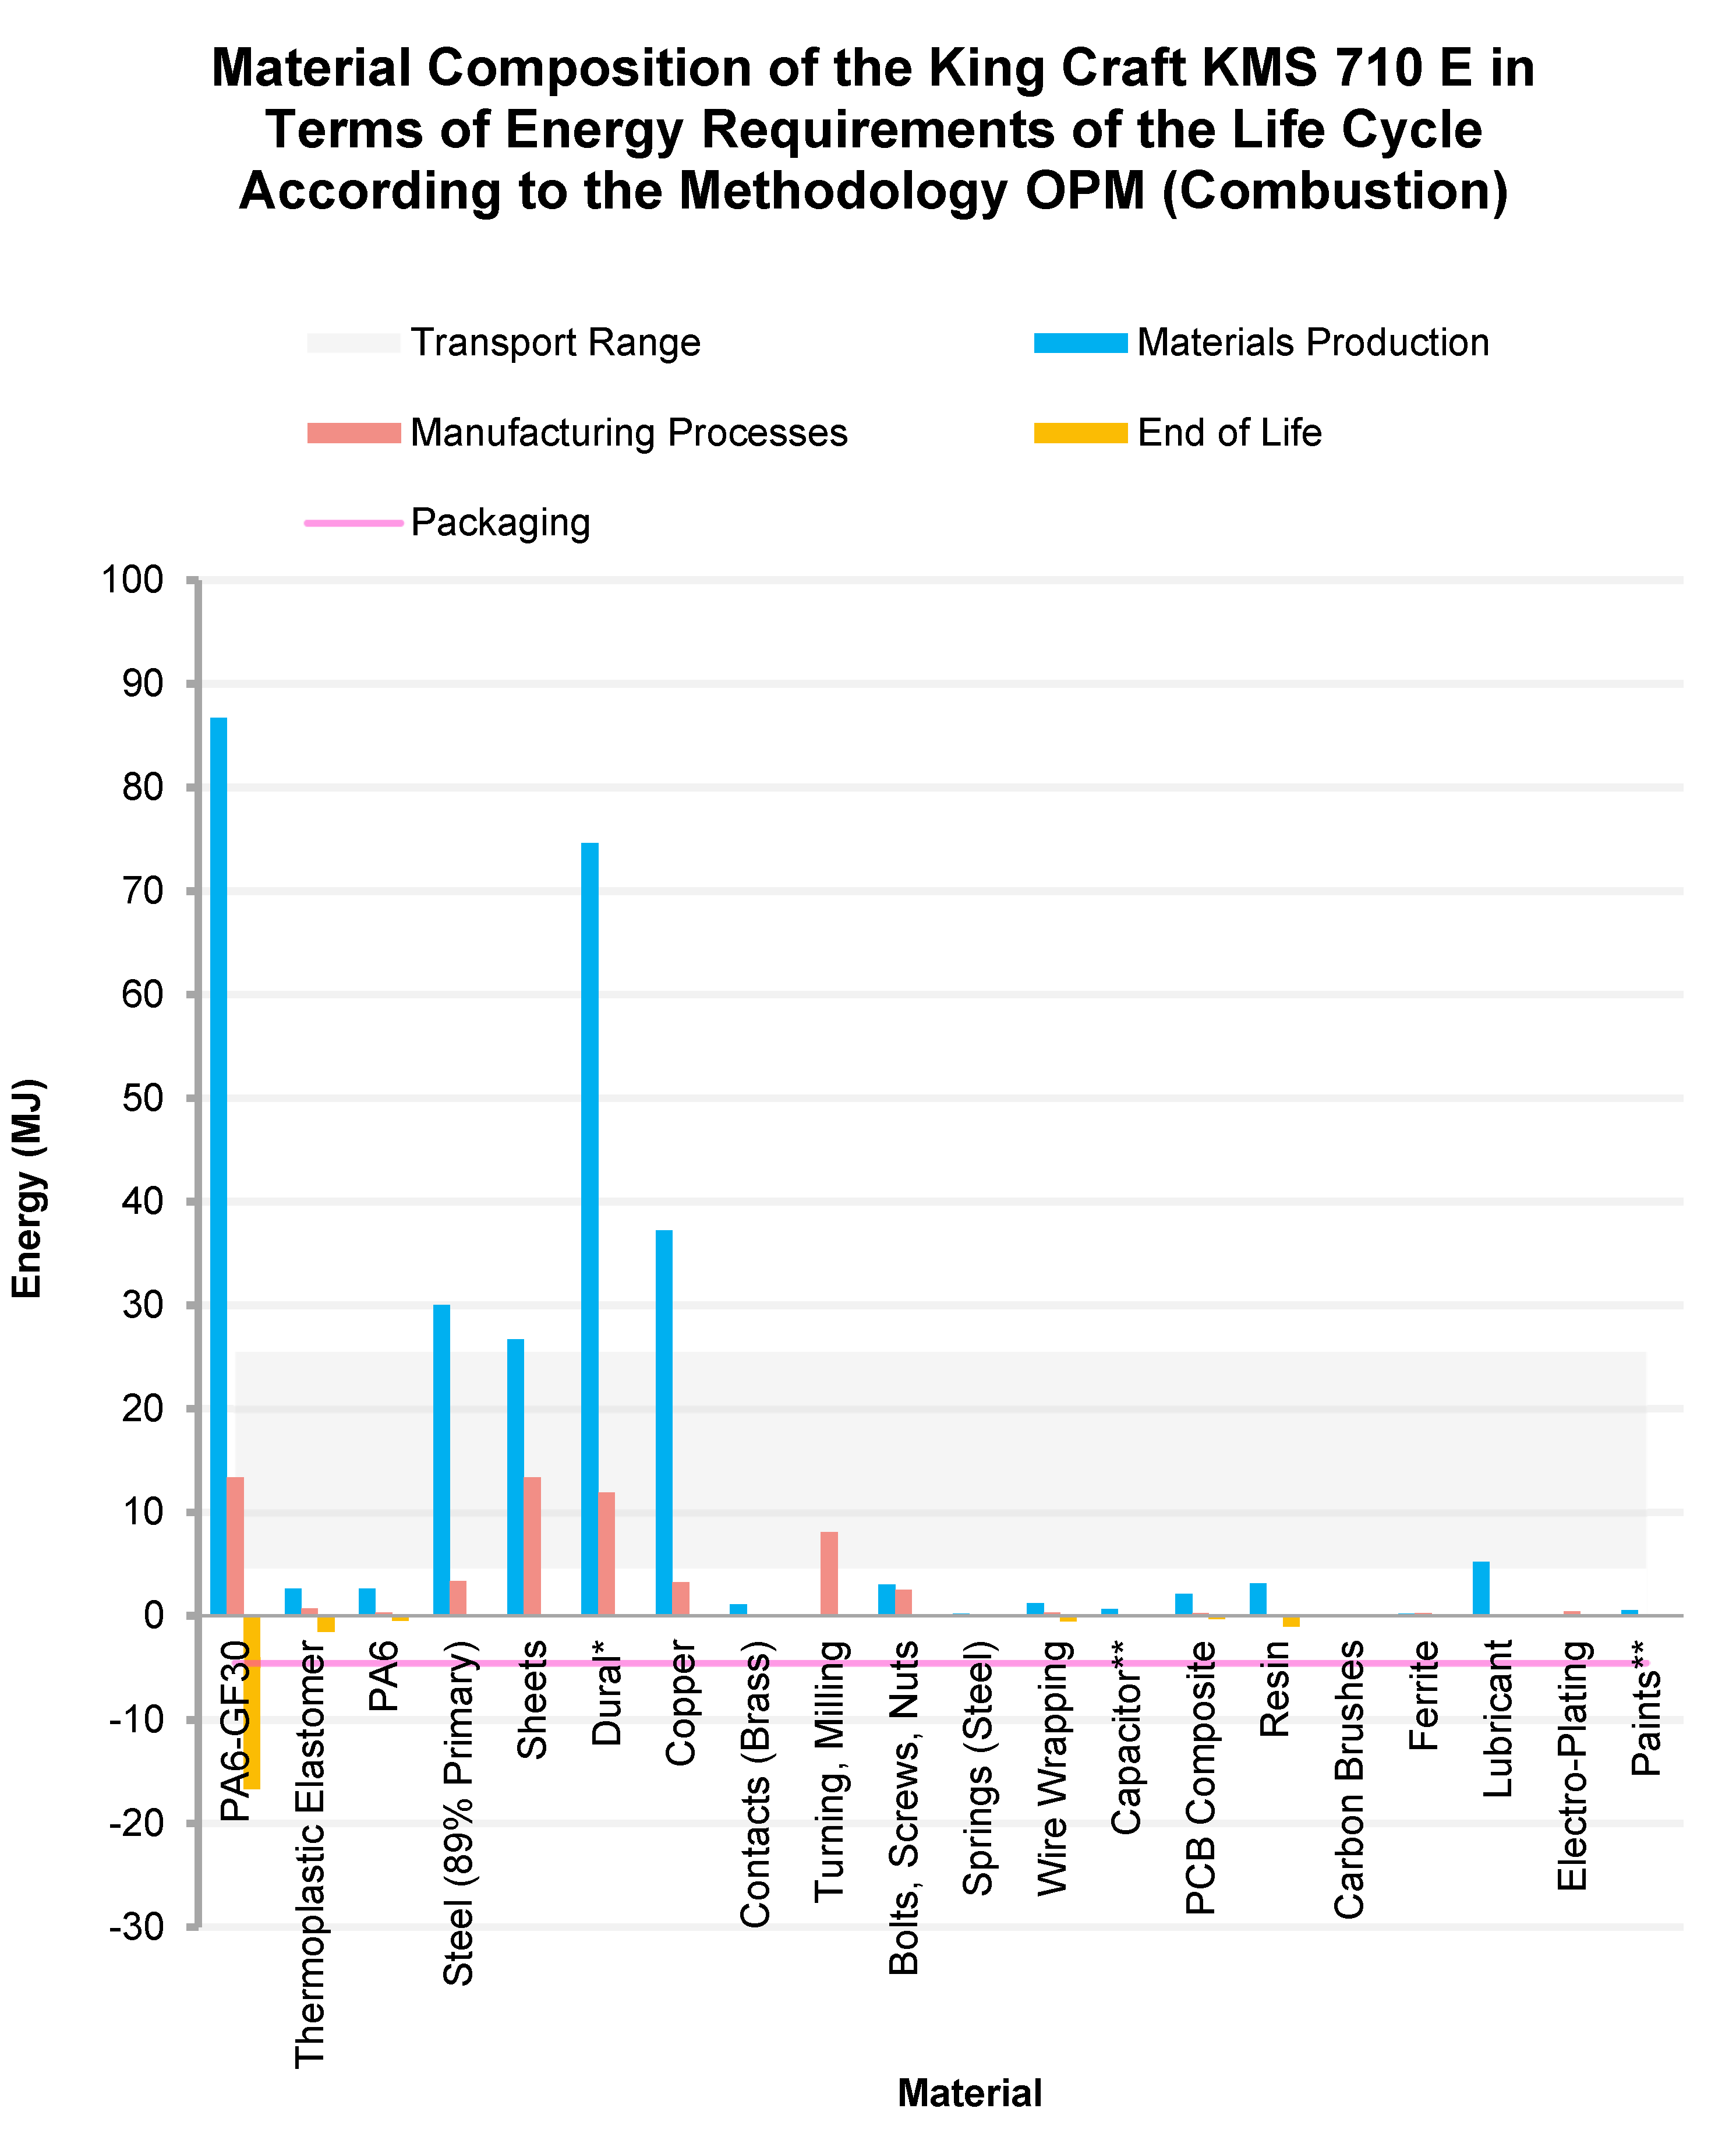
3.3. Combustion
The combustion mode (
Figure 5) was only possible for materials that contain feedstock share indicators, such as ABS, PP, PMMA, PVC, etc. The composite material PA6, PA66, PP, POM, PBT was used for energy only in percentages without glass fibres (GF) reinforcement. Capacitors, printed circuit boards (PCBs), V-Belts, and lubricants were also transformed to energy. The energy obtained from the combustion of the packaging material, which always had an energy potential, was also calculated. The highest possible value obtained was 6.017 MJ for electric chainsaws (the values depended on the size of the power tools). In the case of combustion, the energy in MJ is transferred to an independent system.
3.4. Turning Point & 90% Recycling
For products with a high proportion of used plastic on the inner part and on the outer covers, it was not possible to find a turning point on the entire recycling scale from 0% to 100%. The return of some types of plastic back into circulation is energetically demanding due to the multiple values of fuel share (recycling) compared to the values of feedstock share (landfilling). Recycling requires a high amount of energy for shredding, separation, and re-melting (
Figure 6). The average reduction in energy requirements for product recycling compared to EoL landfilling is 13.2% ± 1.6%. The maximum energy saved by recycling was 32.4%. The increase in energy requirements for EoL (90% recycling) is only in 13 out of 134 tools, with an average value of 1.6% ± 0.8% (maximum increase was 6.2%). In 47 cases, the turning point was more energetically difficult than the demand of the EU for 45% recycling. The location of the turning point is shown in the graph (
Figure 7). In 45.5% of cases, it was not possible to find a turning point on the whole recycling scale from 0% to 100%.
3.5. Simulation Monte Carlo
The acquired data showed the dependence of product volume on the energy used for power tool production. It was found that the most accurate correlation coefficient r
xy for the tool group of angle grinders reach from 96.7% to 97.5%. The smallest value of the correlation coefficient r
xy was found in sheet sanders, from 60.8% to 72.8% (
Table 2). A value above 0.60 showed a strong dependence on a perfect positive association of almost 1.00. All simulations were performed with 95% confidence with
p-value < 0.05. They described how the model captures the data. The graph of the dependence of the volume on the energy requirements for production shows the division of tools into groups according to categories (
Figure 8). The values of the r
xy correlation coefficients obtained from the simulations were highly dependent on the data obtained from the LCA. In the case of high r
xy values, they confirmed the dependence of the input data. For a low r
xy value of about 0.6, the data were from a small number of samples on a short range of volumes with a large variability of the tool energy, especially for landfilling (for 90% recycling the variability was smaller and from this point of view was r
xy higher, not valid for random orbital sanders and belt sanders when the number of samples was low). These categories were further divided into 3 variants of EoL (example on
Figure 9).
The low dependence of power tools volume and energy requirements on product production is due to the high number of individual parts in a small volume and is characteristic of percussion drills, angle grinders, and reciprocating saws. Some tools, such as sheet sanders, circular saws and handle jigsaws, are larger in volume for ergonomic reasons, for sufficient grip and guidance of the tool, for example. This phenomenon is manifested by the high internal volume of air within the tool due to the different construction design of the products (high variability of tool design) and thus a low value of rxy.
3.6. Emission CO2
Simulation of emissions kg CO
2 eq. was derived from data obtained from production energy requirements in MJ (values were converted to kWh). Final emission values kg CO
2 eq. for individual product categories were recalculated and graphically equal to the energy requirements in kWh (
Table 3). Emissions kg CO
2 eq. for individual states were the average energy requirements for the production of individual groups of tools (
Figure 10). Emissions of the selected countries (
Table 4) kg CO
2 eq. per kWh corresponded to their energy mixes and thus their order values ranged between 93 g CO
2 eq. per kWh for SE (Sweden) up to 875 g CO
2 eq. per kWh for EE (Estonia) [
20].
4. Discussion
In this research, the energy requirements for the production of handheld power tools and calculations of kg CO2 eq. were included. The results presented significant differences at the three ends of end of life (landfilling, combustion, and 90% recycling) and also at 0–100% recycling calculations. The data was obtained from individual power tool analyses and further statistically processed. For statistical processing of the data, the t-test paired with a two-tailed distribution with alpha value = 0.05 was used. In general, 20% of the 10 categories of power tools had p-values > 0.05. These tools were not excluded from the following simulations. The 10 product categories were used for the simulation with 95% confidence and a p-value < 0.05.
End-of-life energy requirements for the power tool categories were logically ordered from the highest landfilling, combustion, and 90% recycling (in two cases 90% recycling was more energy intensive than combustion). This was due to the high proportion of recycled plastics. In total, in 74 cases of individual tool samples, recycling was more energy intensive (the reason for this is the technological processes involved in recycling: shredding, separation, and re-milling). This phenomenon was only for products with a high proportion of plastic components. Using Monte Carlo simulation, missing samples were calculated to refine the volume dependencies on the energy requirements of production, and equations were obtained. The packaging energy requirements for EoL landfilling were 8.5 MJ ± 1.1 MJ; this value corresponds to 5.5% of the total energy expenditure for production. For 90% recycling, the energy per packaging material was 11.4 MJ ± 1.3 MJ. The results are consistent with those found for cardboard packaging with similar parameters [
21]. The energy savings for 90% recycling goes towards zero recycling (full landfilling) a maximum of 32.4% (average achievement is 13.3% ± 4.9%). The values correspond to the most represented materials, namely steel, aluminium, copper, and plastic. This reduction corresponds to a statistical reduction potential of up to 27% ± 9.0% (theoretical value) [
22]. The different values of energy savings are due to the level of recycling of each material. This level has been calculated with the linear recycling level of each material. The global values of the recycling potential by 2050 are calculated to be 64% steel, 94% aluminium, and 55% plastic, and the amount of energy to produce them decreases as the recycling percentage increases [
23]. The r
xy values of the indicators are in the range from 60.8% to 97.5% and reflect the amount of variability of the simulation model. Higher percentage r
xy values are due to the smaller volume of air inside the tool and to very similar material composition (the package encloses close internal components both in the grip area and in the gearbox area). From the volume and material properties, it is possible to derive their carbon footprint according to the location of production and the subsequent use phase. It is clear from the results that the amount of emissions kg CO
2 eq. depends on the energy mix of the countries where they are produced. From the selected countries, SE (Sweden) is the best in terms of carbon footprint and EE (Estonia) the worst. The calculation of emissions has the same characteristics as the energy requirements for the production of power tools, as they are derived and recalculated from it. The proposed method includes a use phase (1000 h), but is not included in the calculation equations (energy requirements and CO
2 emissions) to determine the energy requirements for tool production. The energy requirement of each power tool is determined by its power input and time of use, which determine the dominant part of the product life cycle. The method does not take into account maintenance costs and also service interventions on the products, due to the lack of data for a more detailed evaluation. Currently, no research has been conducted in the area of designing and assessing power tools based on the volume proportions of the product. This is a completely new approach that can be most closely compared to the method that has been used for a long time in the construction industry in the Czech Republic. The statistical method “price indices in the construction industry” is used for quick valuation of categorised types of buildings according to the “uniform classification of construction objects” (houses, bridges, etc.), using the external volume of the building [
24]. Buildings are made up of basic materials and elements according to the same principle as power tools. In the construction industry, outputs are given in monetary units relative to their volume, and in the new VEME method (Volumetric Evaluating Method for Ecodesign), outputs are given in energy units also relative to their volume.
Research was carried out on power tools, and samples were selected according to their condition and frequency in the electrical waste. The sample range represented a cross section of products from 1989 to 2018 and does not include all existing types of power tools. The OPM that was used for LCA calculations provided relevant results, as the quality of the method has previously been compared with EDIP and Eco-Indicator 95 [
11]. CO
2 emissions were recalculated from kWh only for the production of selected countries, according to the Carbon Footprint June 2019 [
20]. The calculations of CO
2 emissions from kWh were indicative and the issues involved in determining them are very extensive and complicated. The energy intensity of production, including kg CO
2 eq. emissions, should motivate manufacturers to make production more environmentally friendly, but also to optimise material flows, including volume proportions, at an early stage of product design. This responsibility lies mainly with the industrial designers who design products [
14]. An increase in the price of the emission allowances will logically lead to the optimisation of the production location and the reduction of energy requirements [
25]. Optimisation for a single product may seem insignificant, but for millions of tools produced, it already has a significant impact. The energy intensity for the production of raw materials and the price of materials are closely linked [
26]. The potential of research can be targeted at enlarging the range of power tools samples, converting volume characteristics to weight properties, transforming electric engines from alternating current (AC) to direct current (DC), and optimising transport range and location of pollutions.
5. Conclusions
The volume characteristics of handheld power tools and the energy requirements for their production represent interdependencies. The life cycle, especially of EoL power tools, is influenced by the type of tool, the material used, and the volume characteristics of the tool. According to the performed analysis, the volume of the power tool consists of a set of parts, which as a result must meet the economic, constructional, and ergonomic requirements for the product. Large amounts of plastics (PA, PA66, Epoxy, PU, PC, PET film, and PMMA) with a high fuel share content impair the efficiency of recycling. Tools with a high proportion of these plastics (e.g., electric chainsaws and handle jigsaws), including GF-reinforced plastics, have the same or worse results in recycling as in landfilling (only in 13 samples out of 134). The energy requirements for tool transport can be twice the energy required to produce its packaging. The method for the analysis of power tools is based on OPM without knowledge of LCA software (Gabi, SimaPro, open LCA), which requires expensive training of the solver and is easily integrated into MS Excel. The method provides a simplified analysis target on the volumetric characteristics of the power tools. With the help of established equations, it is possible to quickly determine the energy requirements for their production. The equations of the overall analysis are divided into 10 main groups according to the type of power tool. These groups contain 60 equations (kWh and MJ) describing product production requirements and 30 equations for determining emissions (kg CO2 eq.). To determine the emissions (kg CO2 eq.) according to the geographical location of the production location, 11 equations are set.
It was found that different product types (angle grinders, belt sanders, etc.) have different material and structural characteristics, depending on the volume. With 90% recycling, it is possible to save up to 32.4% of energy compared to landfilling. Of all 134 samples, 9.7% of the quantity of recycled samples required up to 6.2% more energy than landfilling. This is because of the high energy requirements for material recycling. In some cases, incineration is more effective than recycling materials (especially plastic) due to the high fuel share values compared to the feedstock share values.
The method provides an optimization tool for product development, production, and determination of kg CO2 eq. emissions according to the energy mixes of individual countries. The new approach can be used by designing products in industrial design and in the areas of economic evaluation of the method and place of production. The contribution of the conducted research is the acquisition of knowledge in the areas of energy requirements for production according to different variants of EoL with respect to the volume proportions of products. The acquired knowledge can be used not only in production optimisation, but also in educational activities of industrial designers at the early stage of product design. Future research will focus on the addition of other categories of products in the field of power tools and their expansion. Another possibility is the application of the method to household appliances, for example. The potential of this research enables the extension of energy labelling of products (consumption) by energy requirements for the production of tools, transport, and packaging. The weak point of this method is the determination of parameters (kWh, MJ and kg CO2 eq.) from equations at low product volumes in three EoL studies. The knowledge of the research has given rise to the new VEME method. This method, using the proposed software, allows industrial designers to directly evaluate the environmental and economic impacts by input two parameters (volume and typology of the products) and subsequently optimise the final design of the product. The advantage of this software is that it is easy to use, without the need for knowledge of LCA, and can be used by the general public. This software is available online at VEME.cz
Author Contributions
Conceptualization, R.S. and M.T.; methodology, R.S. and M.T.; software, R.S.; validation, R.S.; formal analysis, R.S.; investigation, R.S.; resources, R.S.; data curation, R.S.; writing—original draft preparation, R.S. and E.F.; writing—review and editing, R.S., M.T. and E.F.; visualization, R.S.; supervision, R.S. and M.T.; project administration, R.S. and E.F.; funding acquisition, R.S. and E.F. All authors have read and agreed to the published version of the manuscript.
Funding
This research was funded by grant number No. FSI-S-20-6481 (Brno University of Technology, Faculty of Mechanical Engineering).
Institutional Review Board Statement
Not applicable.
Informed Consent Statement
Not applicable.
Data Availability Statement
The data presented in this study are available on request from the corresponding author.
Acknowledgments
The authors thank ENVIROPOL s. r. o. for lending us samples of power tools for analysis and also the Brno University of Technology (Faculty of Mechanical Engineering) for providing the workshop and equipment.
Conflicts of Interest
The authors declare no conflict of interest for this study.
References
- UNFCCC. The Paris Agreement. 2015. Available online: http://unfccc.int/files/essential_background/convention/application/pdf/english_paris_agreement.pdf (accessed on 8 June 2021).
- International Organization for Standardization. ISO 14040 Environmental Management-Life Cycle Assessment-Principles and Framework. 2006. Available online: https://www.iso.org/standard/38498.html (accessed on 13 December 2019).
- Life Cycle Assessment (LCA)—Complete Beginner’s Guide. 2019. Available online: https://ecochain.com/knowledge/life-cycle-assessment-lca-guide/ (accessed on 20 March 2021).
- Luttropp, C.; Lagerstedt, J. EcoDesign and The Ten Golden Rules: Generic Advice for Merging Environmental Aspects into Product Development. J. Clean. Prod. 2006, 14, 1396–1408. [Google Scholar] [CrossRef]
- Topic 7: Life Cycle Analysis: Introduction and Background. RMIT University|Melbourne|Australia. Available online: https://www.dlsweb.rmit.edu.au/conenv/envi1128/focus3/f3_t7_q37.htm (accessed on 4 May 2021).
- Hemdi, A.R.; Mat Saman, M.Z.; Sharif, S. Indicator for Measuring Sustainable Product Design: A Review and Further Research. In Proceedings of the 1st International Congress of Sustainability Science and Engineering, Cincinnati, OH, USA, 9–13 August 2009. [Google Scholar]
- Byggeth, S.; Hochschorner, E. Handling Trade-Offs Ecodesign Tools for Sustainable Product Development and Procurement. J. Clean. Prod. 2006, 14, 1420–1430. [Google Scholar] [CrossRef]
- Hochschorner, E. Life Cycle Thinking in Environmentally Preferable Procurement; Royal Institute of Technology: Stockholm, Sweden, 2008; ISBN 978-917-1789-105. [Google Scholar]
- Knight, P.; Jenkins, J.O. Adopting and Applying Eco-Design Techniques: A Practitioners Perspective. J. Clean. Prod. 2009, 17, 549–558. [Google Scholar] [CrossRef] [Green Version]
- Weinzettel, J. Life Cycle Assessment (LCA) and Input-Output Analysis (IoA): Interconnections in the Acquisition of Una-Vailable Data. Dissertation Thesis, Czech Technical University in Prague, Praha, Czech Republic, 2008. (In Czech). [Google Scholar]
- Bey, N. The Oil Point Method—A Tool for Indicative Environmental Evaluation in Material and Process Selection. Ph.D. Thesis, Technical University of Denmark, Lyngby, Denmark, 2000. [Google Scholar]
- Vallet, F.; Eynard, B.; Millet, D.; Mahut, S.G.; Tyl, B.; Bertoluci, G. Using Eco-Design Tools: An Overview of Experts’ Practices. Des. Stud. 2013, 34, 345–377. [Google Scholar] [CrossRef]
- Lofthouse, V. Investigation into the Role of Core Industrial Designers in Ecodesign Projects. Des. Stud. 2003, 25, 215–227. [Google Scholar] [CrossRef] [Green Version]
- Kuys, B.; Koch, C.; Renda, G. The Priority Given to Sustainability by Industrial Designers within an Industry 4.0 Paradigm. Sustainability 2021, 14, 76. [Google Scholar] [CrossRef]
- Khandelwal, P. Power Tools Market by Mode of Operation (Electric, Pneumatic, and Others), Tool Type (Drills, Material Removal Tool, Saws, Wrenches, and Others), and Application (Industrial and Do-It-Yourself (DIY)): Global Opportunity Analysis and Industry Forecast, 2020–2027. Available online: https://www.alliedmarketresearch.com/power-tools-market (accessed on 19 January 2022).
- Energy Labelling Product Database—European Commission. 2019. Available online: https://ec.europa.eu/info/energy-climate-change-environment/standards-tools-and-labels/products-labelling-rules-and-requirements/energy-label-and-ecodesign/product-database_en (accessed on 19 March 2021).
- Regulations. Regulation (EU) 2017/1369 of the European Parliament and of the Council of 4 July 2017. Available online: https://eur-lex.europa.eu/legal-content/EN/TXT/PDF/?uri=CELEX:32017R1369&from=EN (accessed on 20 March 2021).
- Loglisci, G.; Priarone, P.C.; Settineri, L. Cutting Tool Manufacturing: A Sustainability Perspective. 2013. Available online: https://www.gcsm.eu/Papers/76/8.3_48.pdf (accessed on 29 April 2021).
- Directive 2012/19/EU of the European Parliament and of the Council. 2012. Available online: https://eur-lex.europa.eu/legal-content/EN/TXT/HTML/?uri=CELEX:02012L0019-20180704&from=EN (accessed on 19 August 2021).
- Carbon Footprint Country Specific Electricity Grid Greenhouse Gas Emission Factors. 2019. Available online: https://www.carbonfootprint.com/docs/2019_06_emissions_factors_sources_for_2019_electricity.pdf (accessed on 13 May 2021).
- Yi, Y.; Wang, Z.; Wennersten, R.; Sun, Q. Life Cycle Assessment of Delivery Packages in China. Energy Proced. 2017, 105, 3711–3719. [Google Scholar] [CrossRef]
- Worrell, E.; Carreon, J.R. Energy Demand for Materials in an International Context. Philos. Trans. R. Soc. A Math. Phys. Eng. Sci. 2017, 375, 20160377. [Google Scholar] [CrossRef] [PubMed]
- Sahni, S. Strategies for Reducing Energy Demand in The Materials Sector. Ph.D. Thesis, Massachusetts Institute of Technology, Cambridge, MA, USA, 2013. [Google Scholar]
- Czech Building Standards: Price Indicators in the Construction Industry. 2021. Available online: http://www.stavebnistandardy.cz/default.asp?Bid=6&ID=6 (accessed on 19 January 2022). (In Czech).
- EU Emissions Allowance Prices in the Context of the ECB’s Climate Change Action Plan. 2021. Available online: https://www.ecb.europa.eu/pub/economic-bulletin/focus/2021/html/ecb.ebbox202106_05~ef8ce0bc70.en.html (accessed on 30 November 2021).
- Gutowski, T.G.; Sahni, S.; Allwood, J.; Ashby, M.F.; Worrell, E. The energy required to produce materials: Constraints on energy-intensity improvements, parameters of demand. Philos. Trans. R. Soc. London. Ser. A Math. Phys. Eng. Sci. 2013, 371, 20120003. [Google Scholar] [CrossRef] [PubMed]
| Publisher’s Note: MDPI stays neutral with regard to jurisdictional claims in published maps and institutional affiliations. |
© 2022 by the authors. Licensee MDPI, Basel, Switzerland. This article is an open access article distributed under the terms and conditions of the Creative Commons Attribution (CC BY) license (https://creativecommons.org/licenses/by/4.0/).


