1. Introduction
Under the background of climate change, achieving “Carbon Neutrality” has become a common goal of the international community [
1,
2,
3,
4,
5,
6]. EECE accounts for 25% of the global total, which further contributes to global warming [
7]. For the “Carbon Neutrality” implementation plan formulation, reducing export embodied carbon emissions (EECE) was an important aspect [
8,
9,
10,
11,
12,
13].
The production process of a certain export product extended from the raw materials acquisition to the final product output. All direct and indirect carbon emissions generated during the entire production process of an export product are the EECE. The EECE has an important impact on the total regional carbon emissions [
14,
15,
16]. China is the largest CO
2 emitter in the world [
17]. Its EECE accounted for nearly 30% of national emissions and was one of the important reasons that the total carbon emissions remained high [
18,
19,
20,
21,
22,
23]. The production of a certain export product not only caused the carbon emissions of an export province, but also have the domestic spillover effects (DSE) on other provinces. The DSE is the carbon emissions generated by providing raw materials for export products, which are transmitted through inter-provincial trade. In 2017, the total DSE of EECE was 580 MtCO
2 in China, which seriously affected the interregional carbon emission pattern [
24]. Therefore, EECE and its DSE cannot be ignored in the formulation of regional carbon emission reduction policies. In recent years, the issue of EECE has gradually attracted the attention of the academic community [
25,
26,
27,
28,
29]. However, the existing achievements were limited to the research on EECE itself, rather than the DSE [
30,
31,
32,
33,
34]. Most of the research only looked at the level of spatial-temporal pattern analysis and rarely analyzed the sectoral sources. In addition, the existing studies lacked empirical research on targeted adjustment countermeasures, which could not effective support the “Carbon Neutrality”.
Based on the above analysis, we found that the existing research results did not answer the following scientific questions well:
Research Question 1: What was the spatial-temporal evolution pattern of EECE and its DSE for the typical region?
Research Question 2: How do we reduce the EECE and its DSE?
Research Question 3: What are the carbon reduction effects of the adjustment countermeasures for EECE?
From 2007 to 2017, the EECE of China was mainly concentrated in five provinces, and EECE intensity mostly decreased. Only Liaoning Province has the largest EECE intensity and EECE growth from 2012 to 2017. Therefore, we selected Liaoning Province as the research object. Based on the multi-region input-output tables of China, we applied the Multi-region Input-output Model (MRIO Model) and ArcGIS spatial analysis tools, constructed the Coupling Relationship Model (CR Model) for trade value and carbon emissions, quantitatively assessed the EECE and its DSE for Liaoning Province, depicted the spatial-temporal evolution pattern, proposed sectoral adjustment countermeasures, and evaluated the adjustment effects. The conclusions could provide a decision-making basis for the case area to formulate lower-cost and better-effective carbon reduction adjustment countermeasures. It could also provide a reference and scientific support for achieved “Carbon Neutrality” and sustainable development in similar regions of the world with rapid growth in EECE.
The rest of this paper was organized as follows:
Section 1 was the introduction,
Section 2 reviews the relevant literature,
Section 3 introduces the general situation of the study area,
Section 4 discusses the methodological model,
Section 5 and
Section 6 involve the results analysis and adjustment countermeasures, and
Section 7 includes the conclusions of the paper.
2. Literature Review
2.1. Research on EECE
The primary problem of reducing the EECE was the scientific accounting of the amount [
35,
36,
37,
38,
39,
40,
41]. Many scholars have carried out related researches. Sato et al. [
42] calculated the EECE from 1995–2007 and found that EECE has the most obvious negative effects, accounting for 10–45% of total carbon emissions in China. Wang et al. [
19] calculated the EECE of global high-tech products in China in 2011, and found that it accounted for 73.20% of total global EECE.
EECE has an important impact on the global carbon emission pattern [
43,
44,
45,
46,
47]. Zhong et al. [
48] analyzed the EECE spatial-temporal evolution of 39 countries, and found that the EECE transformed from developing countries to developed countries from 1995 to 2011. Zhang et al. [
49] found that 72% of the embodied air pollution (including carbon monoxide, sulfur dioxide, etc.) of the export trade was borne by central and western regions of China in 2012, which were the less developed regions.
With the continuous deepening of EECE research, a global discussion of the EECE adjustments has arisen. Some scholars have proposed that more scientific sectoral structure adjustment countermeasures and more reasonable carbon reduction countermeasures should be formulated. Sun et al. [
50] proposed the adjustment countermeasures of the sectoral EECE in China, such as increasing the exports of 10 sub-sectors. Xu et al. [
51] found that most EECE were concentrated in a few sectoral areas in China, and that in the globally integrated market, China could reduce its emission intensity by introducing advanced technologies and management systems from developed countries.
2.2. Research on DSE of EECE
The research of the EECE and its DSE was still in the initial stages. Only a few scholars have explored its account and the spatial patterns of large regional scales. Guo et al. [
14] considered that EECE has an important impact on carbon emissions in different parts of the country. As a result of the 2008 financial crisis, the exports of China declined rapidly, which results in a decline in the growth rate of carbon emissions in eastern and central China to 3.96% and 5.86%, respectively. Meng et al. [
52] studied the EECE and its DSE of energy-intensive intermediate products in 2012. He divided China into eight regions. The central region was a major supplier of highly energy-intensive intermediate products that are exported to coastal areas. The central region was also a major suffer region with the DSE of EECE for coastal areas.
In summary, the existing studies lacked the provincial spatial-temporal pattern analysis of EECE and its DSE. Less research was carried on the EECE sectoral sources, adjustment countermeasures, and even the countermeasures effects. It was unable to meet the actual needs of scientific carbon reduction policy formulation and the “Carbon Neutrality” target realization. Such issues need to be researched in depth as soon as possible.
3. Study Area
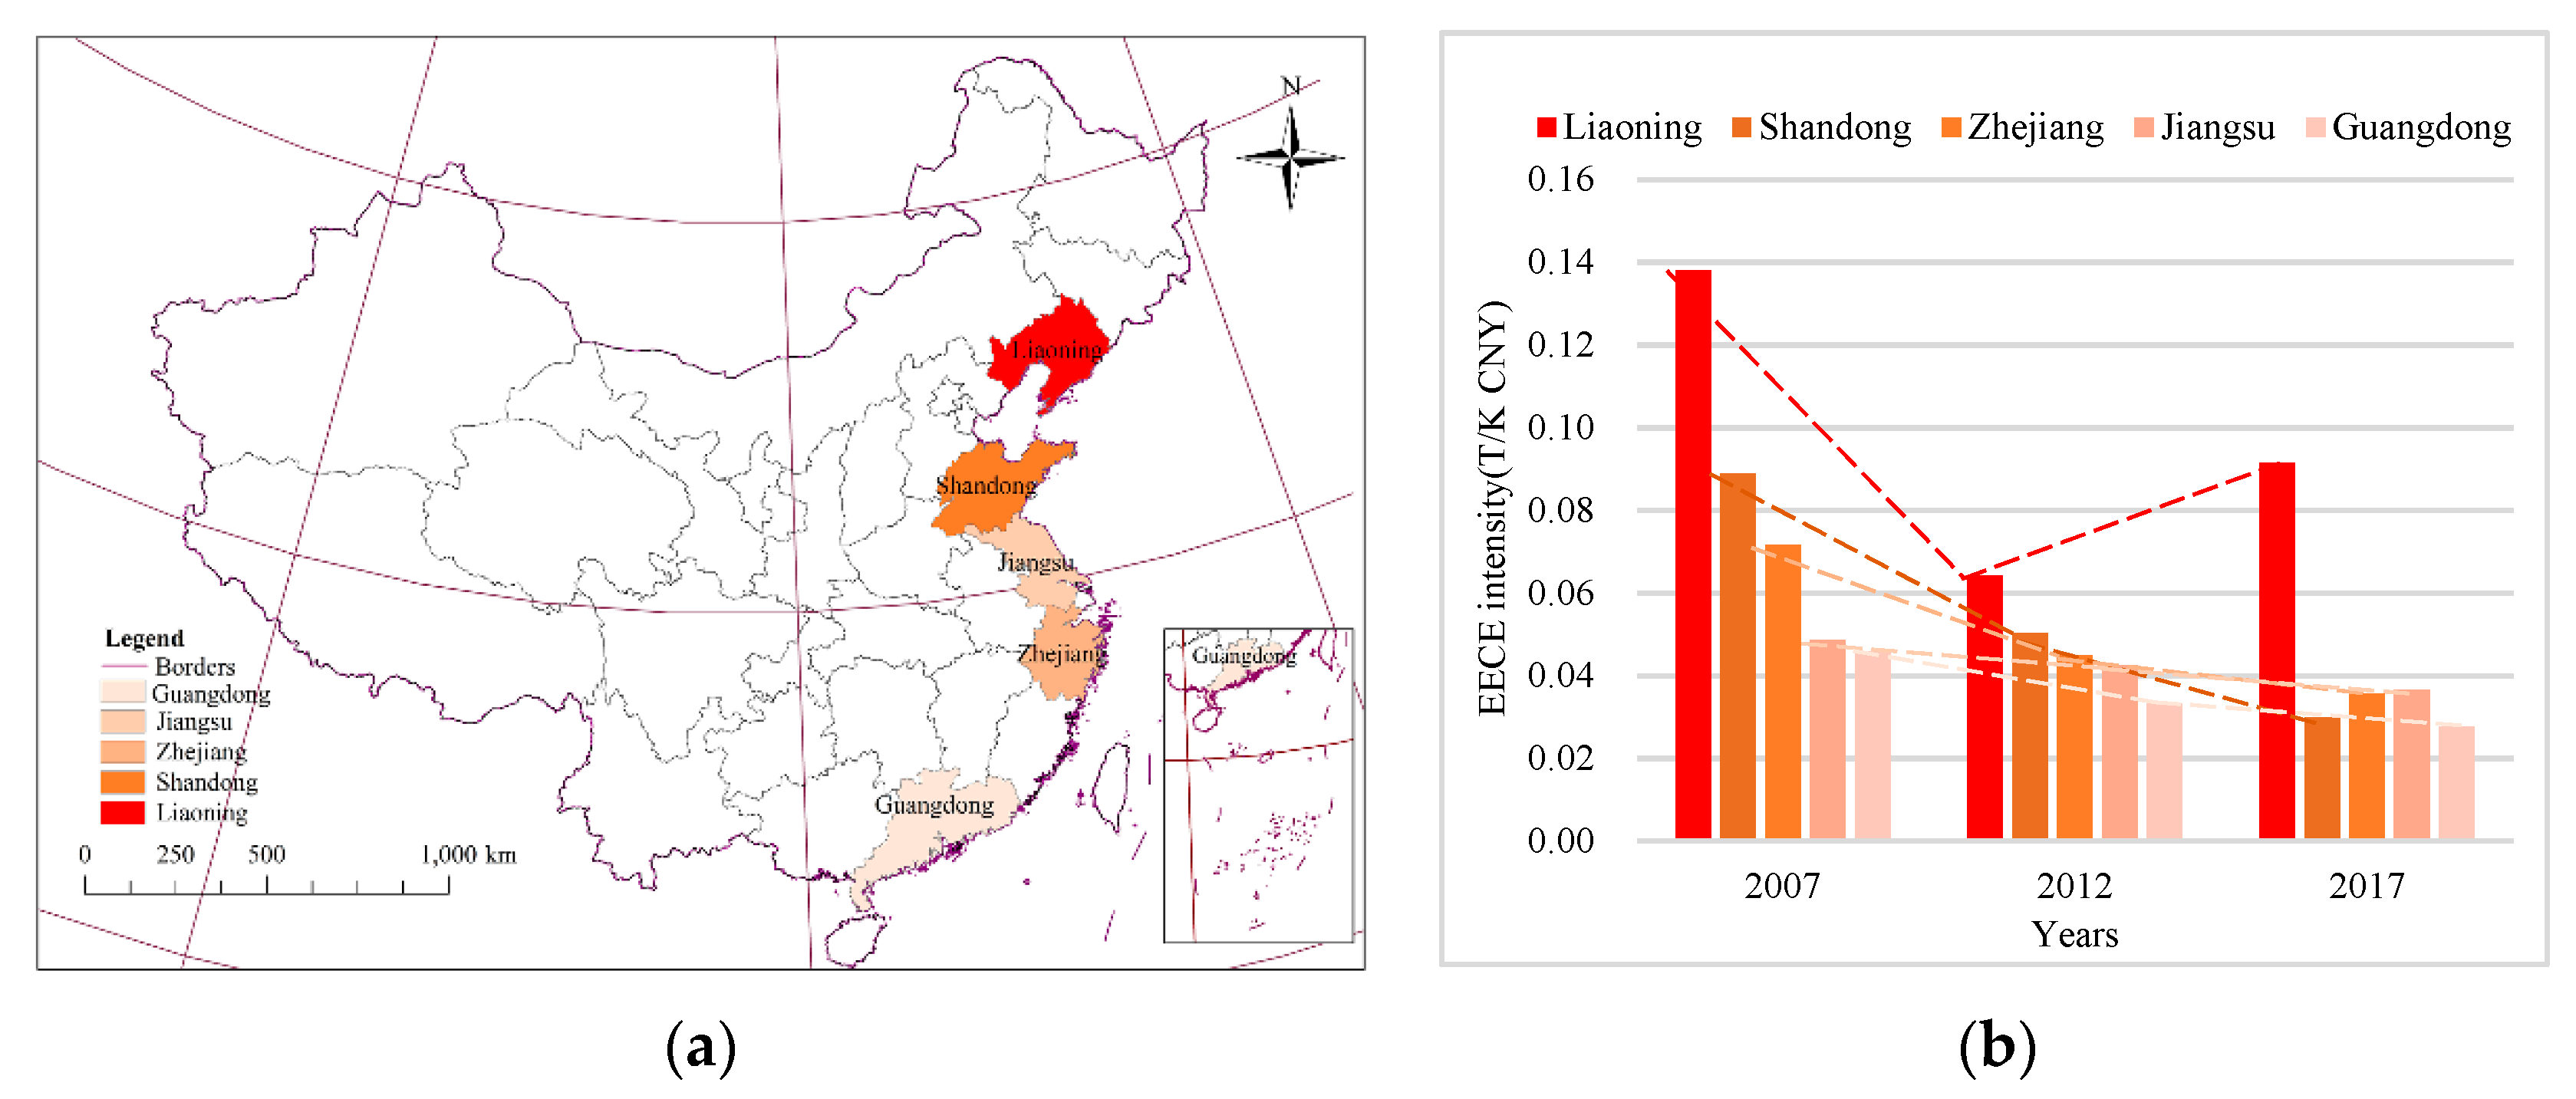
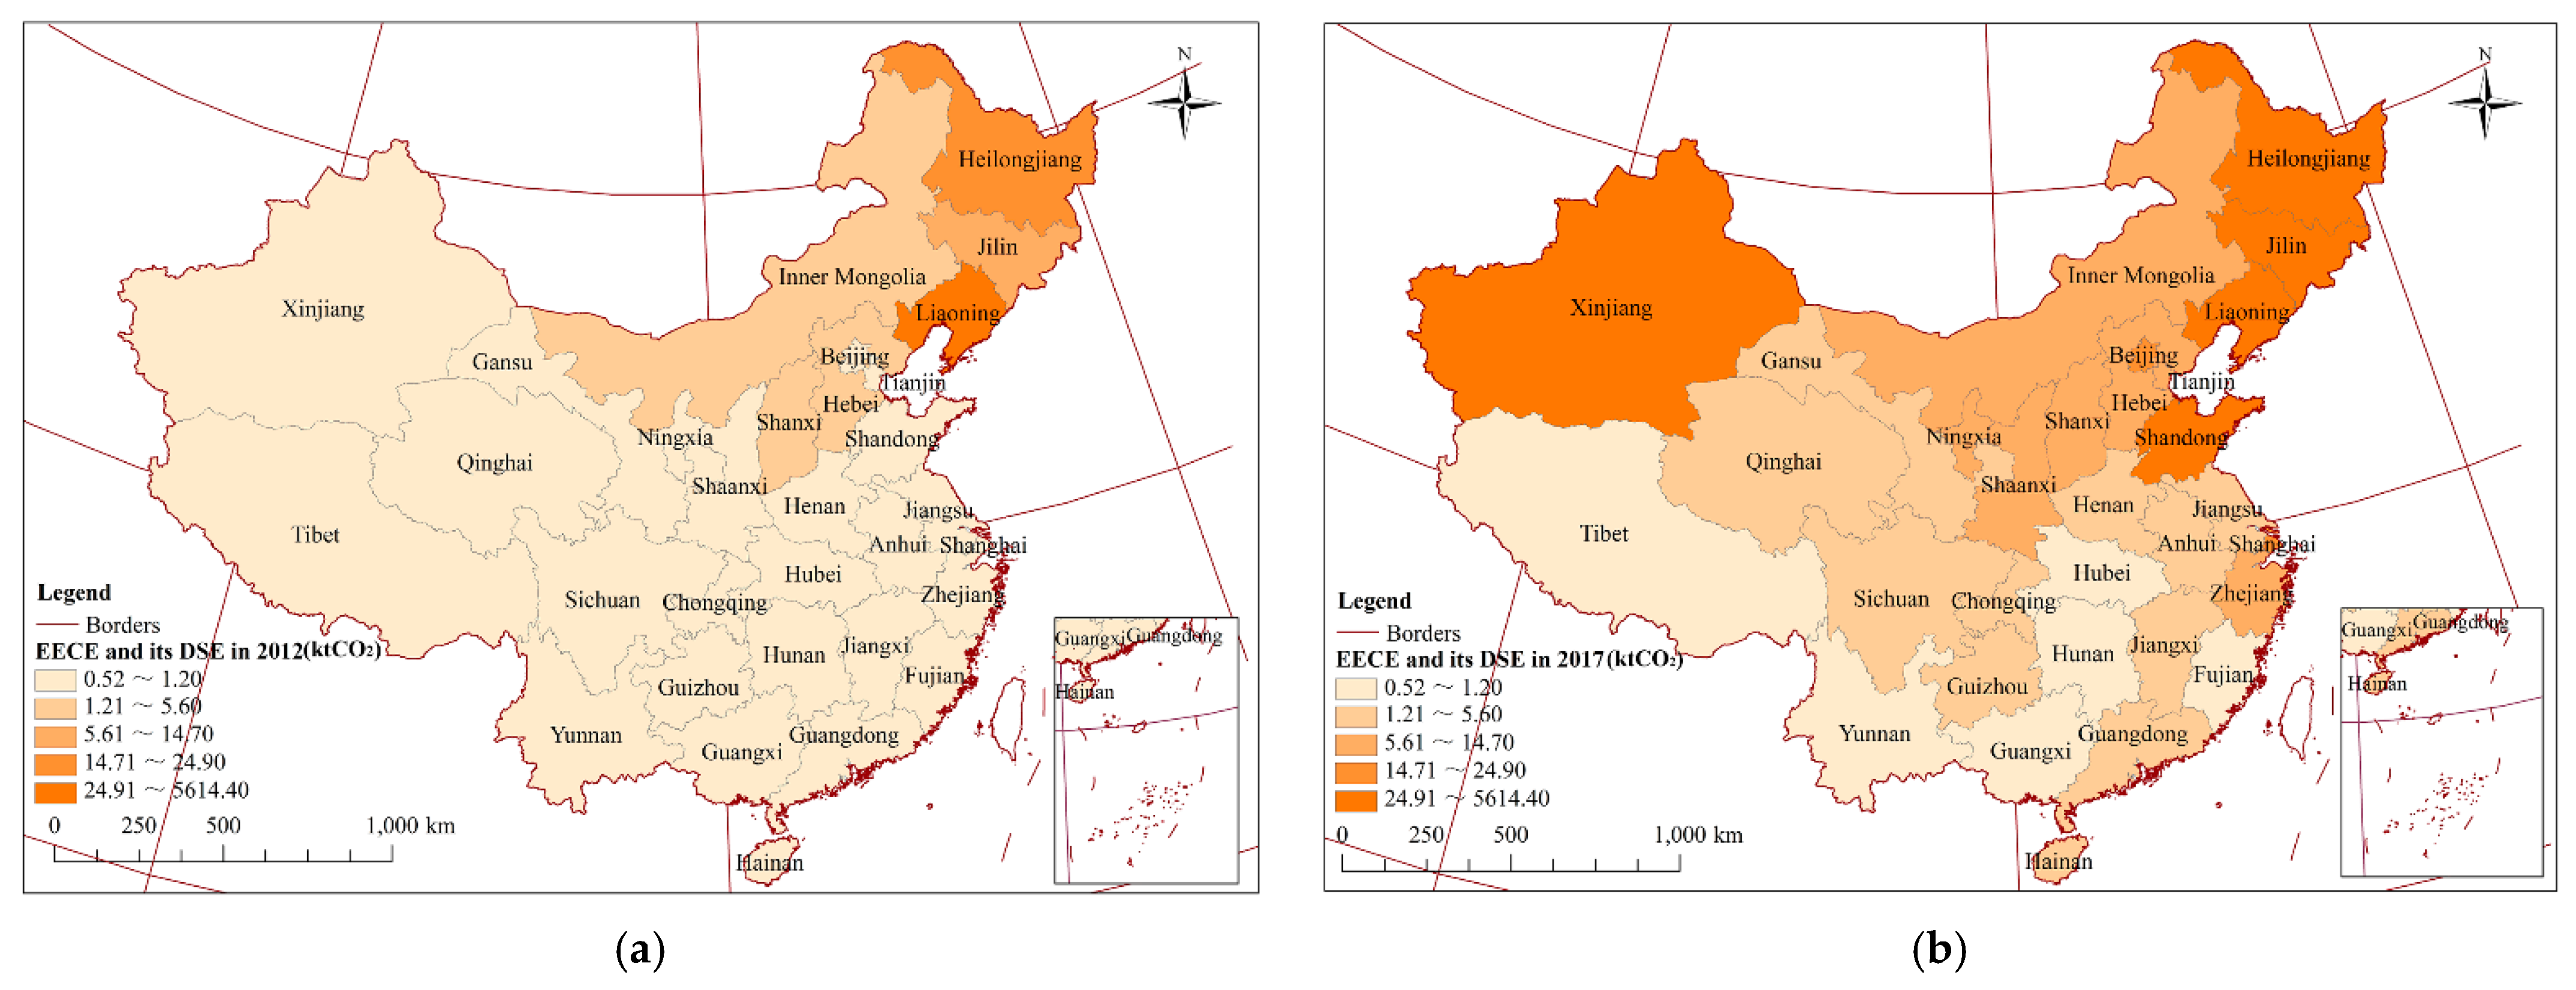
From 2007 to 2017, the EECE was concentrated in five provinces in China, which were Liaoning Province, Shandong Province, Zhejiang Province, Jiangsu Province and Guangdong Province, and their total EECE had remained above 60% (
Figure 1a). Among them, the EECE intensity of four provinces remained decreased. However, the EECE intensity of Liaoning Province decreased from 2007 to 2012 and then increased from 2012 to 2017, which became the largest province (
Figure 1b). In 2017, the EECE intensity of Liaoning Province was 0.09 T/K CNY, higher than the national average of 0.06 T/K CNY. In addition, the EECE of Liaoning Province also decreased from 2007 to 2012 and then increased from 2012 to 2017. The EECE increased from 21.42 MtCO
2 in 2012 to 32.08 MtCO
2 in 2017, which was the fastest growth, with a growth rate of 49.78%.
According to the change trends of EECE intensity and EECE, we found that the ecological environmental effects of export were improving for most provinces in the most recent 10 years. However, for Liaoning Province, it had seriously deteriorated from 2012 to 2017. Therefore, we selected Liaoning Province as the study area, chose 2012 to 2017 as the study period, quantitatively assessed the EECE and its DSE, and proposed adjustment countermeasures. This research could provide a reference for carbon reduction and regional sustainable development achievement in similar regions around the world.
4. Models and Methods
4.1. Research Methods
4.1.1. MRIO Model
Assessing the EECE and its DSE requires a clear understanding of the relationships among the various sectors in different regions (
Table 1). The Multi-region Input-output Model (MRIO Model) can quantitatively express the sectoral correlation within and among regions. It is a commonly used model for calculating the carbon emissions of interregional trade and tracking spillover and feedback relationships among regions [
53]. Therefore, we used this method to quantitatively assess the EECE and its DSE, as well as the adjustment countermeasures effects.
In the Multi-region Input-output Tables, the row vectors include intermediate use, final use, and total output. Si (i =1,2, …, n) is the sectors. (i, j = 1, 2, …, n and r, d = 1, 2, …, m, in this research n = 29, m = 31) is the intermediate use of r region i sector put into the d region j sector. The final use is consisted of internal final use and export. is the internal final use of r region sector put into the d region j sector i. is the export of r region i sector. is the total output of r region i sector.
The column vectors are intermediate inputs, imports, value added and total inputs. and are respectively the import of i sector put into the intermediate use and internal final use of r region j sector. is the added value of r region sector. is the total input of r region i sector.
The direct consumption coefficient is also known as the input coefficient or the technical coefficient, usually expressed by the letter
a, and the formula is:
where
expresses the proportion of the intermediate input from the
r region
i sector in the total input of
d region
j sector.
The basic equation for the Multi-region Input-output Model is
where
is the final use of
r region
i sector, which is composed of
and
.
Equation (2) is the balanced expansion in Multi-region Input-output Tables, and could be converted in matrix form as follows:
where
is the Leontief inverse matrix.
X is the output matrix,
Y is the final use matrix for all regions, which is composed of
F and
EX.
We used
EX instead of
Y and obtained the following:
where
C represents EECE,
e is the intensity of energy consumption matrix, and
μ is the carbon emission coefficient matrix.
4.1.2. CR Model
In order to adjust the EECE and its DSE, as well as formulate adjustment countermeasures with less economic impact and better carbon reduction effects, upon referring to previous studies [
27], we constructed a Coupling Relationship Model (CR Model) for trade values and carbon emissions.
In the CR Model for trade value and carbon emission, we used “change in contribution rate” to measure “change in the trade value “ and “change in carbon emission”. Thus, we got the following formula:
where Δ
and Δ
represent the change in the contribution rate. And the superscripts 0 and 1 represent two different years. In this research, 1 represents 2017 and 0 represents 2012.
and
indicate the total trade value and the total carbon emission, respectively.
and
represent them in the
t year
i sector.
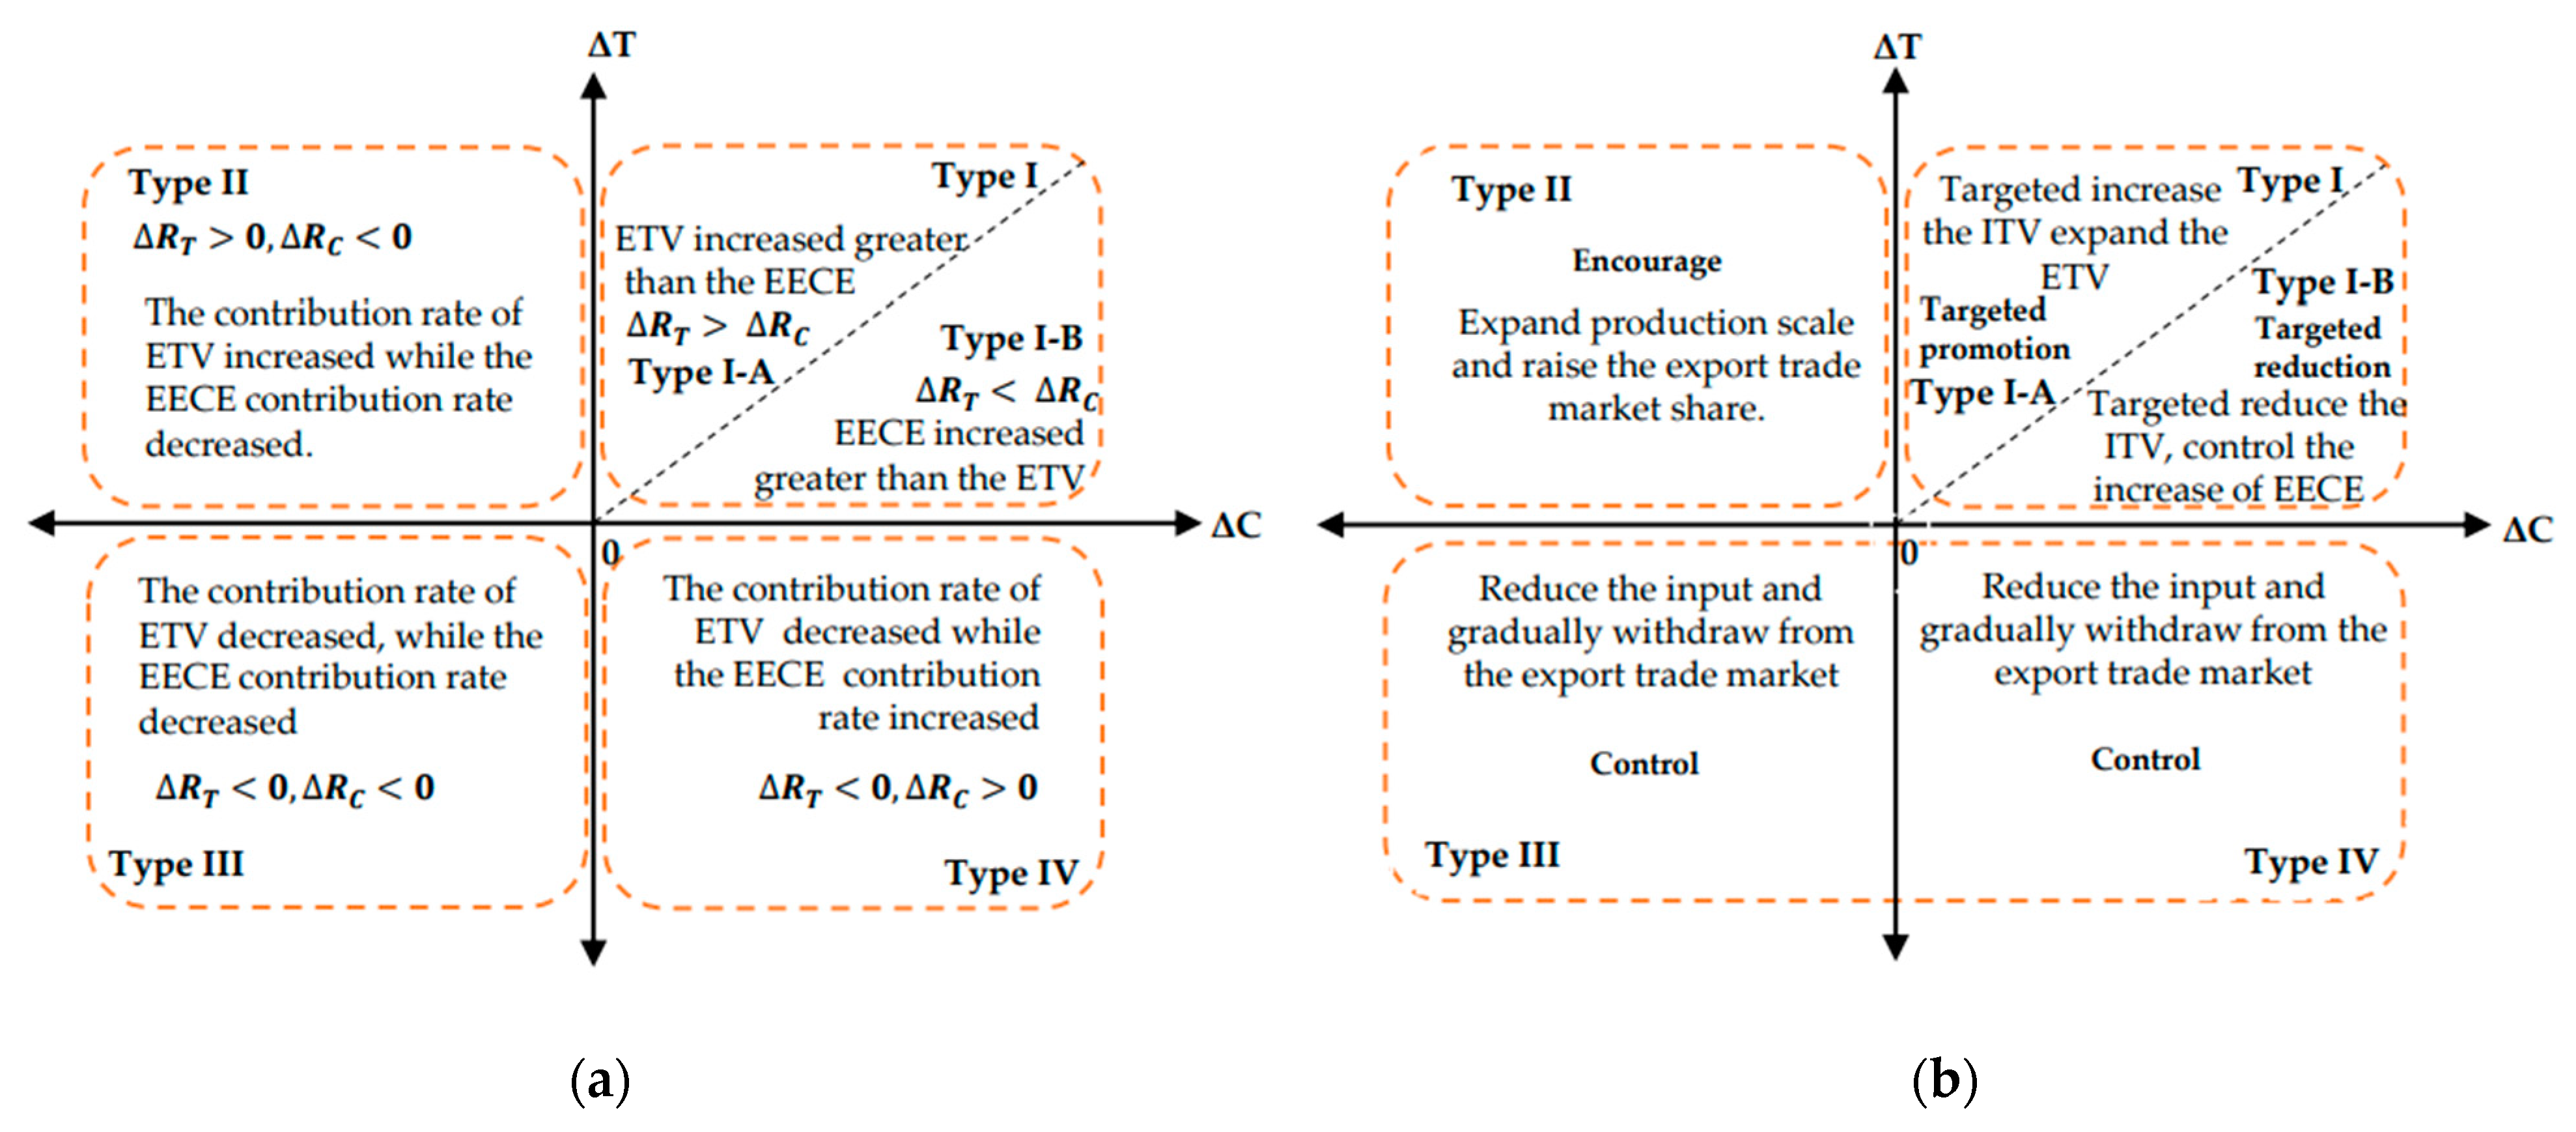
Based on the coupling relationship between Δ and Δ, we divided the sector into 4 types, as follows: Type I: . Type II: , . Type III: , . Type IV: , .
In this research, if the trade value is ETV, the carbon emission expresses EECE, which is the Coupling Relationship Model of export trade value and the export embodied carbon emissions(ETV-EECE CR Model), which were used for the adjustment classification of EECE; if the trade value is the interprovincial trade value (ITV), the carbon emission means the DSE, that is Coupling Relationship Model of interprovincial trade value and the domestic spillover effects (ITV-DSE CR Model), which was used for the adjustment classification of DSE.
4.2. Data Source
The export and interprovincial trade data comes from the China multi-region input-output tables of 2007, 2012 and 2017 (excluding Hong Kong, Macao and Taiwan). It was compiled by the Development Research Center of the State Council and the National Bureau of Statistics. China’s multi-region input-output tables were compiled every 5 years. The latest version is from 2017.
The energy consumption data were derived from the “regional energy balance”, “comprehensive energy balance sheet” and “energy variety consumption by sector” provided by the China Energy Statistical Yearbook and the Provincial Statistical Yearbook. Based on the energy conversion coefficients provided by the Intergovernmental Panel on Climate Change (IPCC), the energy consumption intensity of each province and sectors were calculated.
The classification of sectors was slightly different for the multi-region input-output tables and the energy consumption data obtained from the statistical yearbook; this research categorized the sectors into 29 distinct ones.
5. Results
5.1. The EECE and its DSE of Liaoning Province
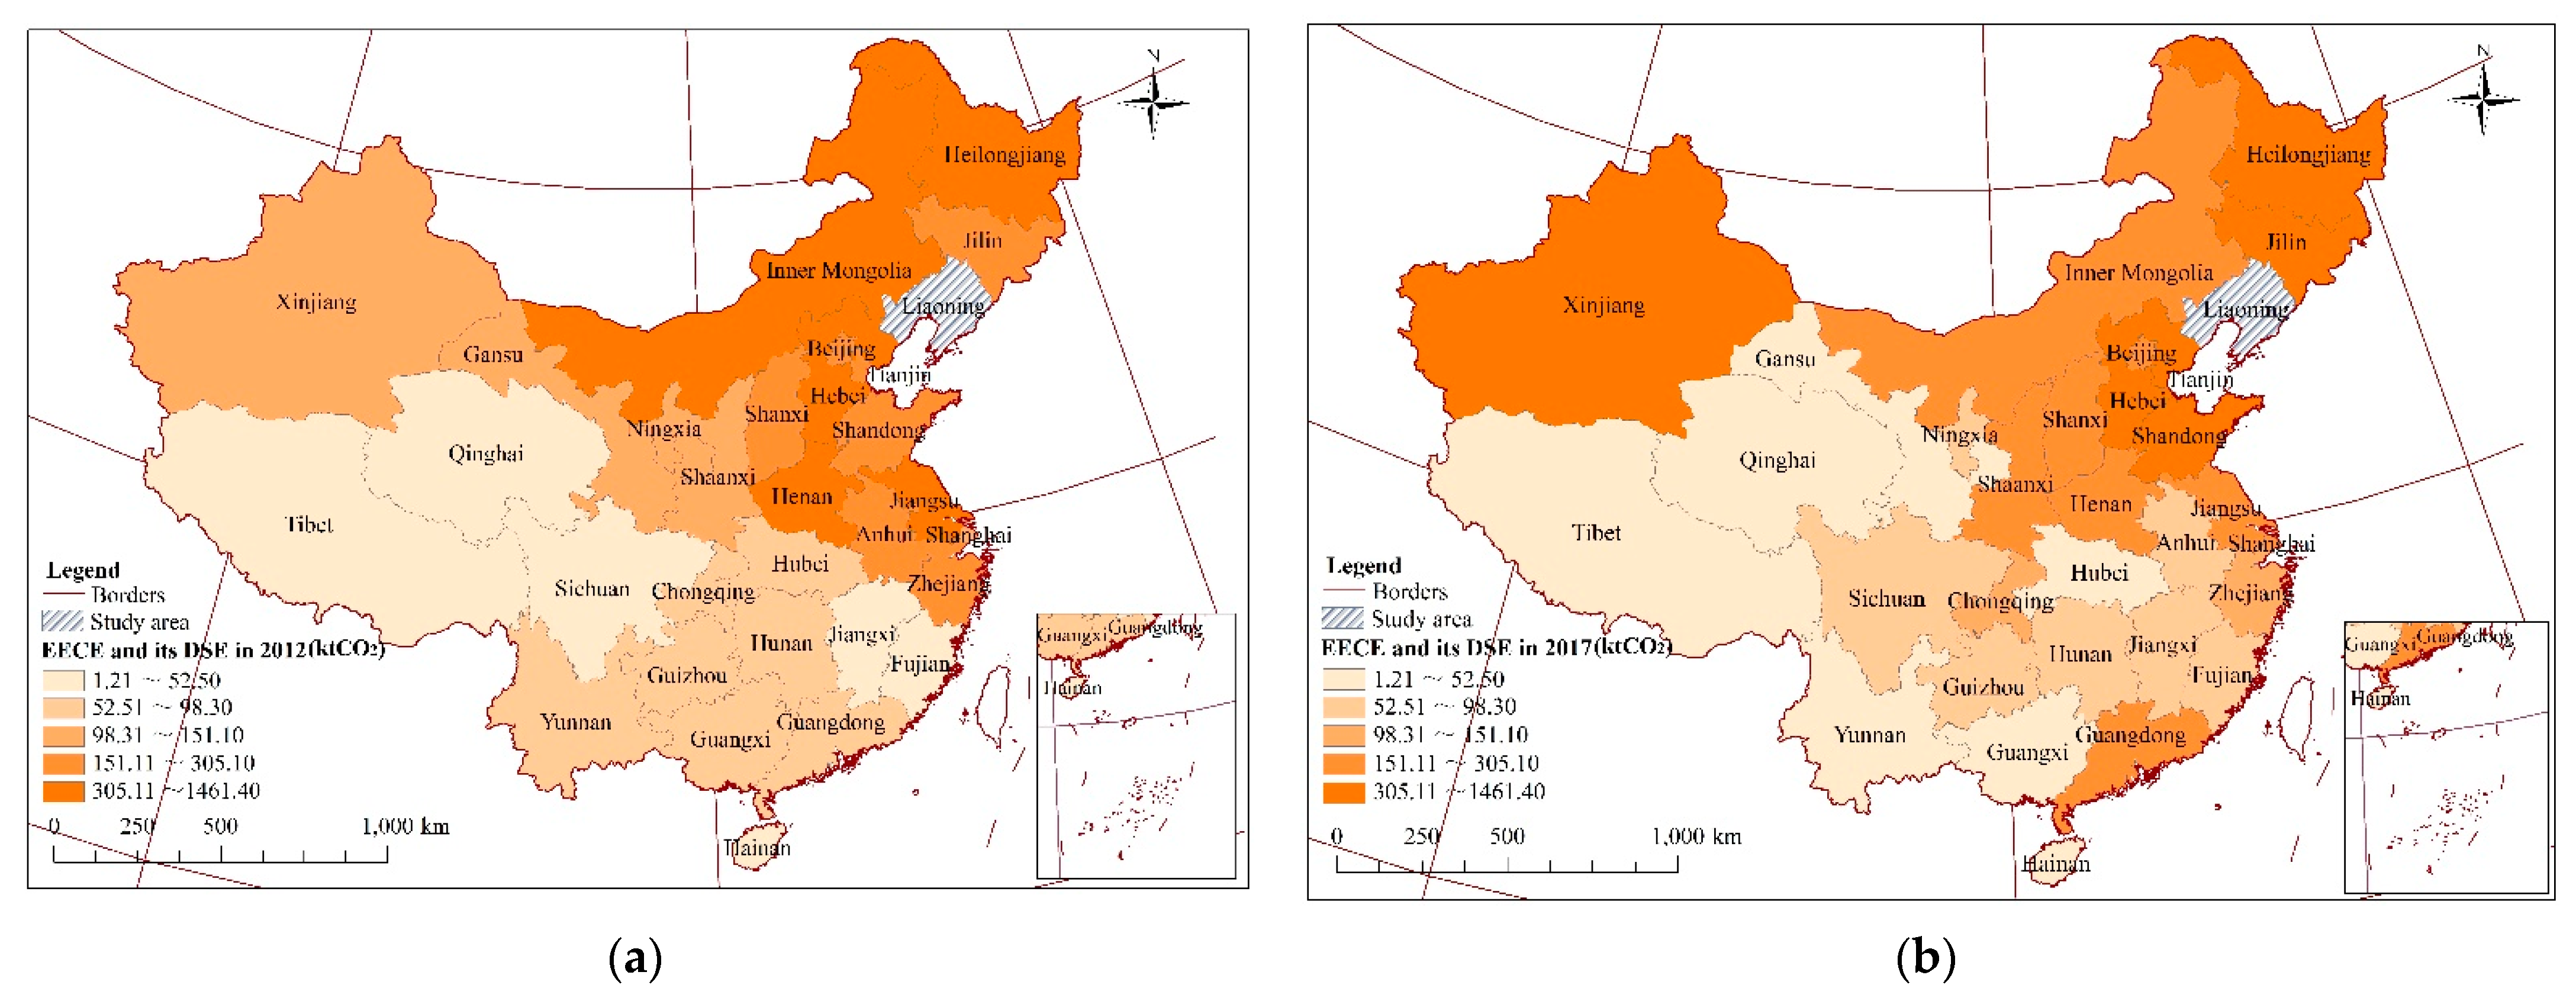
According to the MRIO Model, the total EECE of Liaoning Province rose from 21.42 MtCO
2 in 2012 to 32.08 MtCO
2 in 2017 (
Figure 2a). The impact of EECE on Liaoning Province itself increased from 14.93 MtCO
2 in 2012 to 26.67 MtCO
2 in 2017. The DSE decreased from 6.49 MtCO
2 in 2012 to 5.43 MtCO
2 in 2017.
The DSE decreased, but its spatial agglomeration effect was obvious. Jilin Province became the province with the largest DSE, and the DSE increased from 265.40 ktCO
2 in 2012 to 749.13 ktCO
2 in 2017, with an increase rate of 182.27% (
Figure 2b). Shandong and Tianjin were the second and third highest in growth, with DSE increasing to 213.19 ktCO
2 and 126.74 ktCO
2, respectively. The petroleum processing, coking and nuclear fuel processing sectors (RefPetral) and metal smelting and rolling processing sector (MetalSmelt) were main sectors which lead to the DSE increase in Jilin Province.
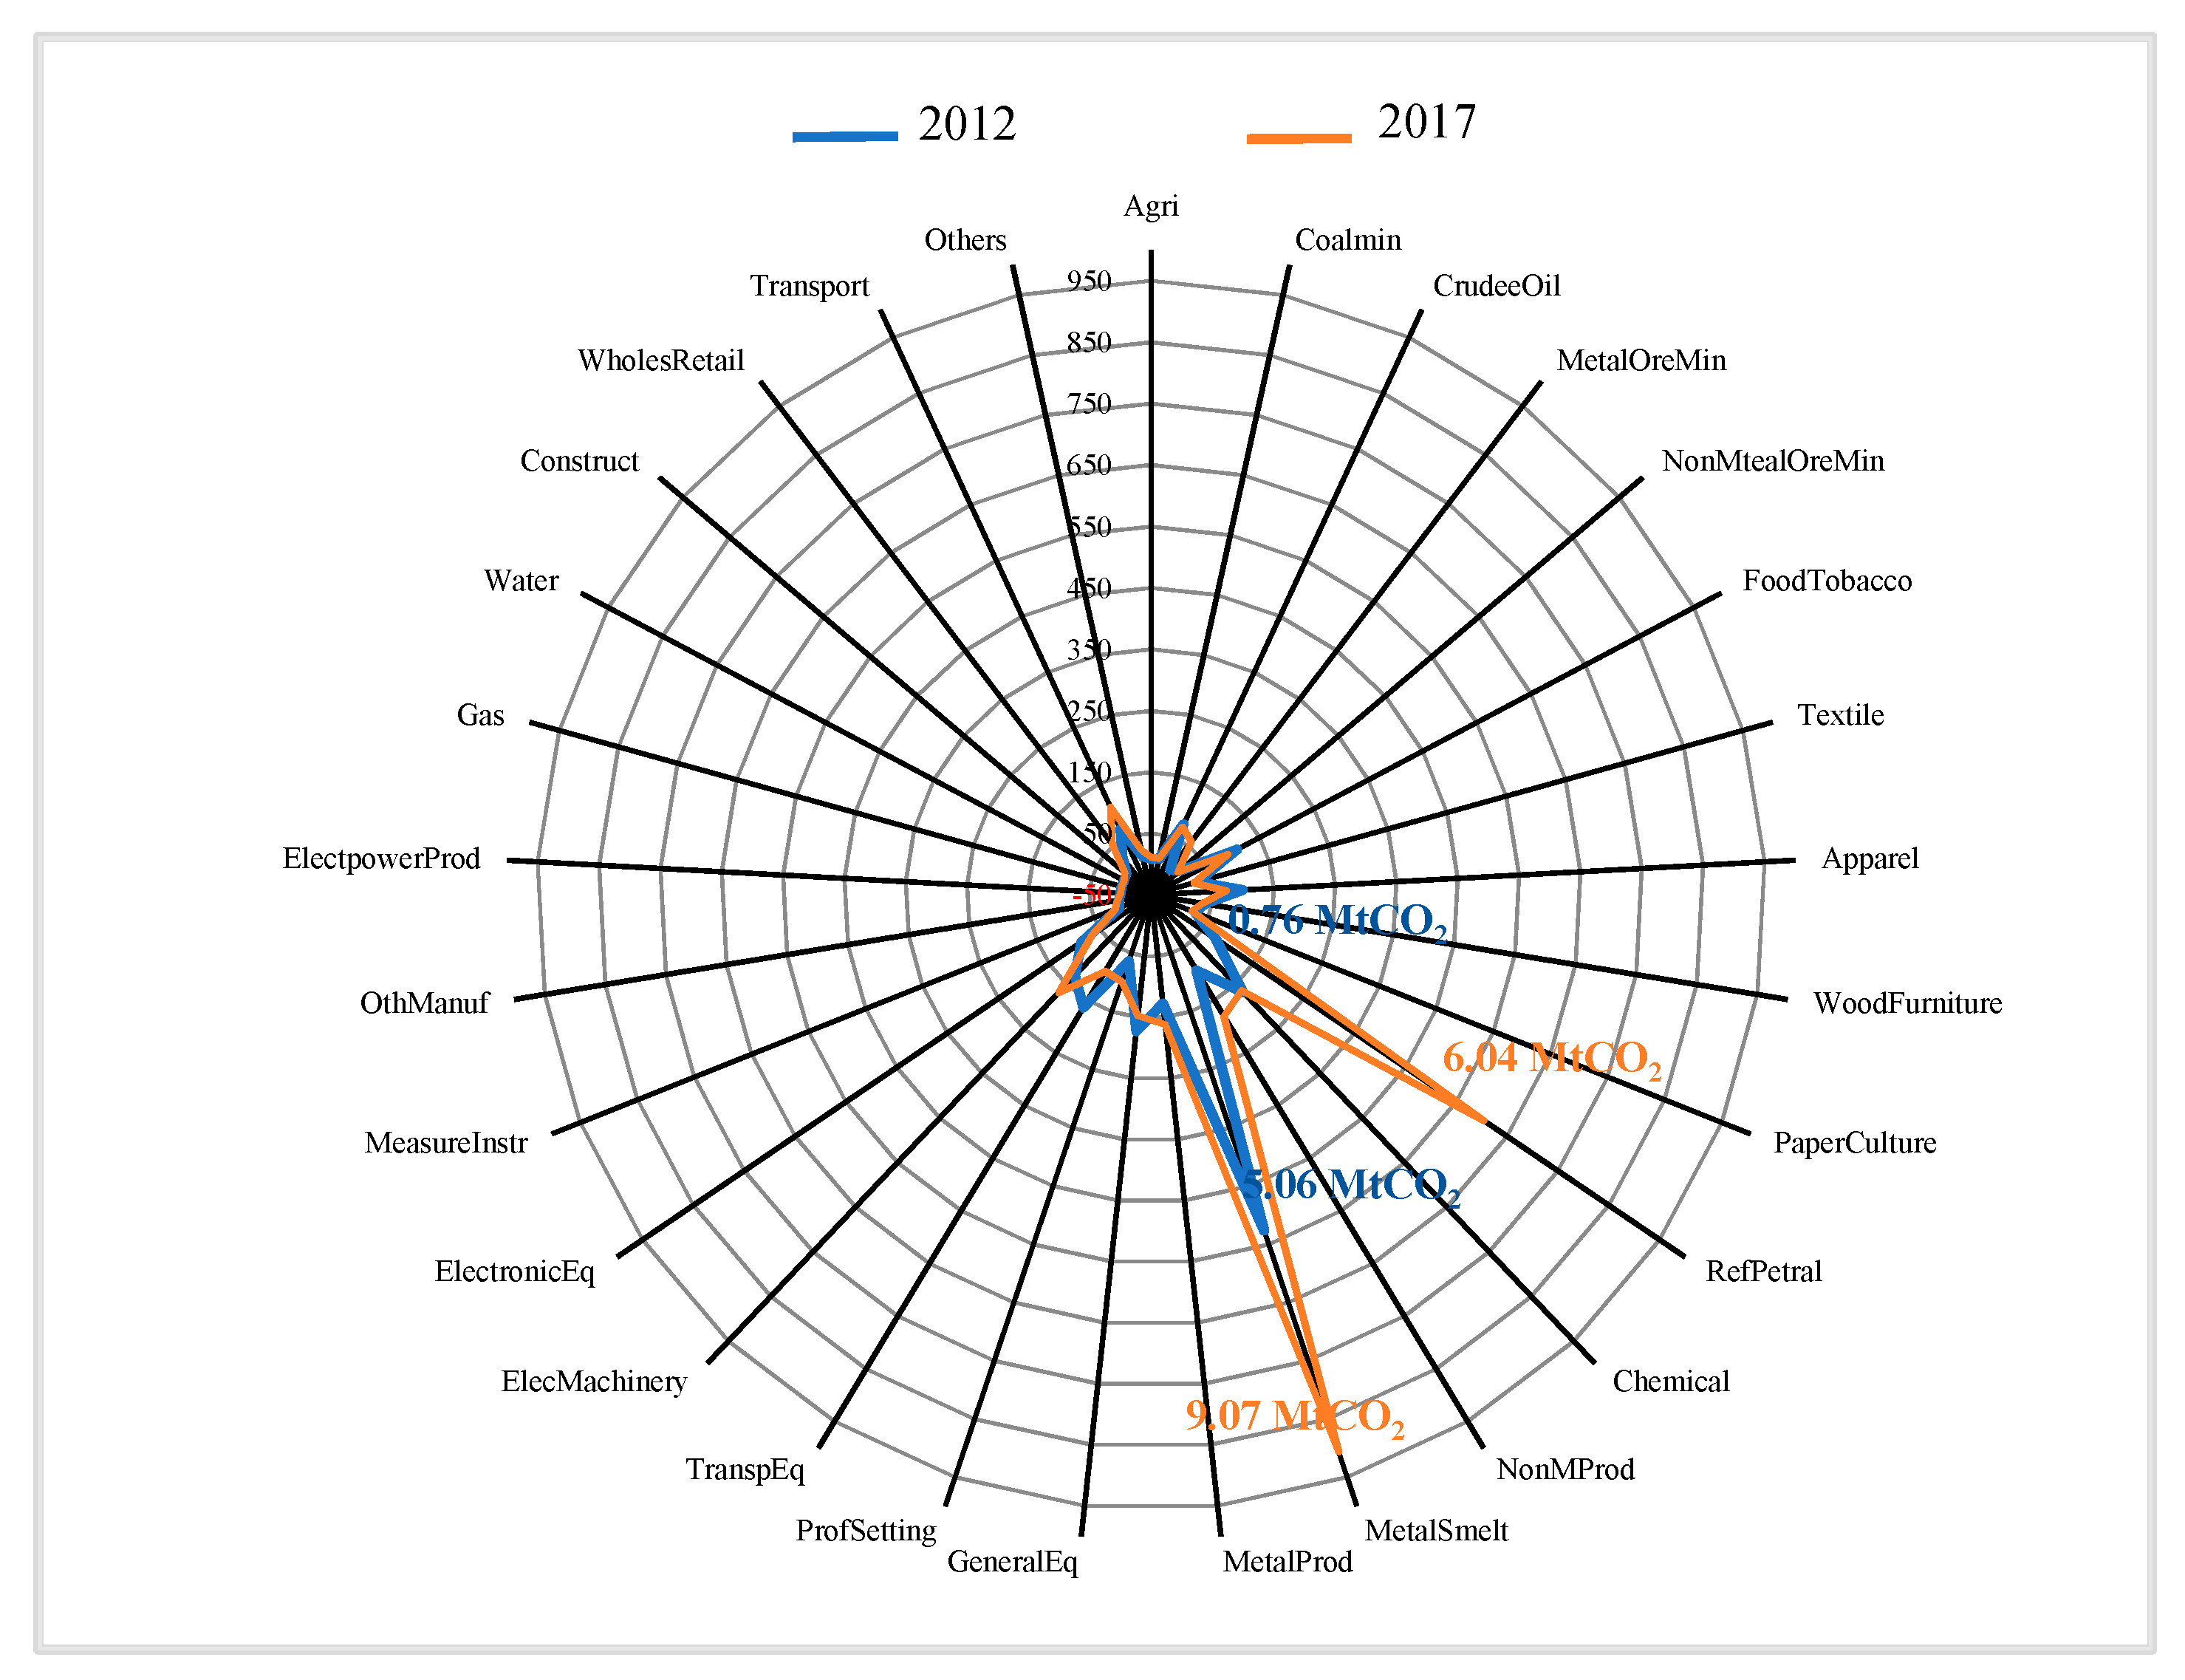
5.2. Typical Sectors of EECE and Its DSE
From the perspective of the sectors, the EECE of the MetalSmelt remained in the top place, with an increase from 9.07 MtCO
2, and accounted for 0.76% of the total in 2012 to and 1.56% in 2017. Furthermore the EECE of the RefPetral became the second largest sector in Liaoning Province, with an increase from 768.72 ktCO
2 in 2012 to 6.04 MtCO
2 in 2017, and accounted for the proportion of EECE from 0.13% in 2012 to 1.04% in 2017. RefPetral became the fastest growing sector in China (
Figure 3).
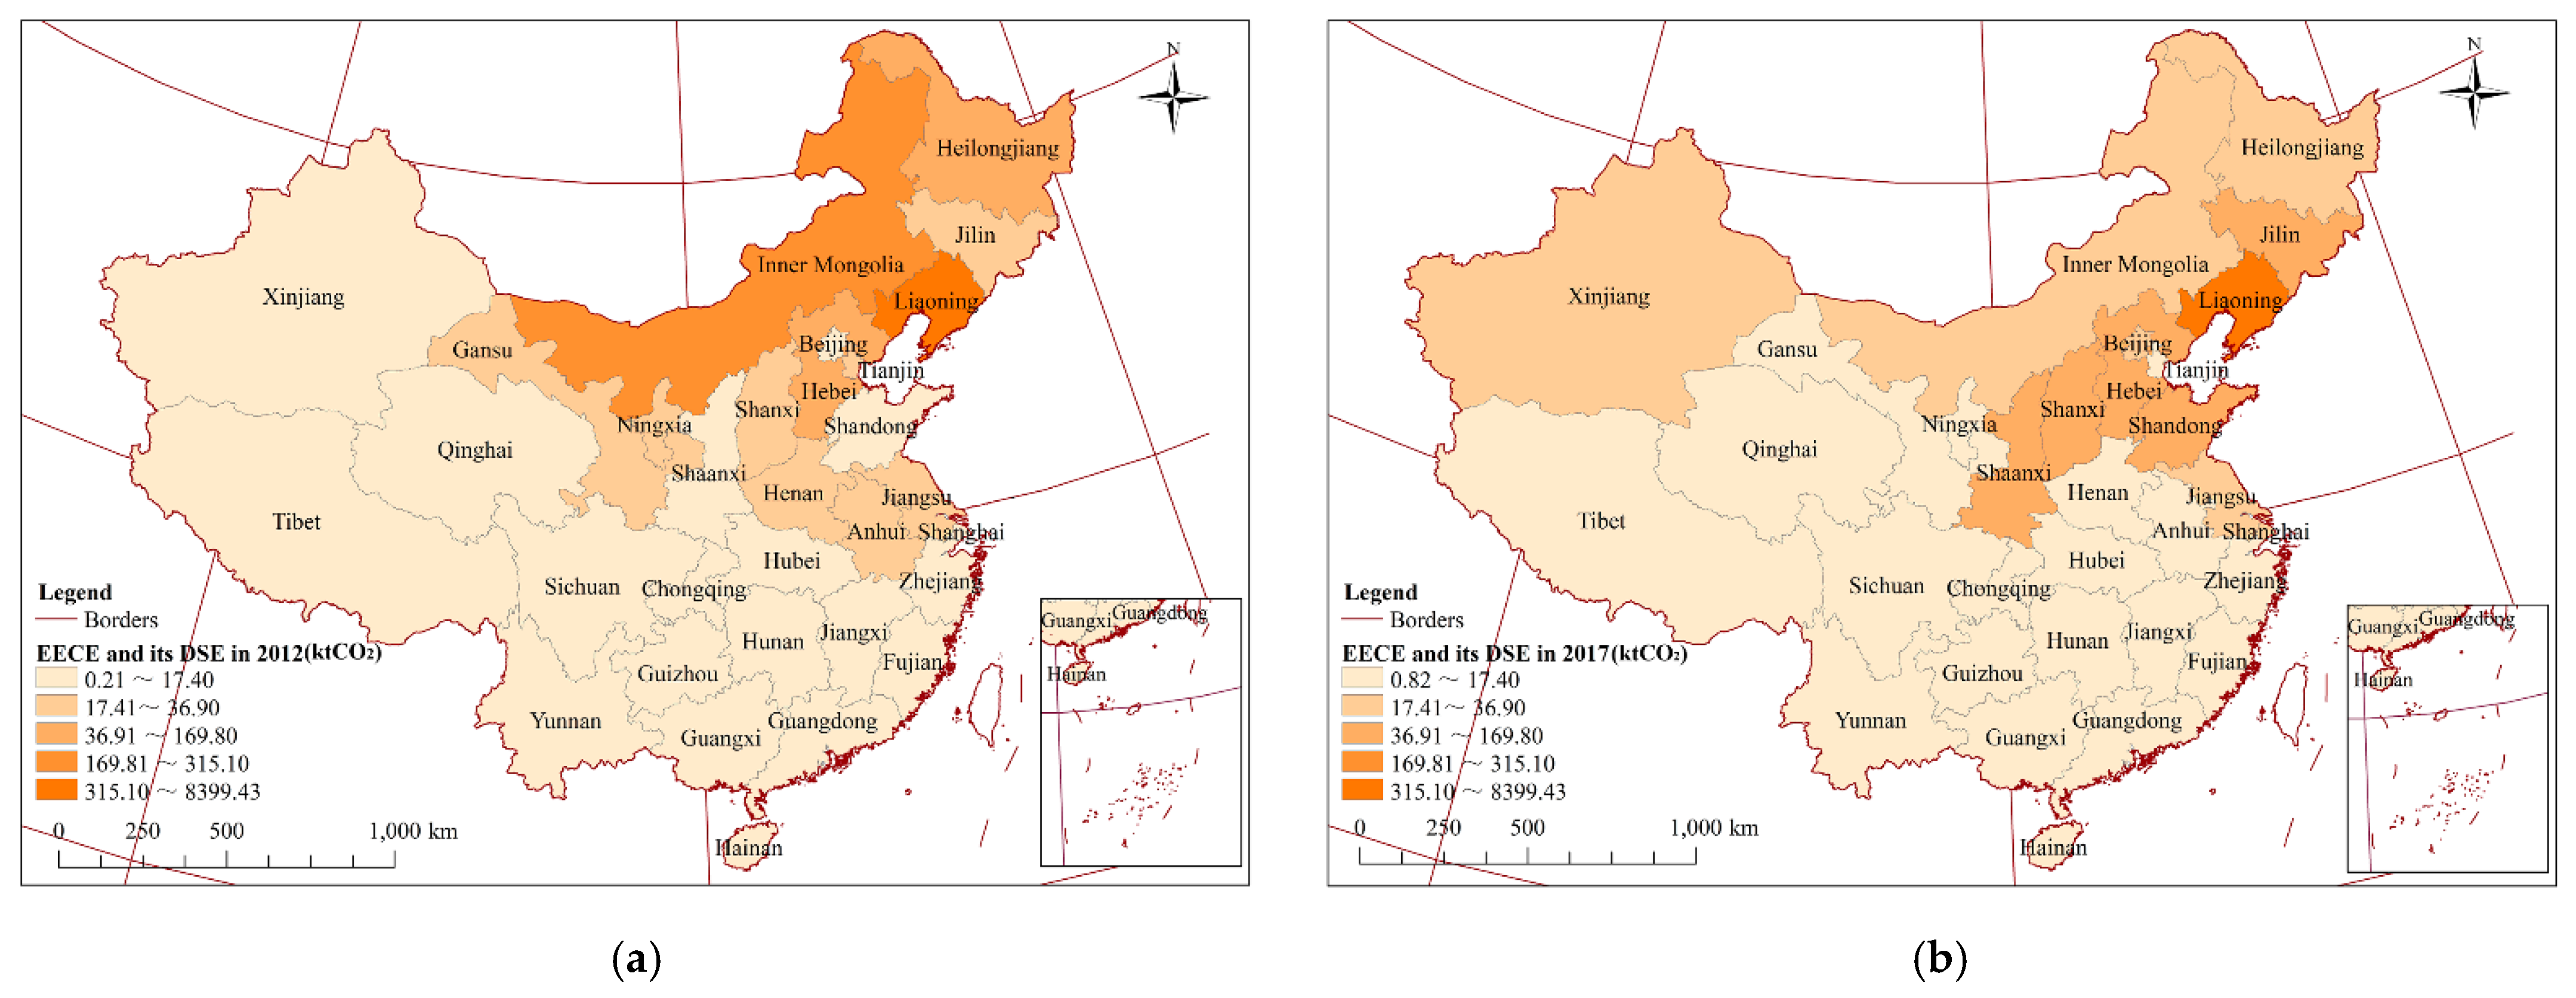
The EECE of MetalSmelt has always ranked first with the impact on Liaoning Province itself increasing from 4.28 MtCO
2 in 2012 to 8.40 MtCO
2 in 2017, and the DSE of other provinces decreasing from 984.32 ktCO
2 in 2012 to 669.35 ktCO
2 in 2107. This indicates that the impact of EECE on the export region has intensified (
Figure 4a). Although the DSE has weakened overall, it showed an obvious spatial agglomeration effect that DSE aggravated in the Hebei, Jilin, and Shandong Provinces. These three provinces exceeded Inner Mongolia and Heilongjiang to be the largest regions of DSE. Among them, the DSE of Jilin Province increased from 25.01 ktCO
2 in 2012 to 92.00 ktCO
2 in 2017, with an increase rate of 267.80% (
Figure 4b). In order to export MetalSmelt products, Liaoning Province needed to buy MetalSmelt and Transport products from Hebei Province, buy NonMProd, TranspEq and chemical products from Jilin Province, and buy chemical, construct and other products from Shandong Province, which were the main DSE transmission processes.
The RefPetral EECE increased by 5.28 MtCO
2 from 2012 to 2017. The impact on Liaoning Province itself and the DSE both significantly increased (
Figure 5a), with an increase from 705.85 ktCO
2 in 2012 to 5.62 MtCO
2 in 2017, and from 62.87 ktCO
2 in 2012 to 431.06 ktCO
2 in 2017, respectively. It showed an obvious spatial diffusion effect. The provinces of DSE exceeding 10 ktCO
2 increased from just two in 2012 to eight in 2017 (
Figure 5b). Heilongjiang and Jilin Province remained the provinces with the largest DSE in 2012 and 2017. In addition, the DSE increased from 24.94 ktCO
2 and 14.73 ktCO
2 in 2012 to 162.87 ktCO
2 and 75.82 ktCO
2 in 2017, respectively, and increased more than six times. In order to export RefPetral products, Liaoning Province needed to buy RefPetral products from Heilongjiang Province and buy Coalmin and chemical products from Jilin Province, which constituted the main DSE transmission process.
6. Adjustment Countermeasures and Its Effects
6.1. Sectoral Adjustment Countermeasures
Based on the above analysis, the EECE were not uniformly distributed in all sectors, but rather were relatively concentrated in some key sectors, such as MetalSmelt and RefPetral. However, these key sectors with higher EECE might be not with the highest ETV. Therefore, according to the export trade value and the ETV-EECE CR Model, we proposed the sectoral adjustment countermeasures to achieve the purpose of reducing EECE, while maximizing the export economic benefits.
6.1.1. Classification of Sectoral Adjustment Types
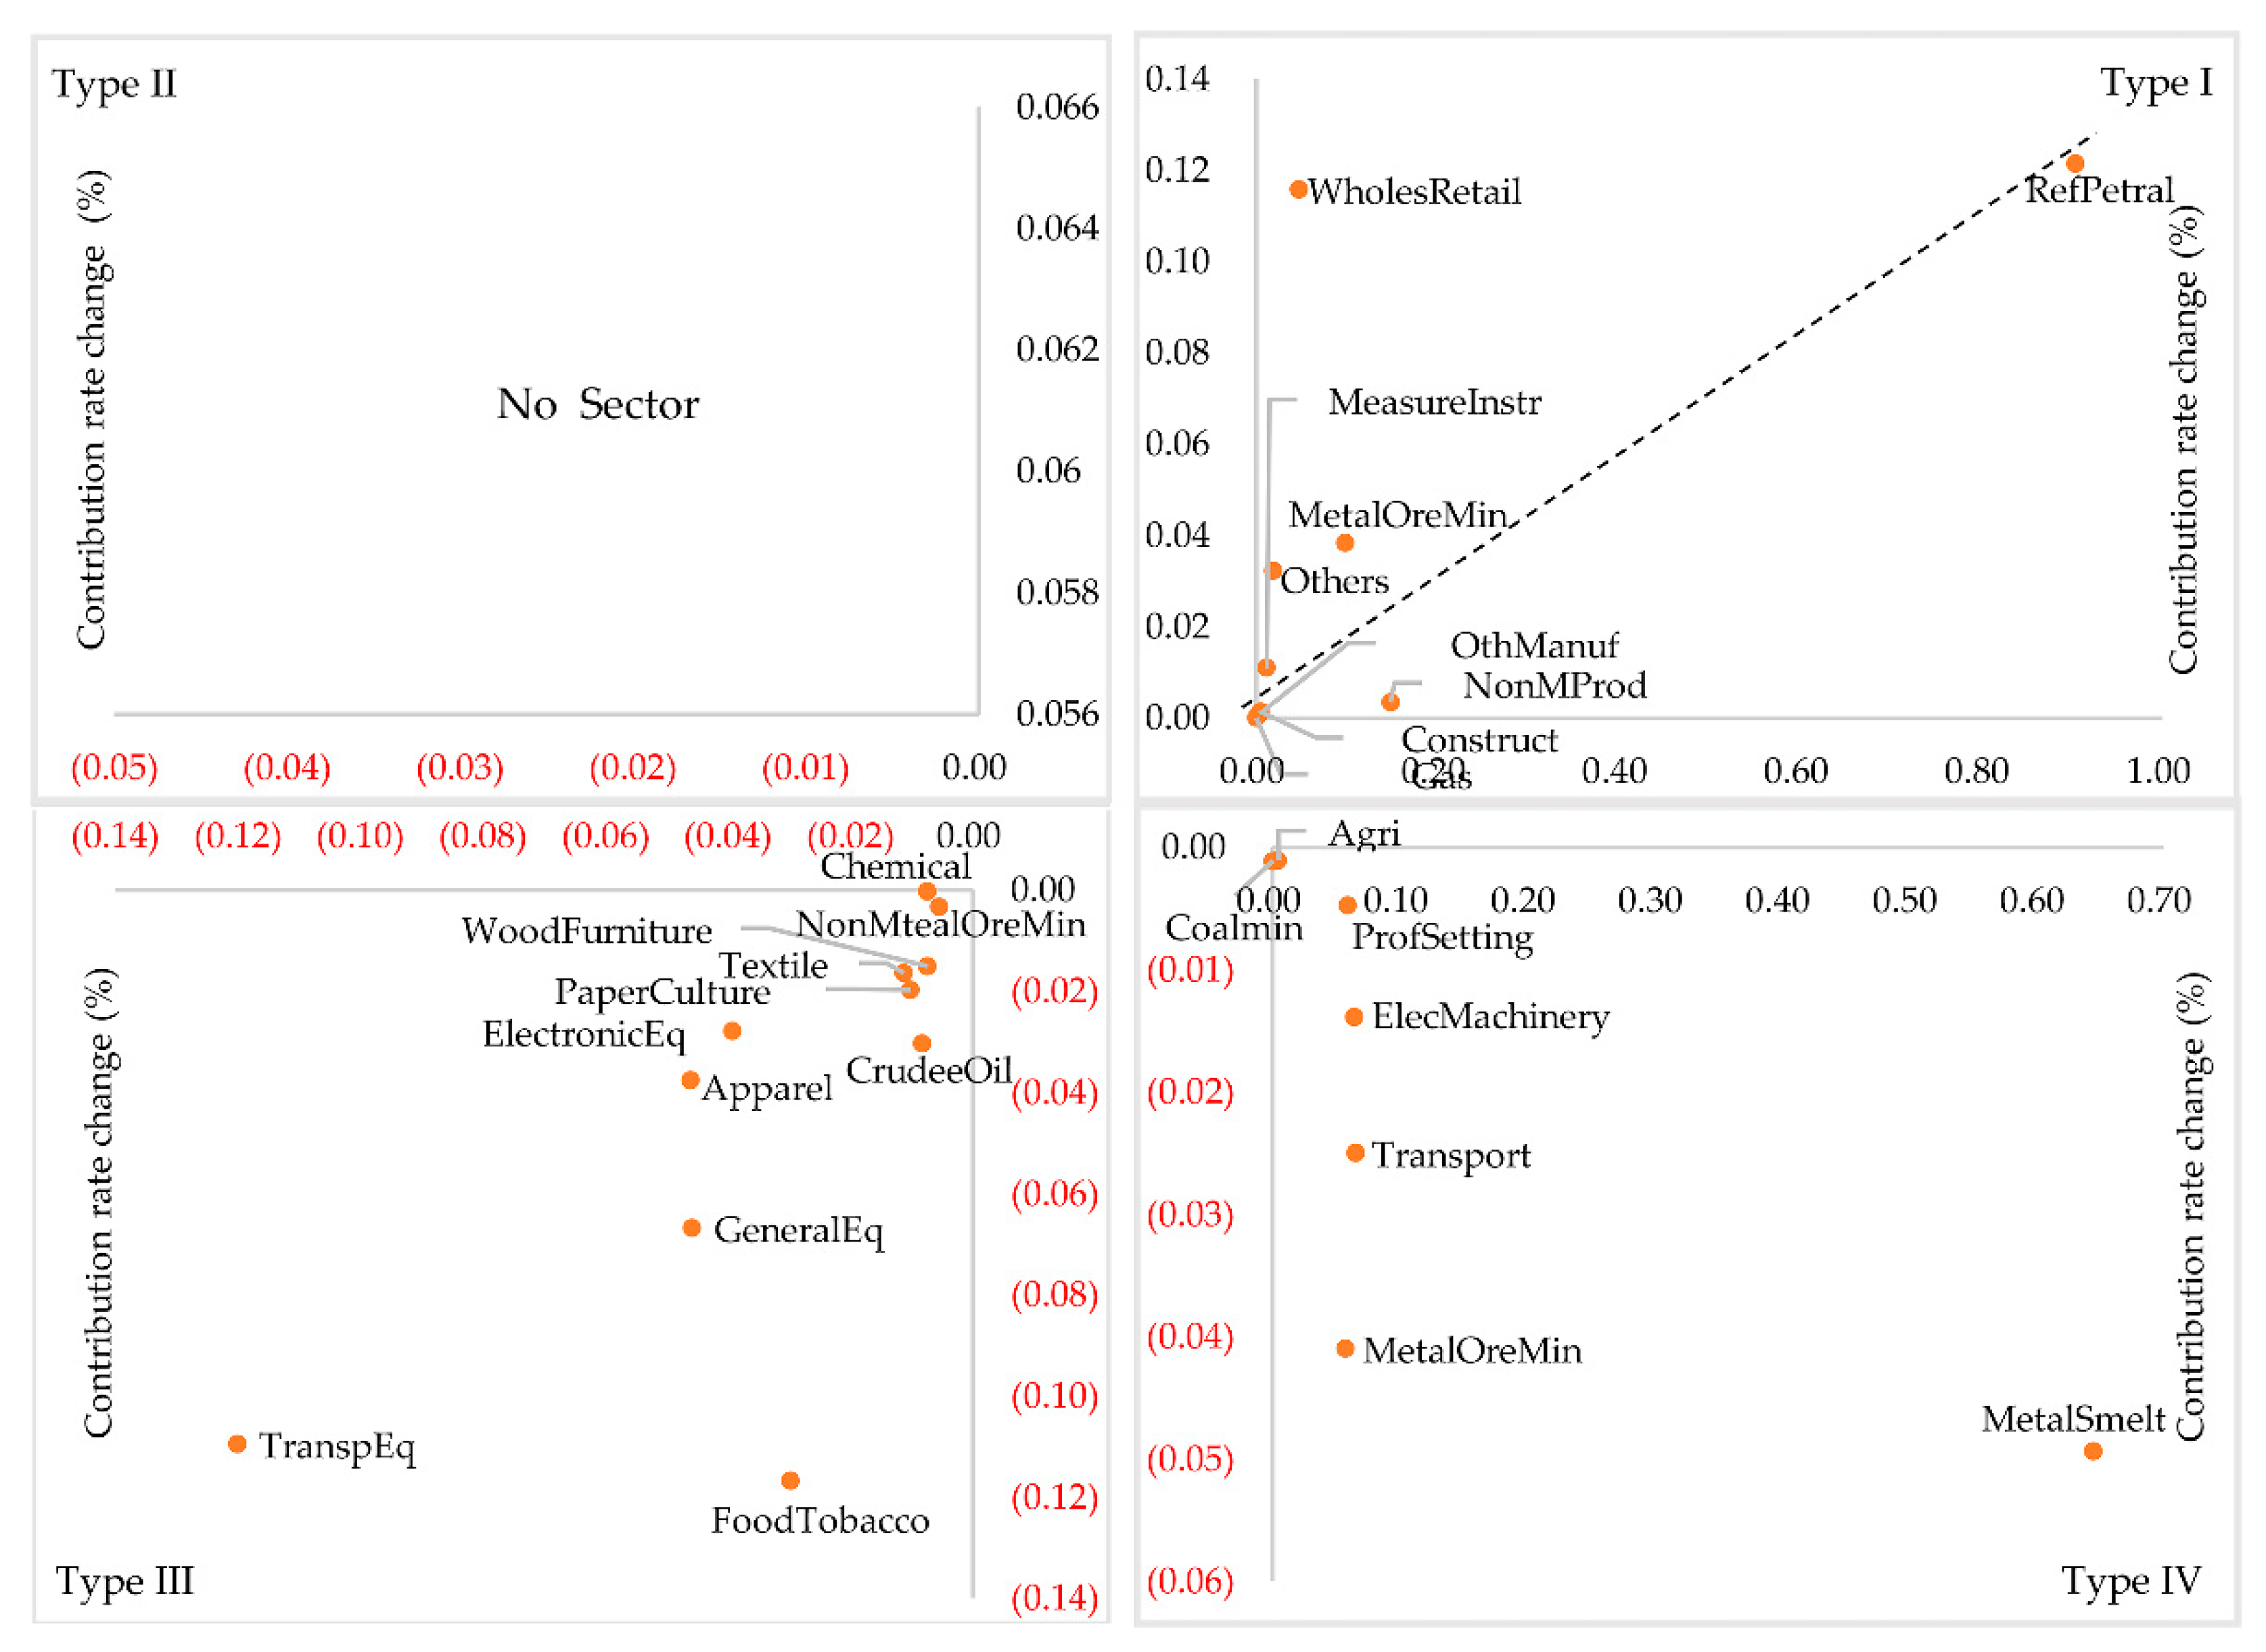
According to the ETV-EECE CR Model, we classified the 27 sectors into the following four types (
Figure 6). The ETV and EECE of the ElectpowerProd and the Water were 0, so they did not participate in the classification. There are nine sectors in Type I, zero sectors in Type II, 11 sectors in Type III, and seven sectors in Type IV, respectively.
6.1.2. Countermeasures for Different Sectoral Types
According to the characteristics of different types, different adjustment countermeasures are proposed (
Figure 7). For Type I, regulation countermeasures should be implemented. According to the different growth rate, we should apply different regulation countermeasures. For Type I-A, targeted promotion countermeasures, such as Apparel and the other five sectors, should be implemented. For Type I-B, targeted reduction countermeasures, such as the RefPetral and the other two sectors should be implemented. For Type II, the positive countermeasures which were not involved in this research should be implemented. For Type III and IV, the control countermeasures, such as CrudeOil and ElecMachinery should be implemented.
For the above four sectoral types, we could apply regulation (including targeted promotion and targeted reduction), encouragement and control countermeasures. Through policy tools, such as finance and taxation subsidies, we could achieve the goal of minimizing EECE, in addition to the lower-cost and DSE on other provinces. It could provide the scientific support for the realization of the 2060 “Carbon Neutrality” target.
6.2. Adjustment Effects for Typical Sectors
6.2.1. Adjustment Effects for MetalSmelt
The products of MetalSmelt mainly included steel making, iron making, steel rolling processing and ferroalloy smelting and other steel processing and manufacturing industries. In 2017, the major export countries of MetalSmelt in Liaoning Province were South Korea, Japan, Vietnam, the United States and the Philippines. Liaoning Anshan Iron and Steel Group Company limited is an important steel enterprise in China, with a wide range of overseas trade partners [
54]. It has 31 overseas companies and institutions, as well as more than 500 domestic and foreign customers and partners. Its product sales covered more than 70 countries and regions. It is also the global supplier of many international well-known enterprises.
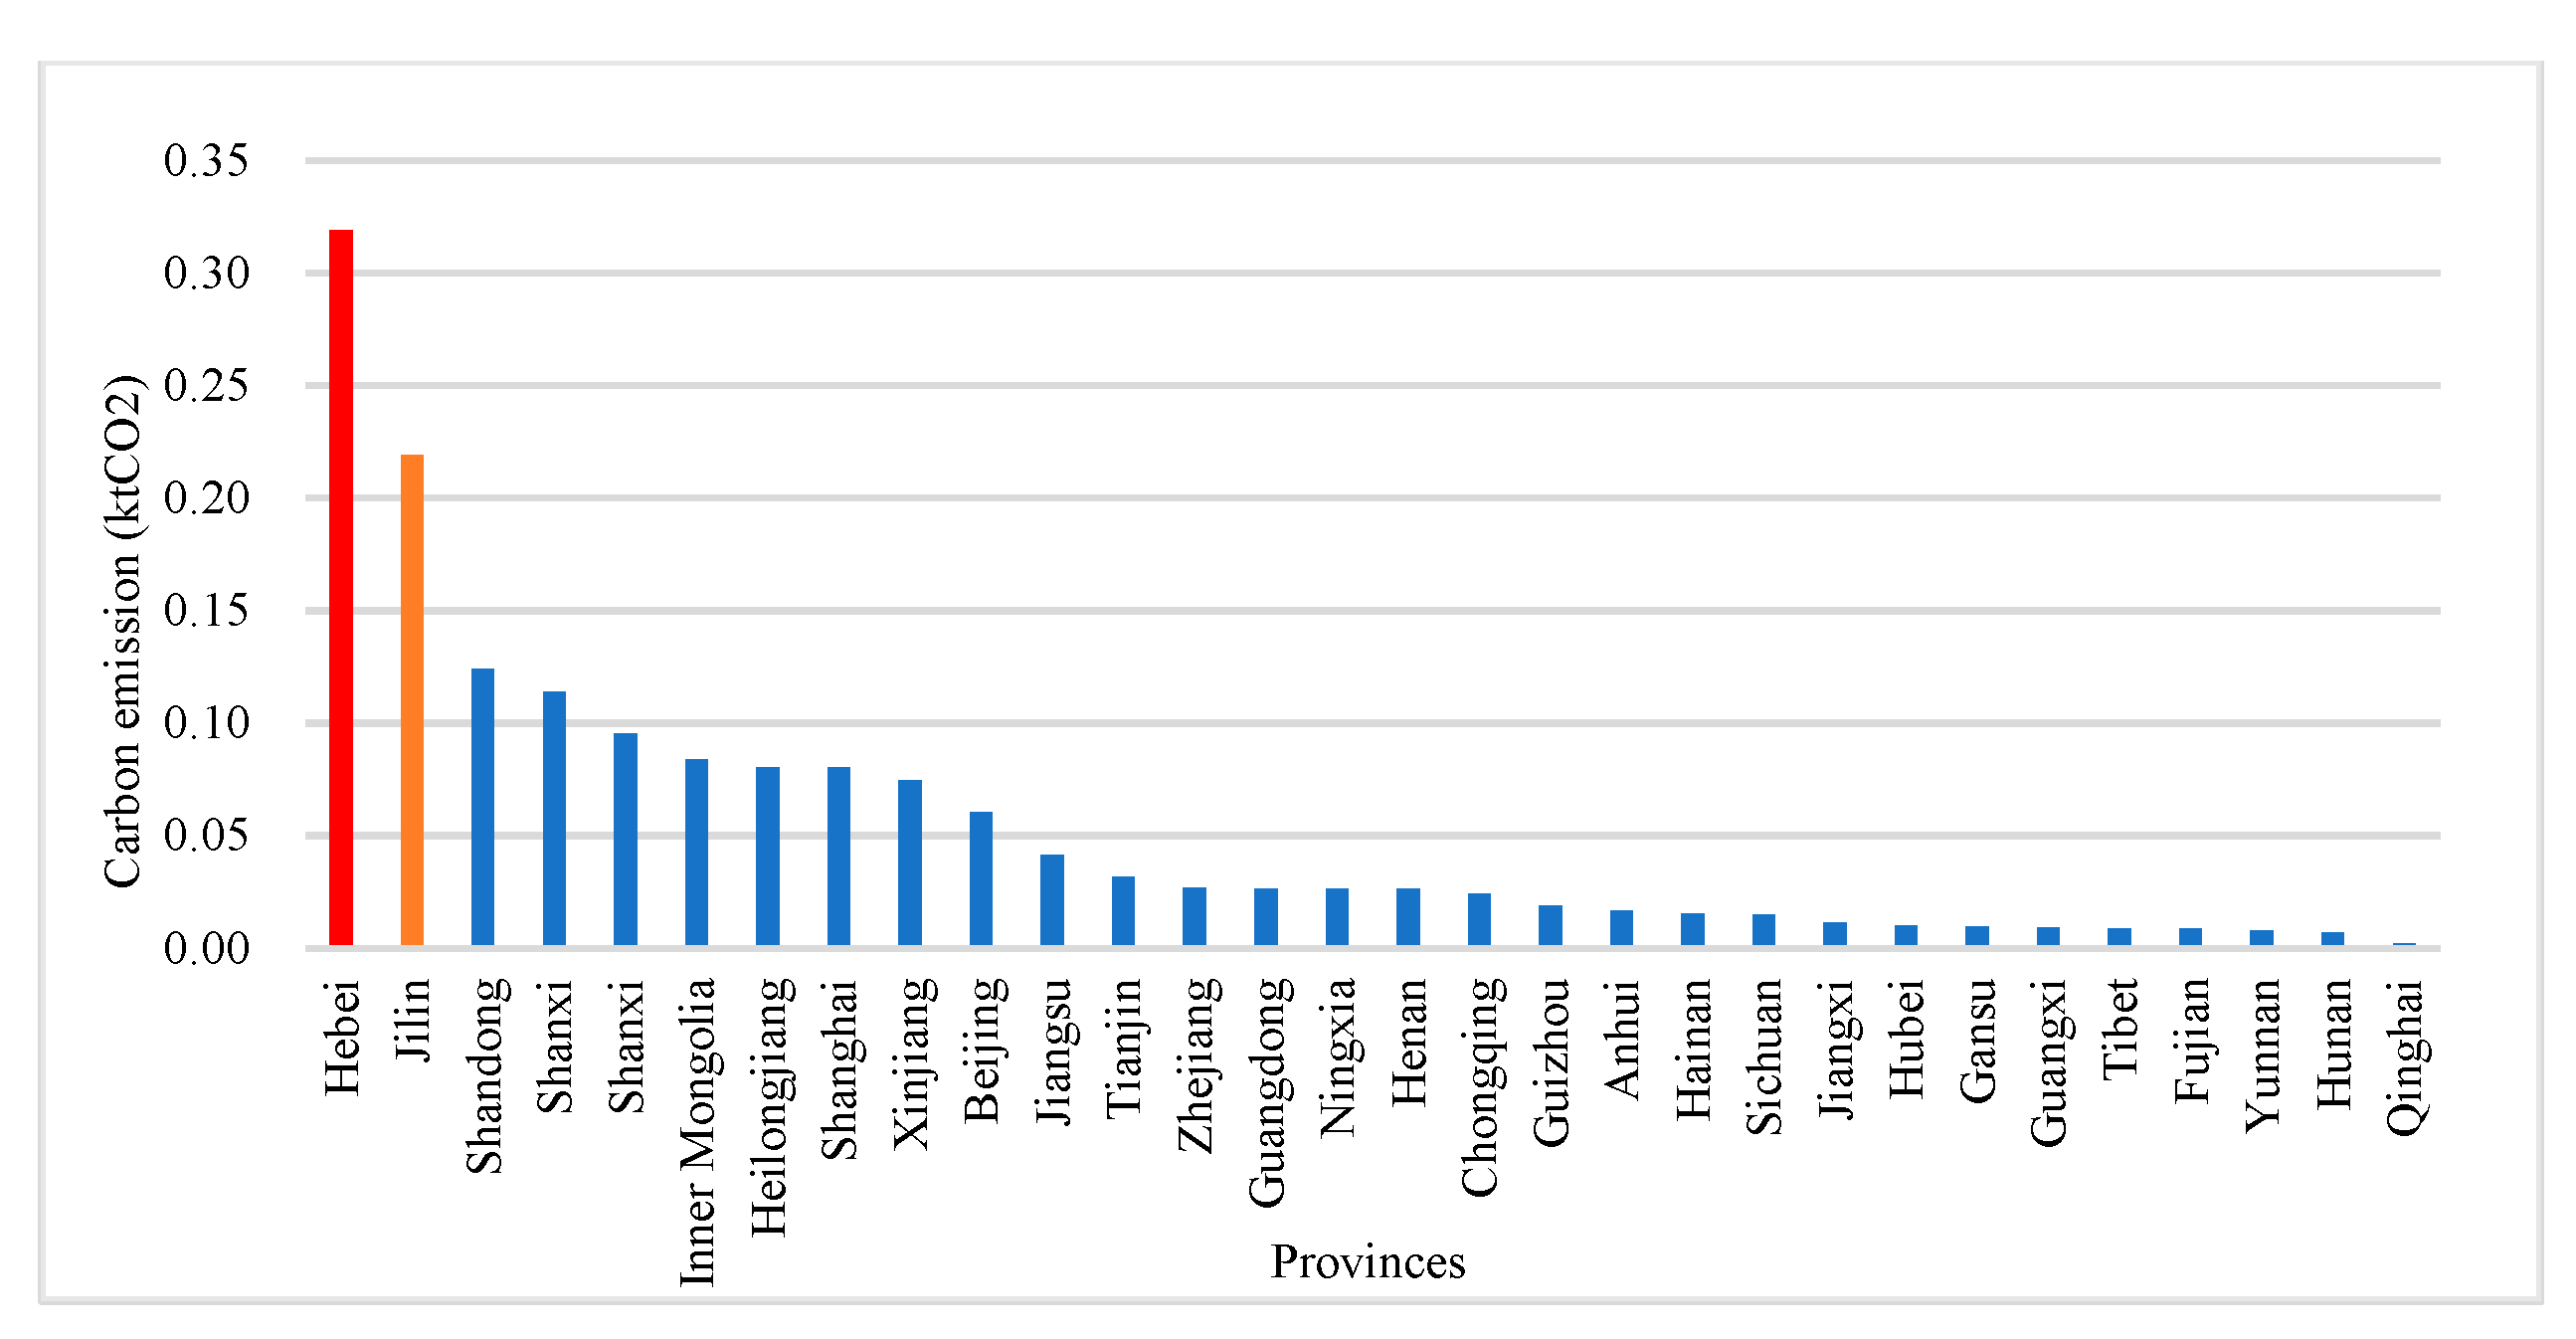
According to the ETV-EECE CR Model, MetalSmelt belonged to Type IV, the controlled type. It showed that ETV decreased while EECE increased. It should reduce input and make the sector gradually withdraw from the export trade market. According to the MRIO Model, if the ETV reduced 100 million CNY, the EECE could reduce by 21.57 ktCO
2. The DSE could reduce by 1.59 ktCO
2, with Hebei and Jilin seeing the largest reductions, which totaled 0.32 ktCO
2 and 0.22 ktCO
2, respectively (
Figure 8).
6.2.2. Adjustment Effects for RefPetral
The products of RefPetral mainly included refined petroleum products manufacturing, crude oil processing and petroleum products manufacturing, other crude oil manufacturing and the nuclear fuel processing industries. Dalian City was one of the important petroleum product export bases for Liaoning Province and for all of China. The Dalian Petrochemical Engineering Company mainly produces 129 kinds of petrochemical products in four categories, such as gasoline, jet coal, diesel and lubricating oil base oil. Singapore, South Korea, Japan, the United States and Malaysia were the main export countries for RefPetral.
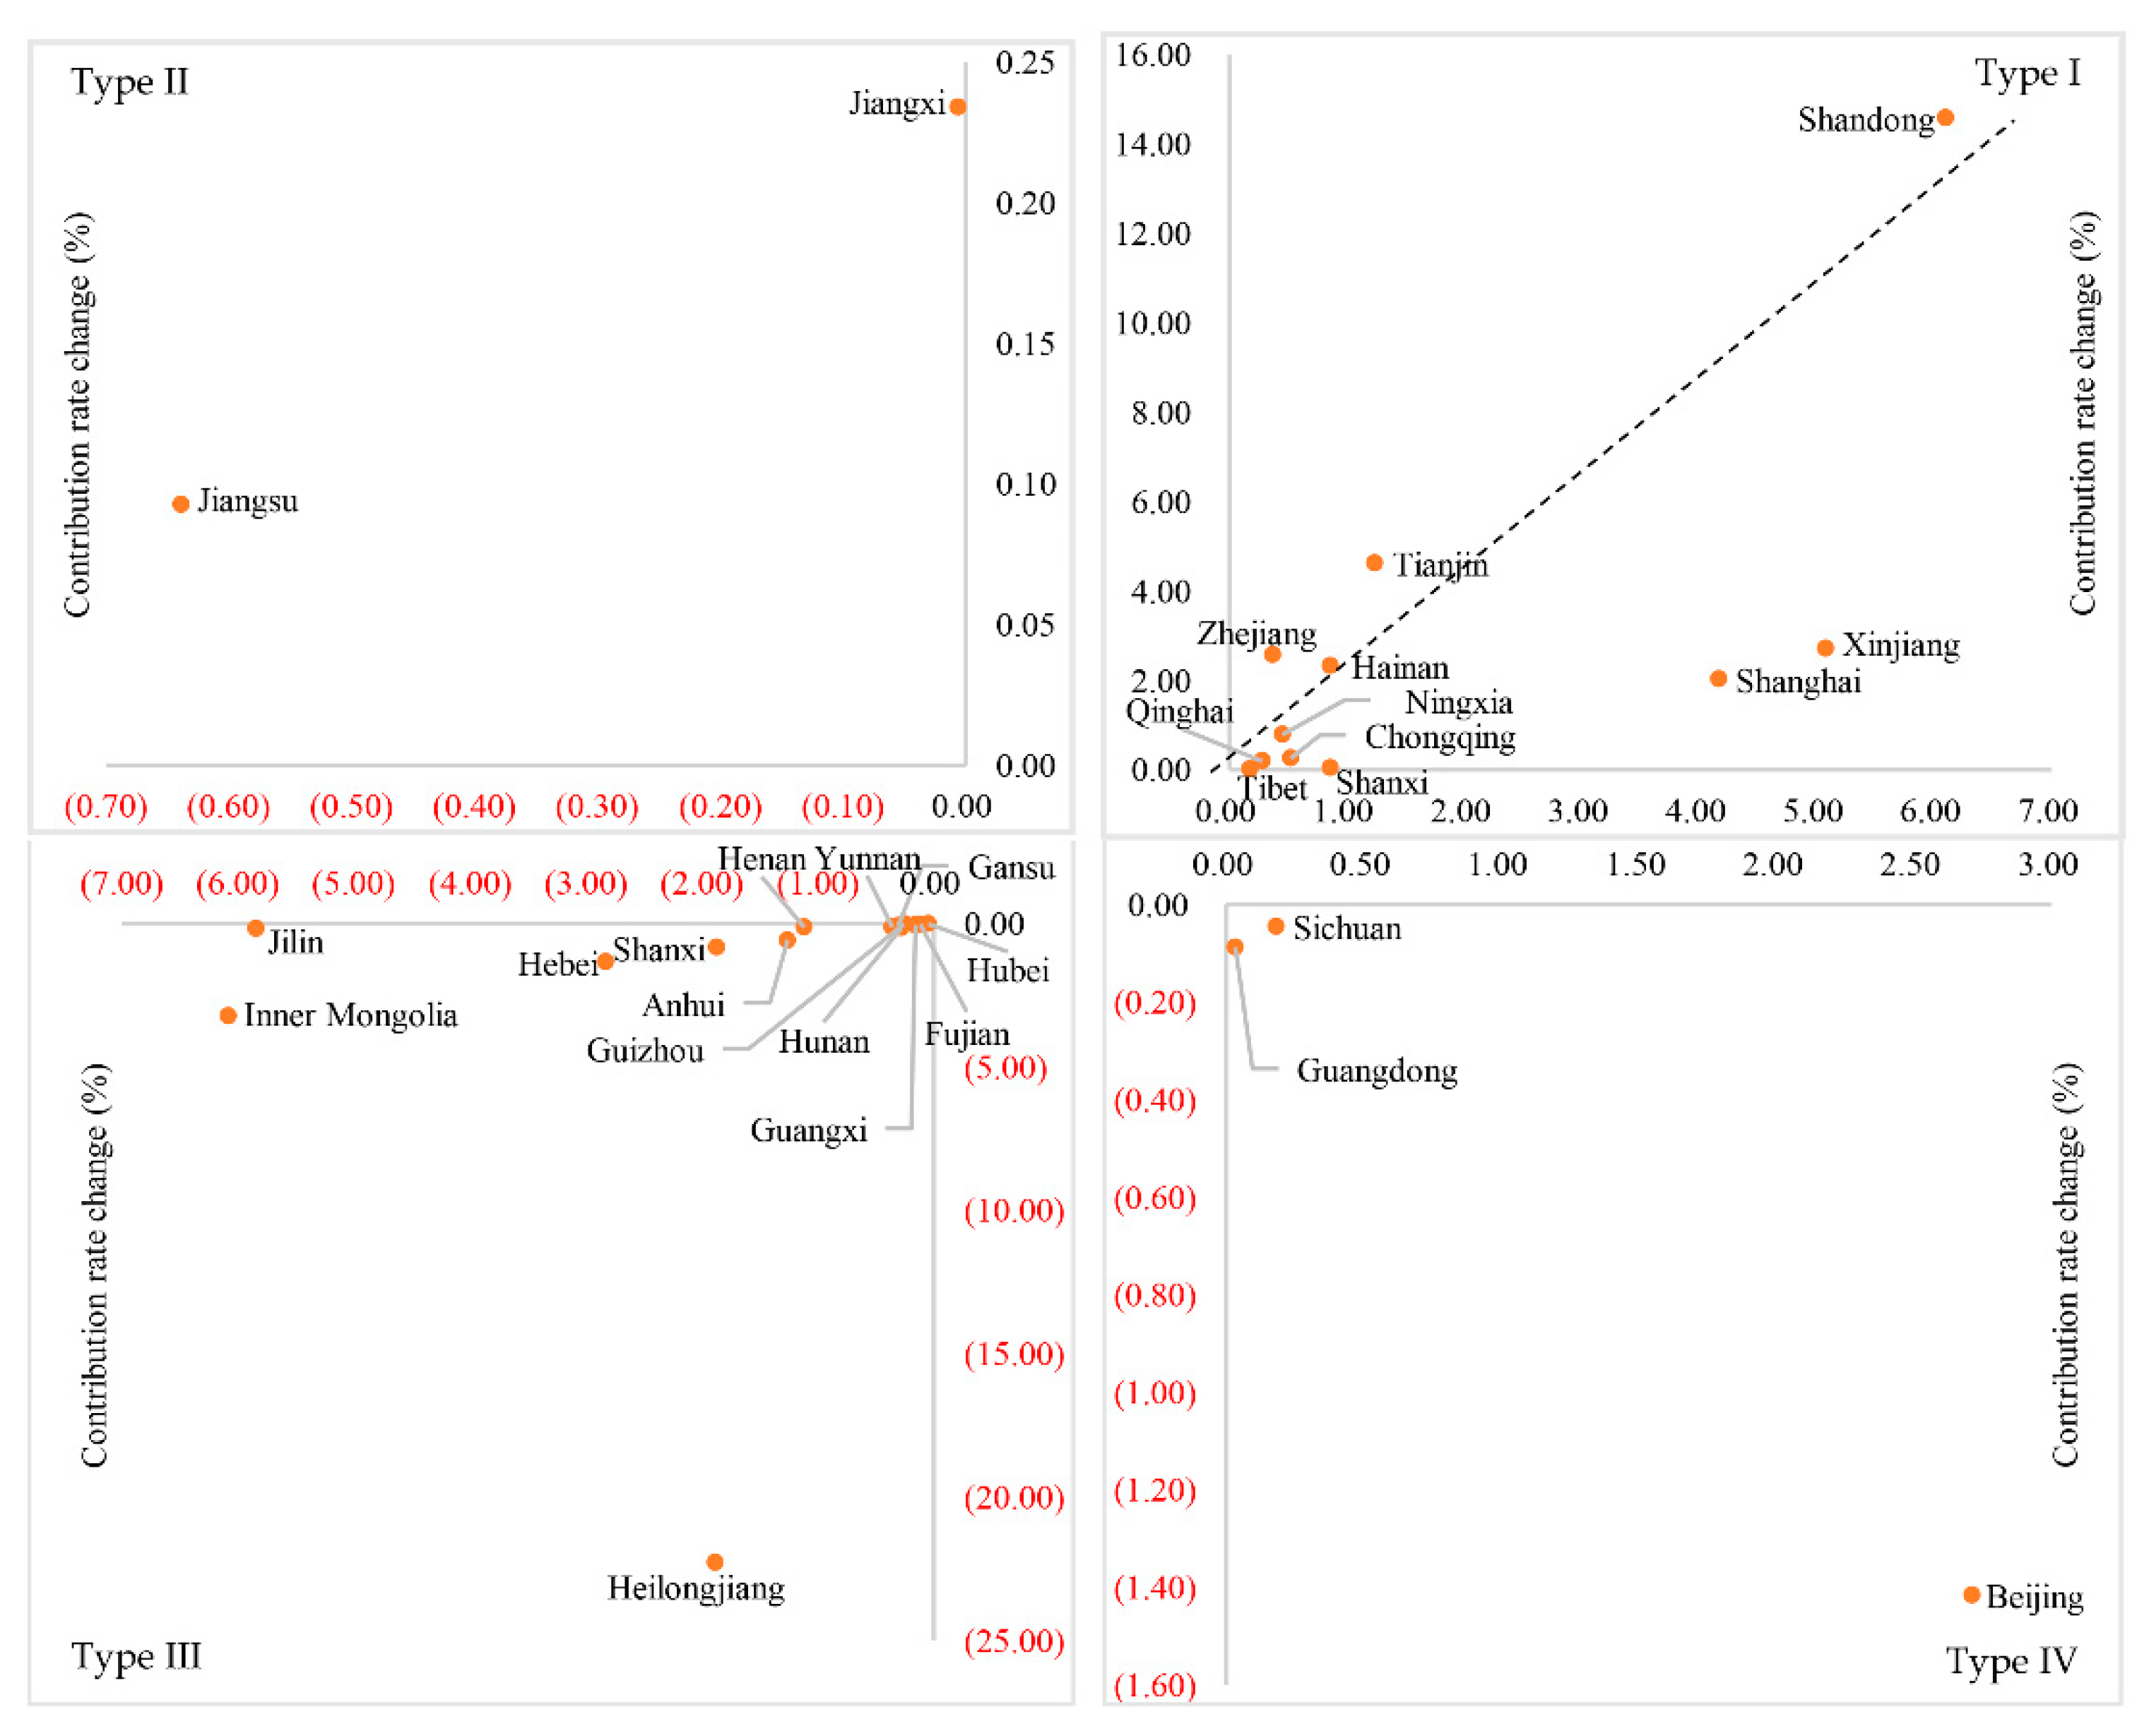
According to the ETV-EECE CR Model, the RefPetral was Type I-B, the targeted reduction type. It showed that the increase of the contribution rate of EECE was greater than that of ETV. It should reduce the ITV cooperation with the target provinces to ensure the ETV and control the increase of EECE. In order to identify the target provinces, the ITV-DSE CR Model was used for the adjustment classification of DSE. According to the coupling characteristics, the 30 provinces were divided into four types. There are 11 provinces in Type I, two provinces in Type II, 14 provinces in Type III, and three provinces in Type IV, respectively (
Figure 9). The target provinces should be characterized by the decrease in ITV, while the DSE increased when they traded with Liaoning Province. As a result, the provinces of Type IV were the target provinces, which were Beijing, Sichuan, and Guangdong Province.
According to the MRIO Model, if the ETV of RefPetral reduced 100 million CNY, the EECE and the DSE would be reduced by 23.35 ktCO2 and 1.65 ktCO2, respectively. Among them, Liaoning Province had the largest reduction of 21.70 ktCO2, followed by Beijing with 1.29 ktCO2, Sichuan with 0.18 ktCO2, and Guangdong with 0.18 ktCO2.
7. Conclusions
In this research, Liaoning Province from 2012 to 2017 was selected as the research object. Only Liaoning Province had the largest EECE intensity and the fastest growth of EECE over these six years. Based on the multi-region input-output tables of China in 2012 and 2017, we applied the MRIO Model and ArcGIS spatial analysis tools, constructed a CR Model for trade value and carbon emissions, quantitatively assessed the EECE and its DSE for Liaoning Province, depicted the spatial-temporal evolution pattern, proposed sectoral adjustment countermeasures, and evaluated the adjustment effects. The main conclusions were as follows:
First, in China, the EECE accounted for nearly 30% and was one of the important reasons that it remained high for the total carbon emissions. The EECE was concentrated in five provinces of China, which were Liaoning, Shandong, Zhejiang, Jiangsu and Guangdong. Among them, Liaoning Province has the largest EECE intensity, with 0.91 T/K CNY, which was higher than the national average of 0.66 T/K CNY in 2017. Meanwhile, the EECE grew the fastest, with an increase from 21.42 MtCO2 in 2012 to 32.08 MtCO2 in 2017, of which the growth rate was 49.78%. The EECE of Liaoning Province was not evenly distributed in all sectors, but mainly concentrated in MetalSmelt and RefPetral, with 9.07 MtCO2 and 6.04 MtCO2, respectively. The EECE not only caused huge carbon emissions for Liaoning itself, but also produced DSE for other provinces. In 2017, the DSE of MetalSmelt was 984.32 ktCO2, with ranking first in China. The DSE of RefPetral increased from 62.87 ktCO2 in 2012 to 431.06 ktCO2 in 2017, which grew the fastest.
Second, the spatial pattern of DSE was not balanced. From 2012 to 2017, the DSE of Liaoning Province showed a spatial agglomeration effect. Jilin has become the largest province of DSE, which increased from 265.40 ktCO2 in 2012 to 749.13 ktCO2 in 2017, with a growth rate of 182.27%. The DSE spatial pattern of different sectors were also different. There was obvious spatial heterogeneity of agglomeration and diffusion. The MetalSmelt showed a spatial agglomeration effect in Hebei, Jilin, and Shandong Province. However, the RefPetral showed an obvious spatial diffusion effect. The number of provinces with DSE greater than 10 ktCO2 increased from only two in 2012 to eight in 2017.
Thirdly, according to the ETV-EECE CR Model, we divided the sectors into four types, and according to the type characteristics, adjustment countermeasures were proposed. Among them, 27 sectors in Liaoning Province (except ElectpowerProd and Water) were divided into four types. Type I-A, which has six sectors, should adopt targeted promotion countermeasures. Type I-B, which has three sectors, should adopt targeted reduction countermeasures. Type II, which has zeros sector, should adopt encouraged countermeasures. Type III and Type IV, which have 11 sectors and 7 sectors, respectively, should adopt control countermeasures.
Fourth, based on the MRIO Model, the adjustment countermeasures effects were assessed. We quantitatively evaluated the adjustment countermeasures effects of MetalSmelt and RefPetral for Liaoning Province. MetalSmelt was Type IV, the controlled type. Its ETV reduced by 100 million CNY, and the EECE could be reduced by 21.57 ktCO2, while the DSE could reduce 1.59 ktCO2. Hebei and Jilin Province saw the largest DSE reductions, reduced by 0.32 ktCO2 and 0.22 ktCO2, respectively. The RefPetral was Type I-B, the targeted reduction type. Its ETV reduced by 100 million CNY, and the EECE could be reduced by 23.35 ktCO2, while the DSE could be reduced by 1.65 ktCO2. Liaoning Province saw the largest reduction with 21.70 ktCO2, followed by Beijing with 1.29 ktCO2, Sichuan with 0.18 ktCO2, and Guangdong with 0.18 ktCO2.
EECE not only affects the exporting province, but also leads the DSE to other provinces in a country. When formulating carbon reduction policies, we should not only consider the EECE, but also comprehensively consider the DSE to other regions. The research conclusions could provide a decision-making basis for the case area to formulate lower-cost and better-effective carbon reduction countermeasures. It also could provide reference and scientific support to achieve “Carbon Neutrality” and sustainable development in similar regions of the world with the rapid growth of EECE.
Author Contributions
Conceptualization, S.X. and H.C.; methodology, S.X.; software, M.Z.; validation, H.C. and M.Z.; formal analysis, S.X.; investigation, S.X. and K.G.; resources, H.C. and S.X.; data curation, S.X.; writing—original draft preparation, S.X.; writing—review and editing, S.X. and H.C.; visualization, Q.L.; supervision, H.C. and Y.G.; project administration, H.C.; funding acquisition, H.C. All authors have read and agreed to the published version of the manuscript.
Funding
This research was funded by National Natural Science Foundation of China (Grant number 32161143029, 42071282, 71733003), A-type Strategic Leading Science & Technology Project of Chinese Academy of Sciences (Grant number XDA28130300, XDA20030203), Key Collaborative Research Program of the Alliance of International Science Organizations (Grant number ANSO-CR-KP-2020-02, ANSO-CR-KP-2020-06).
Institutional Review Board Statement
Not applicable.
Informed Consent Statement
Not applicable.
Data Availability Statement
Not applicable.
Conflicts of Interest
The authors declare that they have no conflict of interest.
Nomenclature
| Abbreviation | Full Name |
| EECE | Export embodied carbon emissions |
| DSE | Domestic spillover effects |
| MRIO Model | Multi-region Input-output Model |
| CR Model | Coupling Relationship Model |
| ETV | Export trade value |
| ITV | Interprovincial trade value |
| ETV-EECE CR Model | Coupling Relationship Model of export trade value and the export embodied carbon emissions |
| ITV-DSE CR Model | Coupling Relationship Model of interprovincial trade value and the domestic spillover effects of |
| IPCC | Intergovernmental Panel on Climate Change |
Appendix A
Table A1.
The 29 sectors.
Table A1.
The 29 sectors.
| Sector Code | Full Name | Abbreviation |
|---|
| s1 | Agriculture | Agri |
| s2 | Coal mining and washing | Coalmin |
| s3 | Crude petroleum and natural gas products | CrudeOil |
| s4 | Metal ore mining | MtealOreMin |
| s5 | Non-ferrous mineral mining | NonMtealOreMin |
| s6 | Manufacture of food products and tobacco processing | FoodTobacco |
| s7 | Textile goods | Textile |
| s8 | Apparel, leather, and related products | Apparel |
| s9 | Wood processing and furniture manufacturing | WoodFurniture |
| s10 | Papermaking, printing and paper product manufacturing | PaperCulture |
| s11 | Petroleum processing, coking, and nuclear fuel processing | RefPetral |
| s12 | Chemicals and medicinal products | Chemical |
| s13 | Nonmetal mineral products | NonMProd |
| s14 | Metal smelting and rolling processing | MetalSmelt |
| s15 | Metal products | MetalProd |
| s16 | General Equipment | GeneralEq |
| s17 | Professional setting | ProfSetting |
| s18 | Transportation equipment manufacturing | TranspEq |
| s19 | Electric equipment and machinery manufacturing | ElecMachinery |
| s20 | Electronic and telecommunications equipment manufacturing | ElectronicEq |
| s21 | Instrumentation and cultural, office machinery manufacturing | MeasureInstr |
| s22 | Other manufacturing industry | OthManuf |
| s23 | Electricity and heat production and supply | ElectpowerProd |
| s24 | Gas production and supply | Gas |
| s25 | Water production and supply | Water |
| s26 | Construction | Construct |
| s27 | Transportation, storage, and post and telecommunication services | Transport |
| s28 | Wholesale and retail trade, catering services | WholesRetail |
| s29 | Other services | Others |
References
- Xia, S.-Y.; Yang, Y. Spatio-temporal differentiation of carbon budget and carbon compensation zoning in Beijing-Tianjin-Hebei Urban Agglomeration based on the Plan for Major Function-oriented Zones. J. Geogr. Sci. 2022, 77, 679–696. [Google Scholar]
- Shi, M.-J.; Wang, Y.; Zhang, Z.-Y.; Zhou, X. Regional Carbon Footprint and Interregional Transfer of Carbon Emissions in China. J. Geogr. Sci. 2012, 67, 1327–1338. [Google Scholar]
- Han, M.-Y.; Yao, Q.-H.; Liu, W.-D.; Dunford, M. Tracking embodied carbon flows in the Belt and Road regions. J. Geogr. Sci. 2018, 28, 1263–1274. [Google Scholar] [CrossRef] [Green Version]
- The Central Economic Work Conference Was Held Xi Jinping Li Keqiang made an Important_Chinese Government Network. Available online: http://www.gov.cn/xinwen/2020-12/18/content_5571002.htm (accessed on 24 May 2022).
- Chen, P.; Wang, H.; Guo, M.; Wang, J.; Cai, S.; Li, M.; Sun, K.; Wang, Y. Decomposition Analysis of Regional Embodied Carbon Flow and Driving Factors—Taking Shanghai as an Example. Sustainability 2022, 14, 11109. [Google Scholar] [CrossRef]
- Chen, Z.; Tan, Y. The Imbalance of Embodied CO2 in China’s Imports, Exports and Its Causes. Sustainability 2022, 14, 6460. [Google Scholar] [CrossRef]
- Li, L.; Lei, Y.; He, C.; Wu, S.; Chen, J. Study on the CO2 Emissions Embodied in the Trade of China’s Steel Industry: Based on the Input–Output Model. Nat. Hazards 2017, 86, 989–1005. [Google Scholar] [CrossRef]
- Strive to Achieve Carbon Peak by 2030 and Carbon Neutrality by 2060—Win the Hard Battle of Low-Carbon_ Chinese Government Net. Available online: http://www.gov.cn/xinwen/2021-04/02/content_5597403.htm (accessed on 24 May 2022).
- Opinions of the CPC Central Committee and the State Council on Complete, Accurate, and Comprehensive Implementation of the New Development Concept to Do a Good Job in Carbon Peaking and Carbon Neutrality Relevant Documents of the Central Committee_Chinese Government Net. Available online: http://www.gov.cn/zhengce/2021-10/24/content_5644613.htm (accessed on 24 May 2022).
- Measures for the Administration of Carbon Emissions Trading (Trial Implementation)_Others _Chinese Government Net. Available online: http://www.gov.cn/zhengce/zhengceku/2021-01/06/content_5577360.htm (accessed on 24 May 2022).
- Guiding Opinions on Coordinating and Strengthening Work Related to Climate Change and Ecological Environmental Protection. Available online: https://www.mee.gov.cn/xxgk2018/xxgk/xxgk03/202101/t20210113_817221.html (accessed on 24 May 2022).
- Zeng, S.; Li, G.; Wu, S.; Dong, Z. The Impact of Green Technology Innovation on Carbon Emissions in the Context of Carbon Neutrality in China: Evidence from Spatial Spillover and Nonlinear Effect Analysis. Int. J. Environ. Res. Public Health 2022, 19, 730. [Google Scholar] [CrossRef]
- Tong, X.; Gu, Y.; Jin, T.; Gao, S. Embodied Carbon Emissions in Export of Yangtze River Delta: Calculation and Decomposition of Driving Factors. Sustainability 2022, 14, 12415. [Google Scholar] [CrossRef]
- Guo, J.; Zhang, Z.; Meng, L. China’s provincial CO2 emissions embodied in international and interprovincial trade. Energy Policy 2012, 42, 486–497. [Google Scholar] [CrossRef]
- Yang, X.; Su, B. Impacts of international export on global and regional carbon intensity. Appl. Energy 2019, 253, 113552. [Google Scholar] [CrossRef]
- Zhang, Q.; Jiang, X.; Tong, D.; Davis, S.J.; Zhao, H.; Geng, G.; Feng, T.; Zheng, B.; Lu, Z.; Streets, D.G.; et al. Transboundary health impacts of transported global air pollution and international trade. Nature 2017, 543, 705–709. [Google Scholar] [CrossRef] [Green Version]
- Yang, Y.; Qu, S.; Cai, B.; Liang, S.; Wang, Z.; Wang, J.; Xu, M. Mapping Global Carbon Footprint in China. Nat. Commun. 2020, 11, 2237. [Google Scholar] [CrossRef]
- Liu, H.; Zong, Z.; Hynes, K.; De Bruyne, K. Can China reduce the carbon emissions of its manufacturing exports by moving up the global value chain? Res. Int. Bus. Financ. 2020, 51, 101101. [Google Scholar] [CrossRef]
- Wang, S.; Tang, Y.; Du, Z.; Song, M. Export trade, embodied carbon emissions, and environmental pollution: An empirical analysis of China’s high- and new-technology industries. J. Environ. Manag. 2020, 276, 111371. [Google Scholar] [CrossRef]
- Embodied Energy in Export Flows Along Global Value Chain: A Case Study of China’s Export Trade. Available online: https://www.researchgate.net/publication/351310885_Embodied_Energy_in_Export_Flows_Along_Global_Value_Chain_A_Case_Study_of_China’s_Export_Trade (accessed on 16 August 2022).
- Lin, B.; Sun, C. Evaluating carbon dioxide emissions in international trade of China. Energy Policy 2010, 38, 613–621. [Google Scholar] [CrossRef]
- Arce, G.; López, L.A.; Guan, D. Carbon emissions embodied in international trade: The post-China era. Appl. Energy 2016, 184, 1063–1072. [Google Scholar] [CrossRef]
- Smil, V. China’s Environmental Crisis: An Inquiry into the Limits of National Development: An Enquiry into the Limits of National Development; Routledge: New York, NY, USA, 2016; ISBN 978-1-315-28841-3. [Google Scholar]
- Yang, Y.; Dong, S.; Li, F.; Cheng, H.; Chi, Y.; Li, Z.; Li, S.; Liu, Q.; Xia, B.; Li, Y. Interregional polarized and trickling-down effect of carbon emission space and the optimization policies: Case studies of the Jing-Jin-Ji region. J. Clean. Prod. 2022, 370, 133426. [Google Scholar] [CrossRef]
- The Measurement of the Spatial Effects of Chinese Regional Carbon Emissions Caused by Exports. SpringerLink. Available online: https://link.springer.com/article/10.1007/s11442-015-1237-0 (accessed on 18 July 2022).
- Xia, Y.; Fan, Y.; Yang, C. Assessing the impact of foreign content in China’s exports on the carbon outsourcing hypothesis. Appl. Energy 2015, 150, 296–307. [Google Scholar] [CrossRef]
- Cheng, H.; Dong, S.; Li, F.; Yang, Y.; Li, S.; Li, Y. Multi-regional Input-output Analysis of Spatial-temporal Evolution Driving Force for Carbon Emissions Embodied in Interprovincial Trade and Optimization Policies: A Case Study of Northeast Industrial District in China. Environ. Sci. Technol. 2018, 52, 346–358. [Google Scholar] [CrossRef]
- Yang, W.; Gao, H.; Yang, Y. Analysis of Influencing Factors of Embodied Carbon in China’s Export Trade in the Background of “Carbon Peak” and “Carbon Neutrality”. Sustainability 2022, 14, 3308. [Google Scholar] [CrossRef]
- Zhao, H.; Chen, H.; Fang, Y.; Song, A. Transfer Characteristics of Embodied Carbon Emissions in Export Trade—Evidence from China. Sustainability 2022, 14, 8034. [Google Scholar] [CrossRef]
- Yuan, R.; Rodrigues, J.F.D.; Behrens, P. Impact of non-fossil electricity on the carbon emissions embodied in China’s exports. J. Clean. Prod. 2018, 192, 582–596. [Google Scholar] [CrossRef]
- Andersen, O.; Gössling, S.; Simonsen, M.; Walnum, H.J.; Peeters, P.; Neiberger, C. CO2 emissions from the transport of China’s exported goods. Energy Policy 2010, 38, 5790–5798. [Google Scholar] [CrossRef]
- Peters, G.P.; Hertwich, E.G. CO2 embodied in international trade with implications for global climate policy. Environ. Sci. Technol. 2008, 42, 1401–1407. [Google Scholar] [CrossRef] [Green Version]
- Huang, Y.; Zhang, Y.; Xiang, Y.; Dong, X. Has servitization reduced the embodied carbon emissions of manufacturing export trade? Evidence from 38 countries. Environ. Technol. Innov. 2022, 28, 102950. [Google Scholar] [CrossRef]
- China’s Carbon Emissions and International Trade: Implications for Post-2012 Policy. Available online: https://ideas.repec.org/a/taf/tcpoxx/v8y2008i6p577-587.html (accessed on 25 July 2022).
- Tian, W.; An, H.; Li, X.; Li, H.; Quan, K.; Lu, X.; Bai, H. CO2 accounting model and carbon reduction analysis of iron and steel plants based on intra- and inter-process carbon metabolism. J. Clean. Prod. 2022, 360, 132190. [Google Scholar] [CrossRef]
- Pan, J.; Phillips, J.; Chen, Y. China’s Balance of Emissions Embodied in Trade: Approaches to Measurement and Allocating International Responsibility. In The Economics and Politics of Climate Change; Oxford University Press: Oxford, UK, 2009; ISBN 978-0-19-957328-8. [Google Scholar]
- Wang, Z.; Li, Y.; Cai, H.; Wang, B. Comparative analysis of regional carbon emissions accounting methods in China: Production-based versus consumption-based principles. J. Clean. Prod. 2018, 194, 12–22. [Google Scholar] [CrossRef]
- Minx, J.C.; Baiocchi, G.; Peters, G.P.; Weber, C.L.; Guan, D.; Hubacek, K. A “carbonizing dragon”: China’s fast growing CO2 emissions revisited. Environ. Sci. Technol. 2011, 45, 9144–9153. [Google Scholar] [CrossRef]
- Guan, D.; Peters, G.; Weber, C.; Klaus, H. Journey to world top emitter: An analysis of the driving forces of China’s recent CO2 emissions surge. Geophys. Res. Lett. Geophys. Res. Lett. 2009, 36, 04709. [Google Scholar] [CrossRef] [Green Version]
- The Global Picture and Temporal Evolution of Carbon Transfer in International Trade: Statistical Research, 2016, 02. Available online: https://www.cnki.com.cn/Article/CJFDTOTAL-TJYJ201602006.htm (accessed on 24 May 2022).
- Chen, Z.; Zhang, L.; Zhang, Y.; Zhao, Y.; Zhong, Z. Regional Differences in the Emission-Reduction Effect of Environmental Regulation Based on the Perspective of Embodied Carbon Spatial Transfer Formed by Inter-Regional Trade. Sustainability 2022, 14, 9707. [Google Scholar] [CrossRef]
- Bache, T. Embodied Carbon in Trade: A Survey of the Empirical Literature. Available online: https://www.lse.ac.uk/granthaminstitute/publication/embodied-carbon-in-trade-a-survey-of-the-empirical-literature-working-paper-77/ (accessed on 22 July 2022).
- Wang, J.; Dong, K.; Dong, X.; Jiang, Q. Research on the carbon emission effect of the seven regions along the Belt and Road—Based on the spillover and feedback effects model. J. Clean. Prod. 2021, 319, 128758. [Google Scholar] [CrossRef]
- Bayer, P.; Aklin, M. The European Union Emissions Trading System Reduced CO2 Emissions despite Low Prices. Proc. Natl. Acad. Sci. USA 2020, 117, 8804–8812. [Google Scholar] [CrossRef]
- Zheng, Z. Re-calculation of responsibility distribution and spatiotemporal patterns of global production carbon emissions from the perspective of global value chain. Sci. Total Environ. 2021, 773, 145065. [Google Scholar] [CrossRef]
- Zhao, H.; Zhang, Q.; Huo, H.; Lin, J.; Liu, Z.; Wang, H.; Guan, D.; He, K. Environment-economy tradeoff for Beijing–Tianjin–Hebei’s exports. Appl. Energy 2016, 184, 926–935. [Google Scholar] [CrossRef] [Green Version]
- Meng, J.; Mi, Z.; Guan, D.; Li, J.; Tao, S.; Li, Y.; Feng, K.; Liu, J.; Liu, Z.; Wang, X.; et al. The rise of South–South trade and its effect on global CO2 emissions. Nat. Commun. 2018, 9, 1871. [Google Scholar] [CrossRef] [Green Version]
- Zhong, Z.; Jiang, L.; Zhou, P. Transnational transfer of carbon emissions embodied in trade: Characteristics and determinants from a spatial perspective. Energy 2018, 147, 858–875. [Google Scholar] [CrossRef]
- Zhang, W.; Wang, F.; Hubacek, K.; Liu, Y.; Wang, J.; Feng, K.; Jiang, L.; Jiang, H.; Zhang, B.; Bi, J. Unequal Exchange of Air Pollution and Economic Benefits Embodied in China’s Exports. Environ. Sci. Technol. 2018, 52, 3888–3898. [Google Scholar] [CrossRef]
- Sun, L.; Cao, X.; Alharthi, M.; Zhang, J.; Taghizadeh-Hesary, F.; Mohsin, M. Carbon emission transfer strategies in supply chain with lag time of emission reduction technologies and low-carbon preference of consumers. J. Clean. Prod. 2020, 264, 121664. [Google Scholar] [CrossRef]
- Xu, M.; Li, R.; Crittenden, J.C.; Chen, Y. CO2 emissions embodied in China’s exports from 2002 to 2008: A structural decomposition analysis. Energy Policy 2011, 39, 7381–7388. [Google Scholar] [CrossRef]
- Meng, B.; Xue, J.; Feng, K.; Guan, D.; Fu, X. China’s inter-regional spillover of carbon emissions and domestic supply chains. Energy Policy 2013, 61, 1305–1321. [Google Scholar] [CrossRef] [Green Version]
- Zheng, H.; Bai, Y.; Wei, W.; Meng, J.; Zhang, Z.; Song, M.; Guan, D. Chinese provincial multi-regional input-output database for 2012, 2015, and 2017. Sci. Data 2021, 8, 244. [Google Scholar] [CrossRef]
- Anshan Iron and Steel Co., LTD. The “steel backbone” of great power heavy equipment. Metall. Enterp. Cult. 2019, 65. [Google Scholar]
| Publisher’s Note: MDPI stays neutral with regard to jurisdictional claims in published maps and institutional affiliations. |
© 2022 by the authors. Licensee MDPI, Basel, Switzerland. This article is an open access article distributed under the terms and conditions of the Creative Commons Attribution (CC BY) license (https://creativecommons.org/licenses/by/4.0/).


