
Toward a Healthy Urban Living Environment: Assessing 15-Minute Green-Blue Space Accessibility


Abstract
:1. Introduction
2. Data and Methodology
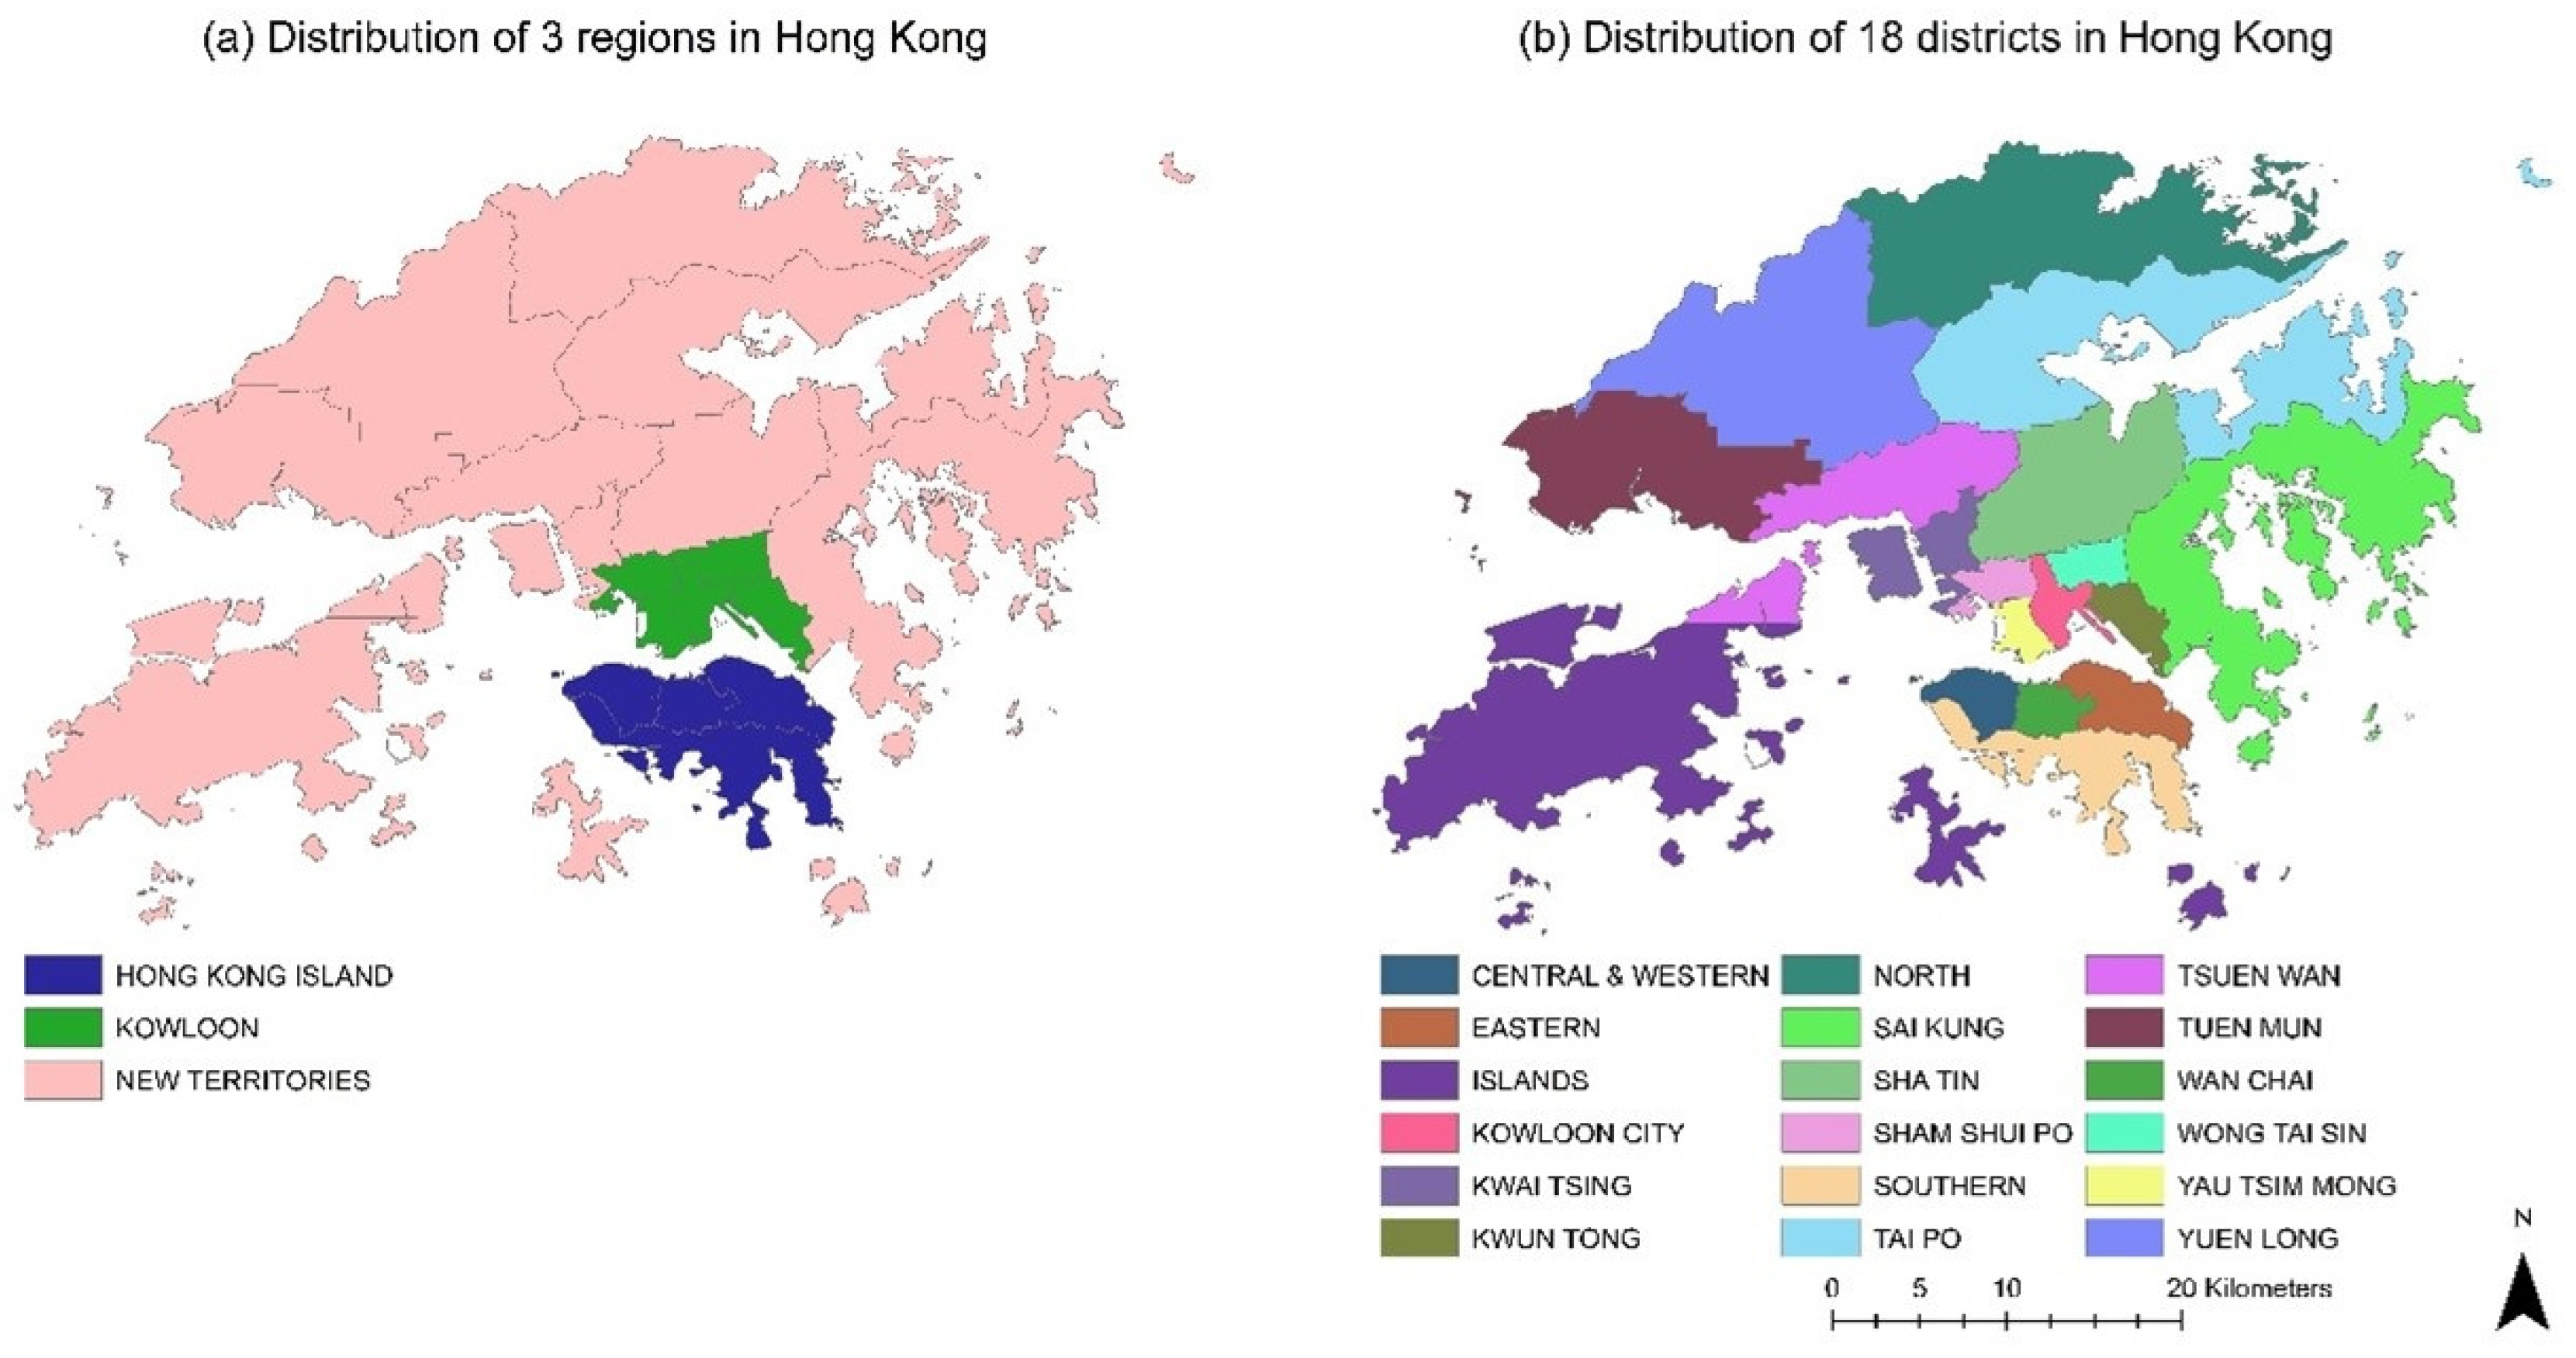
2.1. Study Area
2.2. Data Source
2.3. Methodology
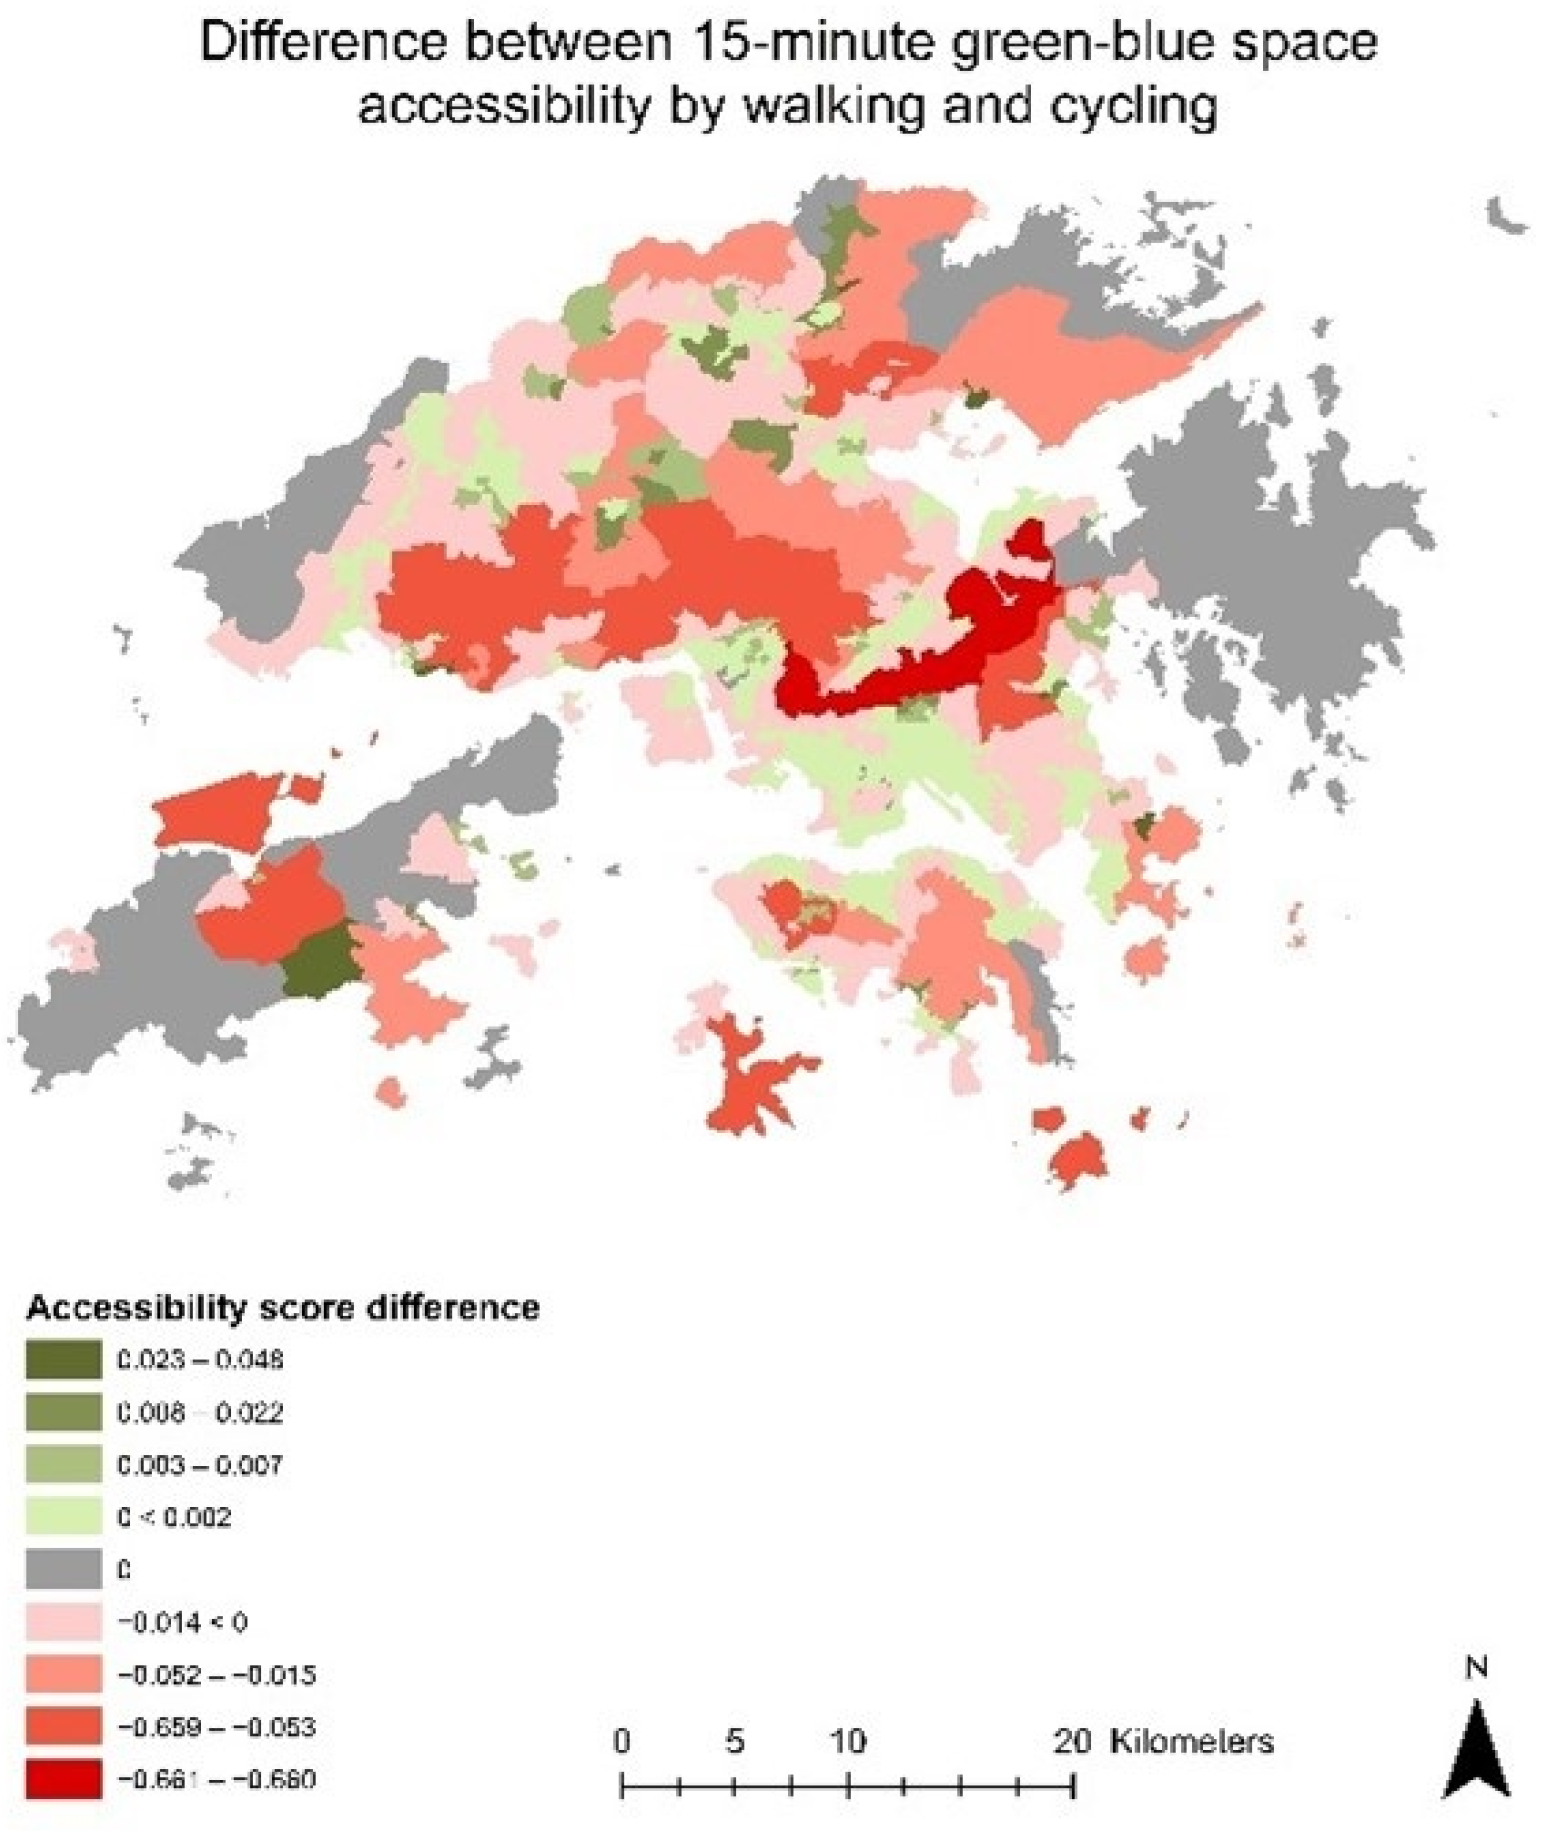
3. Results
4. Discussion and Conclusions
Author Contributions
Funding
Data Availability Statement
Conflicts of Interest
References
- Rigolon, A.; Browning, M.H.; McAnirlin, O.; Yoon, H.V. Green Space and Health Equity: A Systematic Review on the Potential of Green Space to Reduce Health Disparities. Int. J. Environ. Res. Public Health 2021, 18, 2563. [Google Scholar] [CrossRef] [PubMed]
- Crouse, D.L.; Pinault, L.; Balram, A.; Hystad, P.; Peters, P.A.; Chen, H.; van Donkelaar, A.; Martin, R.V.; Ménard, R.; Robichaud, A.; et al. Urban greenness and mortality in Canada’s largest cities: A national cohort study. Lancet Planet. Health 2017, 1, e289–e297. [Google Scholar] [CrossRef] [PubMed]
- De la Fuente, F.; Saldías, M.A.; Cubillos, C.; Mery, G.; Carvajal, D.; Bowen, M.; Bertoglia, M.P. Green space exposure association with type 2 diabetes mellitus, physical activity, and obesity: A systematic review. Int. J. Environ. Res. Public Health 2021, 18, 97. [Google Scholar] [CrossRef] [PubMed]
- Pasanen, T.P.; White, M.P.; Wheeler, B.W.; Garrett, J.K.; Elliott, L.R. Neighbourhood blue space, health and wellbeing: The mediating role of different types of physical activity. Environ. Int. 2019, 131, 105016. [Google Scholar] [CrossRef] [PubMed]
- Braçe, O.; Garrido-Cumbrera, M.; Foley, R.; Correa-Fernández, J.; Suárez-Cáceres, G.; Lafortezza, R. Is a View of Green Spaces from Home Associated with a Lower Risk of Anxiety and Depression? Int. J. Environ. Res. Public Health 2020, 17, 7014. [Google Scholar] [CrossRef]
- Britton, E.; Kindermann, G.; Domegan, C.; Carlin, C. Blue care: A systematic review of blue space interventions for health and wellbeing. Health Promot. Int. 2018, 35, 50–69. [Google Scholar] [CrossRef] [Green Version]
- Nutsford, D.; Pearson, A.; Kingham, S. An ecological study investigating the association between access to urban green space and mental health. Public Health 2013, 127, 1005–1011. [Google Scholar] [CrossRef]
- Kan, Z.; Kwan, M.-P.; Huang, J.; Wong, M.S.; Liu, D. Comparing the space-time patterns of high-risk areas in different waves of COVID-19 in Hong Kong. Trans. GIS 2021, 25, 2982–3001. [Google Scholar] [CrossRef]
- Choi, K.; Giridharan, N.; Cartmell, A.; Lum, D.; Signal, L.; Puloka, V.; Crossin, R.; Gray, L.; Davies, C.; Baker, M.; et al. Life during lockdown: A qualitative study of low-income New Zealanders’ experience during the COVID-19 pandemic. New Zealand Med. J. 2021, 134, 52–56. [Google Scholar]
- Purtle, J. COVID-19 and mental health equity in the United States. Soc. Psychiatry Psychiatr. Epidemiol. 2020, 55, 969–971. [Google Scholar] [CrossRef]
- Pouso, S.; Borja, Á.; Fleming, L.E.; Gómez-Baggethun, E.; White, M.P.; Uyarra, M.C. Contact with blue-green spaces during the COVID-19 pandemic lockdown beneficial for mental health. Sci. Total Environ. 2021, 756, 143984. [Google Scholar] [CrossRef] [PubMed]
- Reid, C.E.; Rieves, E.S.; Carlson, K. Perceptions of green space usage, abundance, and quality of green space were associated with better mental health during the COVID-19 pandemic among residents of Denver. PLoS ONE 2022, 17, e0263779. [Google Scholar] [CrossRef] [PubMed]
- Vos, S.; Bijnens, E.M.; Renaers, E.; Croons, H.; Van Der Stukken, C.; Martens, D.S.; Plusquin, M.; Nawrot, T.S. Residential green space is associated with a buffering effect on stress responses during the COVID-19 pandemic in mothers of young children, a prospective study. Environ. Res. 2022, 208, 112603. [Google Scholar] [CrossRef] [PubMed]
- Geary, R.S.; Wheeler, B.; Lovell, R.; Jepson, R.; Hunter, R.; Rodgers, S. A call to action: Improving urban green spaces to reduce health inequalities exacerbated by COVID-19. Prev. Med. 2021, 145, 106425. [Google Scholar] [CrossRef] [PubMed]
- Liu, D.; Kwan, M.-P.; Kan, Z. Analysis of urban green space accessibility and distribution inequity in the City of Chicago. Urban For. Urban Green. 2021, 59, 127029. [Google Scholar] [CrossRef]
- Song, Y.; Chen, B.; Ho, H.C.; Kwan, M.-P.; Liu, D.; Wang, F.; Wang, J.; Cai, J.; Li, X.; Xu, Y.; et al. Observed inequality in urban greenspace exposure in China. Environ. Int. 2021, 156, 106778. [Google Scholar] [CrossRef]
- Moreno, C. La Ville du Quart D’heure: Pour un Nouveau Chrono-Urbanisme. La Tribune. Available online: https://www.latribune.fr/regions/smart-cities/la-tribune-de-carlos-moreno/la-ville-du-quart-d-heure-pour-un-nouveau-chrono-urbanisme-604358.html (accessed on 5 October 2016).
- Moreno, C.; Allam, Z.; Chabaud, D.; Gall, C.; Pratlong, F. Introducing the “15-Minute City”: Sustainability, Resilience and Place Identity in Future Post-Pandemic Cities. Smart Cities 2021, 4, 93–111. [Google Scholar] [CrossRef]
- Ugolini, F.; Massetti, L.; Calaza-Martínez, P.; Cariñanos, P.; Dobbs, C.; Ostoić, S.K.; Marin, A.M.; Pearlmutter, D.; Saaroni, H.; Šaulienė, I.; et al. Effects of the COVID-19 pandemic on the use and perceptions of urban green space: An international exploratory study. Urban For. Urban Green 2020, 56, 126888. [Google Scholar] [CrossRef] [PubMed]
- Van Leeuwen, E.; Nijkamp, P.; de Noronha Vaz, T. The multifunctional use of urban greenspace. Int. J. Agric. Sustain. 2010, 8, 20–25. [Google Scholar] [CrossRef] [Green Version]
- Liu, H.; Remme, R.P.; Hamel, P.; Nong, H.; Ren, H. Supply and demand assessment of urban recreation service and its implication for greenspace planning-A case study on Guangzhou. Landsc. Urban Plan. 2020, 203, 103898. [Google Scholar] [CrossRef]
- White, M.P.; Elliott, L.R.; Gascon, M.; Roberts, B.; Fleming, L.E. Blue space, health and well-being: A narrative overview and synthesis of potential benefits. Environ. Res. 2020, 191, 110169. [Google Scholar] [CrossRef] [PubMed]
- Zhou, X.; Rana, M.P. Social benefits of urban green space: A conceptual framework of valuation and accessibility measurements. Manag. Environ. Qual. Int. J. 2012, 23, 173–189. [Google Scholar] [CrossRef]
- Liu, D.; Kwan, M.-P.; Huang, J.; Kan, Z.; Song, Y.; Li, X. Analyzing income-based inequality in transit nodal accessibility. Travel Behav. Soc. 2021, 27, 57–64. [Google Scholar] [CrossRef]
- Kan, Z.; Kwan, M.-P.; Wong, M.S.; Huang, J.; Liu, D. Identifying the space-time patterns of COVID-19 risk and their associations with different built environment features in Hong Kong. Sci. Total. Environ. 2021, 772, 145379. [Google Scholar] [CrossRef]
- Liu, D.; Kwan, M.-P.; Kan, Z. Analyzing disparities in transit-based healthcare accessibility in the Chicago Metropolitan Area. Can. Geogr. /Le Géographe Can. 2021, 66, 248–262. [Google Scholar] [CrossRef]
- Luo, W.; Qi, Y. An enhanced two-step floating catchment area (E2SFCA) method for measuring spatial accessibility to primary care physicians. Health Place 2009, 15, 1100–1107. [Google Scholar] [CrossRef] [PubMed]
- Li, H.; Liu, D.; He, J. Exploring Differentiated Conservation Priorities of Urban Green Space Based on Tradeoffs of Ecological Functions. Sustainability 2022, 14, 1845. [Google Scholar] [CrossRef]
- Lu, M.; An, K.; Hsu, S.-C.; Zhu, R. Considering user behavior in free-floating bike sharing system design: A data-informed spatial agent-based model. Sustain. Cities Soc. 2019, 49, 101567. [Google Scholar] [CrossRef]
- Shen, Y.; Zhang, X.; Zhao, J. Understanding the usage of dockless bike sharing in Singapore. Int. J. Sustain. Transp. 2018, 12, 686–700. [Google Scholar] [CrossRef]
- Beatley, T. Singapore: How to grow a high-rise city in a garden. SiteLINES A J. Place 2012, 8, 14–17. [Google Scholar]
- Tan, P.Y.; Wang, J.; Sia, A. Perspectives on five decades of the urban greening of Singapore. Cities 2013, 32, 24–32. [Google Scholar] [CrossRef]
- Lee, A.; Jordan, H.; Horsley, J. Value of urban green spaces in promoting healthy living and wellbeing: Prospects for planning. Risk Manag. Health Policy 2015, 8, 131–137. [Google Scholar] [CrossRef] [PubMed]
- Völker, S.; Kistemann, T. Developing the urban blue: Comparative health responses to blue and green urban open spaces in Germany. Health Place 2015, 35, 196–205. [Google Scholar] [CrossRef]
- Howard, C.; Burns, E.K. Cycling to work in Phoenix: Route choice, travel behavior, and commuter characteristics. Transp. Res. Rec. J. Transp. Res. Board 2001, 1773, 39–46. [Google Scholar] [CrossRef]
- Krizek, K.J.; El-Geneidy, A.; Thompson, K. A detailed analysis of how an urban trail system affects cyclists’ travel. Transportation 2007, 34, 611–624. [Google Scholar] [CrossRef]
- Kim, J.; Kwan, M.-P. How neighborhood effect averaging might affect assessment of individual exposures to air pollution: A study of ozone exposures in Los Angeles. Ann. Am. Assoc. 2021, 111, 121–140. [Google Scholar] [CrossRef]


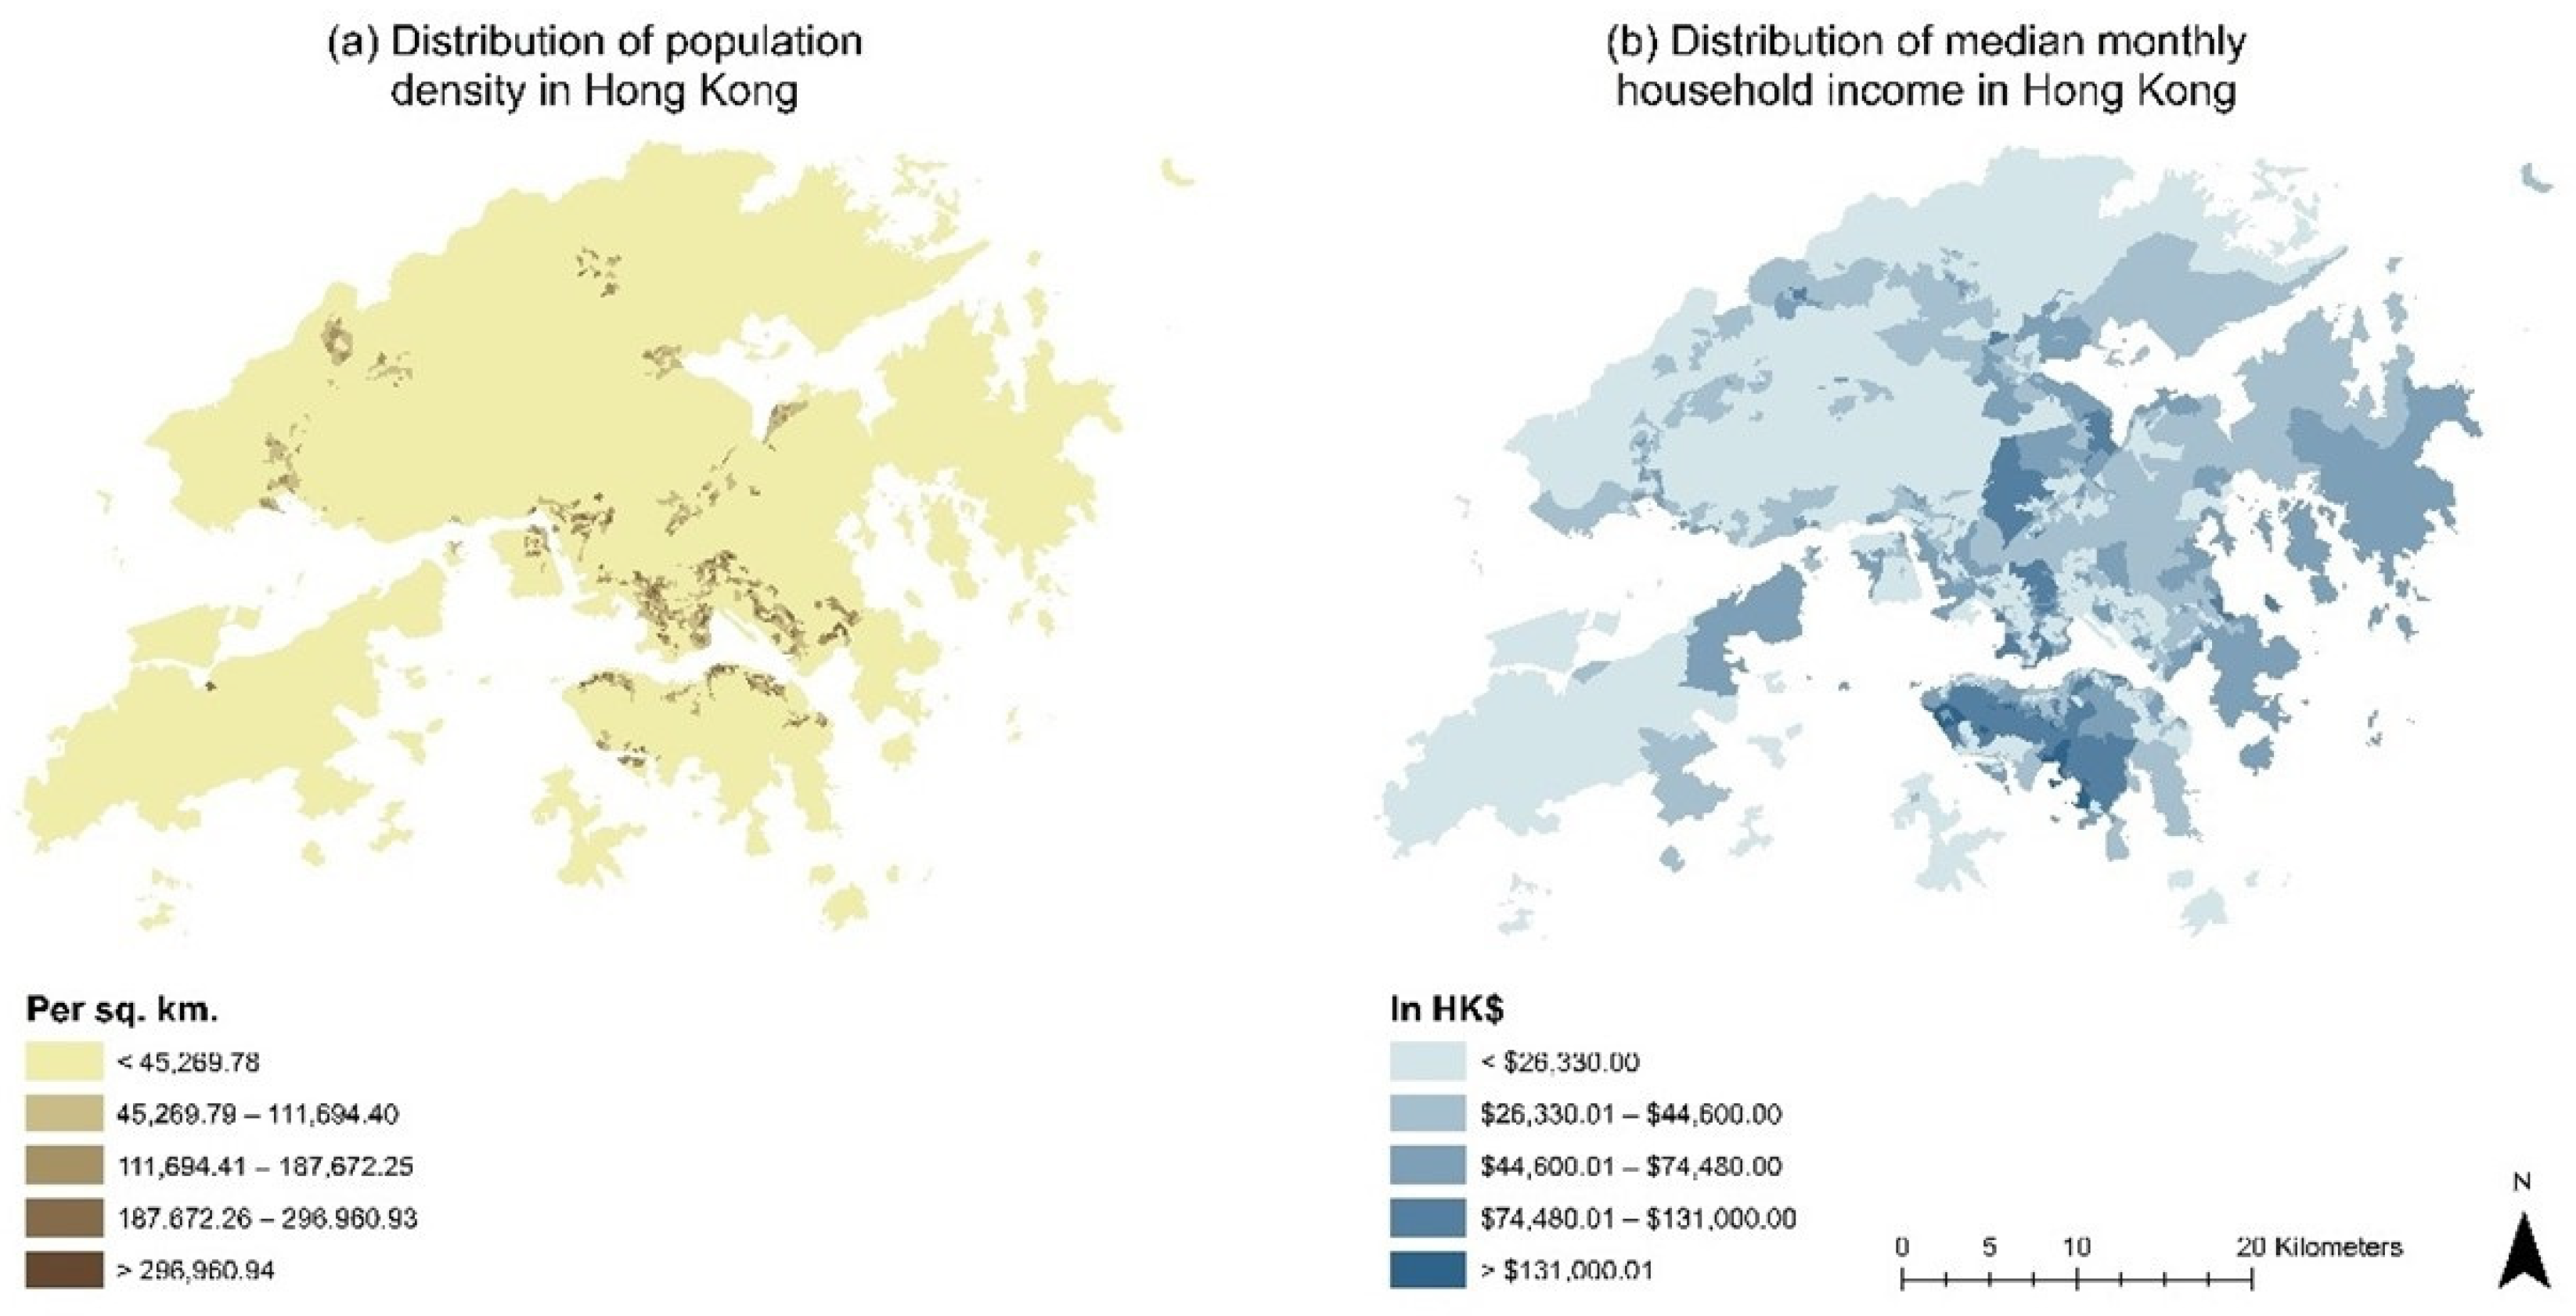
| Regions | Districts | Population Density (per km2) | Median Monthly Household Income |
|---|---|---|---|
| New Territories | North | 2310 | $21,500 |
| Tai Po | 2233 | $26,200 | |
| Sha Tin | 9602 | $26,800 | |
| Sai Kung | 3563 | $31,500 | |
| Tsuen Wan | 5149 | $29,200 | |
| Kwai Tsing | 22,307 | $21,200 | |
| Yuen Long | 4435 | $22,800 | |
| Tuen Mun | 5894 | $22,500 | |
| Islands | 886 | $28,900 | |
| Kowloon | Wong Tai Sin | 45,711 | $22,000 |
| Kowloon City | 41,802 | $26,900 | |
| Kwun Tong | 57,530 | $20,800 | |
| Sham Shui Po | 43,381 | $20,600 | |
| Yau Tsim Mong | 49,046 | $25,800 | |
| Hong Kong Island | Central and Western | 19,391 | $39,500 |
| Wan Chai | 17,137 | $40,000 | |
| Eastern | 30,861 | $31,300 | |
| Southern | 7080 | $30,700 | |
| Overall | 6777 | $25,200 | |
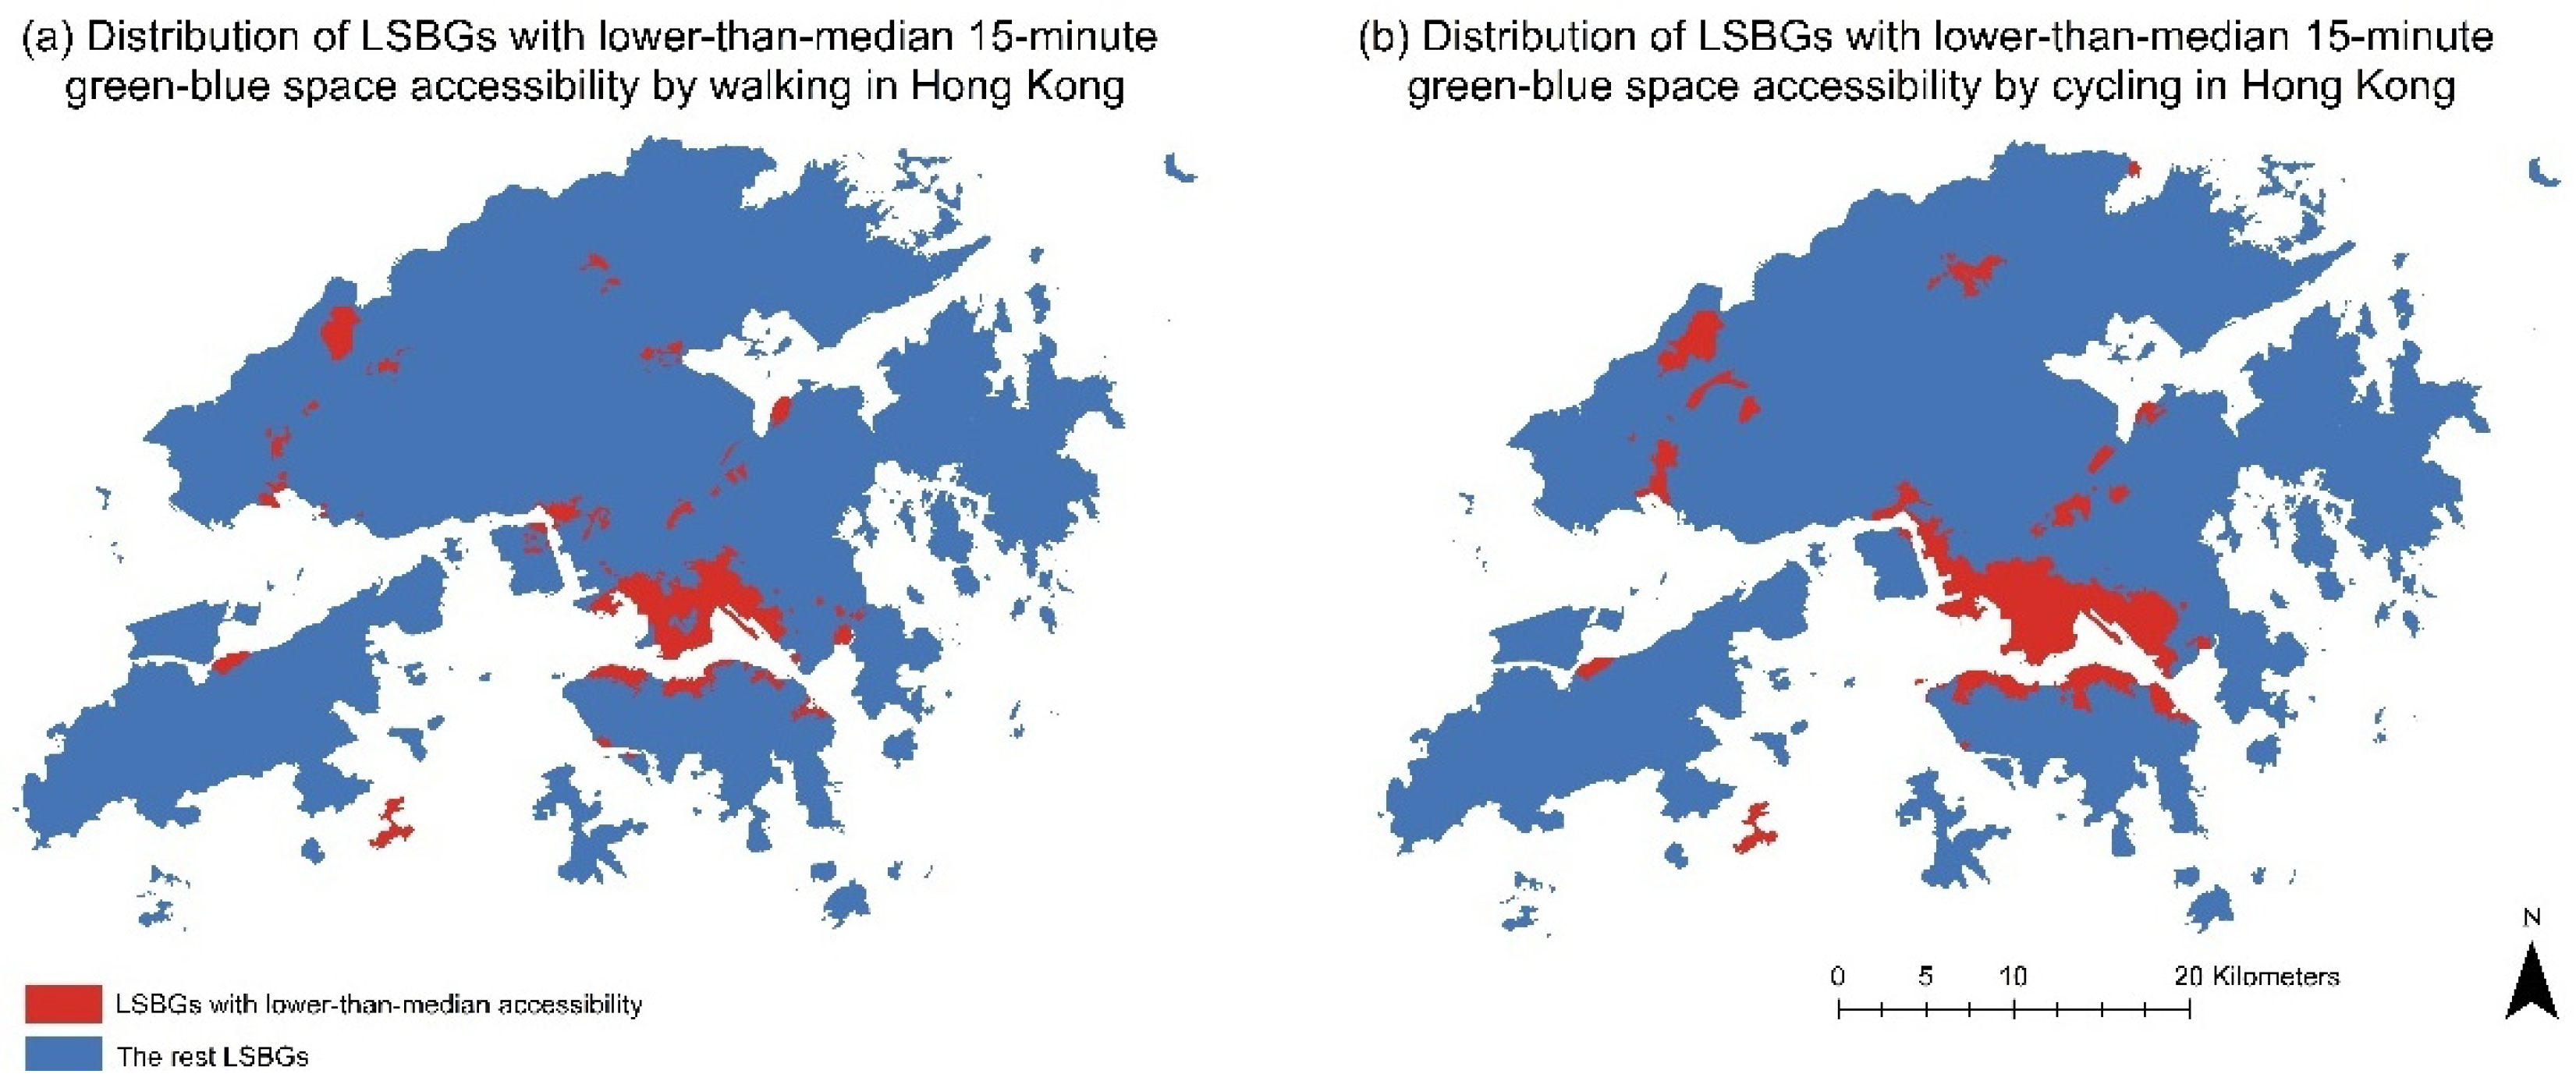
| District Name | % of LSBGs with Lower-Than-Median Accessibility by Walking |
|---|---|
| Yau Tsim Mong | 97.78% |
| Kowloon City | 91.79% |
| Sham Shui Po | 72.50% |
| Wong Tai Sin | 70.59% |
| Central & Western | 61.76% |
| Wan Chai | 56.41% |
| Kwun Tong | 55.00% |
| Eastern | 52.29% |
| Kwai Tsing | 45.76% |
| Tsuen Wan | 41.07% |
| Sha Tin | 30.48% |
| Yuen Long | 28.99% |
| Islands | 27.59% |
| Tuen Mun | 23.46% |
| Tai Po | 18.99% |
| Sai Kung | 14.49% |
| Southern | 12.28% |
| North | 11.39% |
| District Name | % of LSBGs with Lower-Than-Median Accessibility by Cycling |
|---|---|
| Yau Tsim Mong | 100.00% |
| Sham Shui Po | 100.00% |
| Kowloon City | 97.01% |
| Kwun Tong | 93.75% |
| Eastern | 67.97% |
| Central & Western | 56.86% |
| Sha Tin | 40.00% |
| North | 27.85% |
| Islands | 27.59% |
| Tuen Mun | 27.16% |
| Yuen Long | 24.64% |
| Kwai Tsing | 23.73% |
| Tsuen Wan | 23.21% |
| Wong Tai Sin | 19.12% |
| Wan Chai | 17.95% |
| Sai Kung | 8.70% |
| Southern | 1.75% |
| Tai Po | 0.00% |
Publisher’s Note: MDPI stays neutral with regard to jurisdictional claims in published maps and institutional affiliations. |
© 2022 by the authors. Licensee MDPI, Basel, Switzerland. This article is an open access article distributed under the terms and conditions of the Creative Commons Attribution (CC BY) license (https://creativecommons.org/licenses/by/4.0/).
Share and Cite
Liu, D.; Kwan, M.-P.; Kan, Z.; Wang, J. Toward a Healthy Urban Living Environment: Assessing 15-Minute Green-Blue Space Accessibility. Sustainability 2022, 14, 16914. https://doi.org/10.3390/su142416914
Liu D, Kwan M-P, Kan Z, Wang J. Toward a Healthy Urban Living Environment: Assessing 15-Minute Green-Blue Space Accessibility. Sustainability. 2022; 14(24):16914. https://doi.org/10.3390/su142416914
Chicago/Turabian StyleLiu, Dong, Mei-Po Kwan, Zihan Kan, and Jianying Wang. 2022. "Toward a Healthy Urban Living Environment: Assessing 15-Minute Green-Blue Space Accessibility" Sustainability 14, no. 24: 16914. https://doi.org/10.3390/su142416914