Article

Uncovering Inequalities in Food Accessibility between Koreans and Japanese in 1930s Colonial Seoul Using GIS and Open-Source Transport Analytics Tools

1
Department of Geography and Environment, Western University, London, ON N6A 5C2, Canada
2
Department of Geography, Virginia Tech, Blacksburg, VA 24060, USA
3
Department of Urban Engineering, The University of Tokyo, Tokyo 113-8656, Japan
*
Author to whom correspondence should be addressed.
Sustainability 2022, 14(19), 11852; https://doi.org/10.3390/su141911852
Submission received: 2 August 2022 / Revised: 3 September 2022 / Accepted: 13 September 2022 / Published: 20 September 2022

Abstract

:
This study aimed to investigate the disparities and inequalities in food accessibility in colonial Seoul (Keijo [京城] in Japanese, and Gyeongseong [경성] in Korean) in the 1930s, using a geographic information system (GIS) and open-source transport analytics tools. We specifically focused on the unique social standing of people in the colonial era, namely colonial rulers (Japanese) vs. subjects (Koreans) and examined whether neighborhoods with larger proportions of colonial rulers had more access to food opportunities. For a comprehensive evaluation, we computed food accessibility by multiple transport modes (e.g., public transit and walking), as well as by different time budgets (e.g., 15 min and 30 min) and considered various sets of food options—including rice, meat, seafood, general groceries, vegetables, and fruits—when measuring and comparing accessibility across neighborhoods in colonial Seoul. We took a novel digital humanities approach by synthesizing historical materials and modern, open-source transport analysis tools to compute cumulative opportunity-based accessibility measures in 1930s colonial Seoul. The results revealed that Japanese-dominant neighborhoods had higher accessibility by both public transit and walking than Korean-dominant neighborhoods. The results further suggest that inequality and disparity in food accessibility is observed not only in contemporary society but also in the 1930s, indicating a historically rooted issue.

1. Introduction

In recent decades, the adverse impacts of substandard accessibility to healthy and fresh food on health outcomes has become one of the most important research topics in the fields of public health and health geography. Its importance cannot be overstated, as noted by many scholars across numerous academic fields [1,2,3,4,5]. Specifically, nutrition and public health scientists have given intensive attention to finding the relationships between limited access to healthy food outlets and individuals’ health outcomes, such as obesity, diabetes, and chronic diseases [6,7,8,9,10,11,12]. This growing interest in the health-shaping role of food access has led to the development of the term “food deserts”: geographic areas with low levels of spatial accessibility to retail outlets offering healthy, fresh, and affordable food options [13,14,15].
Food scholars have been particularly focusing on the food accessibility levels of disadvantaged population groups (e.g., racial minorities and low-income people) and their poor health outcomes, with a social equity lens [16,17,18]. Geographic information system (GIS) and spatial analysis tools facilitate the identification of geographic areas suffering from inadequate access to healthy food; measure disparities, inequality, and inequity in food access; and, consequently, support better decision making for policymakers and planners to maximize community sustainability, self-reliance, and justice [19,20,21,22,23,24,25].
The rich literature on food accessibility has revealed significant disparities and inequalities in food access in the contemporary era. However, what is missing from the literature is an investigation of the food accessibility landscape in the aspects of two ranges: (1) geographic ranges, and (2) time ranges. First, most prior research studies have selected locations in North America as case studies [4,10,12,21,25,26,27,28]. In European contexts, some studies have paid attention to the problem of limited spatial access to food [29,30,31]. Although food accessibility can play a role in describing a societal problem that stems from inequitable spatial distributions of food outlets in Asian cities, there is a significant research gap regarding food accessibility in Asian cities. Second, little research garnering historical data to elaborate in-depth narratives of food accessibility has been conducted. Food accessibility can be a useful lens through which to infer and understand the health status of people in the past. In fact, poor access to food in the early 20th century is considered a direct primary cause of serious diseases and mortality, due to the lack of proper hygienic conditions and medical treatments [32,33,34]. However, there have been few efforts to quantify food accessibility and to see how food accessibility was heterogeneous among population groups with different social statuses in cities in an early modern era.
Therefore, to fill this significant research gap, we aimed to investigate the inequalities and disparities in food accessibility among neighborhoods with different population compositions in 1930s colonial Seoul (Keijo [京城] in Japanese, and Gyeongseong [경성] in Korean), using GIS and spatial analysis techniques. We specifically focused on the unique social standing of people in the colonial era, namely colonial rulers (Japanese) vs. subjects (Koreans) and examined whether neighborhoods with larger proportions of colonial rulers had higher access to food opportunities. For a comprehensive evaluation, we computed food accessibility by multiple transport modes (e.g., public transit and walking), as well as by different time budgets (e.g., 15 min and 30 min) and considered various sets of food options—including rice, meat, seafood, general groceries, vegetables, and fruits—when measuring and comparing accessibility across neighborhoods in colonial Seoul. We took a novel digital humanities approach [35] by synthesizing historical materials (e.g., census and urban planning/transit maps) and modern quantitative/open-source analysis tools (e.g., r5r public transit analysis kit [36]) to compute the cumulative opportunity-based accessibility measures in 1930s colonial Seoul.
The organization of this paper is as follows. The next section provides historical background on colonial Seoul and the daily discrimination toward Koreans during the Japanese colonial period (1910–1945), between the ruling class and the ruled class. Next, we present a brief description of the study area, an explanation of the data and method, and then a description of the results. The final section presents the conclusions from the results and the implications of the findings, alongside limitations.

2. Background: Historical Context of the Korean Peninsula during the Japanese Colonial Period (1910–1945)

Korea (Figure 1) was annexed by the Empire of Japan in the early 20th century, changing the Korean Peninsula, which was ruled by the Joseon dynasty—a sovereign state with hierarchical classes—into a colony under the Japanese imperialist regime between 1910 and 1945 [37].
There were three prominent changes made by the Empire of Japan. First, the Japanese abolished the social class system that was rooted in Confucianism, which stratified people by lineage [38,39]. This change resulted in Yangban, the hereditary ruling class of civil and military officials in the Joseon dynasty, being completely replaced by Japanese and Japanophile Koreans who did not previously have the same social status as Yangban [40]. The abolition of the social class system in Korea consequently brought forth a new societal structure that dominated Koreans and was ruled by Japanese opportunity. Second, the colonial era drove the GDP of Korea to rise. The empire government built new large-scale manufacturing industries by establishing electric and hydroelectric power to increase their productivity as a means of colonial exploitation [41]. Third, the construction of new communication infrastructure was considered the main change under colonial rule. For instance, the Japanese empire government constructed transport infrastructure (e.g., roads, ports, and railroads) to improve communication among regions [42]. Additionally, modernized urban planning in the Korean Peninsula had been started and was followed by communication infrastructure by the colonial empire [43].
Some scholars asserted that the prominent changes that modernized colonial Korean society resulted in significant economic benefits and improved living standards for Koreans [44]. This perspective, however, solely weighs the bright sides without noting the downsides of the colonized Korean society, in three aspects.
We found three major types of daily discrimination toward Koreans during the colonial era in previous studies. First of all, in accordance with [41,45], there were remarkable economic gaps between the Japanese and Koreans due to government policy that allowed the Japanese to dominate the market. This fact was identified based on the fact that Japanese in Korea made up only 25% of the total population but possessed 64% of the total land [45]. On the other hand, Koreans comprised 74% of the total population but only had 33% of the land [41].
Second, the disparity in the access to the infrastructure of colonial Seoul has been considered a significant obstacle to Koreans. For instance, in colonial Seoul (see Figure 1), Japanese enclaves could easily access essential infrastructure, such as water, sewers, electricity, public transportation, and housing, unlike the neighborhoods dominated by Koreans [37,40,46,47].
Third, during the colonial period, Koreans suffered from a lack of sufficient nutrient consumption, although rice production increased after the Japanese colonial government took over. Kimura [41] found that the calorie intake of Koreans from staple foods during the colonial period gradually declined and then, in the 1940s, finally became worse than the average consumption during the late Joseon dynasty. The research pointed out the expansion of exports of rice to Japan.

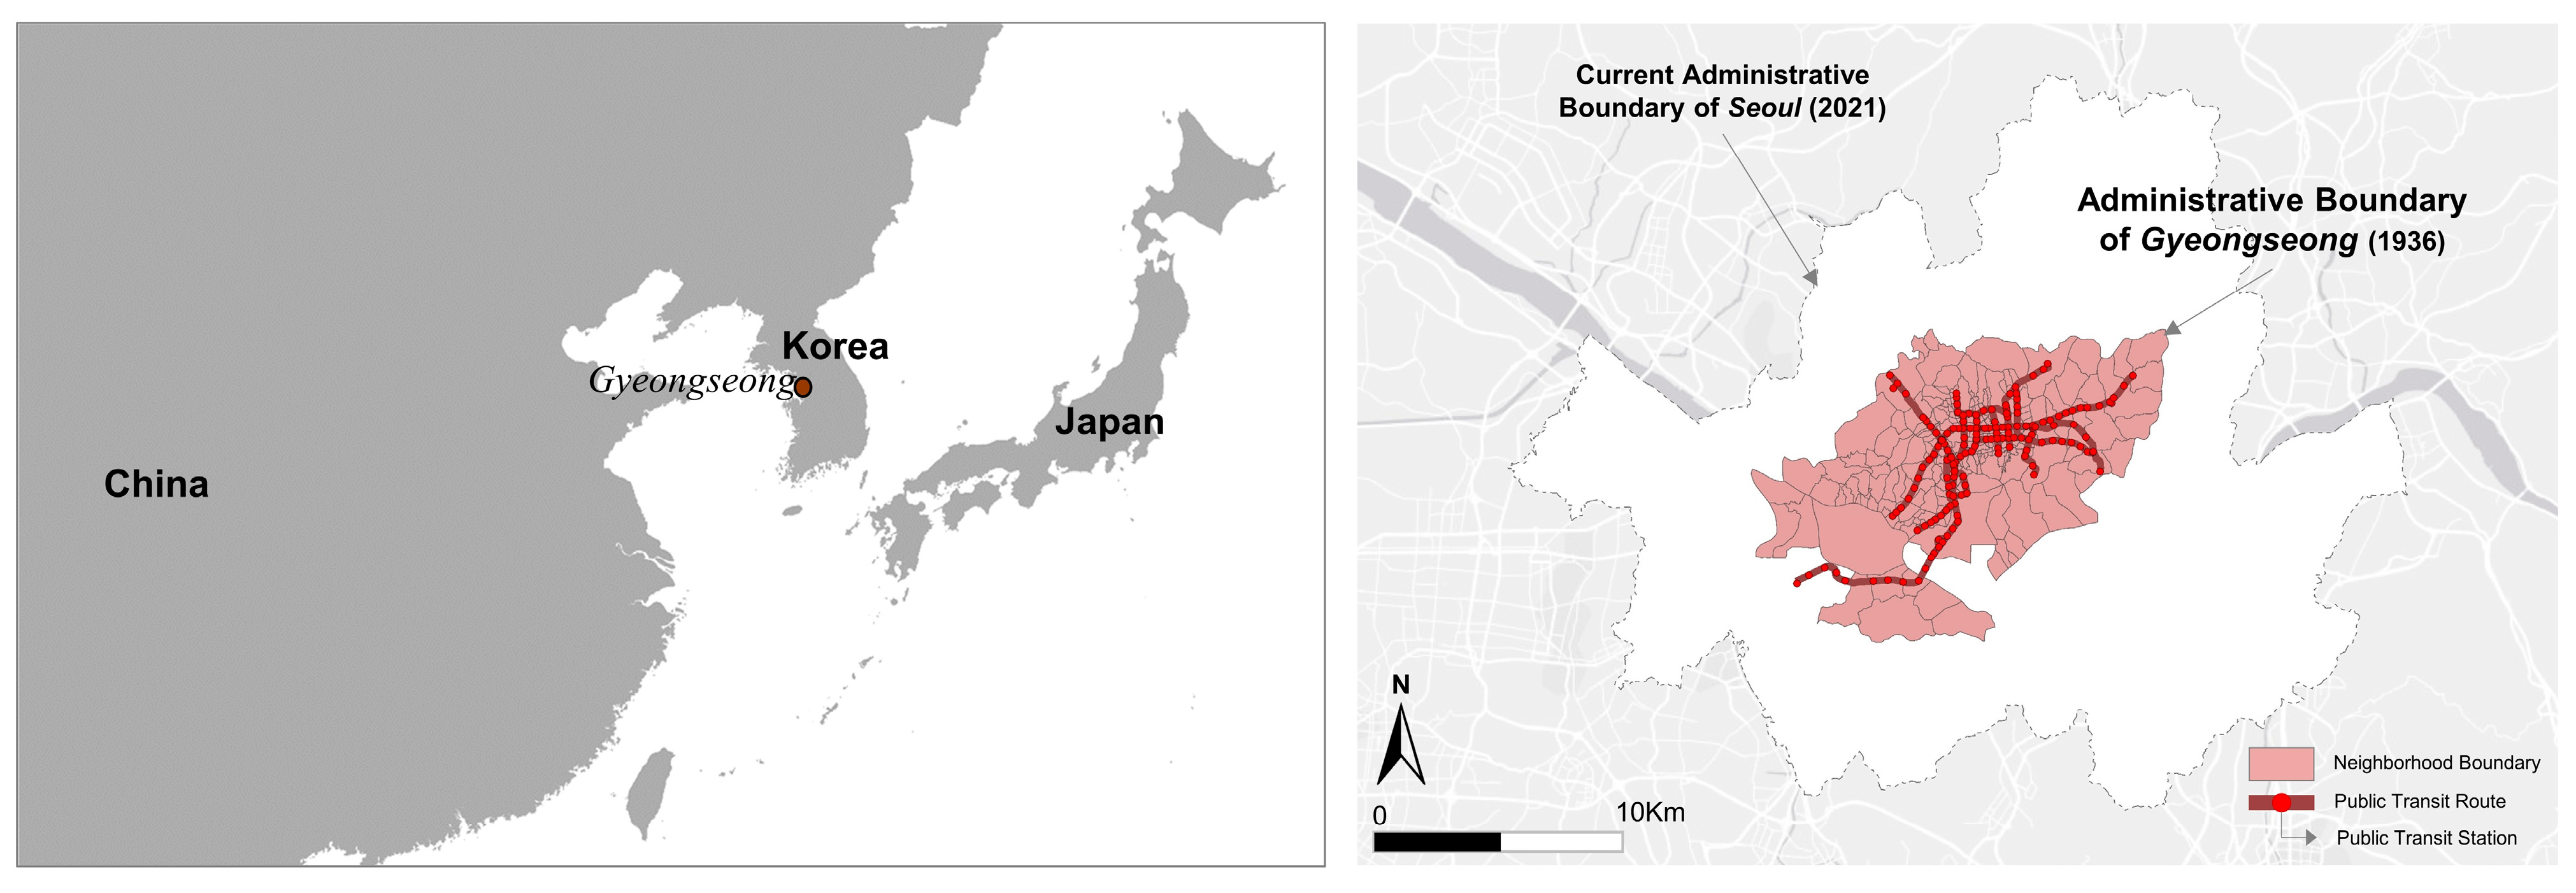
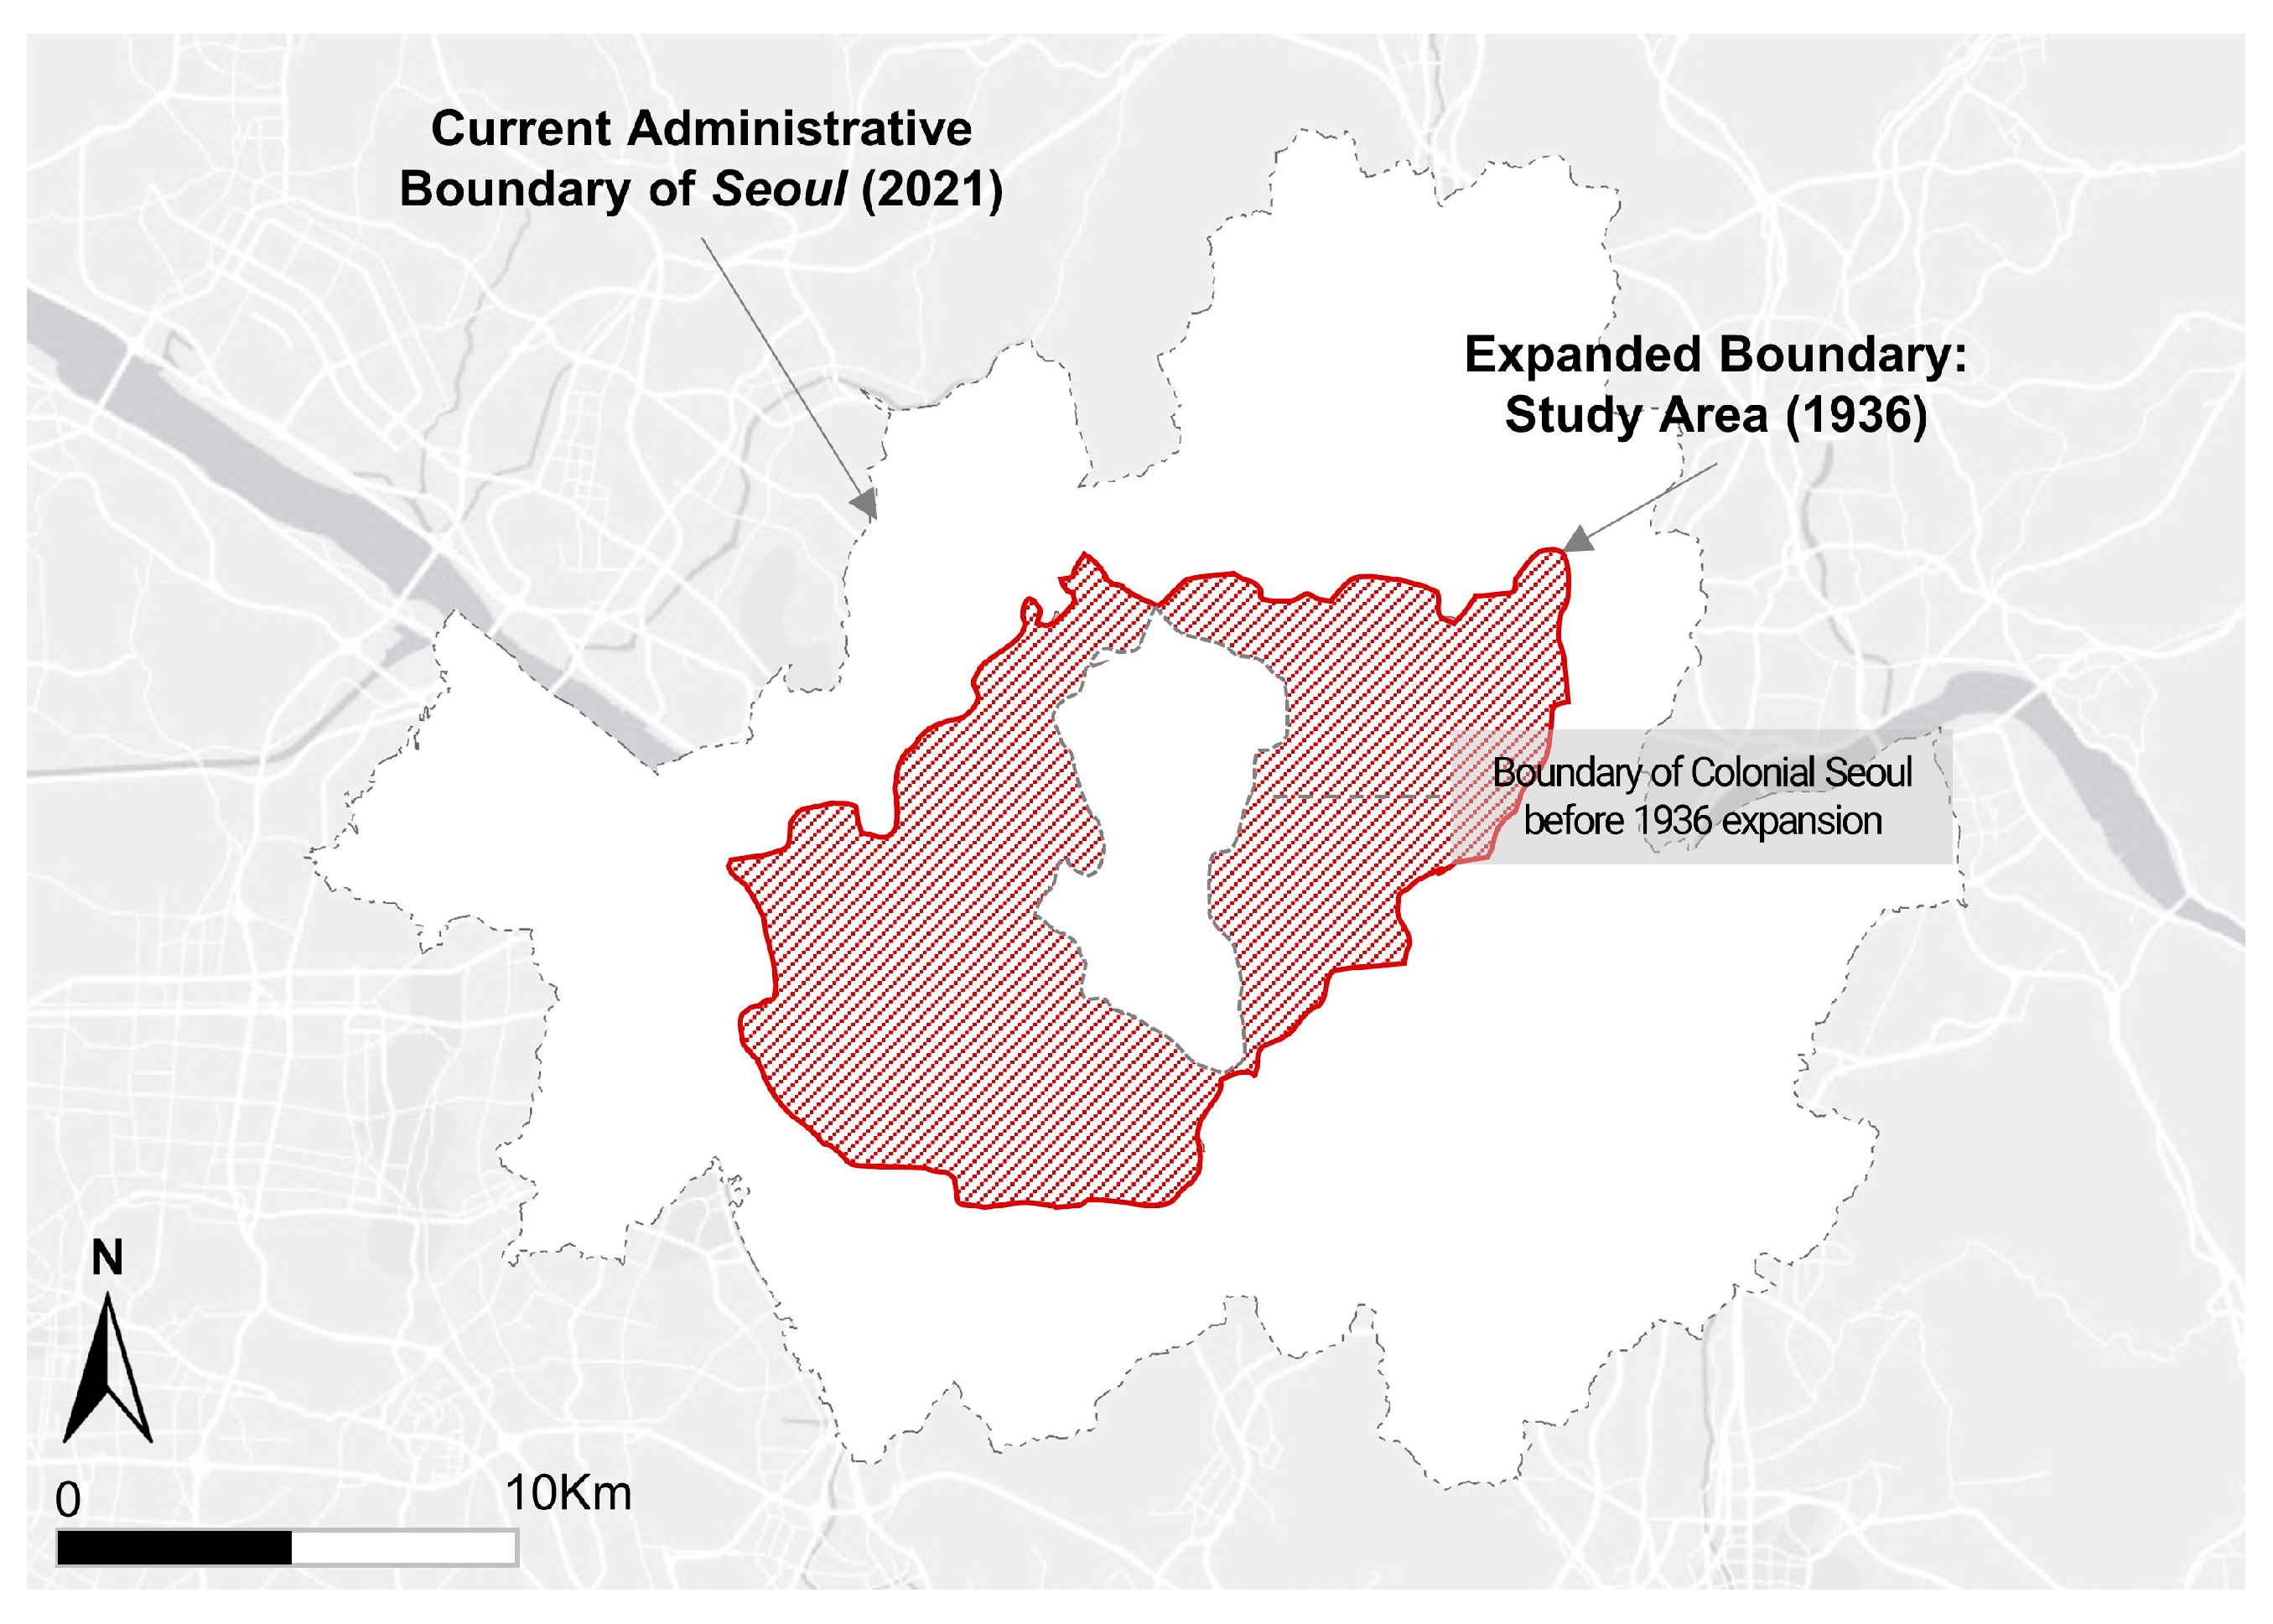
3. Study Area: 1930s Colonial Seoul

Seoul (Figure 1) has been the capital of Korea from the 14th century, through the Japanese colonial era (1910–1945), and up to now (1945–present, Republic of Korea). Colonial Seoul was one of the metropolitan cities under the Japanese imperialist regime during the period of new imperialism (i.e., the late 19th and early 20th centuries) [41]. In the 1940s, colonial Seoul became the seventh largest of the cities in the Japanese empire, with a population of 935,000. Colonial Seoul was socially and economically divided into the following two classes: (1) the ruling class, who were mostly Japanese and a very few wealthy Koreans who were working with the Japanese, and (2) the ruled class, who were laborers exploited by the ruling class—mostly middle-income and lower-income Koreans [40,46]. The ruled class in colonial Seoul suffered from systematic and non-systematic discrimination in various aspects of their lives, such as educational opportunities, job opportunities, and land ownership [41,44]. Given the daily discrimination toward the ruled class—Koreans—which reduced their opportunities in order to keep them in the state of being exploited by the ruling class (Japanese), we raised the question of whether a disparity in access to food opportunities existed among neighborhoods based on their characteristics, i.e., whether the space was dominated by the ruling or the ruled class in colonial Seoul.

4. Data

This section provides the overall descriptions of the datasets we utilized in this study. We digitized a total of 11 historical materials. The map of Greater Keijo, the Keijo Urban Planning Map, and the Keijo municipal government’s monthly report were used to digitize the administrative boundary and census information, including the properties of populations and economic conditions. For the food retailer data, the Keijo business demography index was utilized to capture the spatial distribution of food retailers via the geocoding technique. As for the transportation data, we built a high-resolution transportation network and General Transit Feed Specification (GTFS) data by synthesizing seven historical materials (see Table 1 for details).

4.1. Historical Data on the Administrative Boundary and Census

Table 1 presents a list of the historical materials used in this study. Two types of administrative boundaries were used in this study. First, Dong (the smallest administrative boundary level, consisting of multiple parcels) boundaries were digitized and utilized as a neighborhood unit. Second, parcels were digitized, and their centroids were used as a proxy, representing (1) people’s residential locations, and (2) food business locations, based on their parcel addresses. Dongs and parcels were digitized based on the Map of Great Keijo (1936) and the Keijo Urban Planning Map (1938), respectively. The scanned archive maps were converted into ESRI shapefiles using ArcGIS 10.8.1. There were 254 neighborhoods (Dongs) and 41,646 parcels in colonial Seoul.
For census information, we used the Keijo Municipal Government Monthly Report (1936). The report provided us with detailed social, economic, and demographic information for each neighborhood, including the number of people by gender, ethnicity (e.g., Korean or Japanese), and employment status. Based on this information, we classified neighborhoods in colonial Seoul by (1) ethnicity, and (2) employment status. Prior studies proved that these ethnicity and employment status variables are effective in distinguishing neighborhood characteristics and revealing disparities in access to various urban opportunities and resources (e.g., jobs, education, and healthcare) [6,48,49,50,51,52].

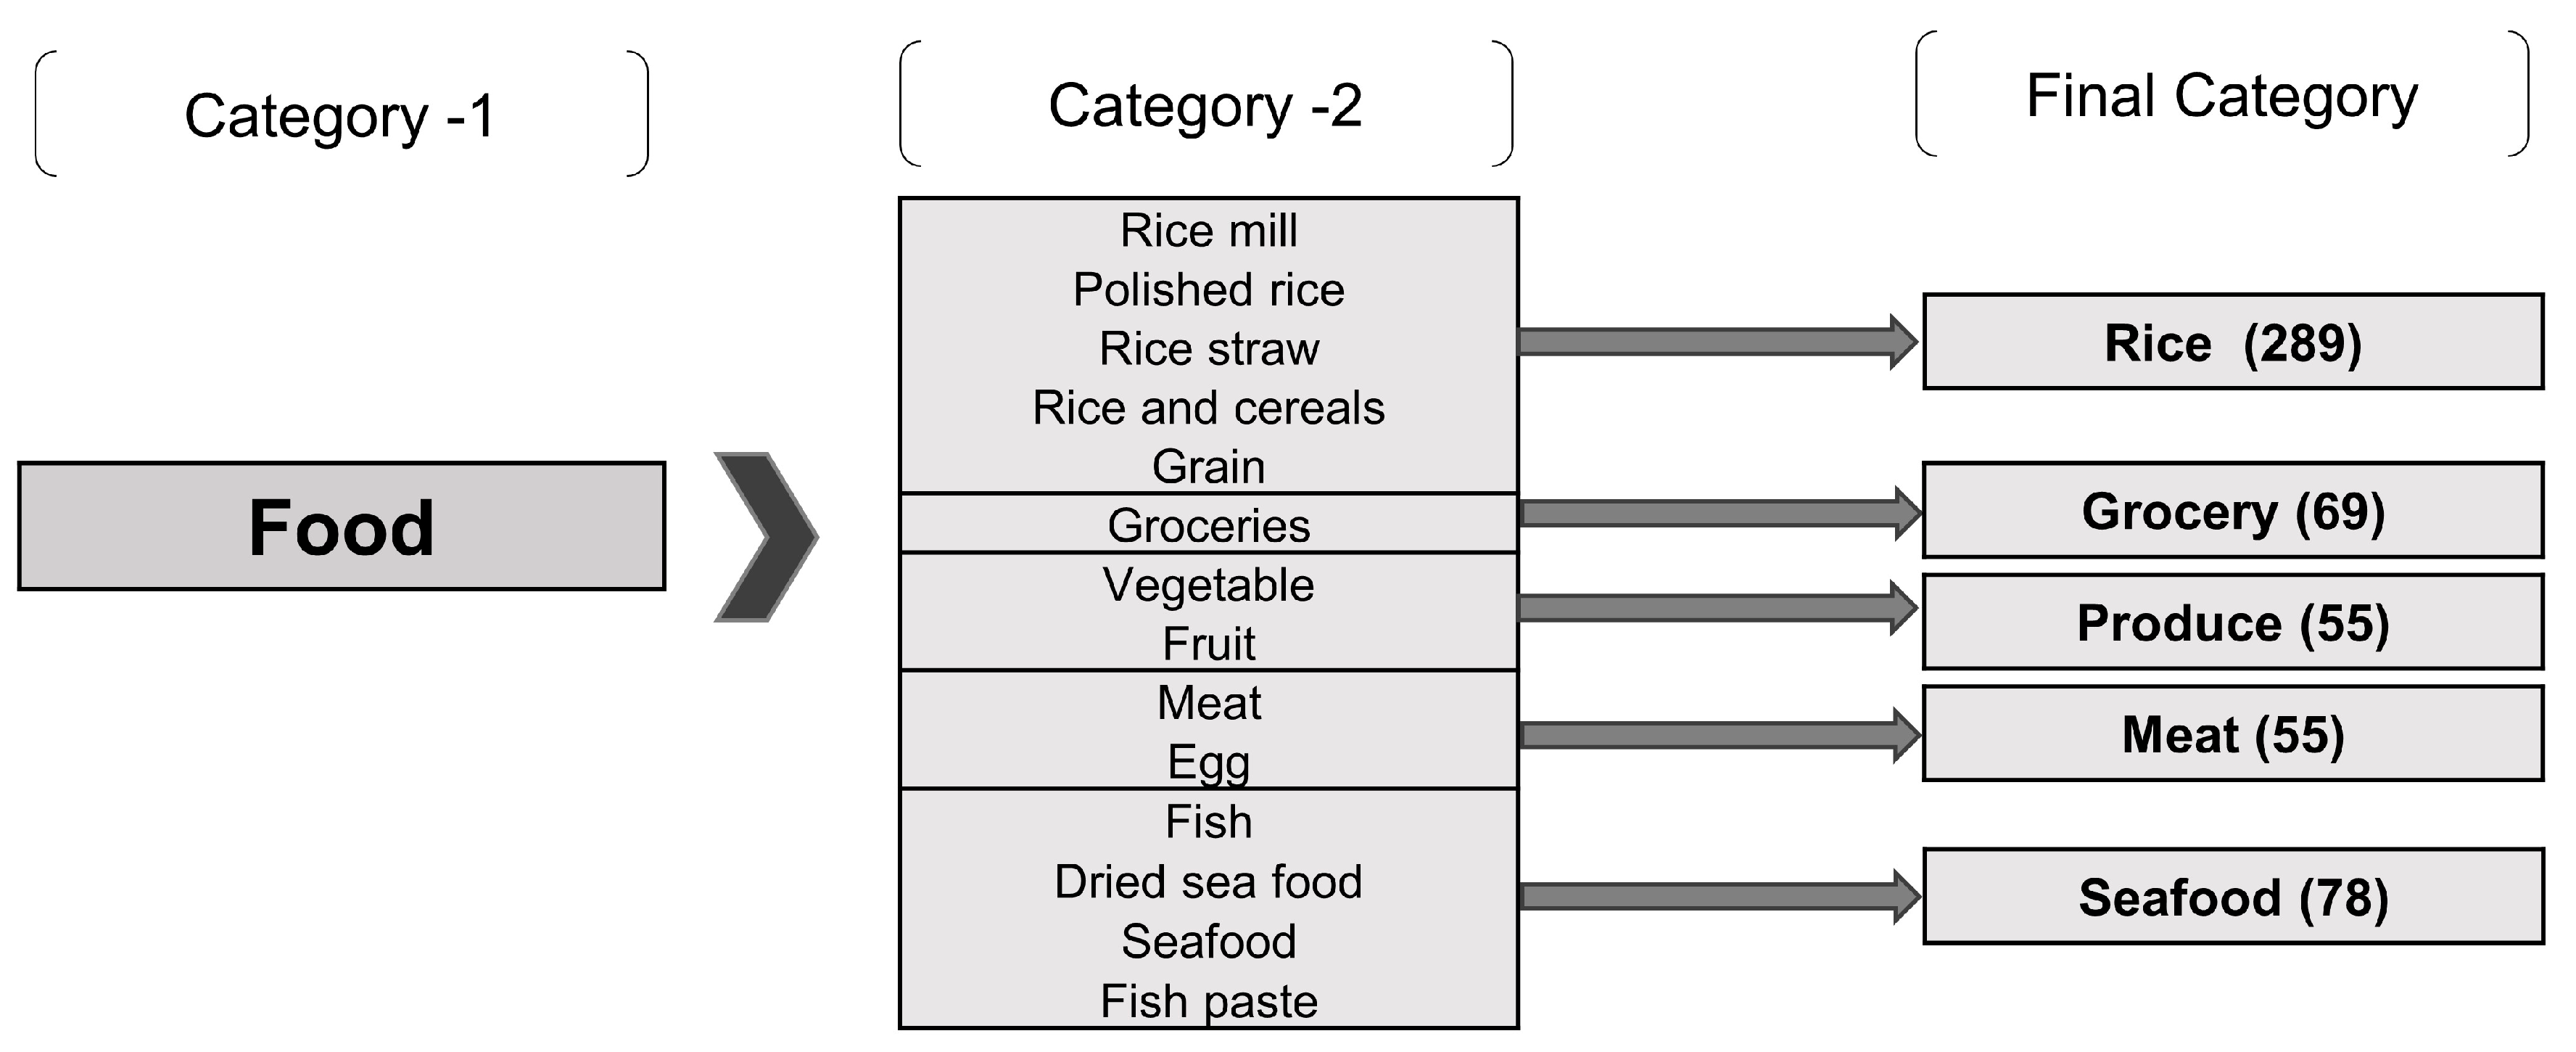
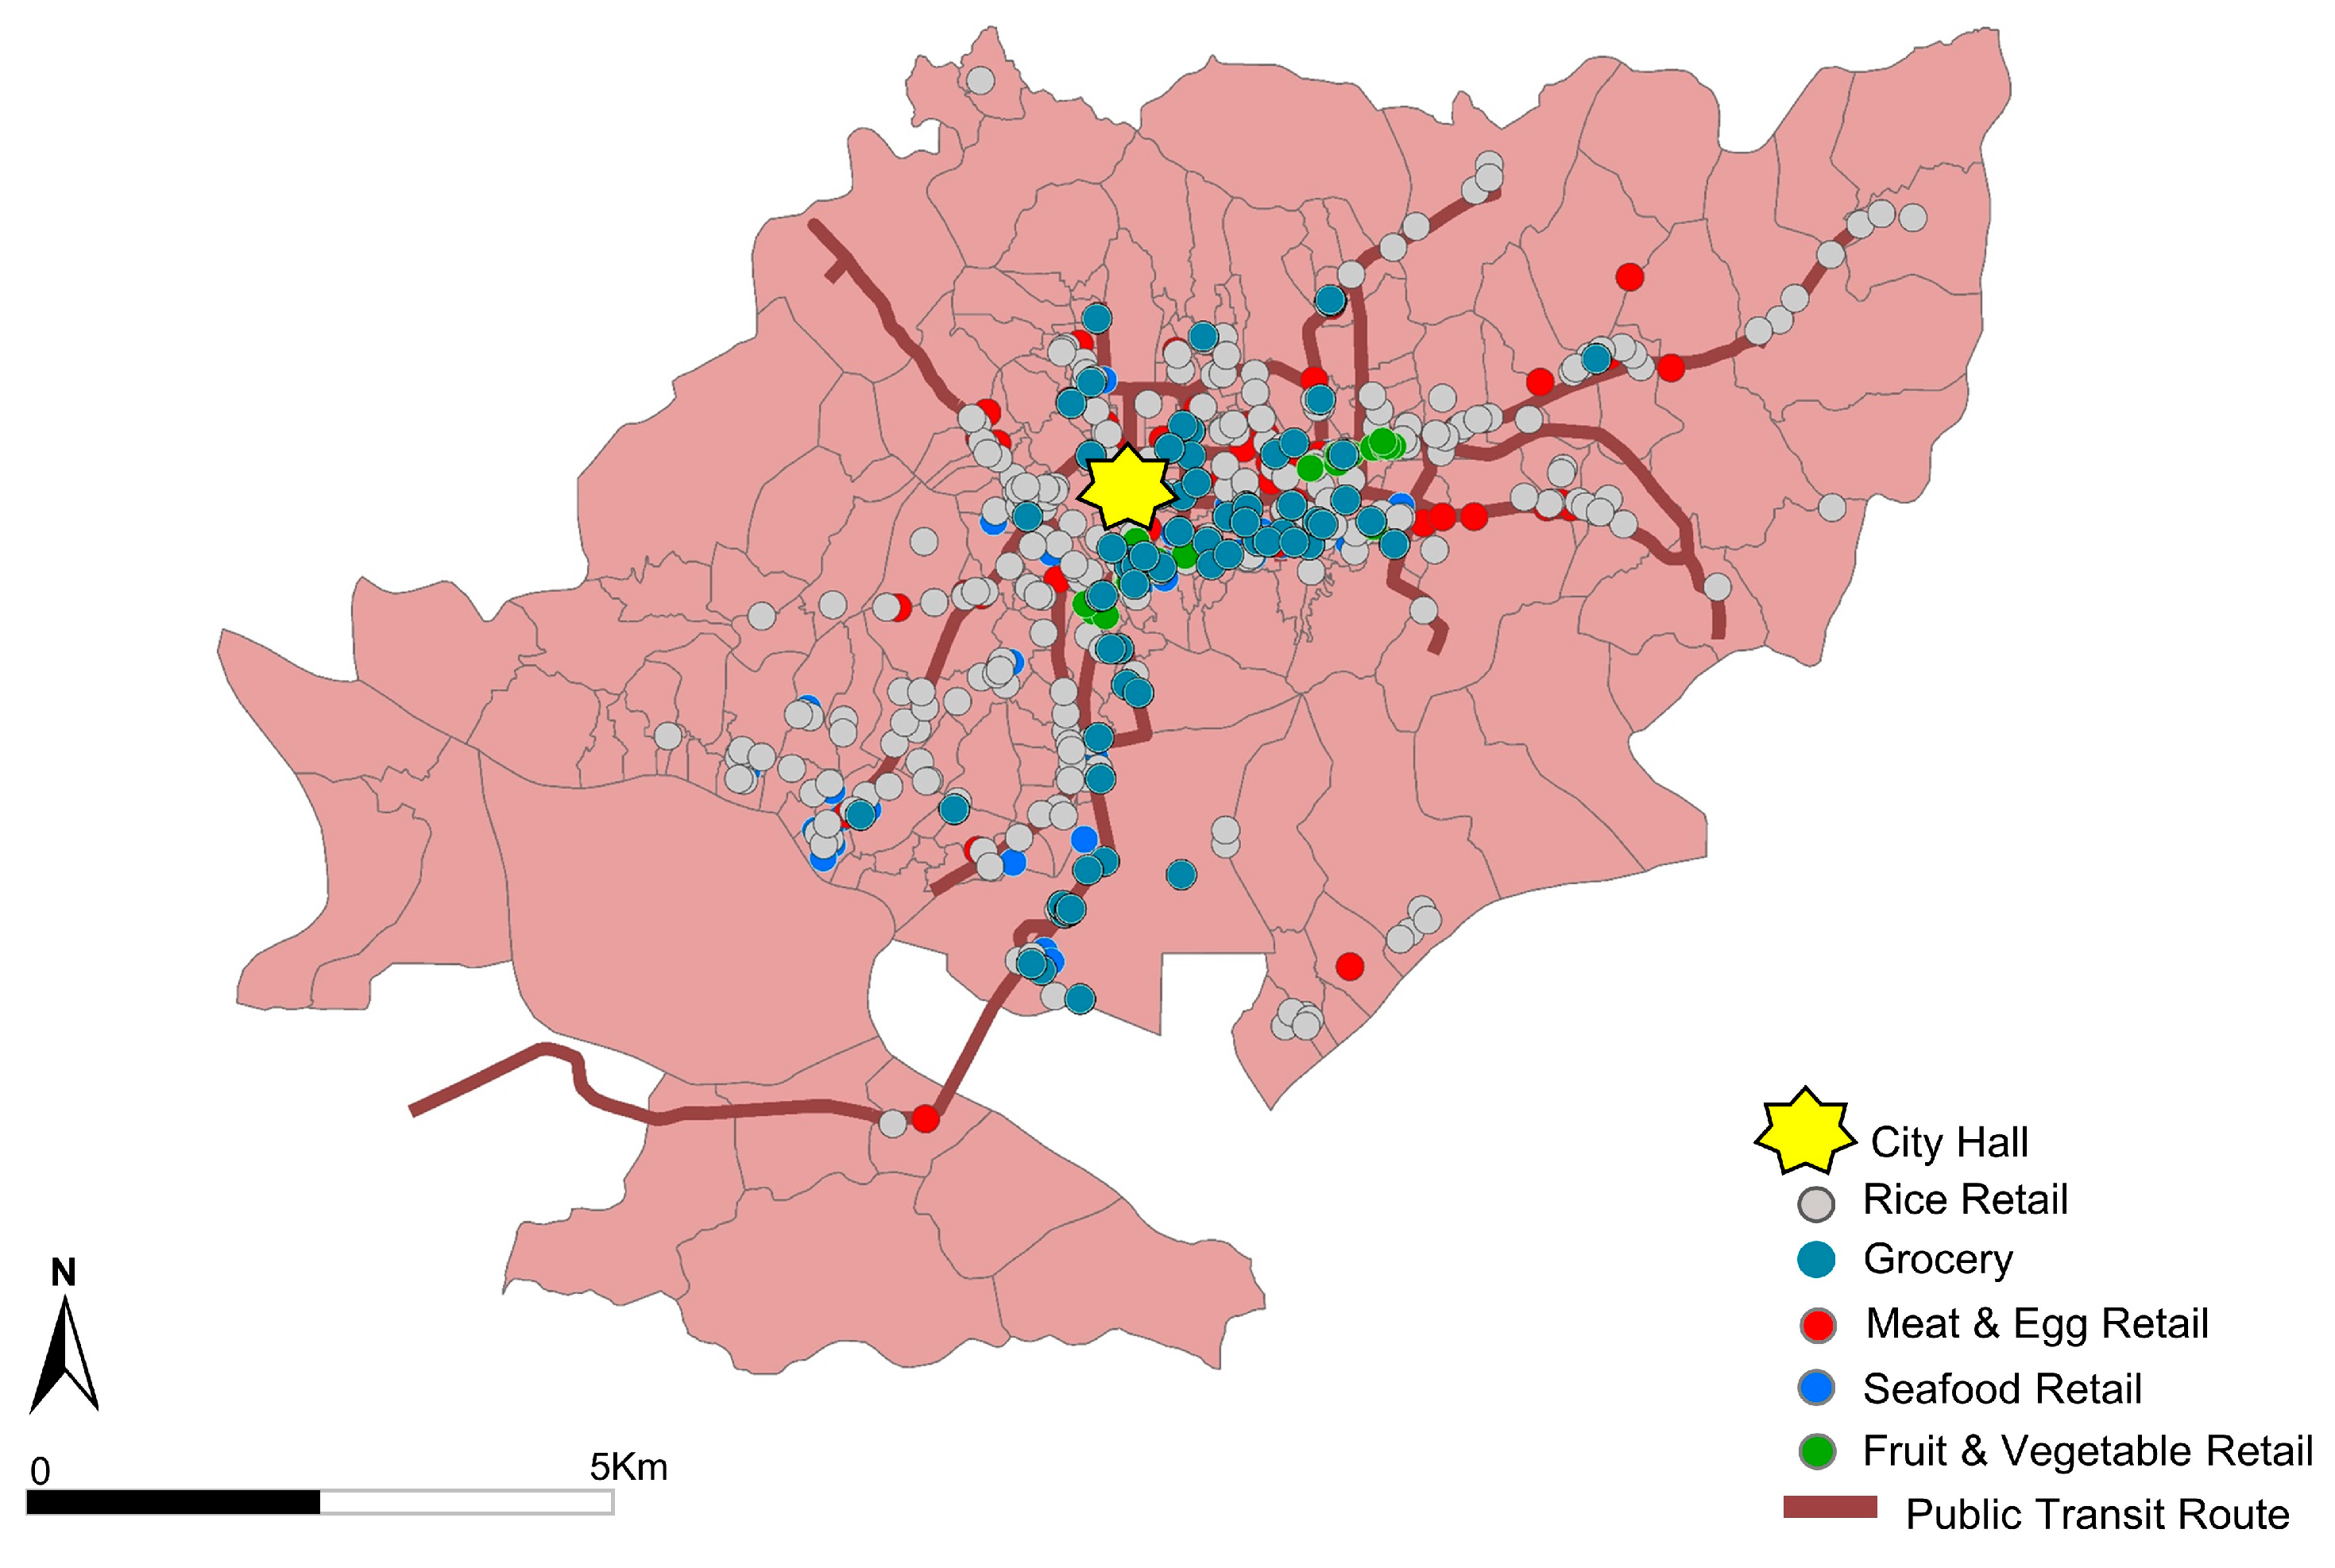
4.2. Historical Data on Food Retailers

We considered five types of food retailers from the Keijo Business Demography Index, distributed by the Keijo Chamber of Commerce and Industry, with the parcel-level address of each food retailer located in colonial Seoul. The document provided detailed information on 3598 companies, including the company name, address, owner, business category, and annual tax. We extracted retail outlets categorized as “food” among a total of 22 business sectors, which embraced 34 of the sub-sectors in its sector (see Figure 2). Among those 34 sub-sectors, we further extracted 14 sub-sectors associated with the staple foods of both Koreans and Japanese, the daily nutrition needs (e.g., carbohydrates, vitamins and minerals, animal protein, and seafood protein), and one sector labeled as “grocery”, serving multiple food items at one retailer. We excluded 20 other sub-sectors that could not be considered as staple foods and essential foods for nutrition balance. These 14 sub-sectors are essential for avoiding nutritional imbalance, which could negatively affect the health status of people in the early 20th century [53]. We grouped 14 sub-sectors based on their nutritional similarities, generating the following five distinctive food categories: (1) rice, (2) groceries, (3) produce, (4) meat, and (5) seafood, as shown in Figure 2. Unlike contemporary food outlets that sell a wide range of groceries in the same place, it is noteworthy that specialty stores, which specialized in a particular item, were common in colonial Seoul.
Five hundred and seventy-one food retailers that fall under the five categories above were identified. Based on the parcel names, from the parcel-level addresses provided by the Keijo Business Demography Index, we geocoded the food outlets to the centroids of their parcels. Given the fact that the parcel was the smallest areal unit available in colonial Seoul, we ensured that our geocoding process facilitated the high-resolution accessibility analysis.
Figure 3 describes the spatial distribution of food outlets. As shown in Figure 3, food stores were mostly concentrated around the city center to target the large demand around the city hall [46]. The relatively high number of rice retailers in the city is explained by the fact that rice was a staple food for both the colonial rulers (Japanese) and the subjects (Koreans).

4.3. Transportation Data

A transportation network is required to measure food accessibility. We integrated the public transit schedule information (e.g., operation hours and headway) from the NAVER news archive (https://newslibrary.naver.com), where users have accessed historical newspaper archive data since the 1920s. We also digitized the transit network, based on the Keijo Tram and Bus Route Map and, finally, we generated a General Transit Feed Specification (GTFS) dataset for colonial Seoul in the 1930s, for a high-resolution accessibility analysis [16,35,54,55,56,57,58]. The National Rural Transit Assistance Program (RTAP) GTFS builder was utilized to construct the GTFS dataset [35,54]. As a result, the schedule-based transit network was combined with a walking network and was used as a basis for measuring the travel times between two points and, thus, calculating food outlet accessibility.

5. Methods

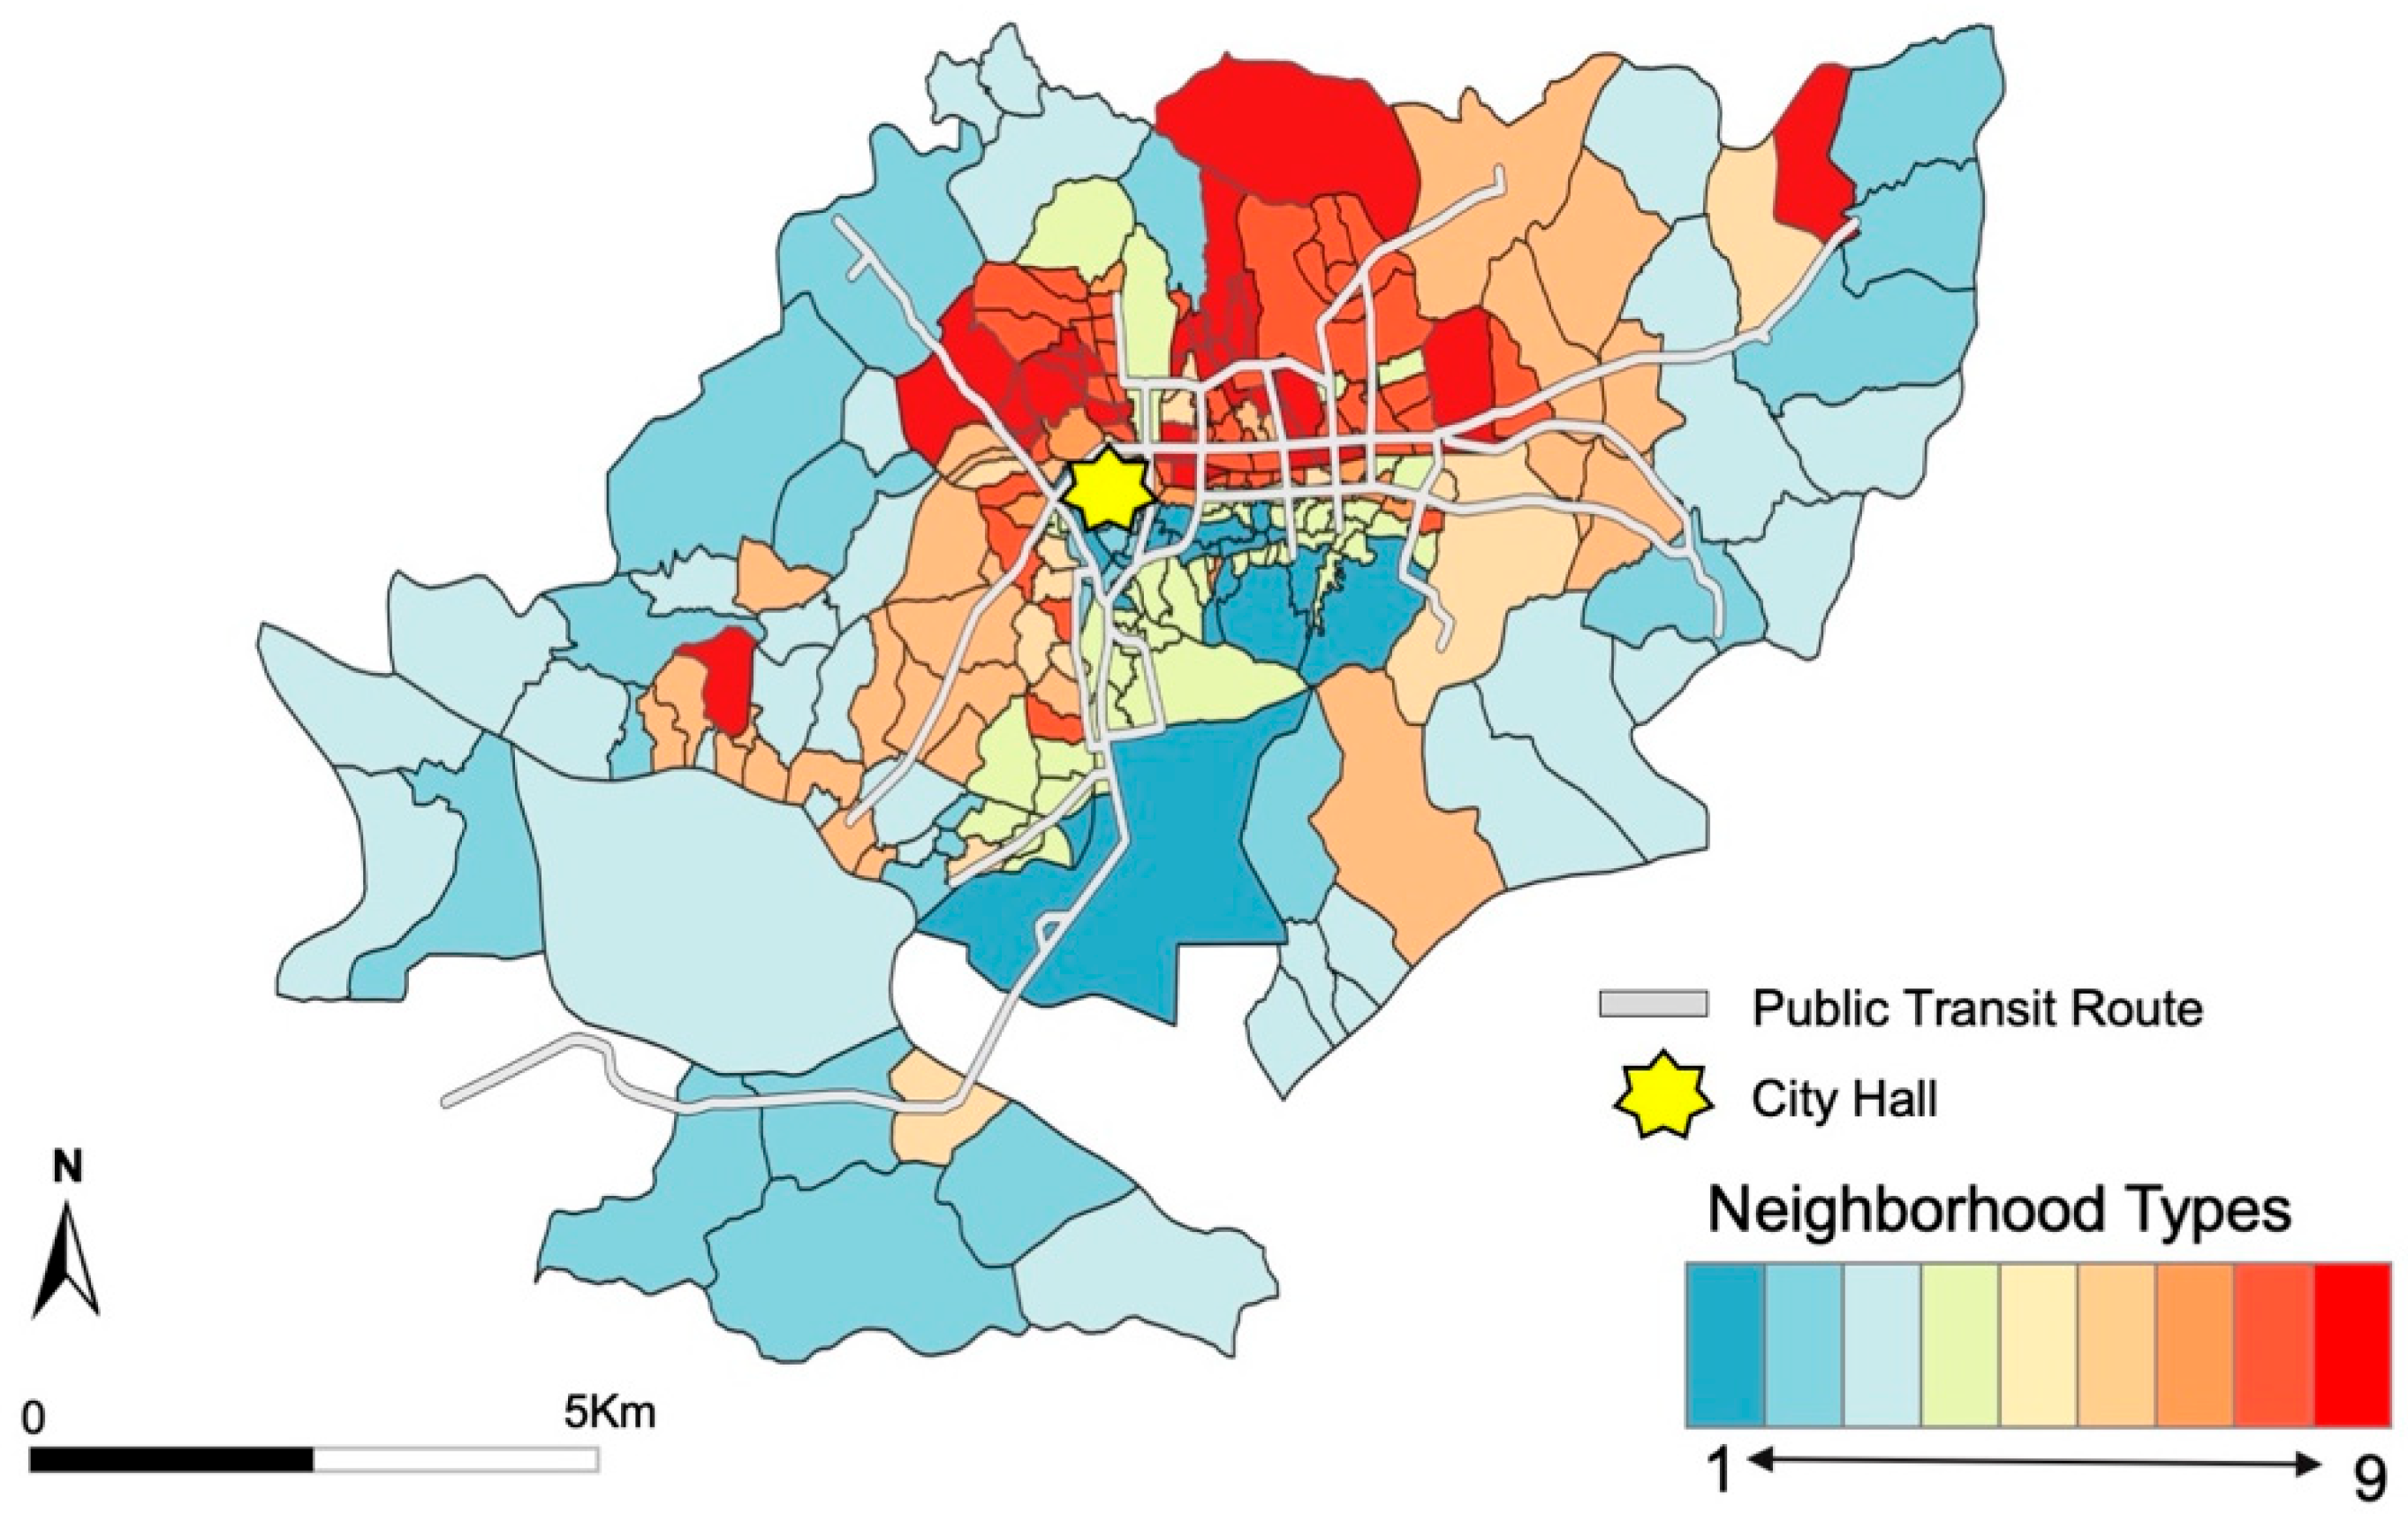
5.1. Classification of Neighborhoods in Colonial Seoul by Ethnicity and Employment Status

We classified the neighborhoods (Dongs) based on their residents’ ethnicity and employment status information. Specifically, we considered the tertile ranks, which is a useful approach in dividing the range into high, medium, and low, in three different variables (e.g., shares of Korean, Japanese, and unemployed populations) of each neighborhood to create nine types of neighborhoods (see Table 2), such as the following:
  • Type 1: Japanese-dominant neighborhoods with a low unemployment rate.
  • Type 2: Japanese-dominant neighborhoods with a medium unemployment rate.
  • Type 3: Japanese-dominant neighborhoods with a high unemployment rate.
  • Type 4: mixed-ethnicity neighborhoods with a low unemployment rate.
  • Type 5: mixed-ethnicity neighborhoods with a medium unemployment rate.
  • Type 6: mixed-ethnicity neighborhoods with a high unemployment rate
  • Type 7: Korean-dominant neighborhoods with a low unemployment rate.
  • Type 8: Korean-dominant neighborhoods with a medium unemployment rate.
  • Type 9: Korean-dominant neighborhoods with a high unemployment rate.
Figure 4 depicts the geographic distribution of nine neighborhood types within the study area. Figure 4 highlights that the majority of Japanese-dominant neighborhoods (areas with blue colors) with low (Type 1) or medium (Type 2) unemployment rates were located in the southern part of the city hall, which had been historically regarded as a Japanese enclave since the beginning of the colonial era in 1910. On the contrary, Korean-dominant neighborhoods (areas with red colors) with low (Type 7) or medium (Type 8) unemployment rates were generally dispersed across the city and also located in the peripheries of the city. Interestingly, Type 9 neighborhoods (red color with the highest chroma)—Korean-dominant communities with a high unemployment ratio—were located in very close proximity to Japanese-dominant neighborhoods (blue color with the highest chroma).

5.2. Measuring Accessibility to Food Outlets Using a Cumulative Approach

In this study, we adopted a well-established cumulative accessibility measure [54,56,59,60,61,62] to compute food accessibility in colonial Seoul. The centroids of residential parcels (41,646) were used as trip origins, while food business locations (571) were used as potential destinations. Using the r5r open-source transport package [36], we calculated a large travel time matrix, which had 23,779,866 (41,646 × 571) pairs of origins and destinations. Based on this travel time matrix, we computed the cumulative accessibility using Equation (1), below:
A i = j O j   ,         i f   d i j T         0     ,                                   i f   d i j > T                                            
where A i indicates the count of accessible food outlets at the origin parcel,   i , within a given time budget, T , (in this study, T = 15 or 30 min) via public transit or walking. O j is the number of food businesses at a parcel, j . A food business was considered as accessible if d i j (travel time between parcel   i and j) was less than a specified travel time threshold, T . We further computed the mean, A i , of the parcels included in a neighborhood (Dong). The resulting mean, A i , was used as the food accessibility index of a neighborhood (Dong).

5.3. Exploring Disparities in Food Accessibility Using Post-Hoc Tests

To explore the disparities in food accessibility among the neighborhoods in colonial Seoul, we used ANOVA and Tukey’s post-hoc statistical tests [63]. These statistical tests examined whether there was a statistically significant difference in the average food accessibility amongst the neighborhoods and between pairs (e.g., Type 1 vs. Type 9) of neighborhoods. We tested a total of 36 pairs of neighborhoods, except for the comparisons between the same types of neighborhood and overlapped pairs.

6. Results

In this section, we provide the food accessibility analysis results and the maps for investigating the disparities in food accessibility across the different neighborhood types (Type 1–9) in the study area. Food accessibility maps presented the spatial patterns of neighborhood (dong) accessibility to five types of food resources—(1) rice, (2) groceries, (3) meat, (4) seafood, and (5) produce (vegetables and fruit)—by two different mobility options—(1) public transit and (2) walking—within a 15- or 30-min time budget. Box plots of each type of food accessibility (Figures 6, 8, 10, 12 and 14) are also provided in this section. Furthermore, parallel plots were generated for an effective and easy comparison of food accessibility by neighborhood type as well as by food resource types, thereby enabling a holistic understanding of food accessibility patterns in 1930s colonial Seoul.

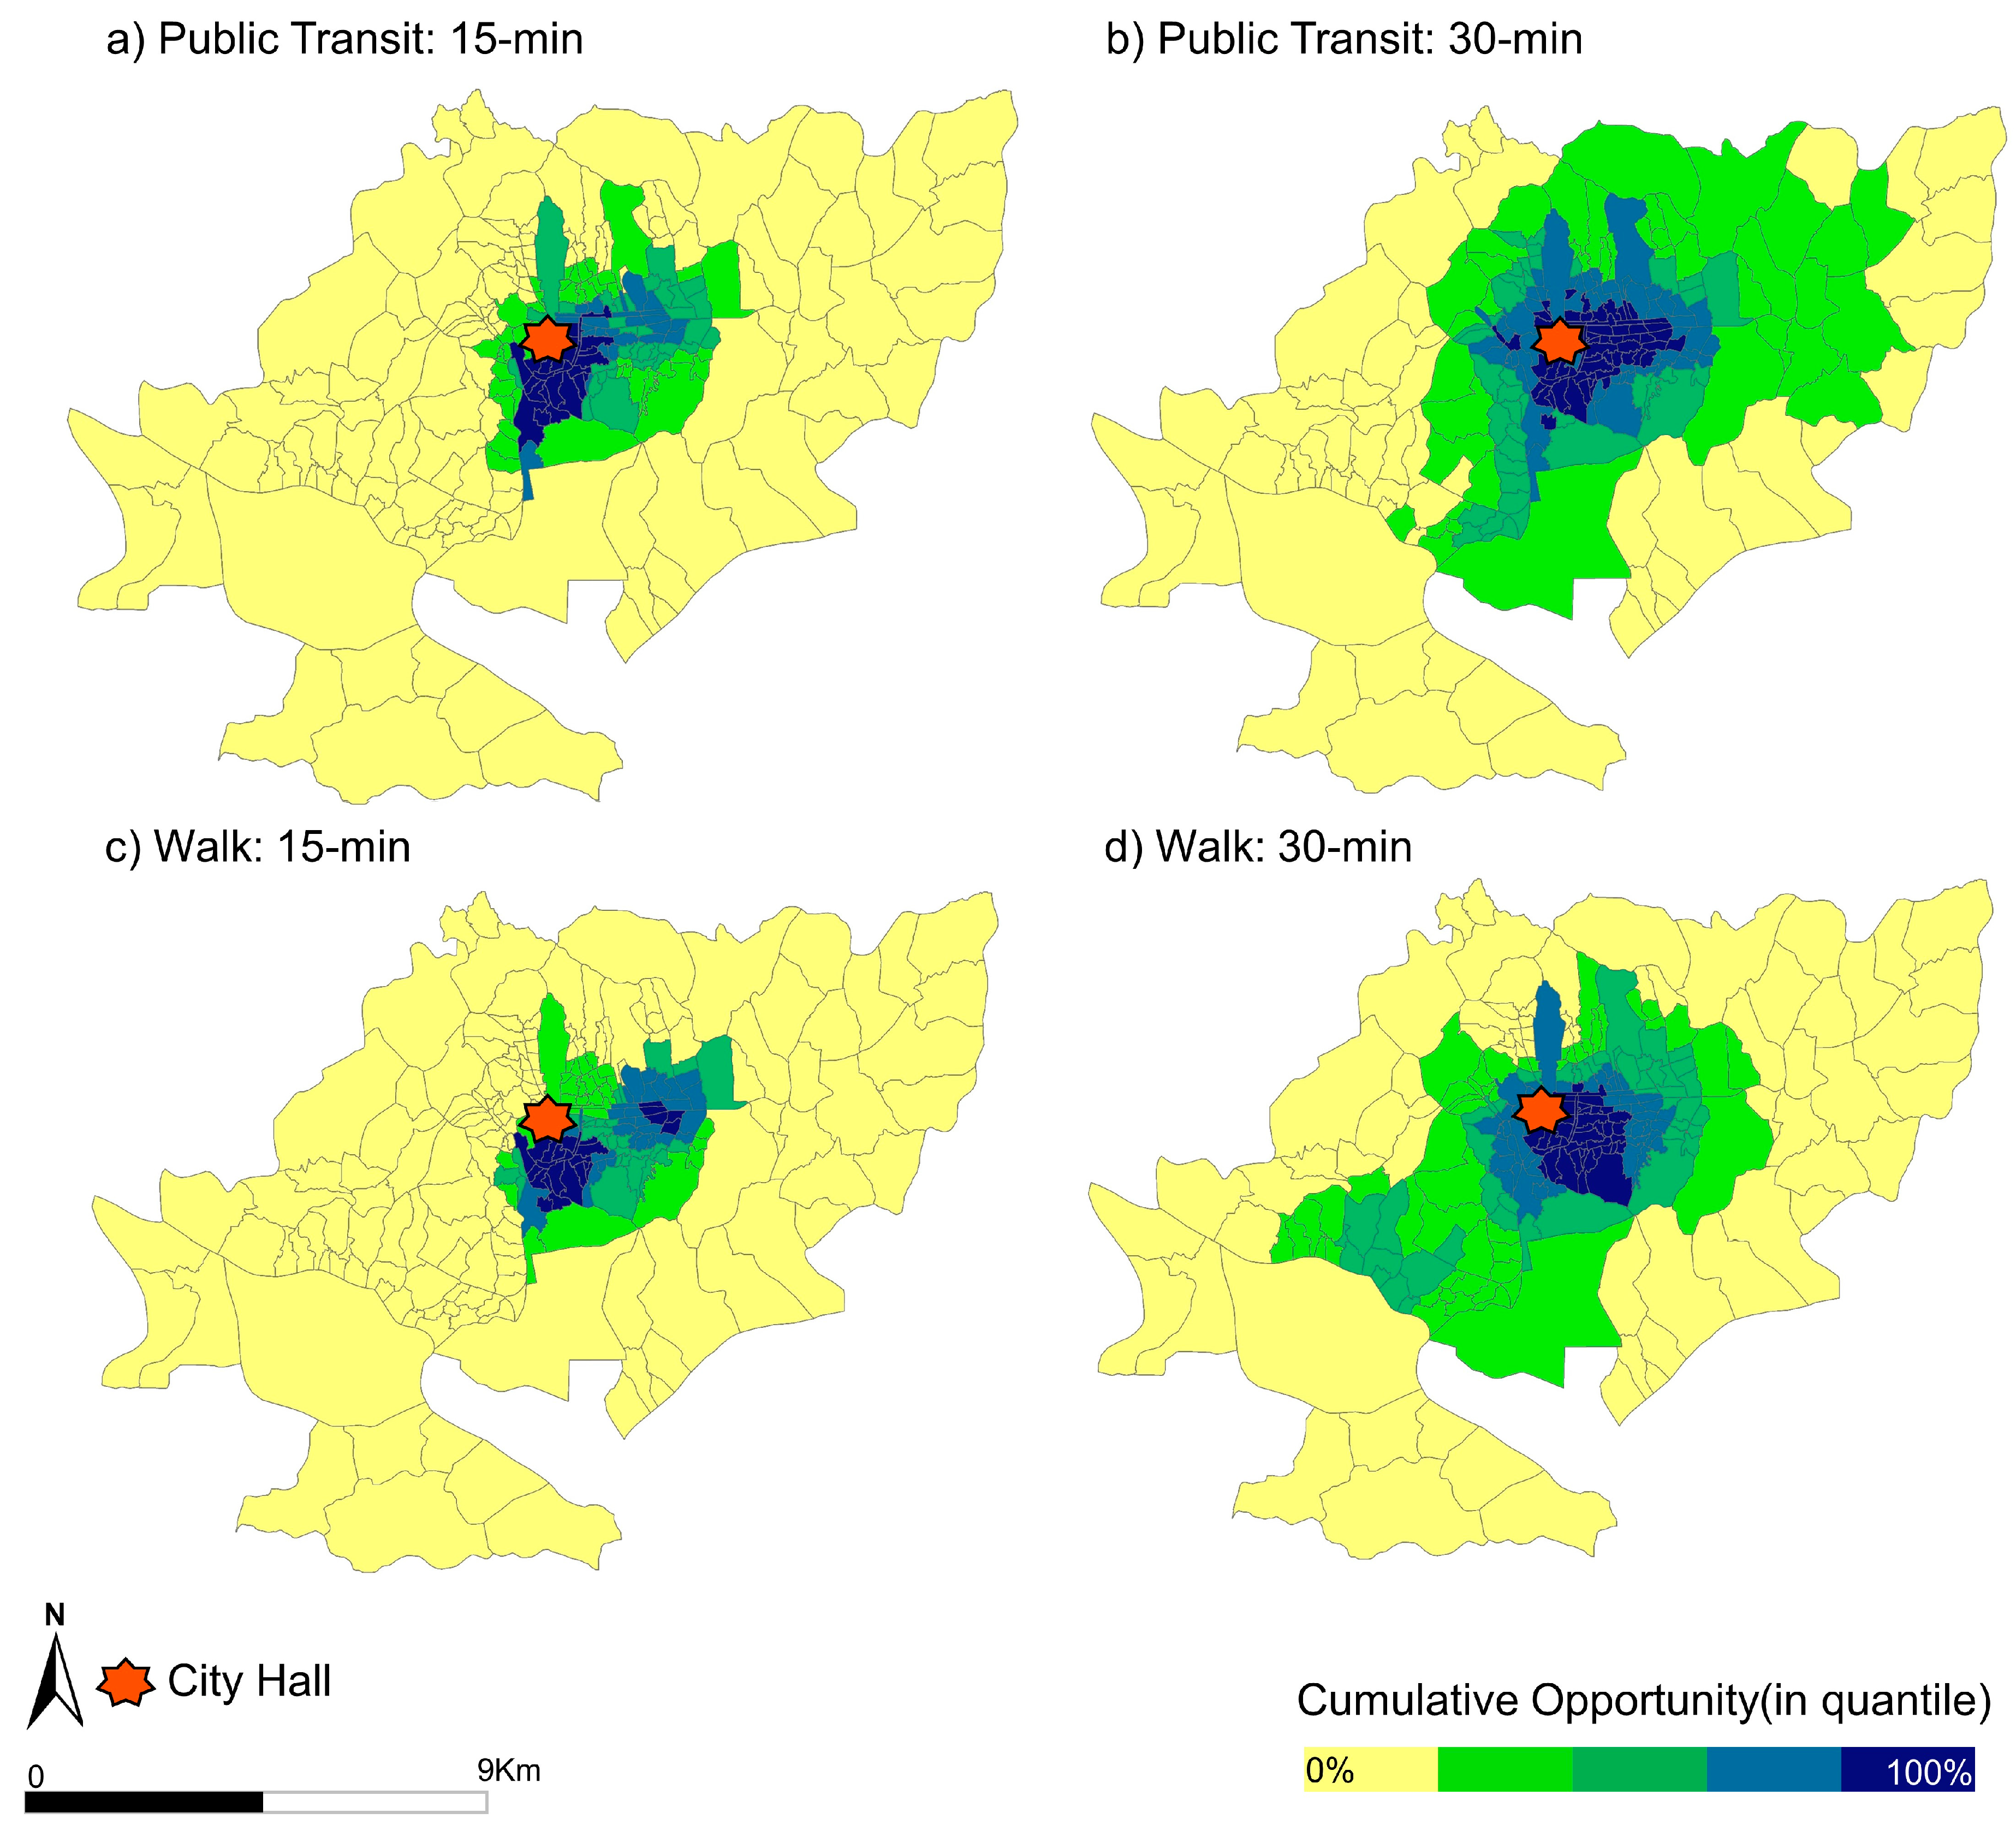
6.1. Food Accessibility Maps and Analyses

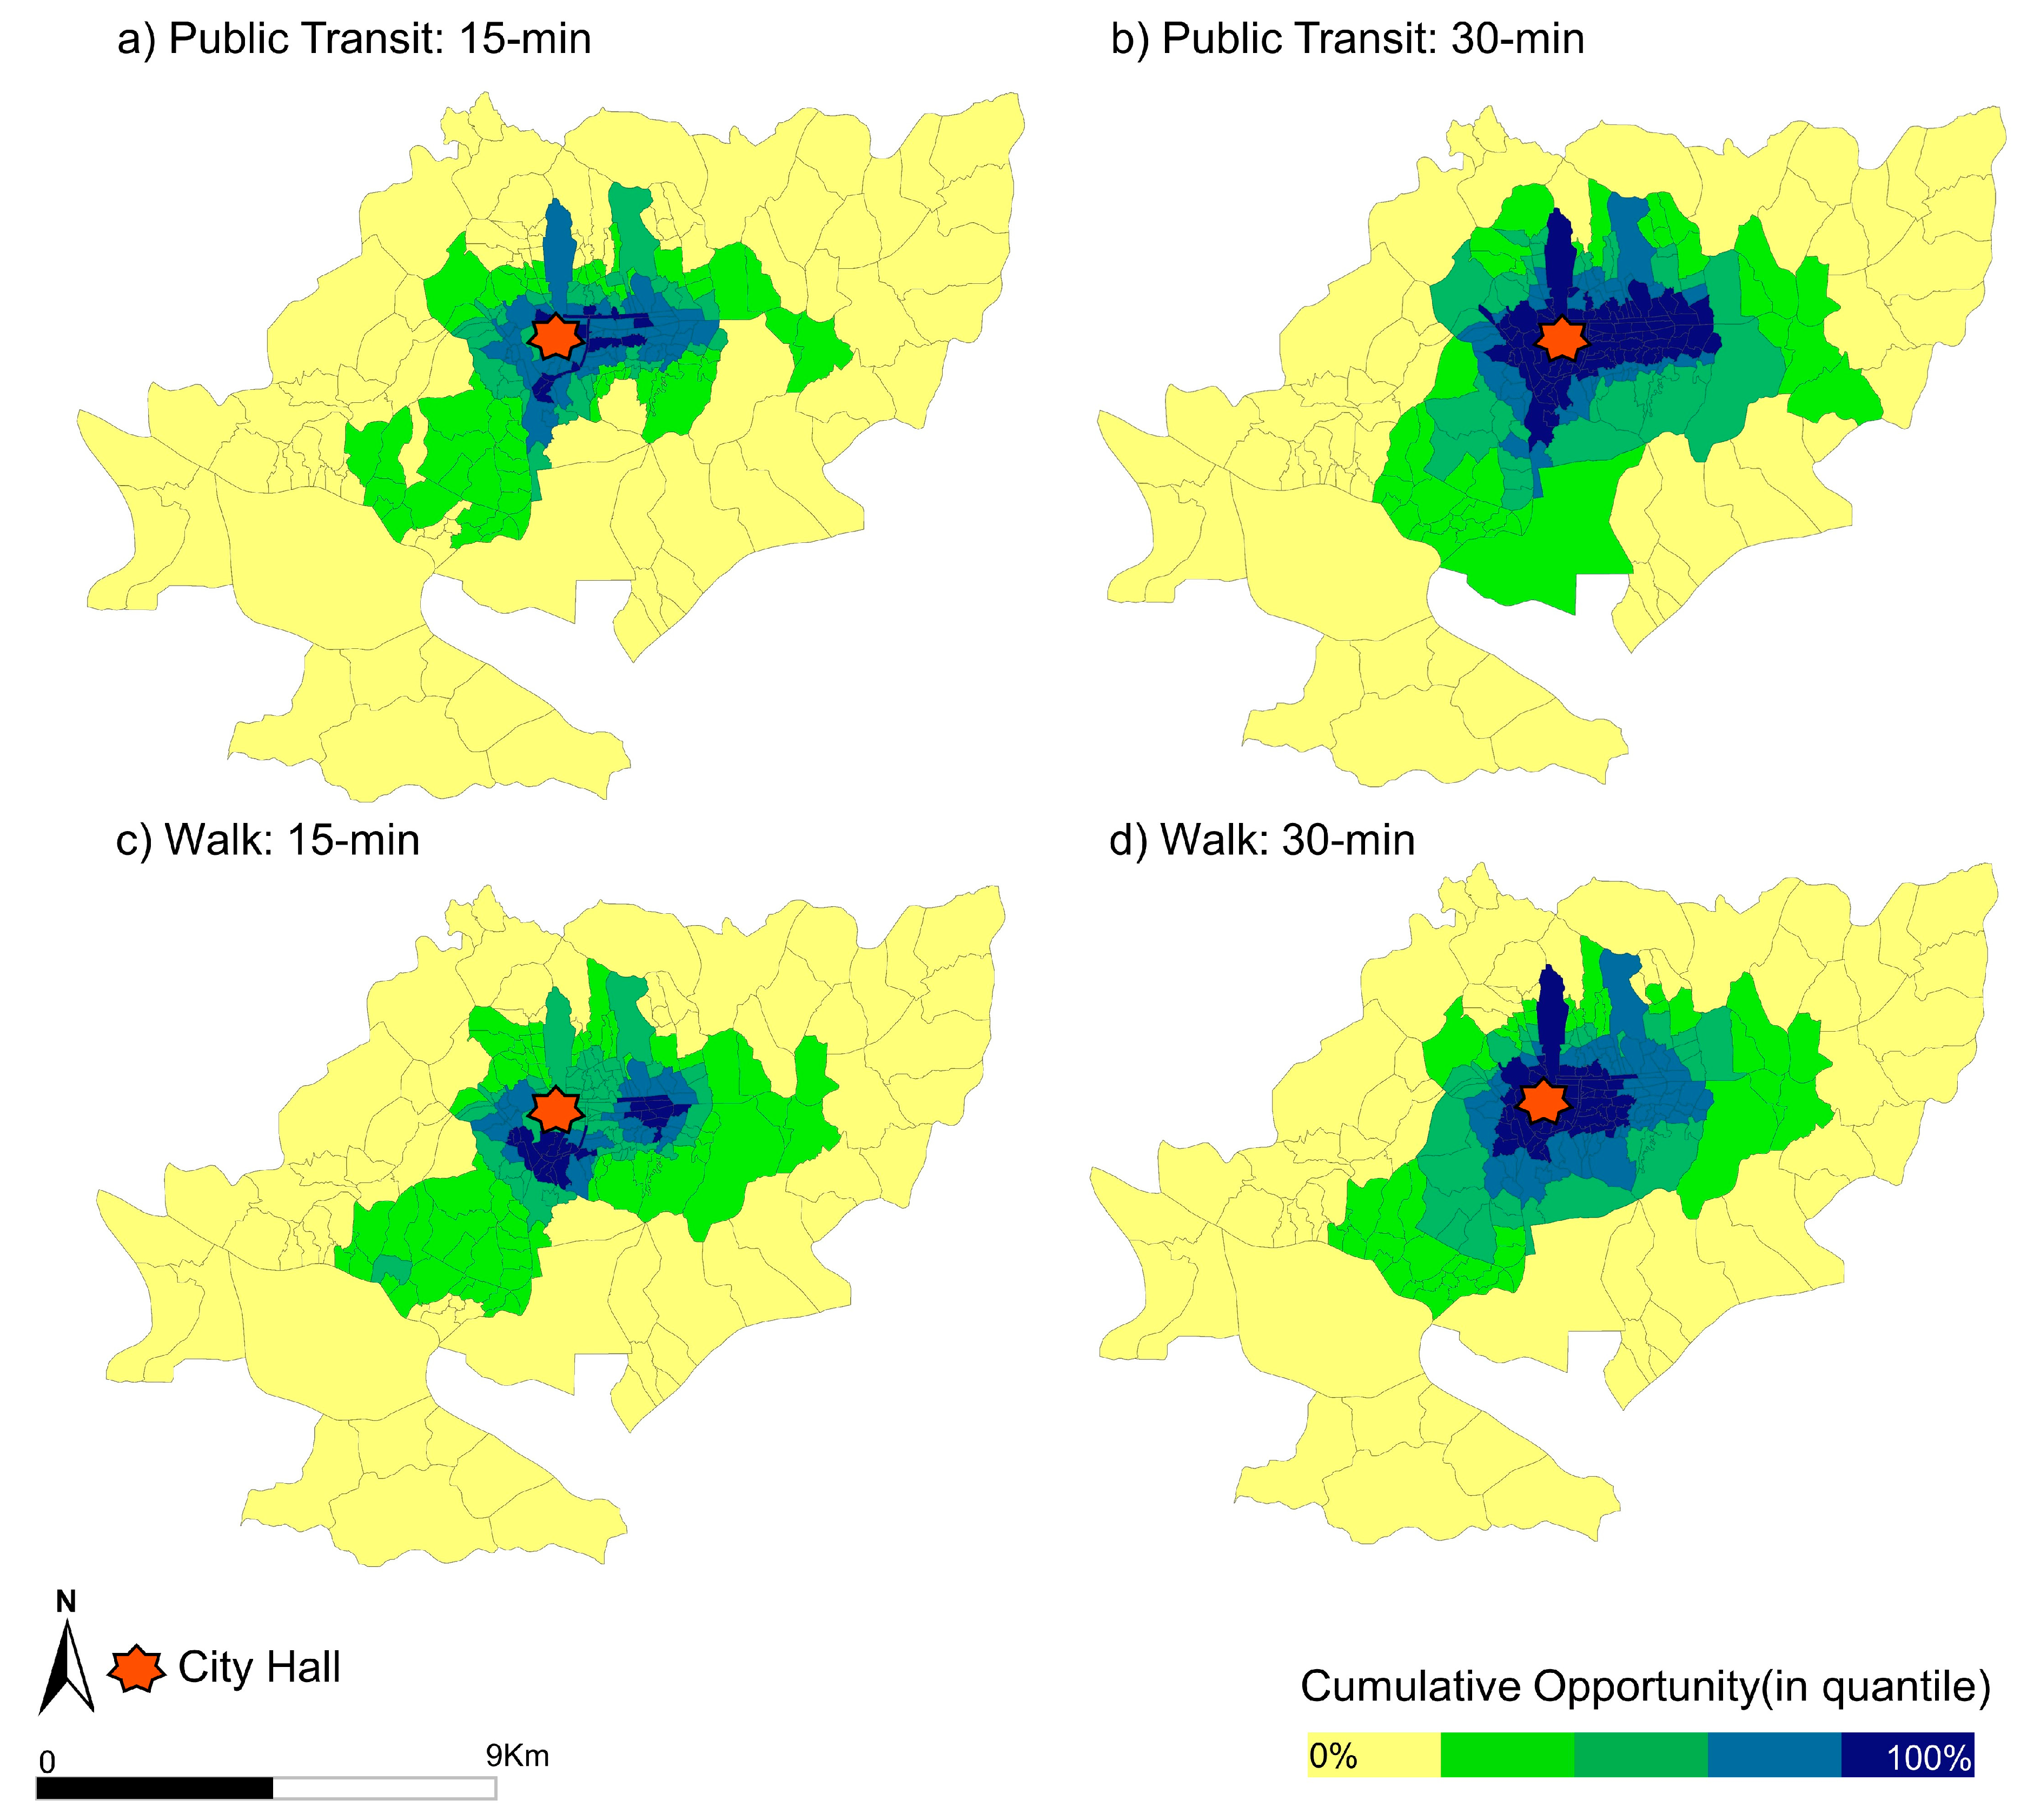
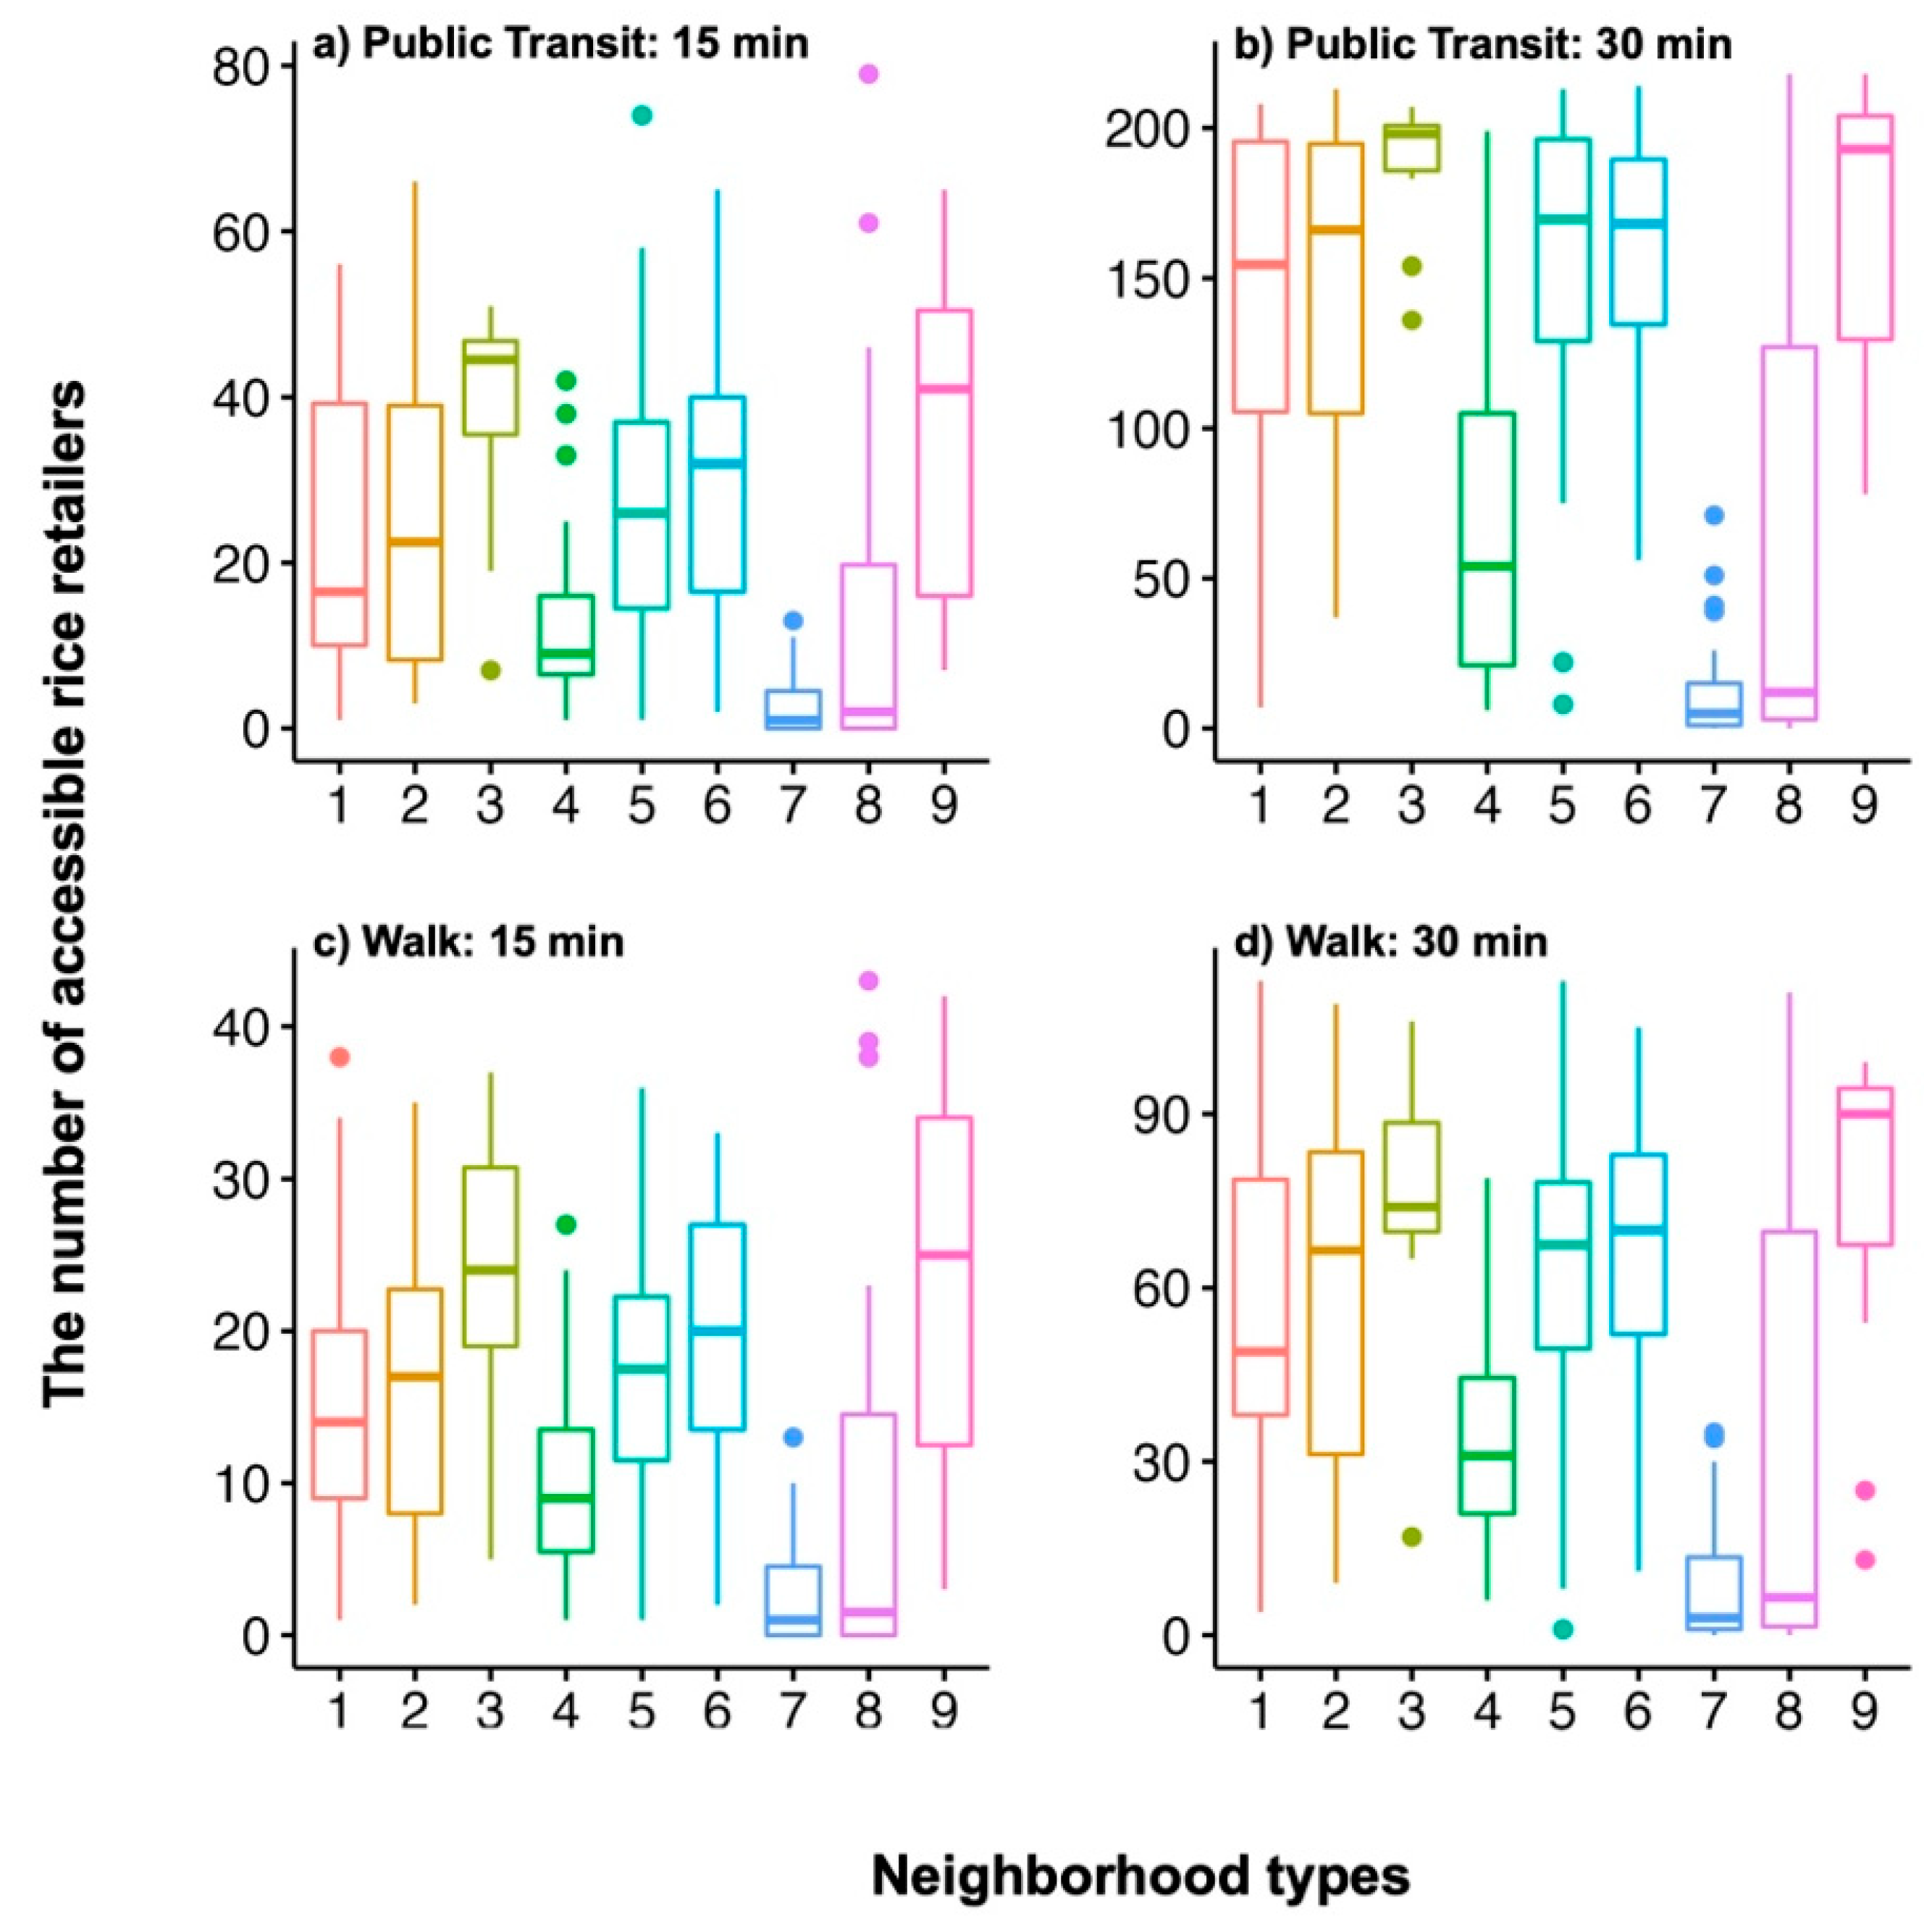
6.1.1. Rice Accessibility

Figure 5 shows rice accessibility maps via public transit or walking. In the maps, darker blue colors indicate a higher level of accessibility to rice retail businesses, given the travel time threshold (15 min or 30 min). The neighborhoods in the south and east parts of the city (based on the location of the city hall) generally show higher accessibility to rice retailers for both public transit (Figure 5a) and walking (Figure 5c), with a 15-min time budget. As the travel time threshold increased to 30 min, rice accessibility by walking (Figure 5d) stretched into the east-west direction of the city, while public transit access (Figure 5b) to rice expanded to the east-south direction along the transit network (see the spatial configuration of the public transit network in Figure 4). Meanwhile, the peripheral areas of colonial Seoul showed a lower level of rice accessibility across different modes and time budgets.
Figure 6 summarizes rice accessibility by neighborhood type as a box plot. Overall, the Japanese-dominant (colonial rulers) neighborhoods (Types 1–3) showed greater rice accessibility than the Korean-dominant (colonial subjects) neighborhoods (Types 7–9). A noteworthy point comes from the accessibility results of neighborhood Type 9—a poor Korean-dominant neighborhood with a high unemployment rate. Across all metrics, the average rice accessibility of this neighborhood (Type 9) was higher than the mean rice accessibility of neighborhood Type 1, which was a wealthy Japanese-dominant neighborhood. This might be counterintuitive, as colonial subjects had a higher level of accessibility than the colonial rulers who oversaw the city operations. However, the fact that most Koreans had historically lived close to big marketplaces with a good availability of staple food resources, such as rice, can explain the high rice accessibility patterns of relatively poor Korean-dominant communities.

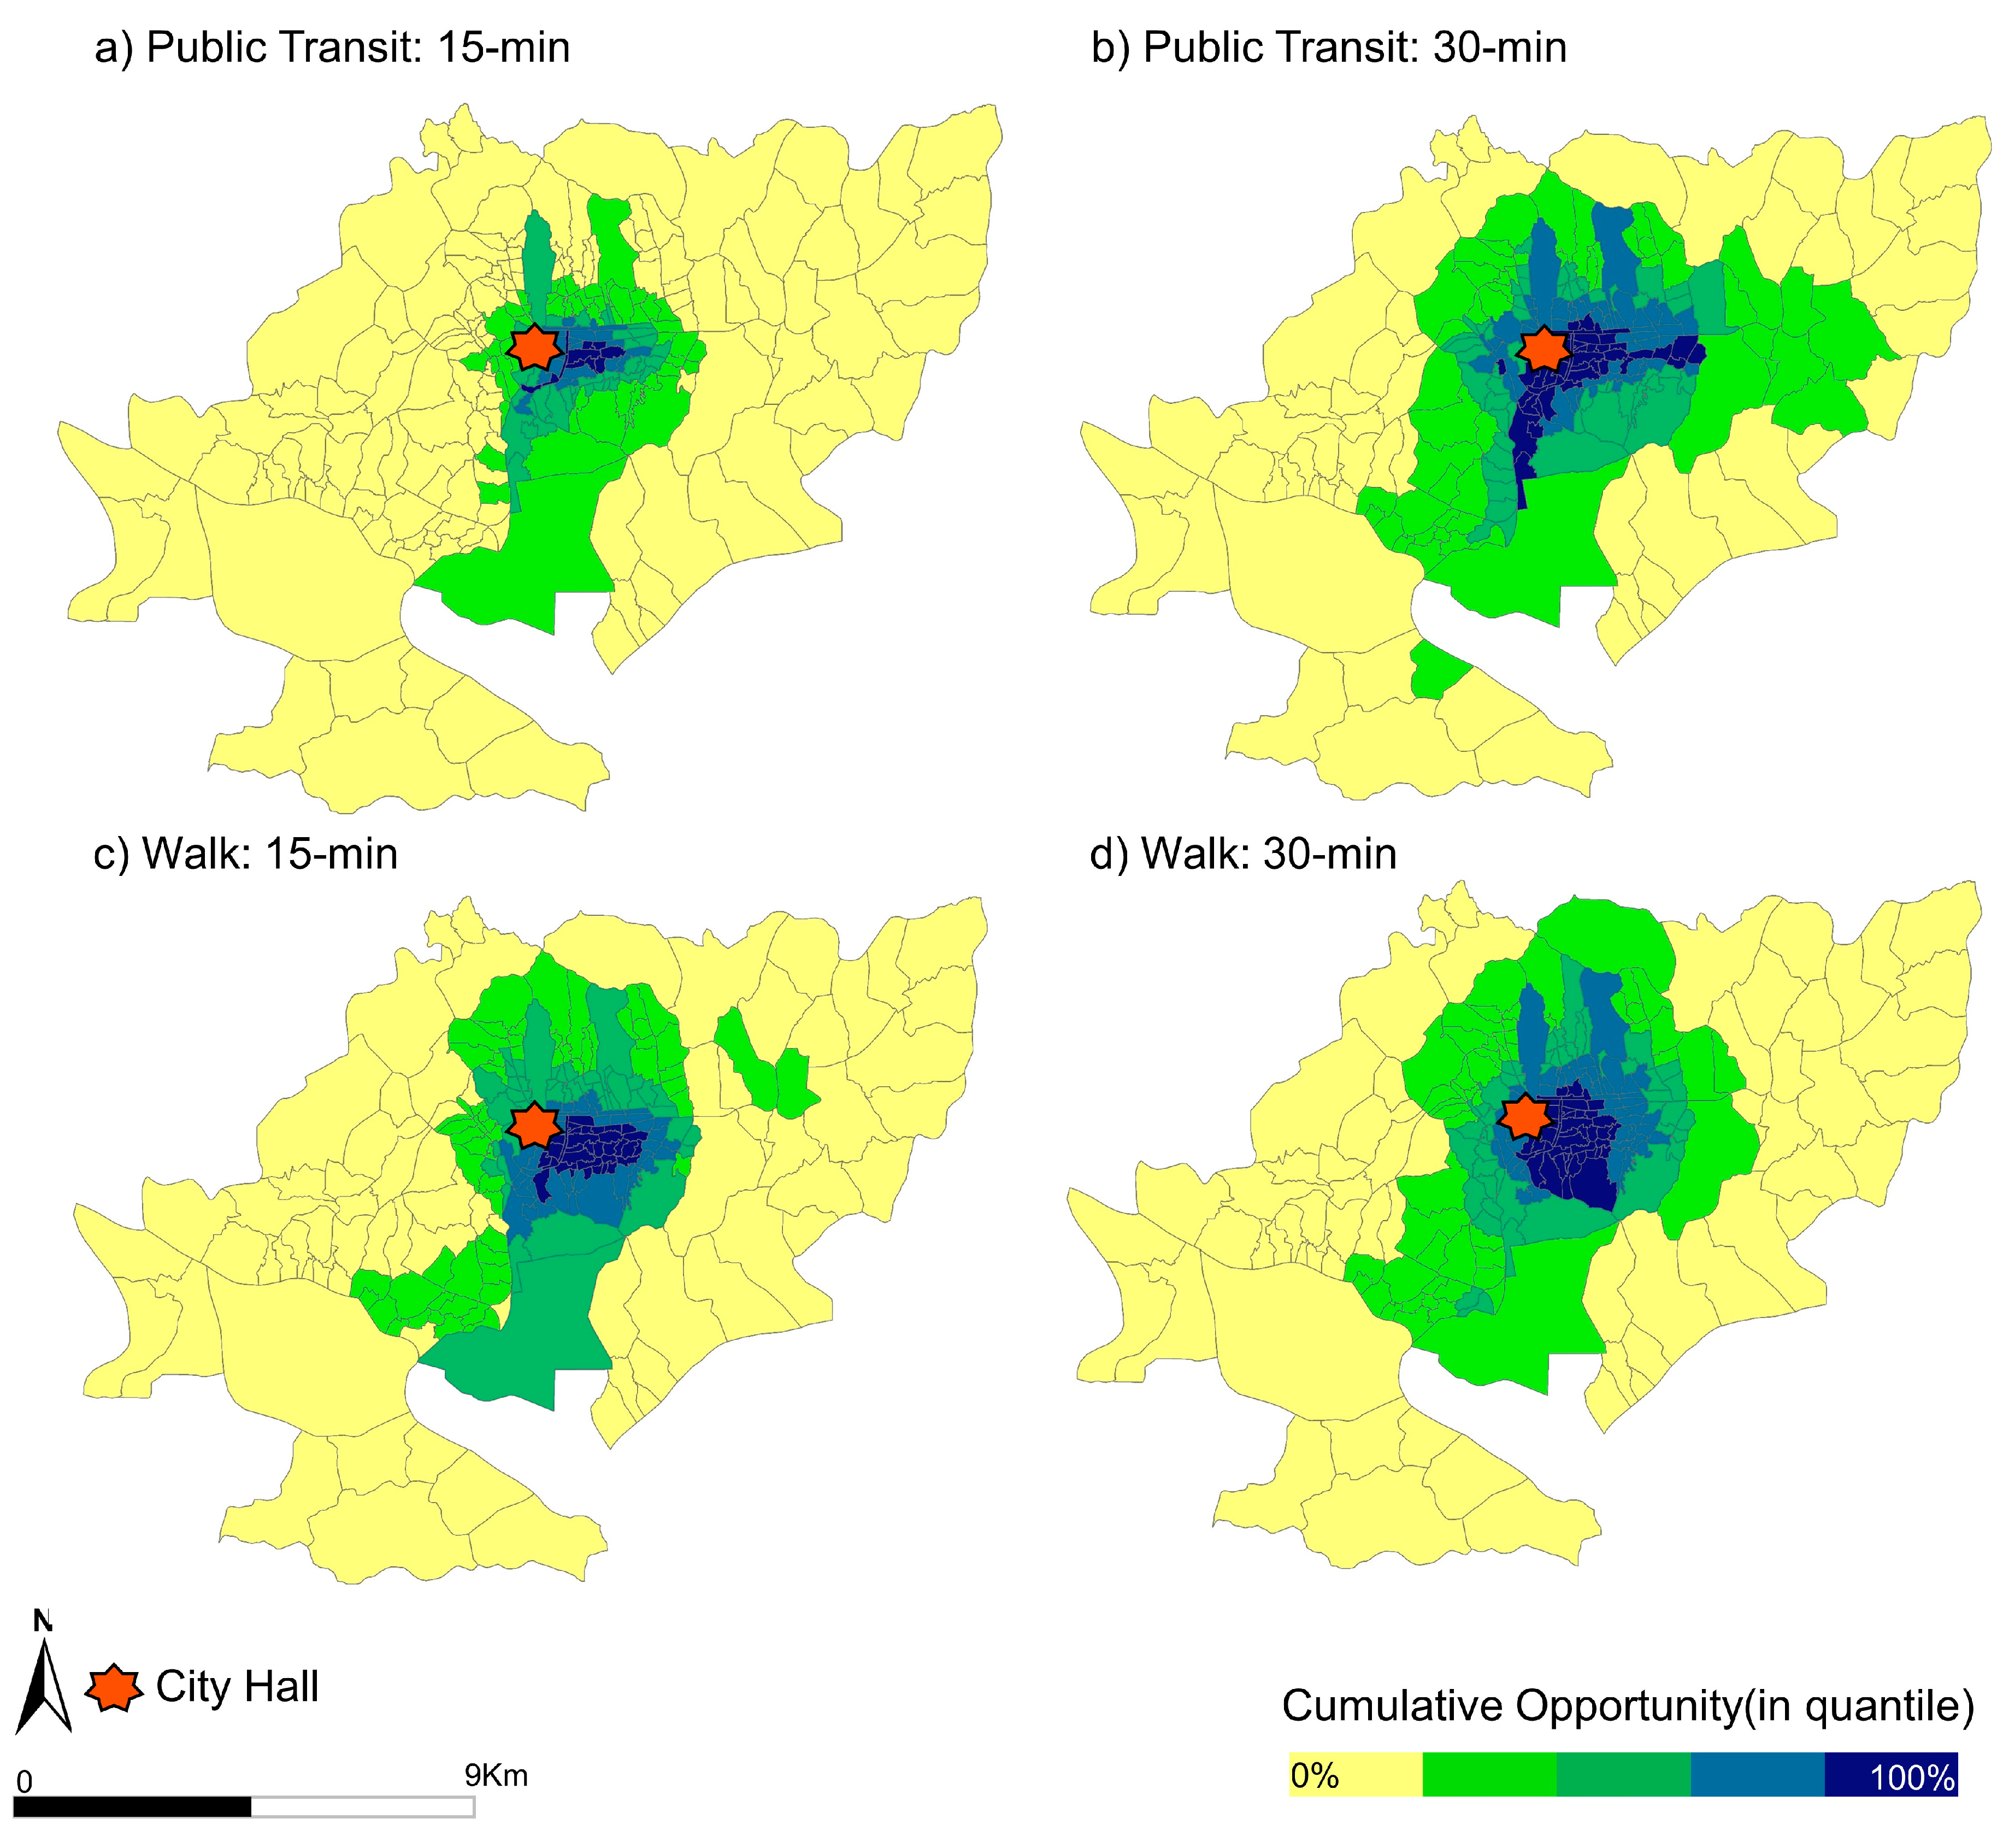
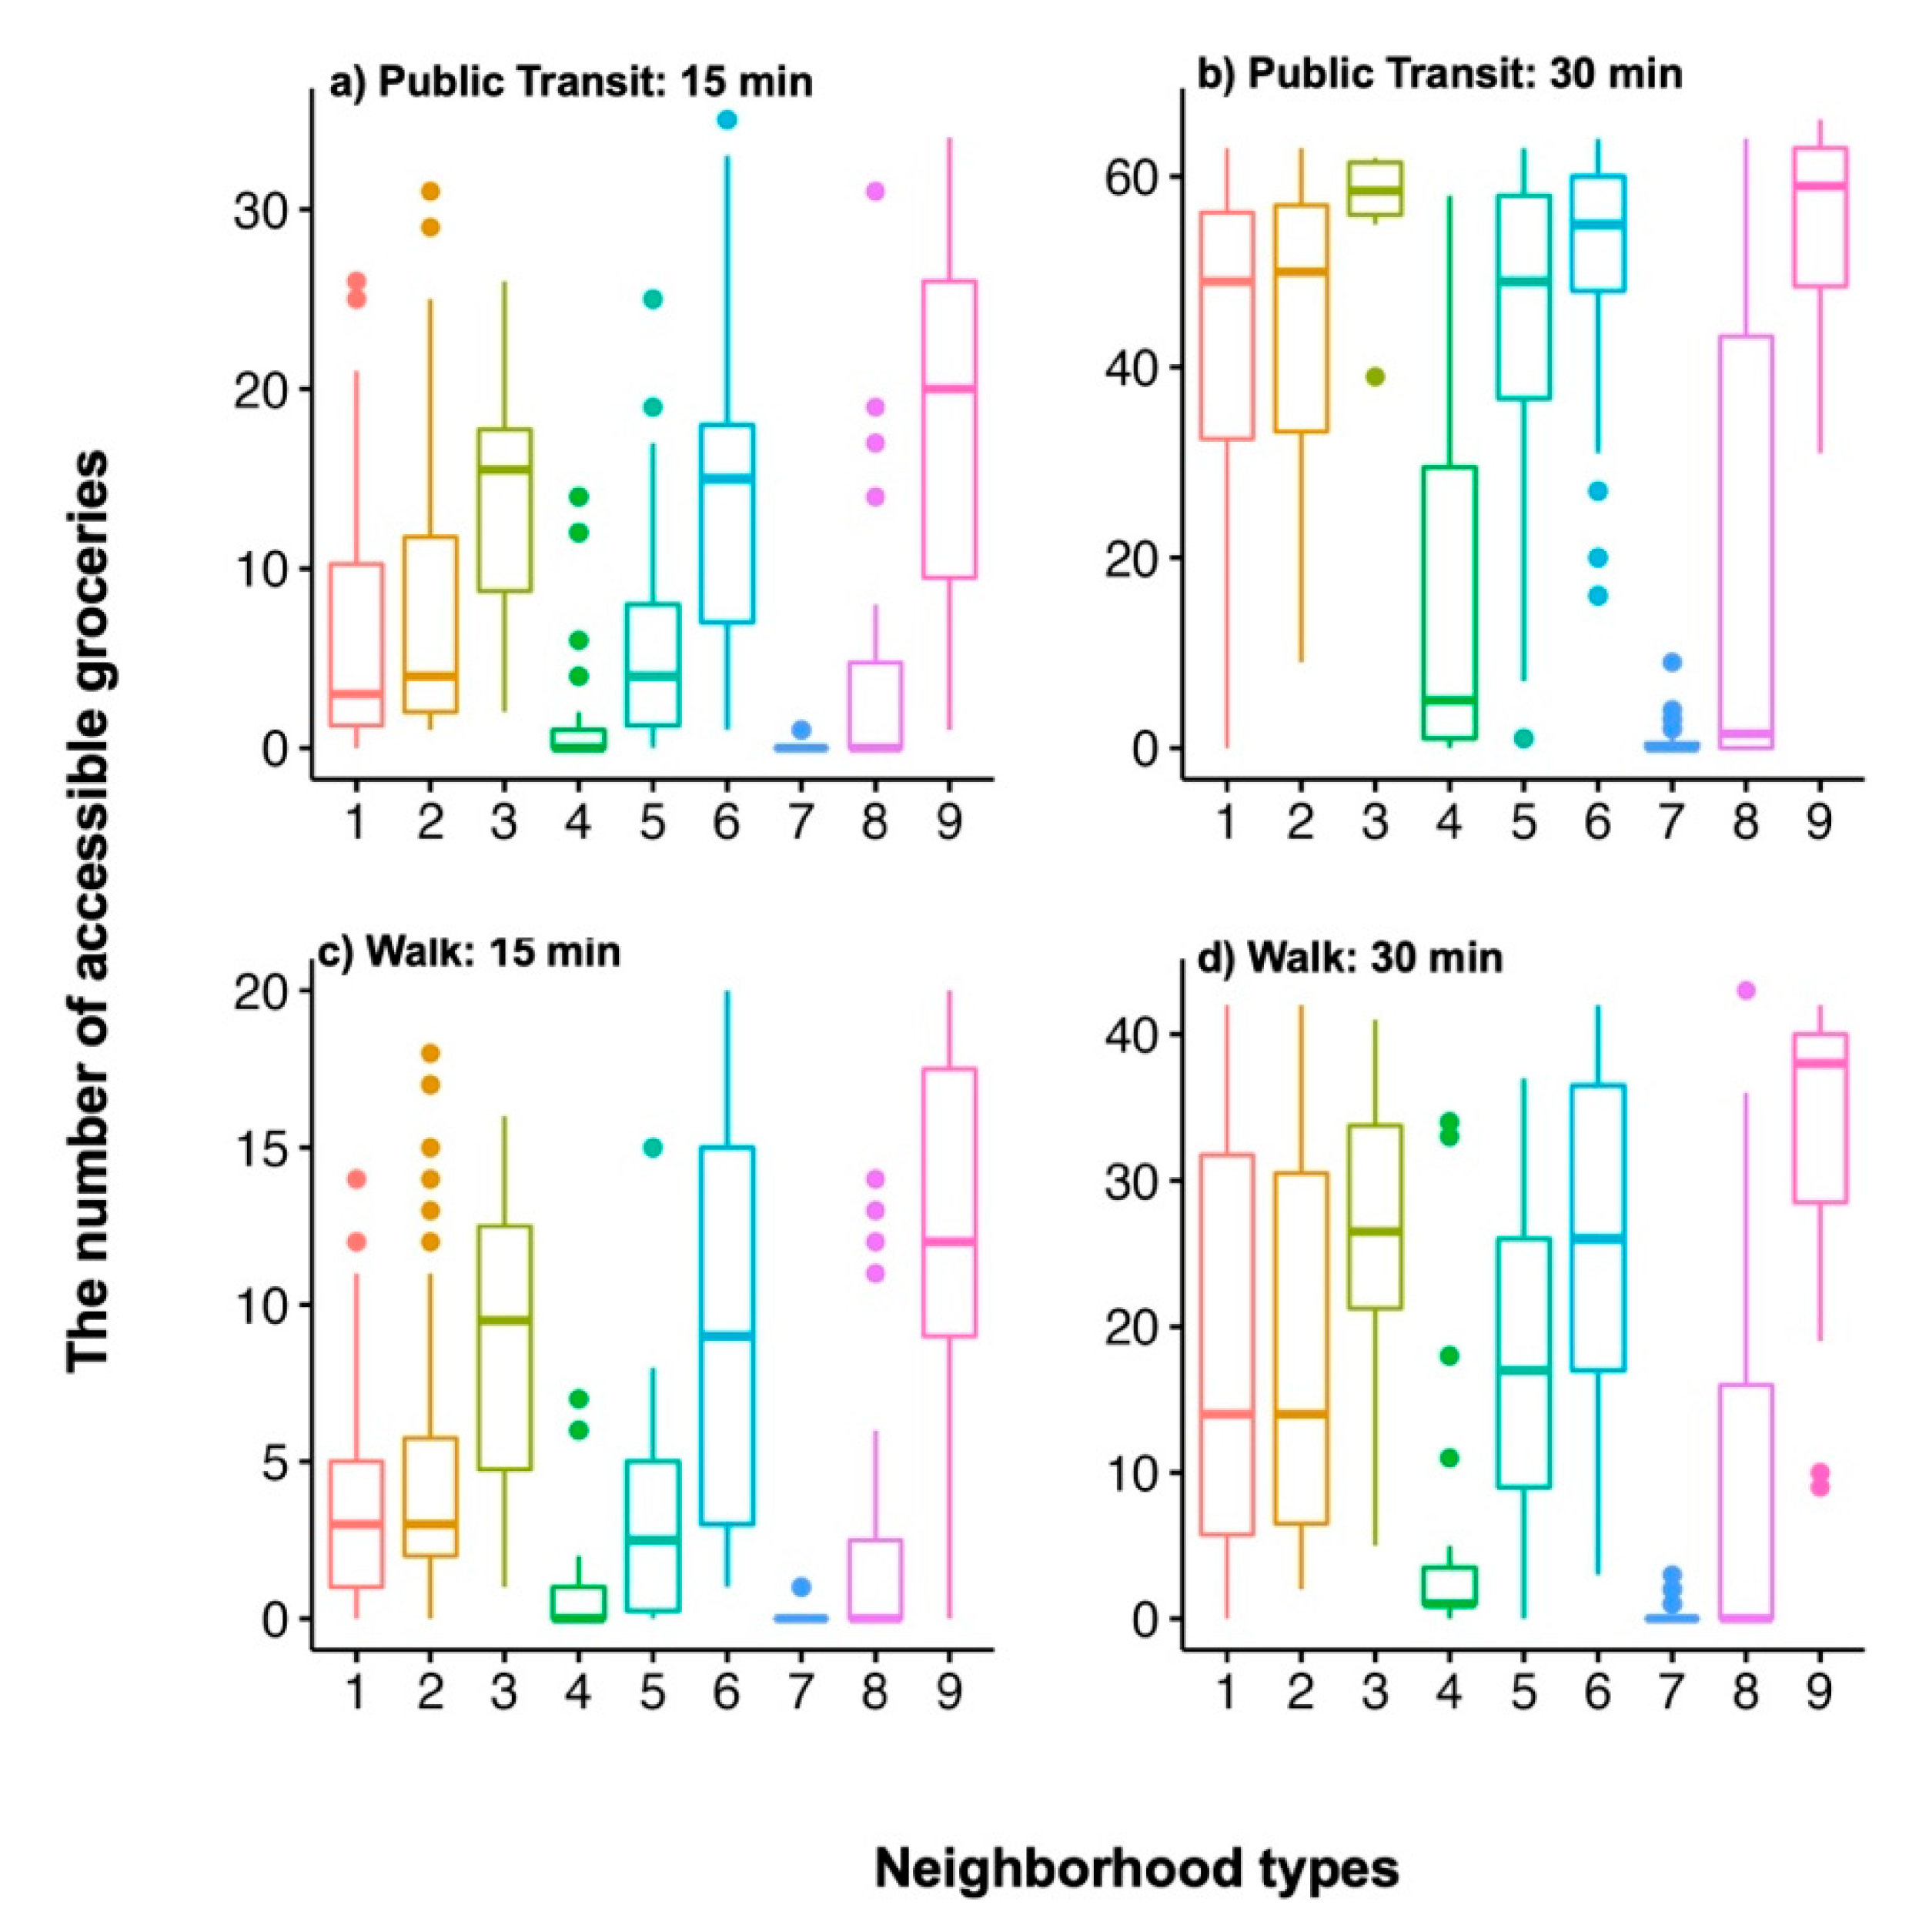
6.1.2. Grocery Accessibility

Figure 7 displays spatial patterns of neighborhood accessibility to groceries in colonial Seoul. Figure 7 clearly shows that the southern part of the city, where Japanese colonial rulers created ethnic enclaves (neighborhood Types 1, 2, and 3), generally had high accessibility to grocery stores. Figure 8 presents the average values of grocery accessibility for transit users and pedestrians across all types of neighborhoods. Accessibility, shown in Figure 8, demonstrates that Japanese-dominant neighborhoods (Types 1, 2, and 3) showed generally better accessibility to grocery resources than Korean-dominant neighborhoods (Types 7, 8, and 9). Strikingly, Korean-dominant neighborhood Type 7 could barely access grocery stores, either by public transit or walking, within a given time budget, which presented substantially poor access to grocery stores.

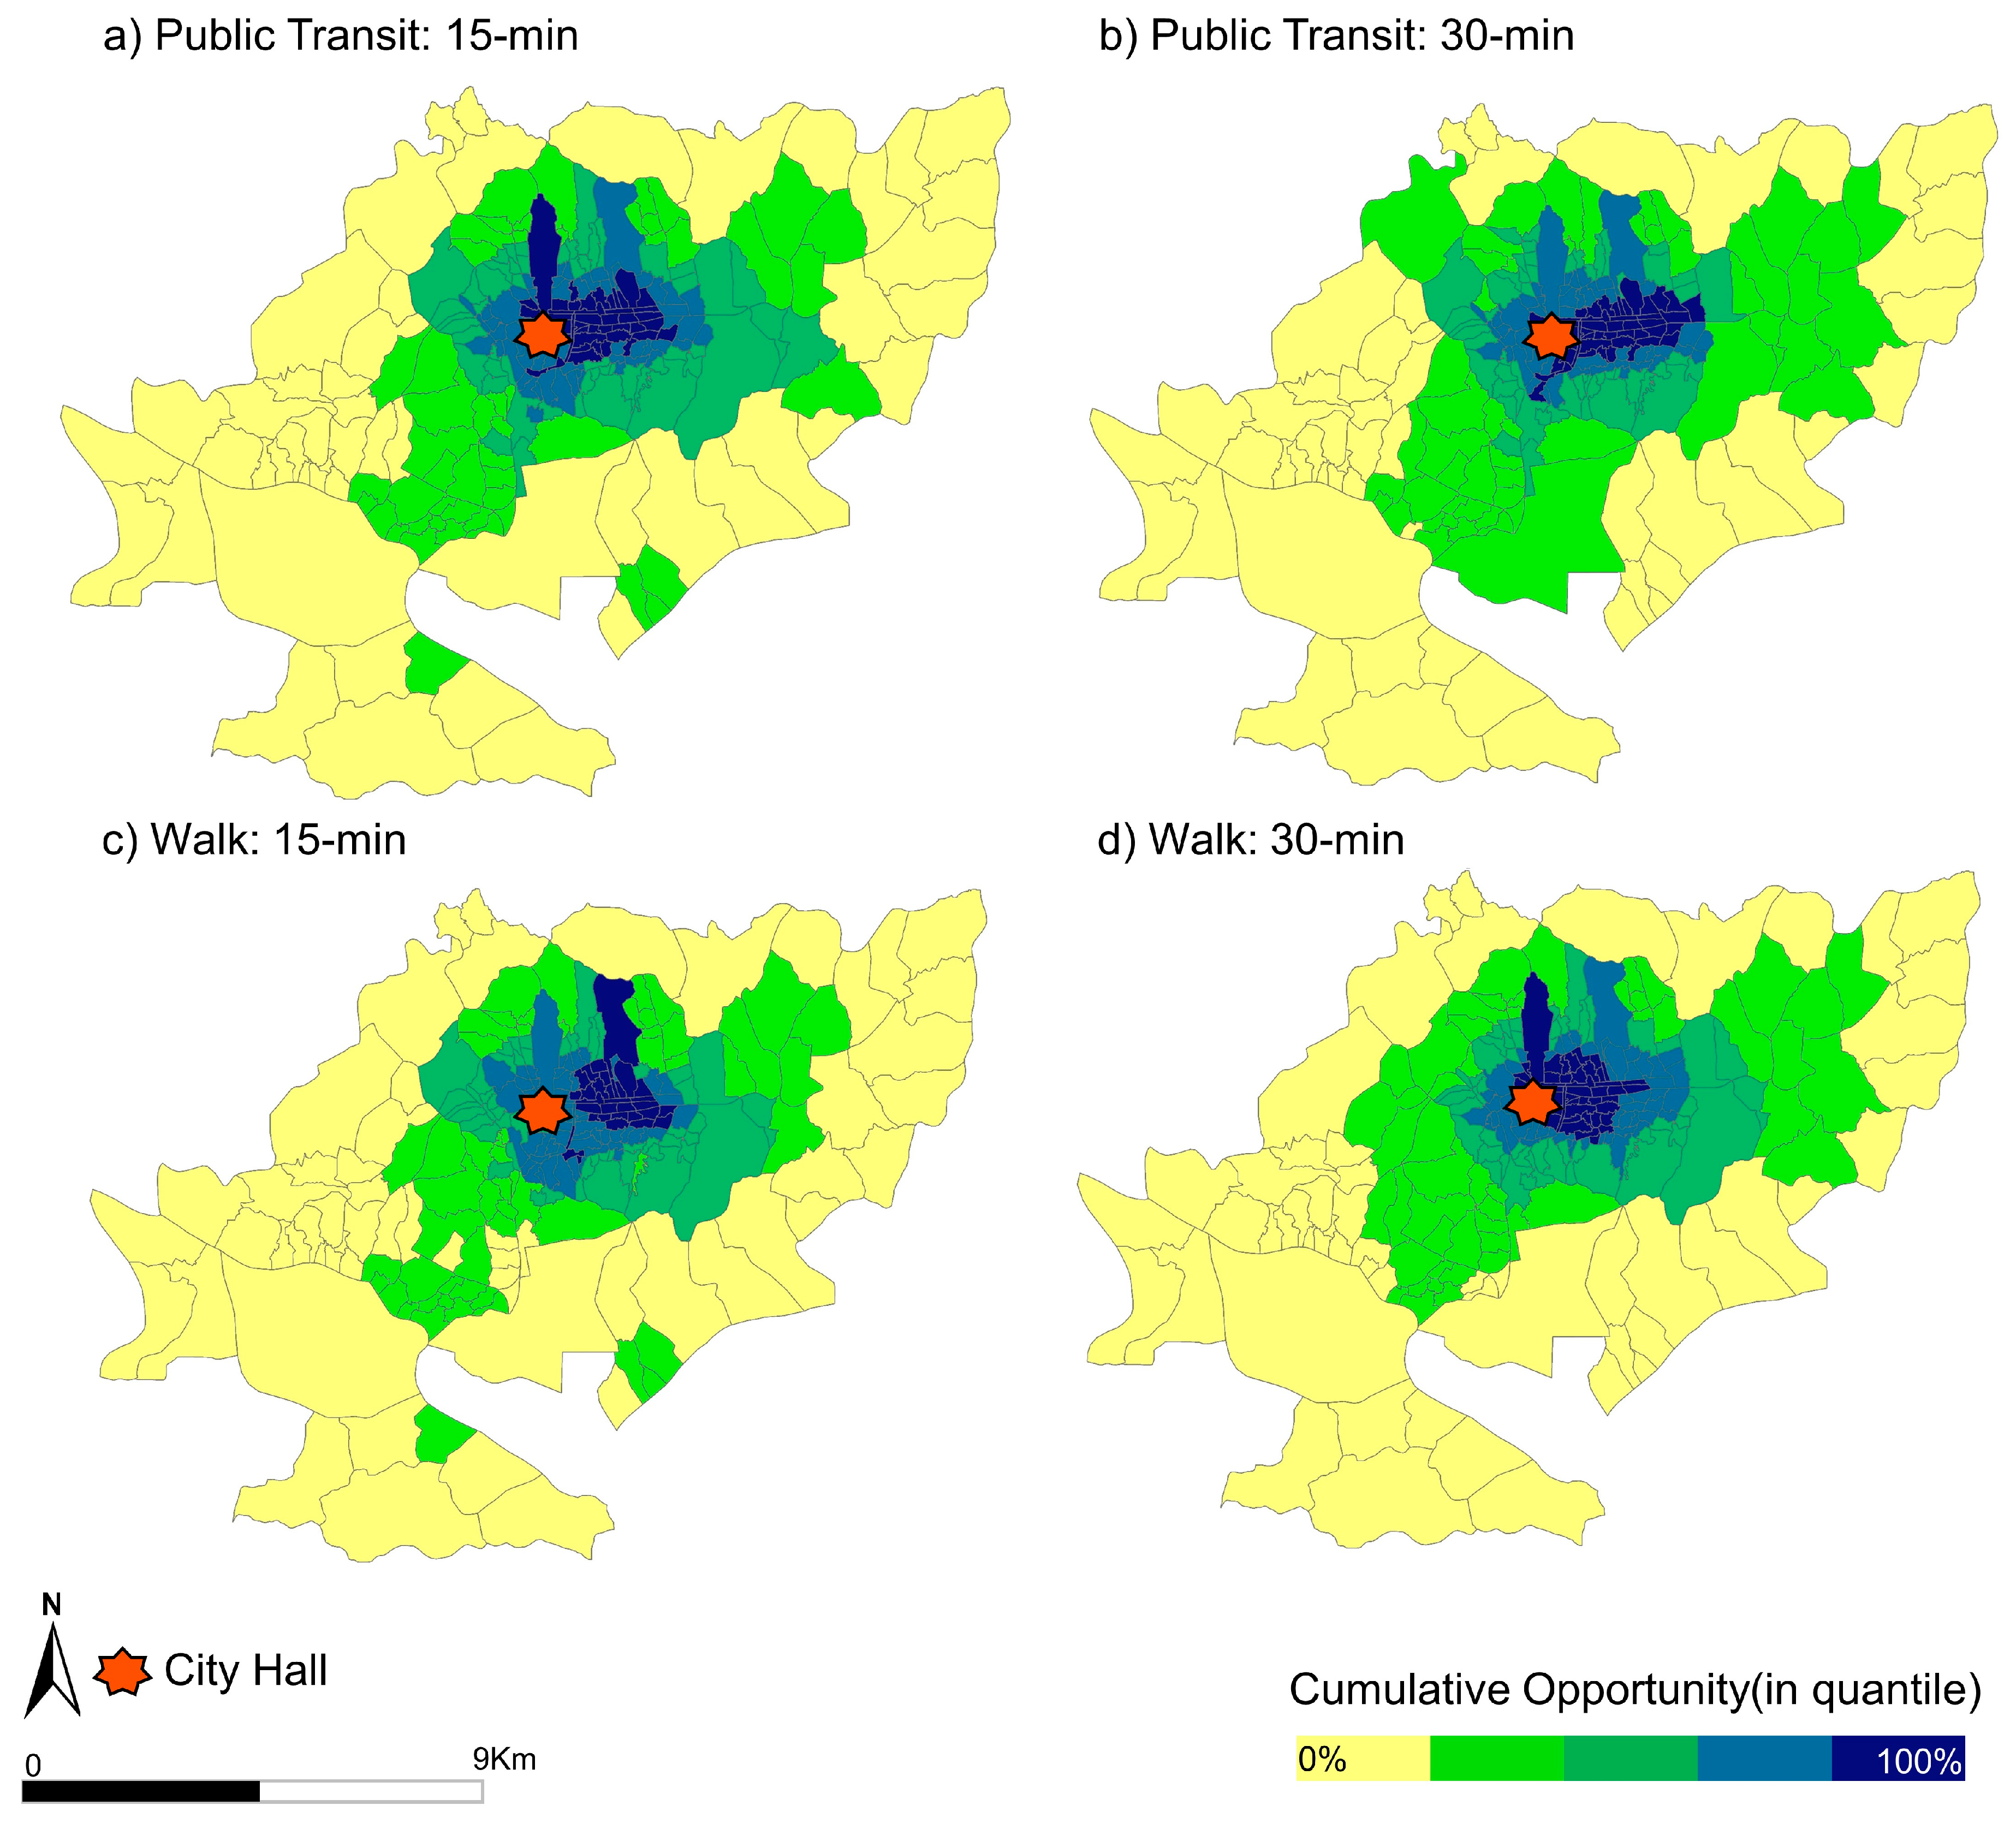
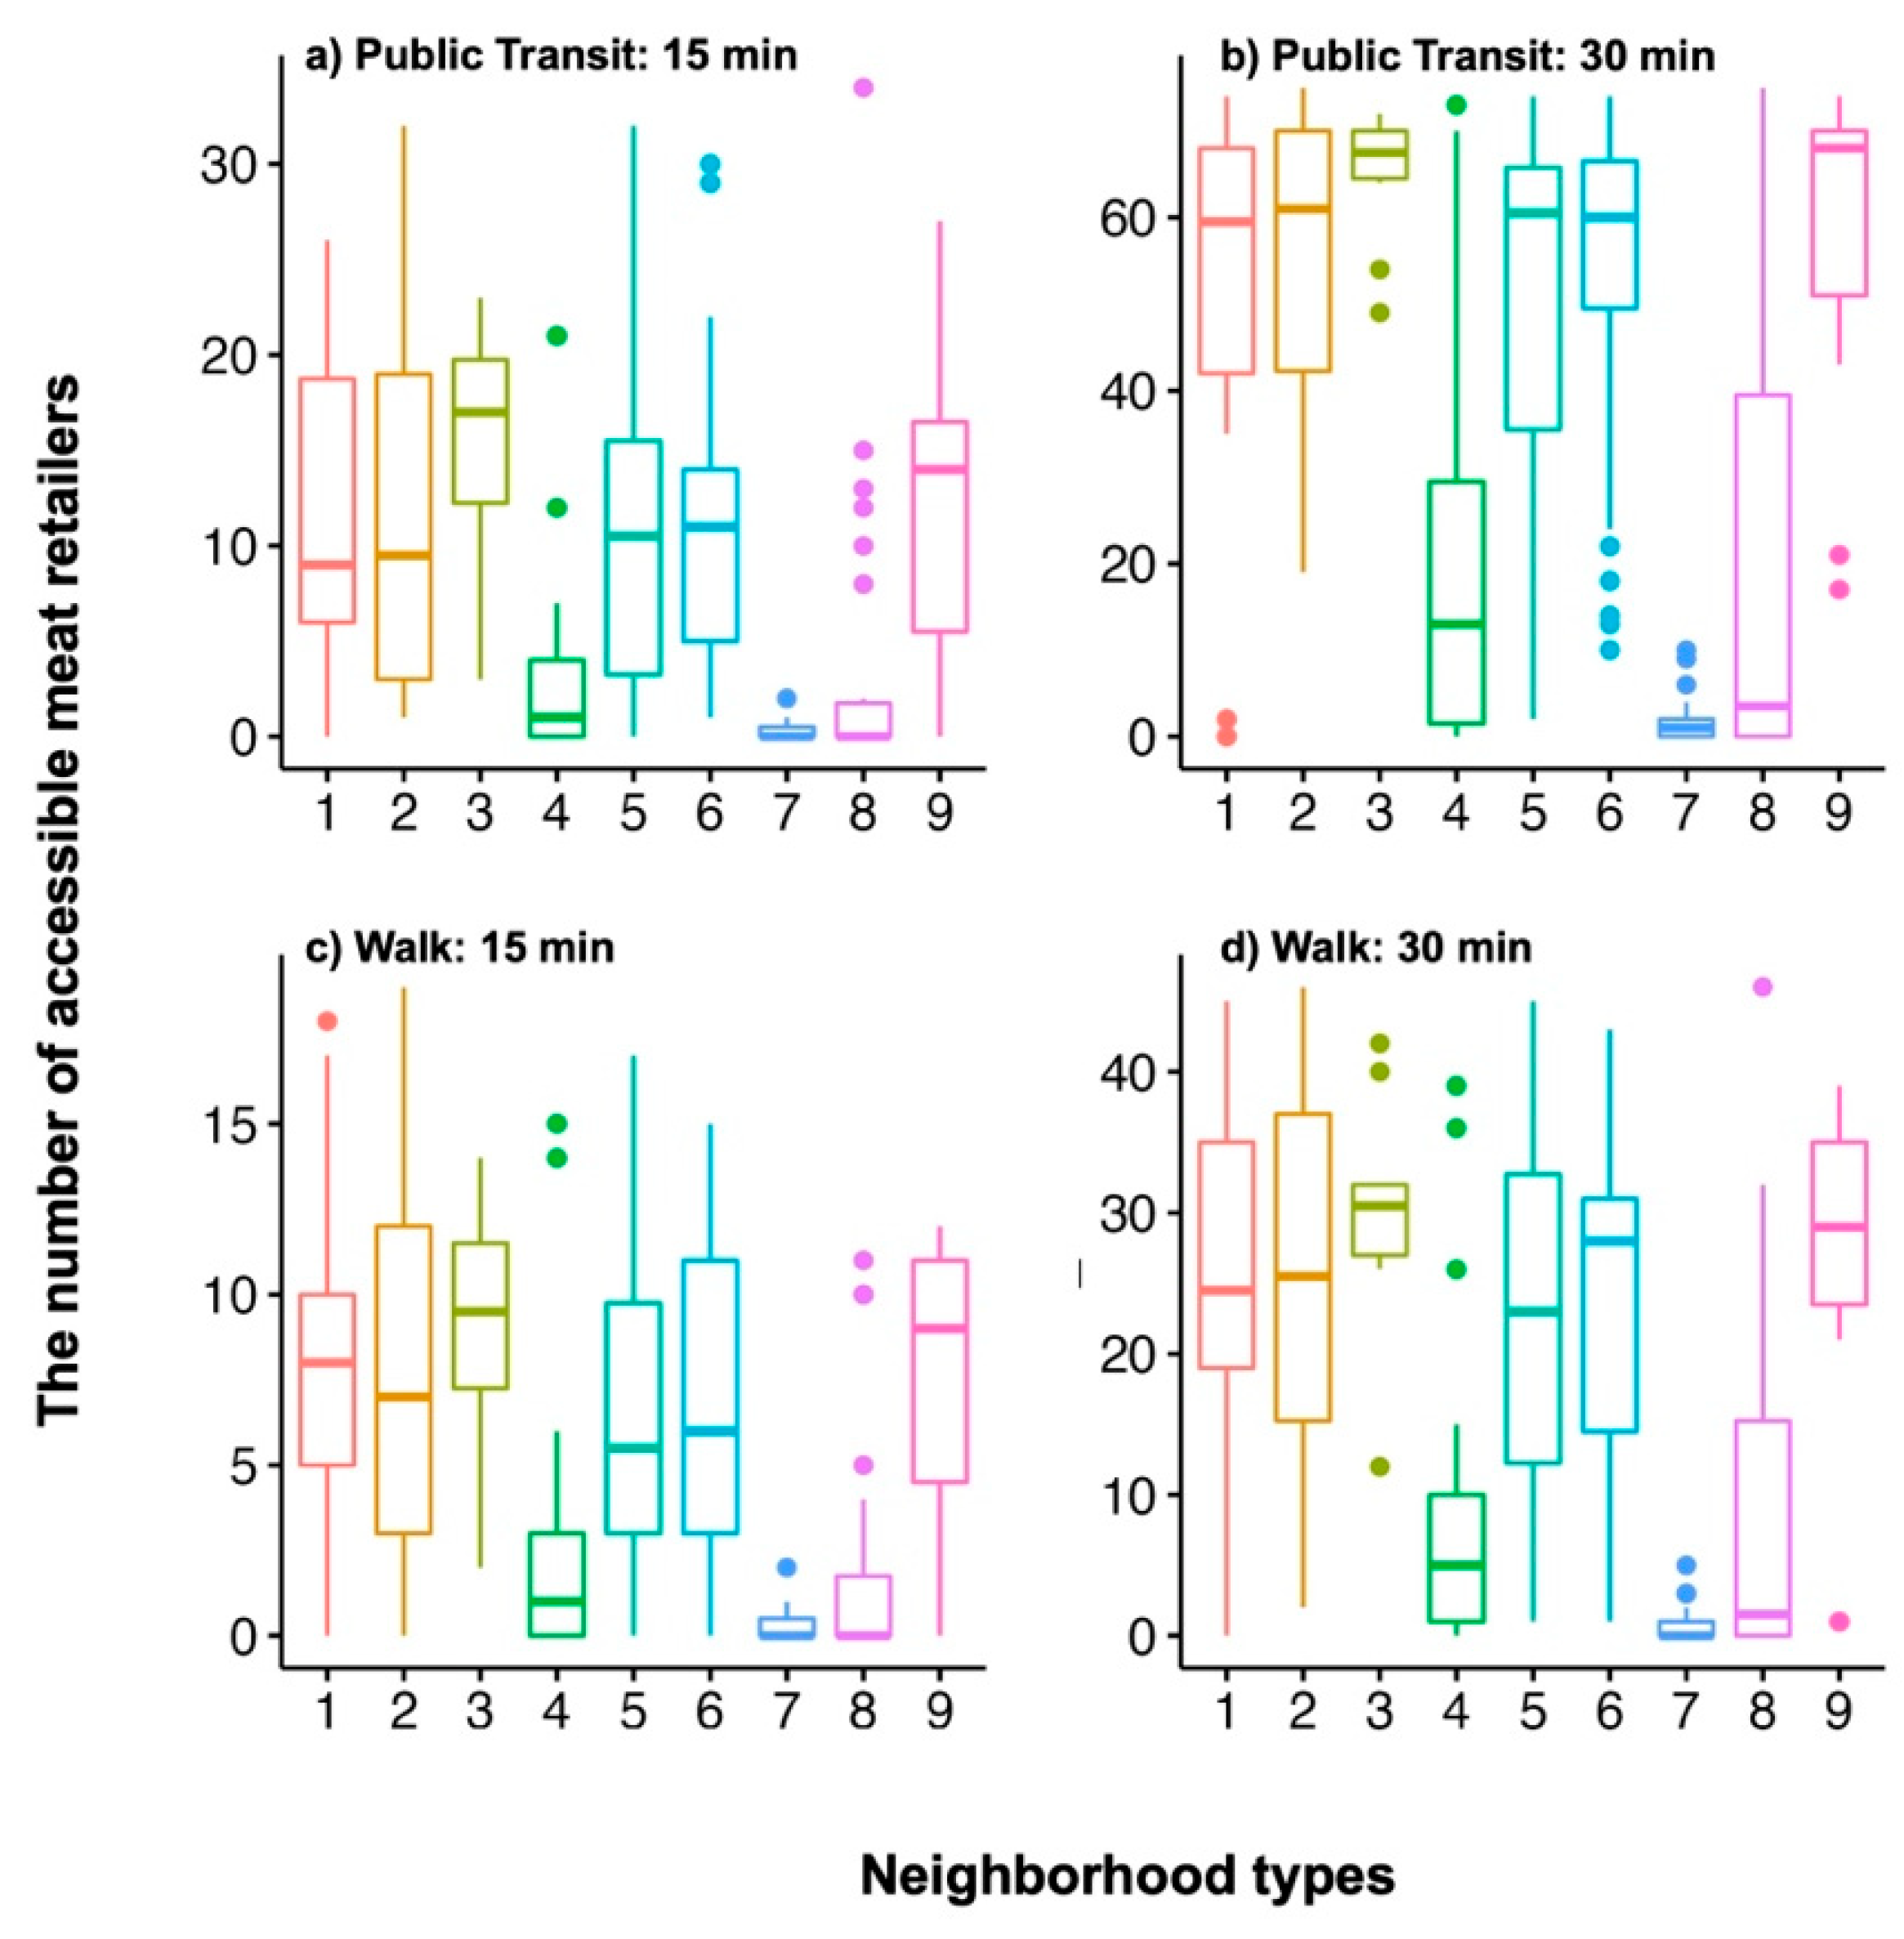
6.1.3. Meat Accessibility

Figure 9 visualizes the geographic patterns of the meat accessibility of neighborhoods within the study area. Similar to rice and grocery accessibility patterns, the Japanese-dominant neighborhoods located in the east and south parts of colonial Seoul had relatively high meat accessibility, compared to the rest of the communities in the city. Figure 10 corroborates these findings. The mean accessibility index by neighborhood type in the box plot presents the Japanese-dominant neighborhoods (Types 1–3) as tending to have had relatively high mean accessibility to meat, compared to the Korean-dominant neighborhoods (Types 7–9). The extreme case of Korean-dominant neighborhood Type 7 provides hard evidence of Korean neighborhoods’ meat accessibility poverty. The average meat accessibility (0.3) of Type 7 Korean-dominant neighborhoods, with 15-min public transit travel is less than one. As shown in Figure 10, 15-min and 30-min walking accessibility to meat was also close to zero. This suggests that even Korean neighborhoods with decent purchasing power (Type 7) were not able to easily access meat, which is a major source of protein.

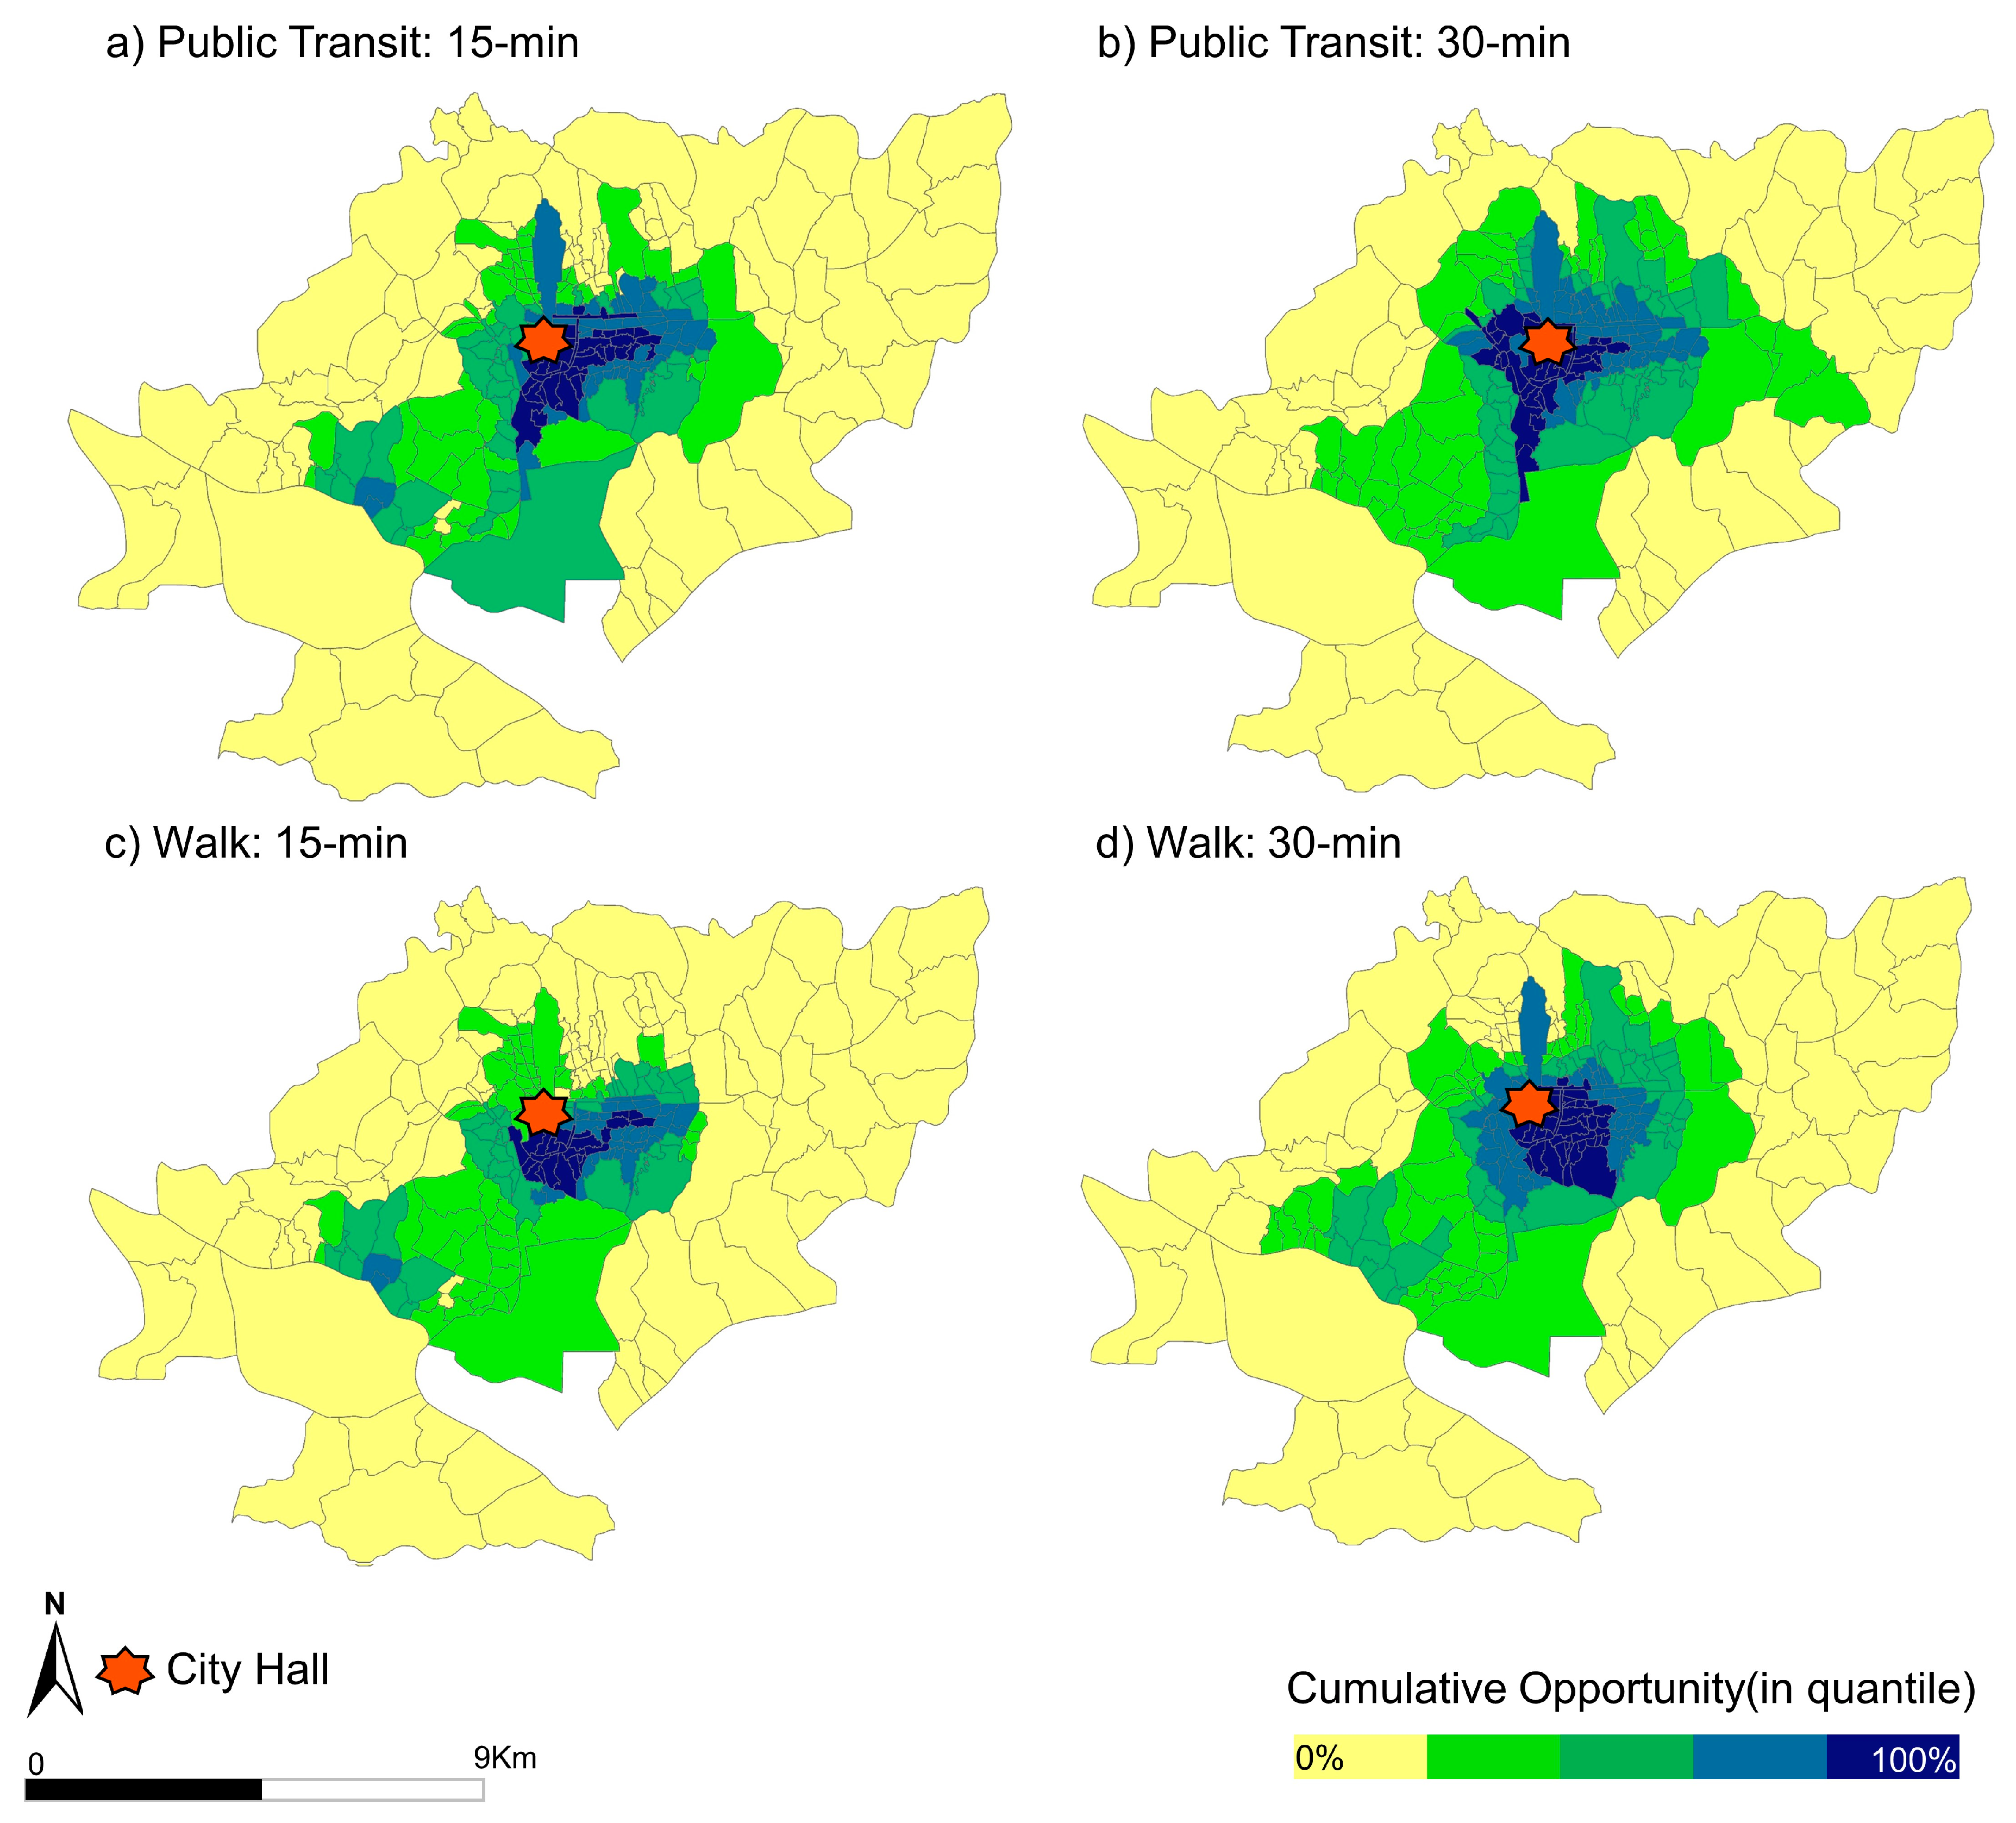
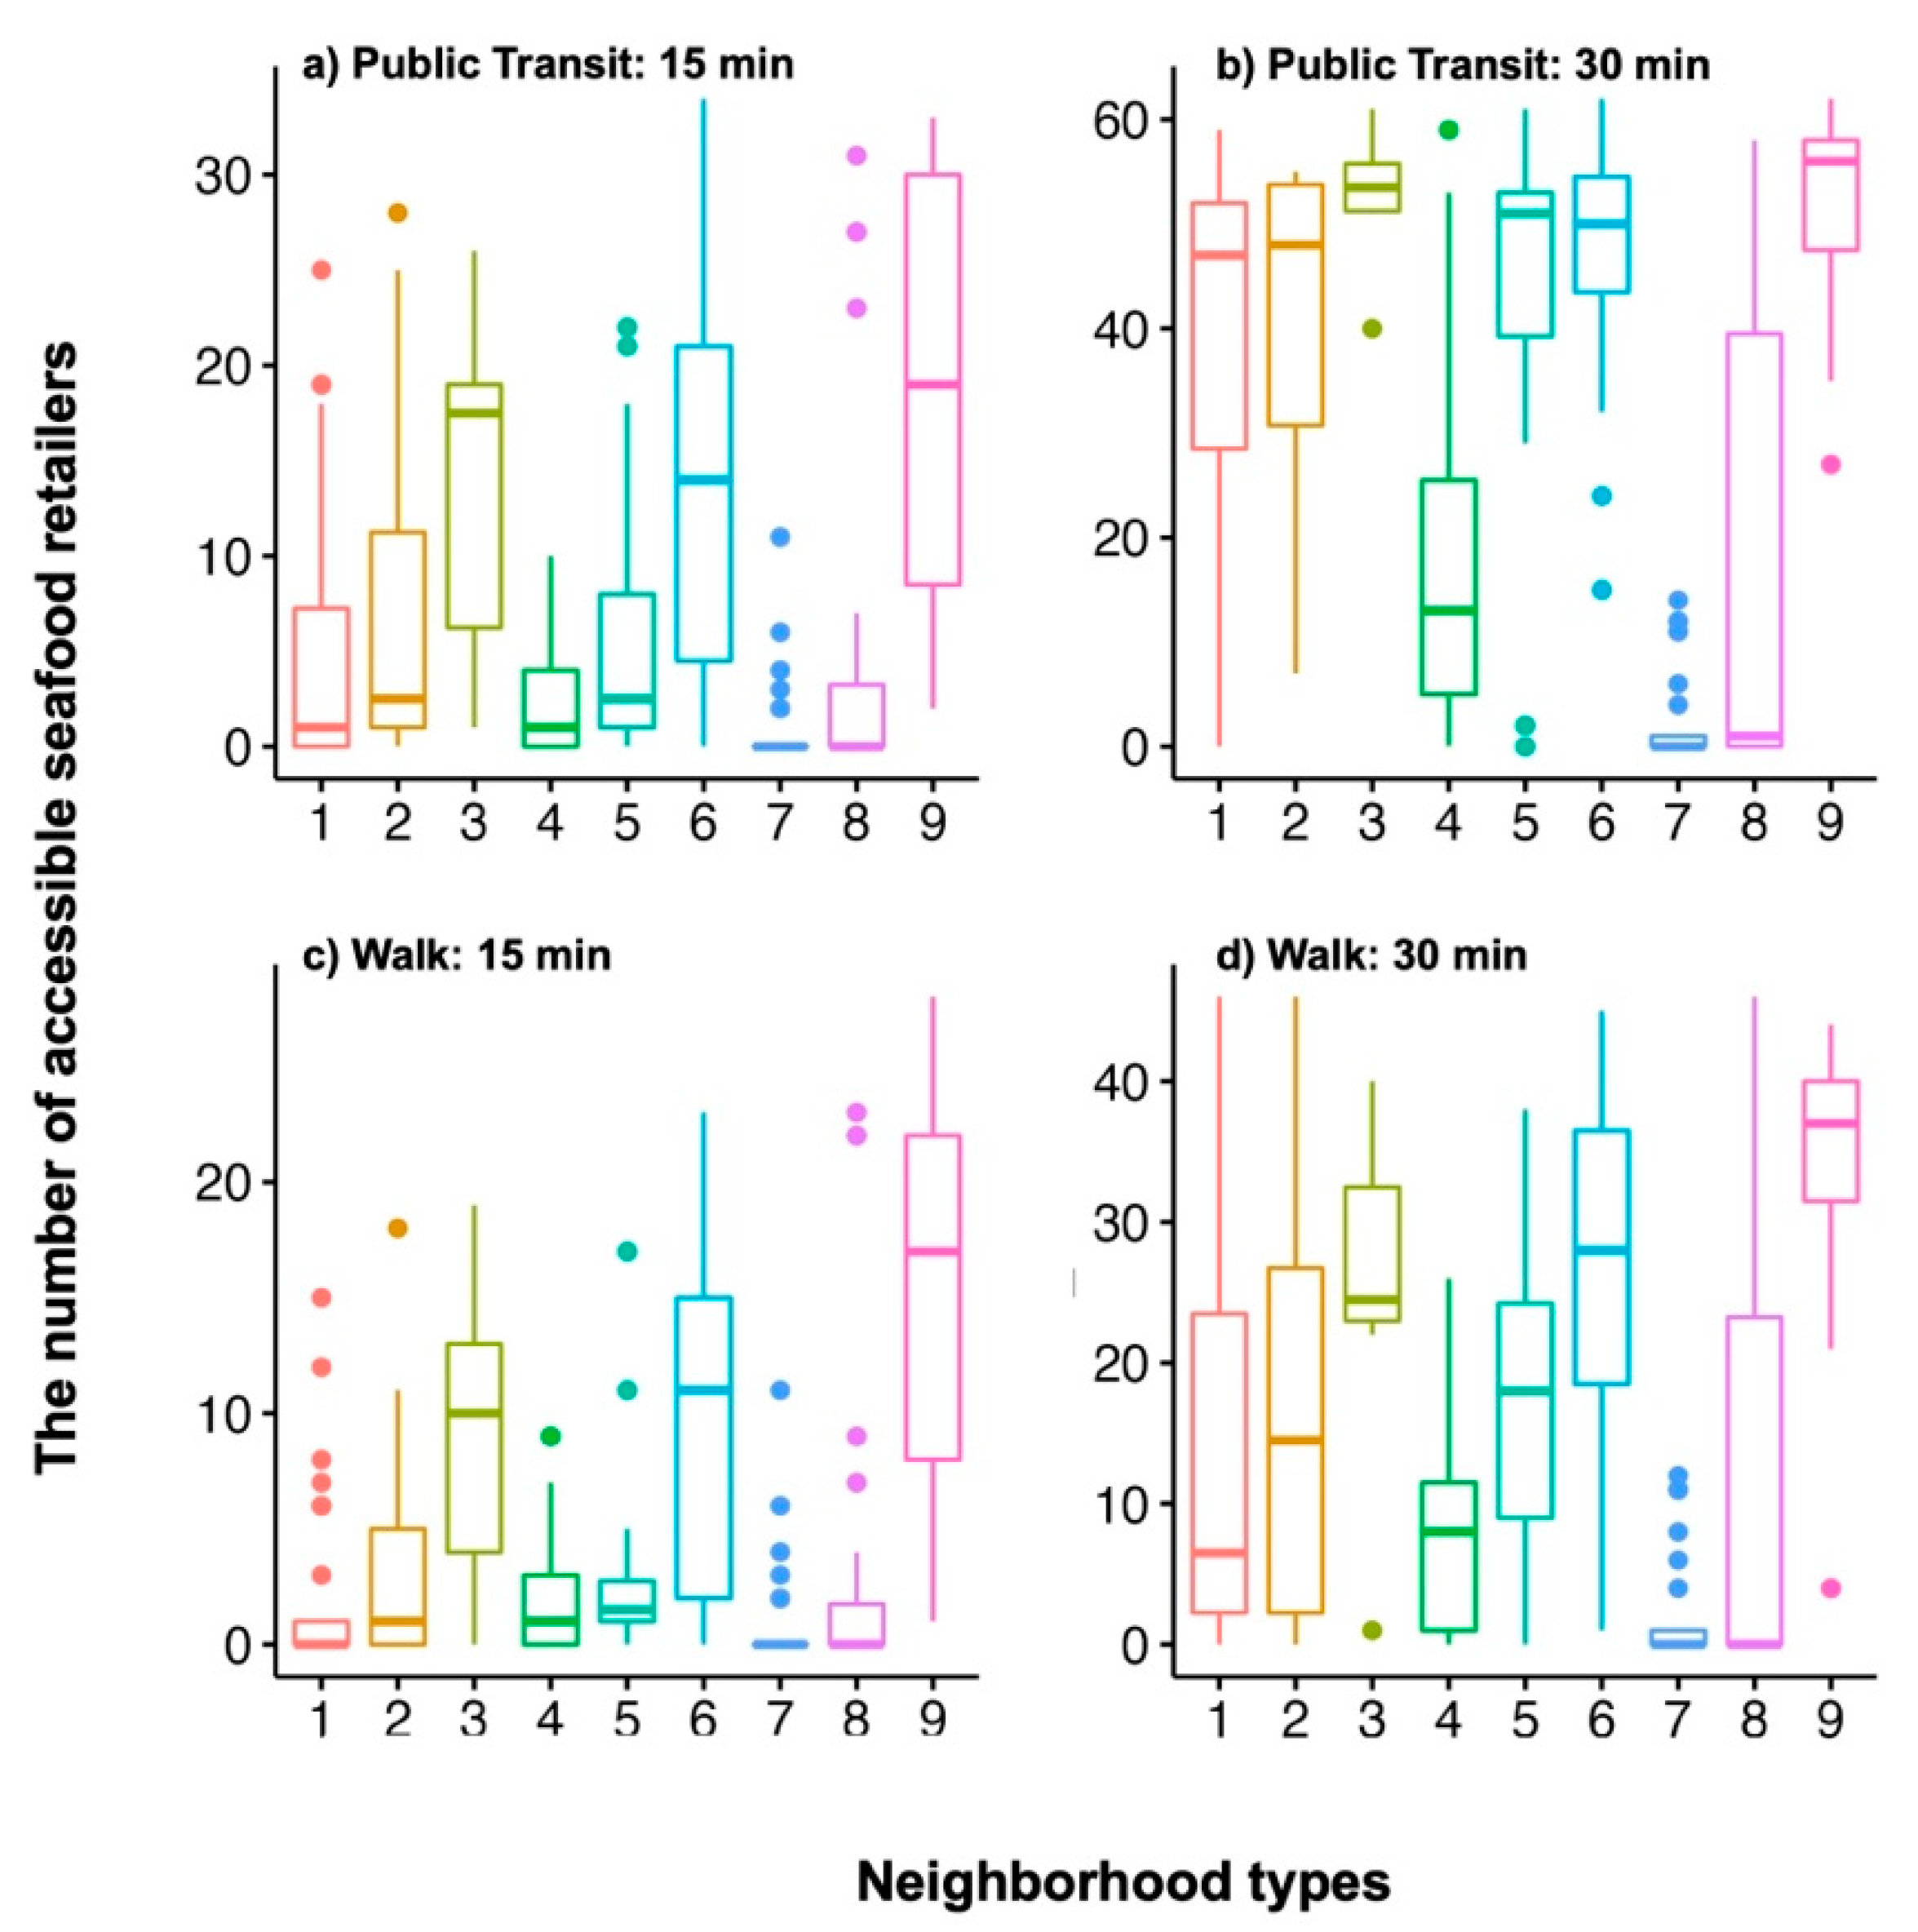
6.1.4. Seafood Accessibility

Figure 11 displays the geographic pattern of food accessibility at the Dong (neighborhood) level in 1930s colonial Seoul. Seafood accessibility patterns are the most effective example for showing the advantages of Japanese-dominant neighborhoods in accessing food resources in the city. In Figure 11, note that the dark blue areas with higher accessibility to seafood retailers mostly match the locations of the Japanese-dominant enclaves (neighborhood Types 1–3). A partial reason for this could be Japanese people’s long history of high seafood consumption (e.g., sushi and sashimi). The preferences [64] might have attracted many Japanese people to the locations in close proximity to seafood businesses in colonial Seoul. Figure 12 confirms the accessibility mapping results. When we focused on the walking accessibility results, in particular, the box plot shows that the average accessibility gaps between the Japanese-dominant vs. Korean-dominant neighborhoods widen in an exponential manner as the travel time threshold increases from 15 min to 30 min.

6.1.5. Produce (Vegetable and Fruit) Accessibility

Figure 13 and Figure 14 report the analysis results of produce (vegetable and fruit) accessibility. Echoing the accessibility results of other food types, the spatial patterns of produce accessibility, with a 15-min time budget by both public transit (Figure 13a) and walking (Figure 13c), illustrate that Japanese-dominant neighborhoods (Types 1–3) had significant advantages in produce accessibility over Korean-dominant neighborhoods (Types 7–9). In particular, the peripheral areas of colonial Seoul, where a decent portion of Korean-dominant neighborhoods were located, showed the lowest accessibility level based on the five-quantile classification scheme. The average accessibility in the box plot (Figure 14) presents that the average produce accessibility of Korean-dominant Type 7 neighborhoods was even close to zero.

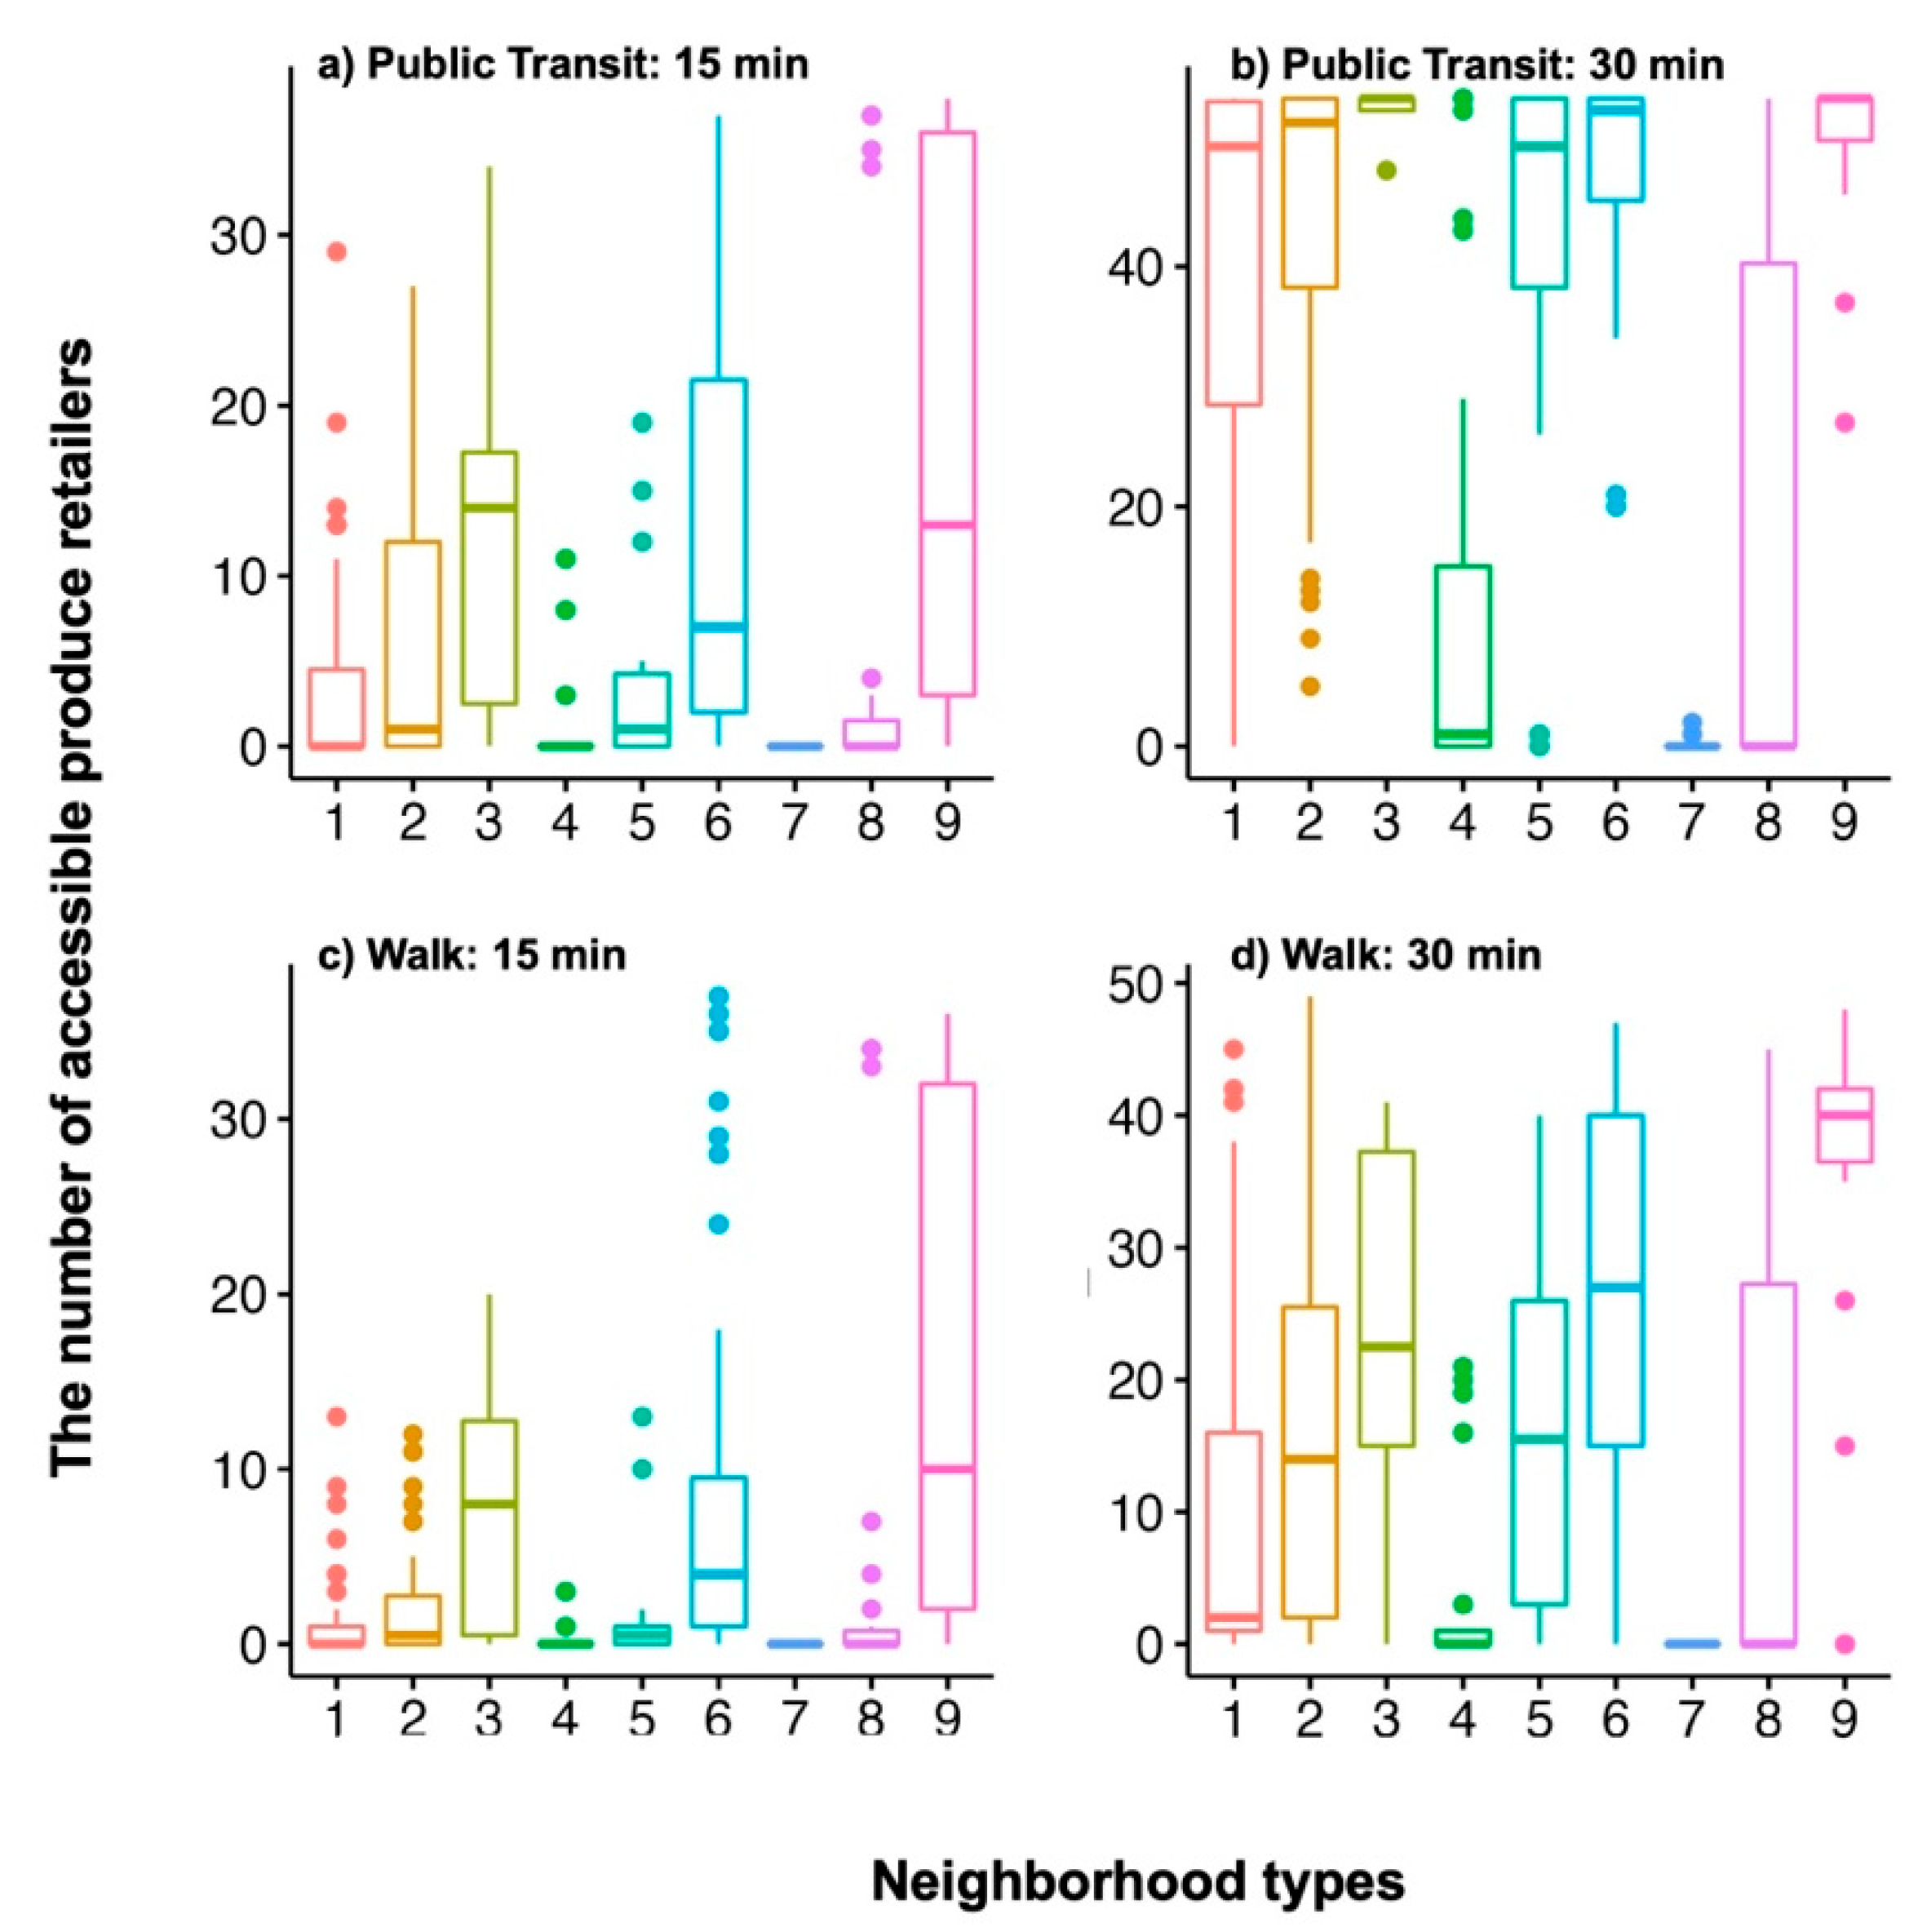
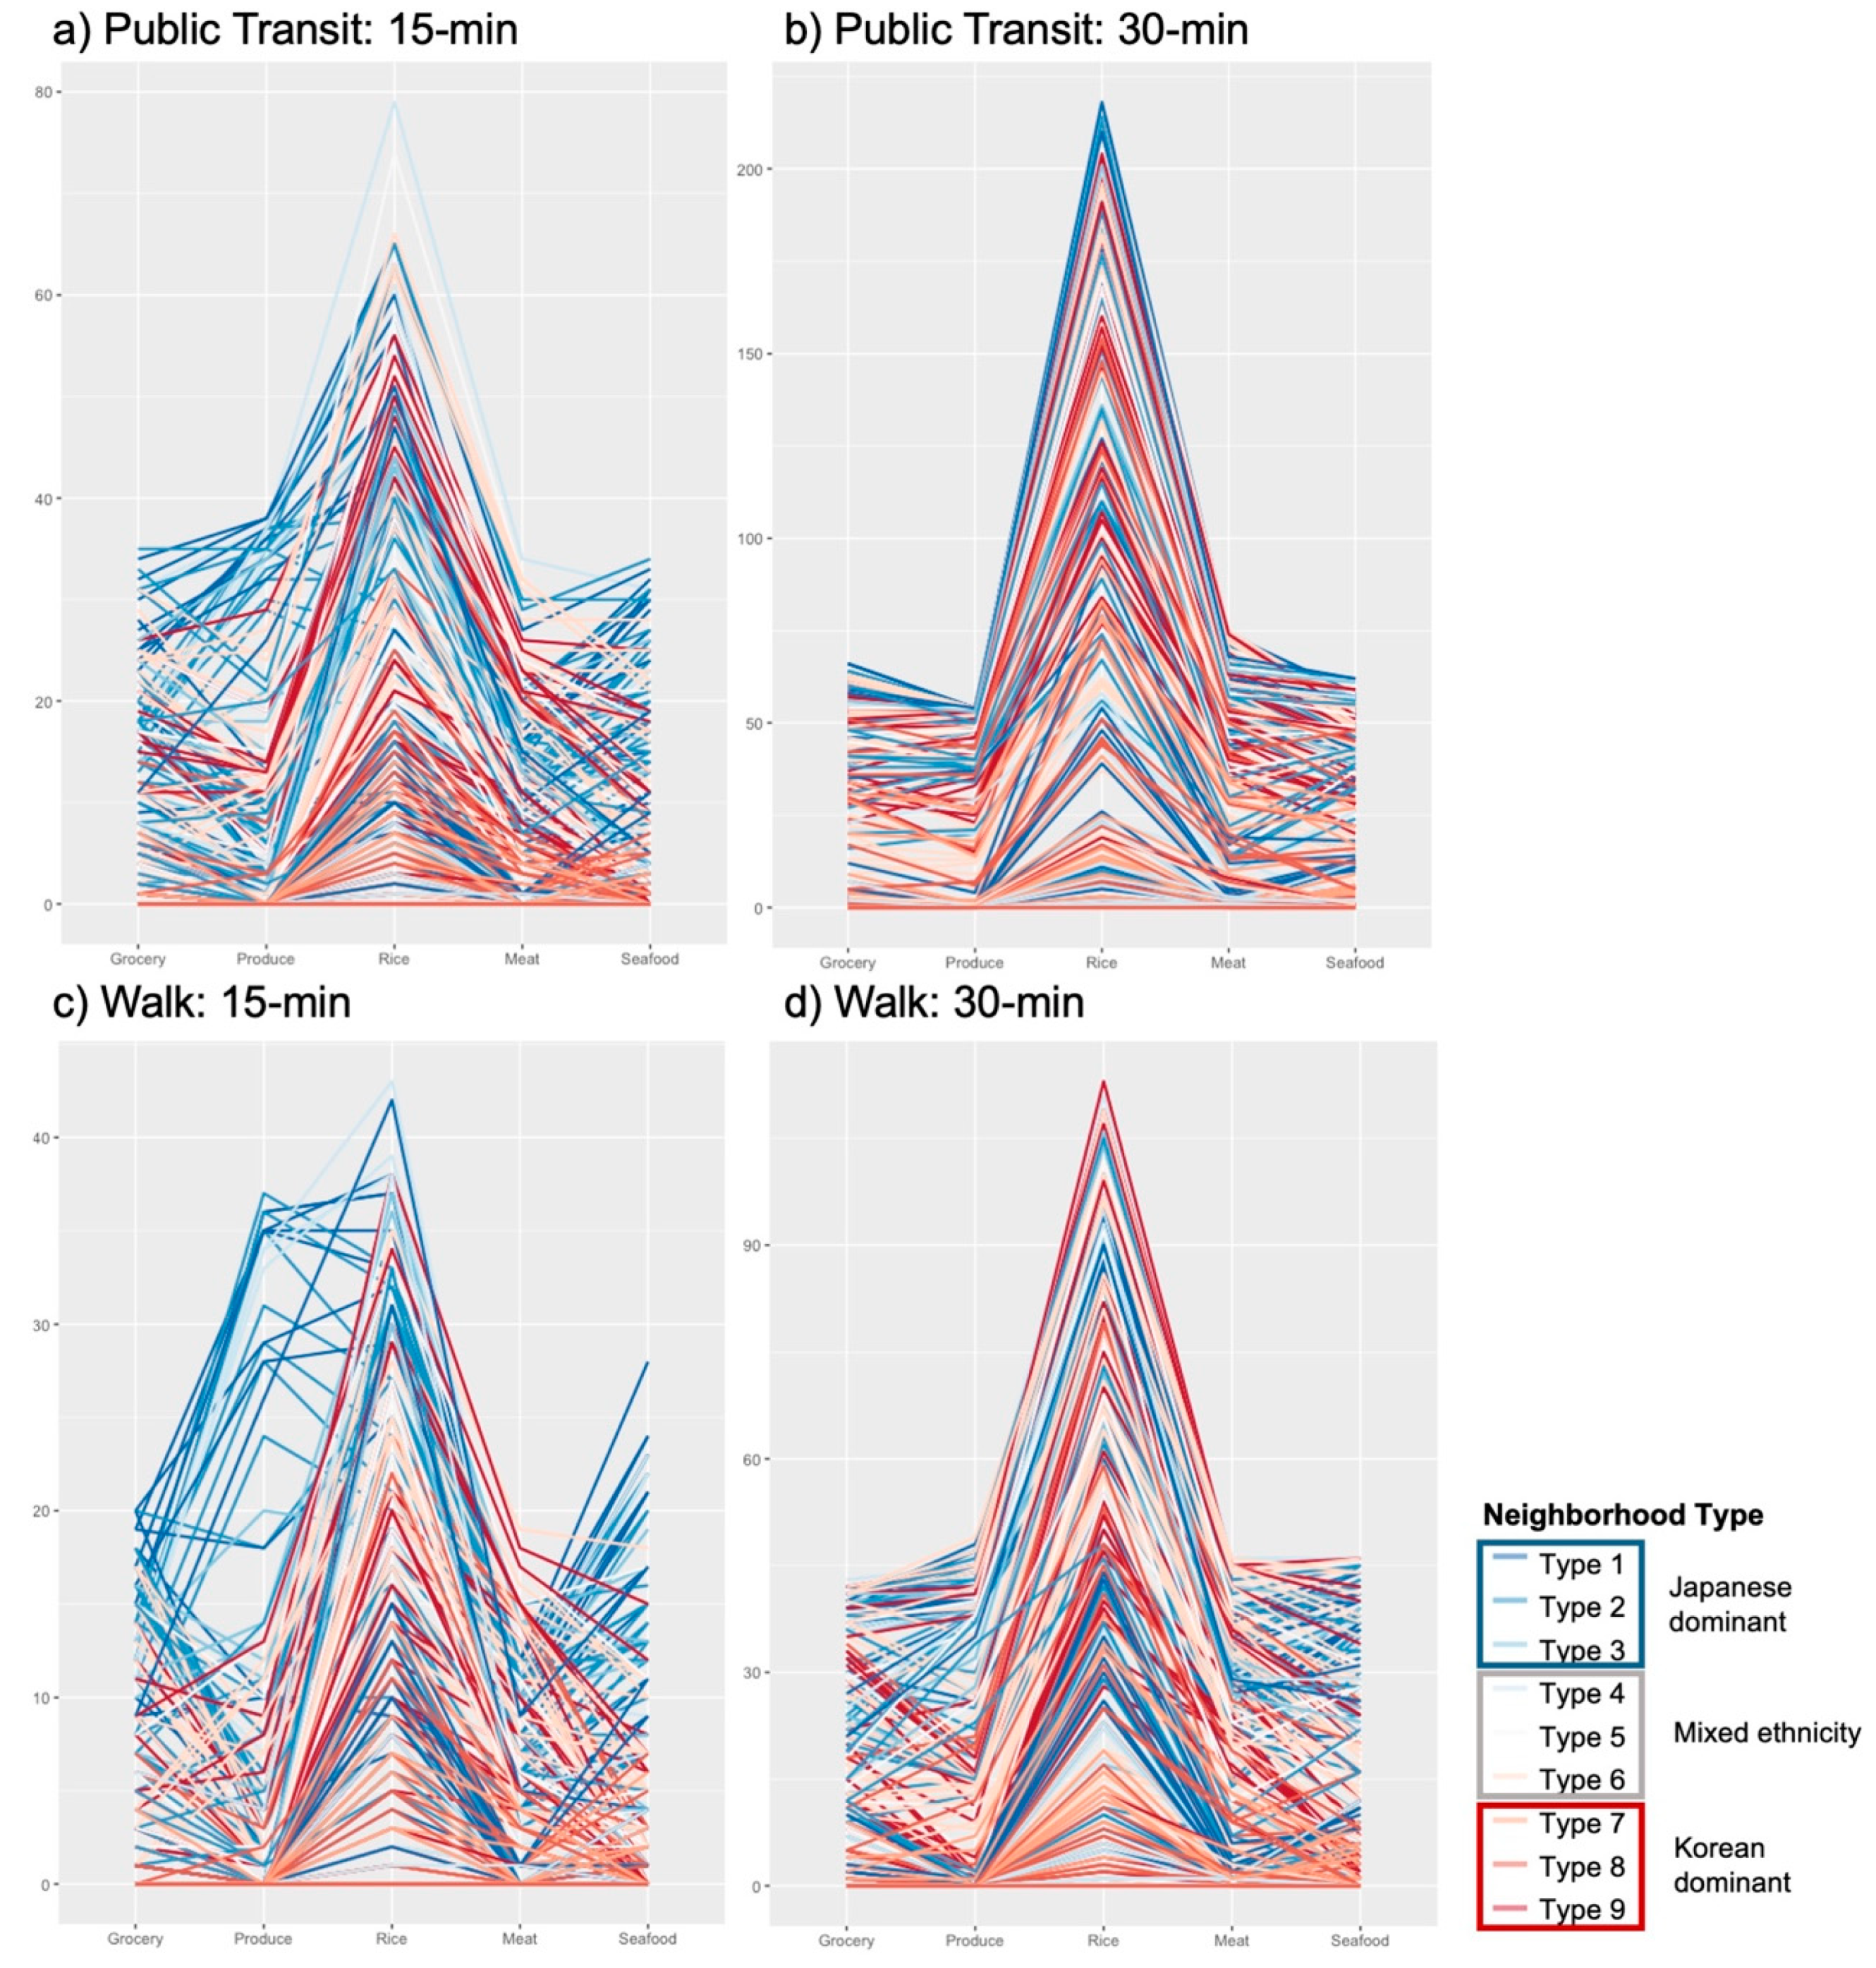
6.2. Inequalities in Food Accessibility across Different Neighborhood Types

In order to quantify and confirm the disparities and inequalities we saw from the food accessibility maps and the mean accessibility values by neighborhood type in the previous section, Section 6.1, we conducted a one-way ANOVA test to examine whether there were statistically significant differences between the averages of food accessibility across nine different types of neighborhood.
We found a statistically significant difference between the nine types of neighborhoods for food accessibility by food type (i.e., as the one-way ANOVA resulted in [p-value < 0.001]). The subsequent post-hoc analysis found that the Japanese-dominant neighborhoods (Type 1) had a higher mean of accessibility via public transit than the Korean-dominant neighborhoods (Types 7 and 8) for all types of food retailers (see tables in Appendix A). On the contrary, Type 1 did not show statistically significant better accessibility to five distinctive food types than the Korean-dominant Type 9 neighborhoods (higher unemployment rate). Meanwhile, the Japanese-dominant neighborhoods (Types 1, 2, and 3) generally showed statistical significance in greater food accessibility via walking than the Korean-dominant neighborhood types (Types 7, 8, and 9).
Figure 15 displays parallel plots of food accessibility for 254 neighborhoods (Dongs) in colonial Seoul, which are colored by the nine neighborhood types. Figure 15a,b, which show food accessibility by public transit, presents that the Japanese-dominant neighborhoods (lines with blue colors) were placed in the higher section of the plot regardless of the food types. Conversely, Korean-dominant Type 7 neighborhoods (lines with light red colors) were located at the lowest section of the plot. Similar to the results of the food accessibility via public transit, most Japanese-dominant neighborhoods had greater food accessibility than other neighborhoods via walking (Figure 15c,d). Remarkably, some Japanese-dominant neighborhoods with a reasonable economic situation (lines with darker blue colors) had significantly better 15-min and 30-min accessibility to produce, rice, and seafood by both public transit and walking than others. The accessibility results of particular food types corresponded to the diet of the Japanese people, who preferred to consume rice, produce, and seafood. Figure 15 enables us to produce the narrative that the Korean-dominant neighborhoods were suffering more, irrespective of modes, from poor food accessibility than neighborhoods dominated by the colonial ruling class—the Japanese—in the 1930s.

7. Conclusions and Discussion

Our findings conclude that the Japanese-dominant neighborhoods generally had greater accessibility by both public transit and walking than the Korean-dominant neighborhoods. Remarkably, the Japanese-dominant neighborhoods had significant advantages in accessing five food types. Nevertheless, we compared the food accessibility to the share of the unemployment rate of Japanese-dominant neighborhoods. On the contrary, the Korean-dominant neighborhoods had a wide discrepancy in food accessibility by the type of neighborhood. We found that the Korean-dominant neighborhoods with a reasonable economic condition (Type 7) showed the worst food accessibility. Conversely, Korean-dominant Type 9 neighborhoods, which had a higher unemployment rate, commonly had better accessibility than Type 7. These empirical results clearly demonstrate ironical phenomena: residents who could afford various food items experienced more limited food accessibility than the people who did not have good purchasing power. This mismatch between the food accessibility and economic conditions of neighborhoods is not only an issue from the distant past, but also in the context of modern society. For example, Helbich [29] finds that socially distressed neighborhoods have better food accessibility than wealthy neighborhoods in Amsterdam, the Netherlands. Future studies should consider the mismatch problems and the costs of food items to discover more in-depth narratives of food accessibility.
These findings suggest that during the Japanese colonial period, Koreans, as a ruled class, suffered not only from social and structural discrimination from the Japanese but may also have experienced spatial barriers in accessibility to food retailers. Disparity in food accessibility may have come from the spatially divided residential areas in colonial Seoul that were crafted by the Japanese from the early 20th century. Our findings claim that spatial barriers in colonial Seoul may have generated invisible daily discrimination toward Koreans that negatively impacted Koreans’ quality of life during the colonial period. These results will be supportive to further studies that aim to testify to the daily discriminations that played a role in widening the disparities between Koreans and Japanese in the early 20th century.
To better understand the results, we referred to the previous urban plans of colonial Seoul announced by the Japanese empire. In the mid-1920s, the Japanese government was preparing to expand the administrative boundary of the major large cities in Japan, including colonial Seoul, to resolve the vicious urban problems that were accelerated by the growth of populations. Hence, the administrative boundary of colonial Seoul had been stretched to the rural areas, meaning that a larger share of Koreans worked in the farming industry (Figure 16). The Japanese government had made the follow-up urban plans to fill the gaps in opportunities (e.g., jobs, housing, public transit, etc.) between the areas within the older administrative boundary and the newly incorporated areas. Unfortunately, the government could not proceed with the plans while the Japanese government was involved in multiple wars, such as the Sino–Japanese war, from 1937 to the defeat of Japanese imperialism in 1945. Therefore, the newly incorporated areas, in which Koreans comprised the majority of the residents, had not taken the opportunity to access various urban amenities, including the food outlets spatially concentrated within the older administrative boundary. These historical contexts denote that food accessibility, which was mainly regarded as an issue associated with transit availability [5,16], will be studied in discovering the relationship with urban and spatial plans.
Although this is the very first study to empirically conduct an analysis of food accessibility in colonial Seoul in 1936, there were three main limitations that should be considered for further studies. First, we could not report the food accessibility by each individual level considering ethnicity and economic status because of data availability. Second, what is known about the access to food retailers in colonial Seoul could not be used to draw a comprehensive picture to capture changes in food accessibility through a longitudinal analysis. The limits of the data acquisition of time-series data on the socio-demographic features of a neighborhood and the locations of food outlets hindered us in conducting a longitudinal analysis. Third, this paper only focused on store-type food retailers; therefore, we could not examine accessibility to informal food retailers such as street vendors [65].
Despite these limitations, our study makes many contributions to the literature on the disparities in food accessibility. This is the very first paper examining the food accessibility landscape in a distant past setting. Given the growth of narratives in food desert studies, our study shows that inequitable food accessibility is not just a notable problem in modern society but is a phenomenon with a long history, detectable in 1930s colonial Seoul through the interdisciplinary approach of synthesizing digital humanities and high-resolution accessibility analysis.

Author Contributions

Conceptualization, H.J.H., J.L., J.K. and Y.K.; methodology, H.J.H., J.L., J.K. and Y.K.; validation, H.J.H., J.L., J.K. and Y.K.; formal analysis, H.J.H., J.L., J.K. and Y.K.; investigation, H.J.H., J.L., J.K. and Y.K.; data curation, Y.K.; writing—original draft preparation, H.J.H.; writing—review and editing, J.L., J.K. and Y.K.; visualization, H.J.H.; project administration, J.L.; funding acquisition, J.L. All authors have read and agreed to the published version of the manuscript.

Funding

This research was supported by Western CIHR Success Seed Grant (0000050542) and SSHRC Success Seed Grant (0000050444), at Western University.

Institutional Review Board Statement

Not applicable.

Informed Consent Statement

Not applicable.

Data Availability Statement

Datasets and materials used in this study are available upon request to the authors.

Conflicts of Interest

The authors declare no conflict of interest.

Appendix A

Table A1. Post-hoc analysis results of rice accessibility by neighborhood type.
Neighborhood
Type
123456789
1 12.602−16.821108.887 ***20.69021.275158.160 ***96.949 ***30.020
(4.140)(−0.400)(14.692 ***)(6.944)(7.848)(21.226 ***)(13.741 ***)(8.500)
2 −29.42396.284 ***8.0888.672145.557 ***84.347 ***17.418
(−4.540)(10.553 **)(2.805)(3.708)(17.086 ***)(9.601 **)(4.360)
3 125.708 ***37.51138.096174.981 ***113.770 ***46.841
(15.092 **)(7.344)(8.248)(21.626 ***)(14.141 *)(8.900)
4 −88.197 **−87.612 ***49.273−11.937−78.867 **
(−7.748)(−6.844)(6.533)(−0.952)(−6.192)
5 0.584137.470 ***76.259 *9.330
(0.903)(14.281 ***)(6.796)(1.556)
6 136.885 ***75.675 ***8.746
(13.378 ***)(5.893)(0.652)
7 −61.210 *−128.139 ***
(−7.485)(−12.726 ***)
8 −66.929 *
(−5.241)
9
Note: the numbers inside the parentheses denote the result of accessibility by walking. *** Significant at 1%. ** Significant at 5%. * Significant at 10%.
Table A2. Post-hoc analysis results of grocery accessibility by neighborhood type.
Neighborhood
Type
123456789
1 4.269−1.58436.623 ***10.64910.81654.509 ***39.389 ***13.404
(3.043)(3.568)(9.830 ***)(8.924 ***)(7.325 ***)(12.272 ***)(11.480 ***)(8.721 ***)
2 −5.85332.354 ***6.3806.54750.240 ***35.121 ***9.135
(0.525)(6.787 ***)(5.881 **)(4.282 **)(9.229 ***)(8.437 ***)(5.679 ***)
3 38.208 ***12.23312.40056.094 ***40.974 ***14.988
(6.262 *)(5.356)(3.757)(8.703 ***)(7.911 ***)(5.153)
4 −25.974 **−25.808 ***17.8862.766−23.219 **
(−0.906)(−2.505)(2.442)(1.650)(−1.109)
5 0.16743.860 ***28.741 **2.755
(−1.599)(3.348)(2.556)(−0.203)
6 43.694 ***28.574 ***2.588
(4.947 ***)(4.155 *)(1.396)
7 −15.119−41.105 ***
(−0.792)(−3.550)
8 −25.985 ***
(−2.758)
9
Note: the numbers inside the parentheses denote the result of accessibility by walking. *** Significant at 1%. ** Significant at 5%. * Significant at 10%.
Table A3. Post-hoc analysis results of meat accessibility by neighborhood type.
Neighborhood
Type
123456789
1 4.651−6.20039.577 ***9.2783.87057.387 ***38.370 ***6.441
(1.266)(−1.316)(5.530 **)(1.295)(0.206)(7.393 ***)(5.166 *)(−0.286)
2 −10.85134.926 ***4.627−0.78252.73633.719 ***1.790
(−2.581)(4.265 *)(0.028)(−1.060)(6.128 ***)(3.900)(−1.552)
3 45.777 ***15.47810.07063.587 ***44.570 ***12.641
(6.846 **)(2.611)(1.522)(8.710 ***)(6.481 *)(1.029)
4 −30.299 **−35.707 ***17.810−1.207−33.136 ***
(−4.235)(−5.324 ***)(1.864)(−0.365)(−5.817 ***)
5 −5.40848.109 ***29.093 *−2.837
(−1.089)(6.099 **)(3.870)(−1.582)
6 53.518 ***34.501 ***2.572
(7.188 ***)(4.960 **)(−0.492)
7 −19.017−50.946 ***
(−2.228)(−7.680 ***)
8 −31.930 ***
(−5.452 **)
9
Note: the numbers inside the parentheses denote the result of accessibility by walking. *** Significant at 1%. ** Significant at 5%. * Significant at 10%.
Table A4. Post-hoc analysis results of seafood accessibility by neighborhood type.
Neighborhood
Type
123456789
1 3.635−1.73733.532 ***7.59610.26348.876 ***32.300 ***11.851
(5.443 *)(6.111)(11.749 ***)(12.266 ***)(11.950 ***)(14.307 ***)(13.470 ***)(13.123 ***)
2 −5.37229.897 ***3.9616.62845.241 ***28.665 ***8.216
(0.667)(6.306 ***)(6.823 ***)(6.507 ***)(8.864 ***)(8.027 ***)(7.679 ***)
3 35.269 ***9.33312.00050.613 ***34.037 ***13.588
(5.639)(6.156)(5.839)(8.197 **)(7.359 *)(7.012 *)
4 −25.936 **23.269 ***15.344−1.232−21.681 **
(0.517)(0.201)(2.558)(1.721)(1.373)
5 2.66741.280 ***24.704 **4.255
(−0.316)(2.041)(1.204)(0.856)
6 38.613 ***22.037 ***1.588
(2.358)(1.520)(1.173)
7 −16.576−37.025 ***
(−0.838)(−1.185)
8 −20.449 **
(−0.347)
9
Note: the numbers inside the parentheses denote the result of accessibility by walking. *** Significant at 1%. ** Significant at 5%. * Significant at 10%.
Table A5. Post-hoc analysis results of produce accessibility by neighborhood type.
Neighborhood
Type
123456789
1 1.996−2.73234.176 ***8.2027.84750.239 ***37.665 ***9.900
(7.920 **)(8.616)(11.893 ***)(14.594 ***)(14.033 ***)(16.316 ***)(16.168 ***)(14.669 ***)
2 −4.73032.180 ***6.2055.85048.243 ***35.668 ***7.902
(0.695)(3.972)(6.673)(6.113 **)(8.395 ***)(8.247 ***)(6.748 **)
3 36.910 ***10.93310.57852.971 ***40.396 ***12.629
(3.277)(5.978)(5.417)(7.700)(7.552)(6.053)
4 −25.974 **−26.329 ***16.0633.489−24.278 ***
(2.701)(2.140)(4.423)(4.275)(2.776)
5 −0.35542.038 ***29.463 ***1.696
(−0.560)(1.722)(1.574)(0.075)
6 42.393 ***29.818 ***2.051
(2.283)(2.134)(0.636)
7 −12.575−40.342 ***
(−0.148)(−1.647)
8 −27.767 ***
(−1.499)
9
Note: the numbers inside the parentheses denote the result of accessibility by walking. *** Significant at 1%. ** Significant at 5%.

References

  1. Bader, M.D.M.; Purciel, M.; Yousefzadeh, P.; Neckerman, K.M. Disparities in Neighborhood Food Environments: Implications of Measurement Strategies. Econ. Geogr. 2010, 86, 409–430. [Google Scholar] [CrossRef] [PubMed]
  2. Cannuscio, C.C.; Weiss, E.E.; Asch, D.A. The Contribution of Urban Foodways to Health Disparities. J. Urban Health 2010, 87, 381–393. [Google Scholar] [CrossRef] [PubMed]
  3. Eisenhauer, E. In Poor Health: Supermarket Redlining and Urban Nutrition. GeoJournal 2001, 53, 125–133. [Google Scholar] [CrossRef]
  4. Gordon, C.; Purciel-Hill, M.; Ghai, N.R.; Kaufman, L.; Graham, R.; van Wye, G. Measuring Food Deserts in New York City’s Low-Income Neighborhoods. Health Place 2011, 17, 696–700. [Google Scholar] [CrossRef]
  5. Widener, M.J. Comparing Measures of Accessibility to Urban Supermarkets for Transit and Auto Users. Prof. Geogr. 2017, 69, 362–371. [Google Scholar] [CrossRef]
  6. Day, P.L.; Pearce, J. Obesity-Promoting Food Environments and the Spatial Clustering of Food Outlets around Schools. Am. J. Prev. Med. 2011, 40, 113–121. [Google Scholar] [CrossRef]
  7. Gucciardi, E.; Vahabi, M.; Norris, N.; Paul, J.; Monte, D.; Farnum, C. The Intersection between Food Insecurity and Diabetes. Curr. Nutr. Rep. 2014, 3, 324–332. [Google Scholar] [CrossRef] [PubMed]
  8. Hipp, J.A.; Chalise, N. Spatial Analysis and Correlates of County-Level Diabetes Prevalence, 2009–2010. Prev. Chronic Dis. 2015, 12, 140404. [Google Scholar] [CrossRef]
  9. Liese, A.D.; Lamichhane, A.P.; Garzia, S.C.A.; Puett, R.C.; Porter, D.E.; Dabelea, D.; D’Agostino, R.B.; Standiford, D.; Liu, L. Neighborhood Characteristics, Food Deserts, Rurality, and Type 2 Diabetes in Youth: Findings from a Case-Control Study. Health Place 2018, 50, 81–88. [Google Scholar] [CrossRef]
  10. Pike, S.N.; Trapl, E.S.; Clark, J.K.; Rouse, C.D.; Bell, B.A.; Sehgal, A.R.; To, T.; Borawski, E.; Freedman, D.A. Examining the Food Retail Choice Context in Urban Food Deserts, Ohio, 2015. Prev. Chronic Dis. 2017, 14, 160408. [Google Scholar] [CrossRef] [Green Version]
  11. Shannon, J. Food Deserts: Governing Obesity in the Neoliberal City. Prog. Hum. Geogr. 2014, 38, 248–266. [Google Scholar] [CrossRef]
  12. Slater, J.; Epp-Koop, S.; Jakilazek, M.; Green, C. Food Deserts in Winnipeg, Canada: A Novel Method for Measuring a Complex and Contested Construct. Health Promot. Chronic Dis. Prev. Can. 2017, 37, 350–356. [Google Scholar] [CrossRef] [PubMed]
  13. Cooksey-Stowers, K.; Schwartz, M.B.; Brownell, K.D. Food Swamps Predict Obesity Rates Better than Food Deserts in the United States. Int. J. Environ. Res. Public Health 2017, 14, 1366. [Google Scholar] [CrossRef] [PubMed]
  14. Widener, M.J.; Shannon, J. When Are Food Deserts? Integrating Time into Research on Food Accessibility. Health Place 2014, 30, 1–3. [Google Scholar] [CrossRef] [PubMed]
  15. Food Access Research Atlas: Documentation 2014. Available online: https://www.ers.usda.gov/data-products/food-access-research-atlas/ (accessed on 1 August 2022).
  16. Farber, S.; Morang, M.Z.; Widener, M.J. Temporal Variability in Transit-Based Accessibility to Supermarkets. Appl. Geogr. 2014, 53, 149–159. [Google Scholar] [CrossRef]
  17. Ghosh-Dastidar, M.; Hunter, G.; Collins, R.L.; Zenk, S.N.; Cummins, S.; Beckman, R.; Nugroho, A.K.; Sloan, J.C.; Wagner, L.; Dubowitz, T. Does Opening a Supermarket in a Food Desert Change the Food Environment? Health Place 2017, 46, 249–256. [Google Scholar] [CrossRef]
  18. Horner, M.W.; Wood, B.S. Capturing Individuals’ Food Environments Using Flexible Space-Time Accessibility Measures. Appl. Geogr. 2014, 51, 99–107. [Google Scholar] [CrossRef]
  19. Apparicio, P.; Cloutier, M.S.; Shearmur, R. The Case of Montréal’s Missing Food Deserts: Evaluation of Accessibility to Food Supermarkets. Int. J. Health Geogr. 2007, 6, 4. [Google Scholar] [CrossRef]
  20. Chen, X.; Yang, X. Does Food Environment Influence Food Choices? A Geographical Analysis through “Tweets”. Appl. Geogr. 2014, 51, 82–89. [Google Scholar] [CrossRef]
  21. Larsen, K.; Gilliland, J. Mapping the Evolution of “food Deserts” in a Canadian City: Supermarket Accessibility in London, Ontario, 1961–2005. Int. J. Health Geogr. 2008, 7, 16. [Google Scholar] [CrossRef] [Green Version]
  22. LeClair, M.S.; Aksan, A.M. Redefining the Food Desert: Combining GIS with Direct Observation to Measure Food Access. Agric. Hum. Values 2014, 31, 537–547. [Google Scholar] [CrossRef]
  23. LeDoux, T.F.; Vojnovic, I. Examining the Role between the Residential Neighborhood Food Environment and Diet among Low-Income Households in Detroit, Michigan. Appl. Geogr. 2014, 55, 9–18. [Google Scholar] [CrossRef]
  24. Widener, M.J.; Farber, S.; Neutens, T.; Horner, M. Spatiotemporal Accessibility to Supermarkets Using Public Transit: An Interaction Potential Approach in Cincinnati, Ohio. J. Transp. Geogr. 2015, 42, 72–83. [Google Scholar] [CrossRef]
  25. Zhang, M.; Ghosh, D. Spatial Supermarket Redlining and Neighborhood Vulnerability: A Case Study of Hartford, Connecticut. Trans. GIS 2016, 20, 79–100. [Google Scholar] [CrossRef] [PubMed]
  26. Raja, S.; Ma, C.; Yadav, P. Beyond Food Deserts: Measuring and Mapping Racial Disparities in Neighborhood Food Environments. J. Plan. Educ. Res. 2008, 27, 469–482. [Google Scholar] [CrossRef]
  27. Walks, A.; Hawes, E.; Simone, D. Gentrification in Large Canadian Cities: Tenure, Age, and Exclusionary Displacement 1991–2011. Urban Geogr. 2021, 42, 603–633. [Google Scholar] [CrossRef]
  28. Widener, M.J.; Farber, S.; Neutens, T.; Horner, M.W. Using Urban Commuting Data to Calculate a Spatiotemporal Accessibility Measure for Food Environment Studies. Health Place 2013, 21, 1–9. [Google Scholar] [CrossRef]
  29. Helbich, M.; Schadenberg, B.; Hagenauer, J.; Poelman, M. Food Deserts? Healthy Food Access in Amsterdam. Appl. Geogr. 2017, 83, 1–12. [Google Scholar] [CrossRef]
  30. Wrigley, N.; Warm, D.; Margetts, B. Deprivation, Diet, and Food-Retail Access: Findings from the Leeds “food Deserts” Study. Environ. Plan. A 2003, 35, 151–188. [Google Scholar] [CrossRef]
  31. Furey, S.; Strugnell, C.; Mcilveen, H. An Investigation of the Potential Existence of “Food Deserts” in Rural and Urban Areas of Northern Ireland. Agric. Hum. Values 2001, 18, 447–457. [Google Scholar] [CrossRef]
  32. Josep, B.-M.; Josep, X.E.; Galiana, M.E.; Moncho, J. Food, Nutrition and Public Health in Contemporary Spain, 1900–1936. Food Hist. 2008, 6, 167–192. [Google Scholar] [CrossRef]
  33. Robins, J.E. “Food Comes First”: The Development of Colonial Nutritional Policy in Ghana, 1900–1950. Glob. Food Hist. 2018, 4, 168–188. [Google Scholar] [CrossRef]
  34. Sikalidis, A.K. From Food for Survival to Food for Personalized Optimal Health: A Historical Perspective of How Food and Nutrition Gave Rise to Nutrigenomics. J. Am. Coll. Nutr. 2019, 38, 84–95. [Google Scholar] [CrossRef] [PubMed]
  35. Kim, Y.; Lee, J.; Kim, J.; Nakajima, N. The Disparity in Transit Travel Time between Koreans and Japanese in 1930s Colonial Seoul. Findings 2021. [Google Scholar] [CrossRef]
  36. Pereira, R.H.M.; Saraiva, M.; Herszenhut, D.; Braga, C.K.V.; Conway, M.W. R5r: Rapid Realistic Routing on Multimodal Transport Networks with R 5 in R. Findings 2021. [Google Scholar] [CrossRef]
  37. Henry, T.A. Assimilating Seoul: Japanese Rule and the Politics of Public Space in Colonial Korea, 1910–1945; University of California Press: Berkeley, CA, USA, 2016. [Google Scholar]
  38. Cumings, B. The Legacy of Japanese Colonialism in Korea. In The Japanese Colonial Empire, 1895–1945; Princeton University Press: Princeton, NJ, USA, 2020; pp. 478–496. [Google Scholar]
  39. Paik, C. Does Lineage Matter? A Study of Ancestral Influence on Educational Attainment in Korea. Eur. Rev. Econ. Hist. 2014, 18, 433–451. [Google Scholar] [CrossRef]
  40. Jeong, W. The Urban Development Politics of Seoul as Colonial City. J. Urban Hist. 2001, 27, 158–177. [Google Scholar] [CrossRef]
  41. Kimura, M. Standards of Living in Colonial Korea: Did the Masses Become Worse off or Better off under Japanese Rule? J. Econ. Hist. 1993, 53, 629–652. [Google Scholar] [CrossRef]
  42. Kimura, M. The Economics of Japanese Imperialism in Korea, 1910–1939. Econ. Hist. Rev. 1995, 48, 555–574. [Google Scholar] [CrossRef]
  43. Ahn, S.; Ishida, J. Reconsideration of Park Planning in Seoul, Especially about Neighborhood Playgrounds Created with Kyoungseong Street Planning and Land Readjustment Project from 1936. J. Seoul Stud. 2014, 64, 131–173. [Google Scholar] [CrossRef]
  44. Cho, Y. Colonial Modernity Matters?: Debates on Colonial Past in South Korea. Cult. Stud. 2012, 26, 645–669. [Google Scholar] [CrossRef]
  45. Haggard, S.; Kang, D.; Moon, C.I. Japanese Colonialism and Korean Development: A Critique. World Dev. 1997, 25, 867–881. [Google Scholar] [CrossRef]
  46. Chung, C. Between Ideology and Entertainment: Gyeongseong (Seoul) Cinemas under the Colonial Rule between 1934 and 1942. J. Jpn. Korean Ciné. 2020, 12, 1–18. [Google Scholar] [CrossRef]
  47. Ishida, J.; Kim, J. Colonial Modernity and Urban Space: Seoul and the 1930s Land Readjustment Project. Constructing the Colonized Land: Entwined Perspectives of East Asia around WWII. 2014. Available online: https://www.taylorfrancis.com/chapters/edit/10.4324/9781315573632-12/colonial-modernity-urban-space-seoul-1930s-land-readjustment-project (accessed on 1 August 2022).
  48. Cubbin, C.; Kim, Y.; Vohra-Gupta, S.; Margerison, C. Longitudinal Measures of Neighborhood Poverty and Income Inequality Are Associated with Adverse Birth Outcomes in Texas. Soc. Sci. Med. 2020, 245, 112665. [Google Scholar] [CrossRef]
  49. Duncan, D.T.; Kawachi, I.; White, K.; Williams, D.R. The Geography of Recreational Open Space: Influence of Neighborhood Racial Composition and Neighborhood Poverty. J. Urban Health 2013, 90, 618–631. [Google Scholar] [CrossRef] [PubMed]
  50. Krizek, K.J. Residential Relocation and Changes in Urban Travel: Does Neighborhood-Scale Urban Form Matter? J. Am. Plan. Assoc. 2003, 69, 265–281. [Google Scholar] [CrossRef]
  51. Wei, Y.D.; Xiao, W.; Simon, C.A.; Liu, B.; Ni, Y. Neighborhood, Race and Educational Inequality. Cities 2018, 73, 1–13. [Google Scholar] [CrossRef]
  52. Wong, M.S.; Chan, K.S.; Jones-Smith, J.C.; Colantuoni, E.; Thorpe, R.J.; Bleich, S.N. The Neighborhood Environment and Obesity: Understanding Variation by Race/Ethnicity. Prev. Med. 2018, 111, 371–377. [Google Scholar] [CrossRef]
  53. Kennedy, E.T. Evidence for Nutritional Benefits in Prolonging Wellness. Am. J. Clin. Nutr. 2006, 83, 410S–414S. [Google Scholar] [CrossRef]
  54. Lee, J.; Miller, H.J. Measuring the Impacts of New Public Transit Services on Space-Time Accessibility: An Analysis of Transit System Redesign and New Bus Rapid Transit in Columbus, Ohio, USA. Appl. Geogr. 2018, 93, 47–63. [Google Scholar] [CrossRef]
  55. Lee, J.; Miller, H.J. Analyzing Collective Accessibility Using Average Space-Time Prisms. Transp. Res. Part D Transp. Environ. 2019, 69, 250–264. [Google Scholar] [CrossRef]
  56. Lee, J.; Miller, H.J. Robust Accessibility: Measuring Accessibility Based on Travelers’ Heterogeneous Strategies for Managing Travel Time Uncertainty. J. Transp. Geogr. 2020, 86, 102747. [Google Scholar] [CrossRef]
  57. Singh, S.S.; Javanmard, R.; Lee, J.; Kim, J.; Diab, E. Evaluating the Accessibility Benefits of the New BRT System during the COVID-19 Pandemic in Winnipeg, Canada. J. Urban Mobil. 2022, 2, 100016. [Google Scholar] [CrossRef]
  58. Kim, J.; Lee, B. More than Travel Time: New Accessibility Index Capturing the Connectivity of Transit Services. J. Transp. Geogr. 2019, 78, 8–18. [Google Scholar] [CrossRef]
  59. El-Geneidy, A.M.; Levinson, D.M. Access to Destinations: Development of Accessibility Measures—Report # 2006-16. 2006. Available online: https://conservancy.umn.edu/handle/11299/638 (accessed on 1 August 2022).
  60. Horner, M.W.; Duncan, M.D.; Wood, B.S.; Valdez-Torres, Y.; Stansbury, C. Do Aging Populations Have Differential Accessibility to Activities? Analyzing the Spatial Structure of Social, Professional, and Business Opportunities. Travel Behav. Soc. 2015, 2, 182–191. [Google Scholar] [CrossRef]
  61. Kwan, M.-P. Space-Time and Integral Measures of Individual Accessibility: A Comparative Analysis Using a Point-Based Framework. Geogr. Anal. 1998, 30, 191–216. [Google Scholar] [CrossRef]
  62. Liu, S.; Zhu, X. Accessibility Analyst: An Integrated GIS Tool for Accessibility Analysis in Urban Transportation Planning. Environ. Plan. B Plan. Des. 2004, 31, 105–124. [Google Scholar] [CrossRef]
  63. McHugh, M.L. Multiple Comparison Analysis Testing in ANOVA. Biochem. Med. 2011, 21, 203–209. [Google Scholar] [CrossRef]
  64. Altintzoglou, T.; Heide, M.; Wien, A.H.; Honkanen, P.; Altintzoglou, T.; Heide, M.; Wien, A.H.; Honkanen, P. Traditional Sushi for Modern Consumers: A Comparison Between Sushi Consumption Behavior in Japan and Norway Traditional Sushi for Modern Consumers: A Comparison Between Sushi Consumption Behavior in Japan And. J. Food Prod. Mark. 2016, 22, 717–732. [Google Scholar] [CrossRef]
  65. Wallace, E. Can Mobile Food Truck Vendors Contribute to the Accessibility of Nutritious Foods Can Mobile Food Truck Vendors Contribute to the Accessibility of Nutritious Foods in Vulnerable Communities? An Analysis of Public Health Policy. Available online: https://www.proquest.com/docview/1460173852?pq-origsite=gscholar&fromopenview=true (accessed on 1 August 2022).
Figure 1. Location of Korean Peninsula and colonial Seoul (Gyeongseong).
Sustainability 14 11852 g001
Figure 2. Processing of food data in this study. Note: the numbers inside the parentheses denote the count of corresponding types of food businesses.
Sustainability 14 11852 g002
Figure 3. Geographic distribution of food retail businesses in colonial Seoul.
Sustainability 14 11852 g003
Figure 4. Spatial distribution of nine neighborhood types.
Sustainability 14 11852 g004
Figure 5. Rice accessibility maps.
Sustainability 14 11852 g005
Figure 6. Box plot of rice accessibility by neighborhood type.
Sustainability 14 11852 g006
Figure 7. Grocery accessibility maps.
Sustainability 14 11852 g007
Figure 8. Box plot of grocery accessibility by neighborhood type.
Sustainability 14 11852 g008
Figure 9. Meat accessibility maps.
Sustainability 14 11852 g009
Figure 10. Box plot of meat accessibility by neighborhood type.
Sustainability 14 11852 g010
Figure 11. Seafood accessibility maps.
Sustainability 14 11852 g011
Figure 12. Box plot of seafood accessibility by neighborhood type.
Sustainability 14 11852 g012
Figure 13. Produce (vegetable and fruit) accessibility maps.
Sustainability 14 11852 g013
Figure 14. Box plot of produce (vegetable and fruit) accessibility by neighborhood type.
Sustainability 14 11852 g014
Figure 15. Parallel plots of accessibility to five foods of all neighborhoods.
Sustainability 14 11852 g015
Figure 16. Administrative Boundary Changes in Colonial Seoul.
Sustainability 14 11852 g016
Table 1. Historical materials used in this study.
DataYearPublisherSourceDigitized Outcome
Map of Greater Keijo1936JiseongdangSeoul Museum of History
(1)
Neighborhood boundary
(2)
Public transit (tram and bus) network data
(3)
Road network data
Keijo Tram and Bus Route Map1932Keijo Electric Company Co., Ltd.Personal
(1)
Public transit (tram and bus) stops, location data
(2)
GTFS
Keijo Urban Planning Map1936Keijo Municipal GovernmentSeoul Museum of History
(1)
Parcel-level centroid data
(2)
Road network data
Keijo neighborhood employment and population statistics1936Keijo Municipal GovernmentNational Library of Korea
(1)
Demographics data by ethnicity
(2)
Unemployment data
Keijo Tram Operation Timetable1942Keijo Electric Company Co., Ltd.Seoul Museum of HistoryGTFS data
Keijo Business Demography Index1937Keijo chamber of commerce and industryNational Library of KoreaFood retail locations at parcel level
Information of Keijo tram headway1939Chosun IlboNAVER (Korean search engine) News library’s digital archiveGTFS data
Information of Keijo bus headway1934Dong-a Ilbo
Information of Keijo bus scheduled speed1931Chosun Ilbo
Information of Keijo streetcar line’s headway and operation time1935Chosun Ilbo
Information of Keijo streetcar line’s scheduled speed1932Dong-a Ilbo
Table 2. Classification of neighborhoods in colonial Seoul by ethnicity and economic status.
Types of Neighborhoods
Japanese-Dominant NeighborhoodsMixed-Ethnicity NeighborhoodsKorean-Dominant Neighborhoods
Lower unemployment rateSustainability 14 11852 i001Higher unemployment rateLower unemployment rateSustainability 14 11852 i001Higher unemployment rateLower unemployment rateSustainability 14 11852 i001Higher unemployment rate
Type 1
(31)
Type 2
(45)
Type 3
(10)
Type 4
(29)
Type 5
(18)
Type 6
(46)
Type 7
(31)
Type 8
(27)
Type 9
(34)
Share of Japanese (average: 26%)>29%>29%>29%3–29%3–29%3–29%<3%<3%<3%
Share of Koreans (average: 71%)<70%<70%<70%70–97%70–97%70–97%>97%>97%>97%
Share of unemployed populations
(average: 3%)
<2%2–4%>4%<2%2–4%>4%<2%2–4%>4%
Note: the numbers inside the parentheses denote the count of neighborhoods.
Publisher’s Note: MDPI stays neutral with regard to jurisdictional claims in published maps and institutional affiliations.

