Article

Environmental Monitoring for Arctic Resiliency and Sustainability: An Integrated Approach with Topic Modeling and Network Analysis

1
Department of Communication, College of Arts & Sciences, University of North Dakota, Grand Forks, ND 58202, USA
2
School of Electrical Engineering and Computer Science, University of North Dakota, Grand Forks, ND 58202, USA
3
Computational Research Center, University of North Dakota, Grand Forks, ND 58202, USA
*
Authors to whom correspondence should be addressed.
Sustainability 2022, 14(24), 16493; https://doi.org/10.3390/su142416493
Submission received: 19 October 2022 / Revised: 14 November 2022 / Accepted: 19 November 2022 / Published: 9 December 2022

Abstract

:
The Arctic environment is experiencing profound and rapid changes that will have far-reaching implications for resilient and sustainable development at the local and global levels. To achieve sustainable Arctic futures, it is critical to equip policymakers and global and regional stake- and rights-holders with knowledge and data regarding the ongoing changes in the Arctic environment. Community monitoring is an important source of environmental data in the Arctic but this research argues that community-generated data are under-utilized in the literature. A key challenge to leveraging community-based Arctic environmental monitoring is that it often takes the form of large, unstructured data consisting of field documents, media reports, and transcripts of oral histories. In this study, we integrated two computational approaches—topic modeling and network analysis—to identify environmental changes and their implications for resilience and sustainability in the Arctic. Using data from community monitoring reports of unusual environmental events in the Arctic that span a decade, we identified clusters of environmental challenges: permafrost thawing, infrastructure degradation, animal populations, and fluctuations in energy supply, among others. Leveraging visualization and analytical techniques from network science, we further identified the evolution of environmental challenges over time and contributing factors to the interconnections between these challenges. The study concludes by discussing practical and methodological contributions to Arctic resiliency and sustainability.

1. Introduction

The Arctic environment is experiencing profound and rapid changes that will have far-reaching implications for sustainable development at the local and global levels. During the last 43 years, the Arctic has been warming nearly four times faster than other regions around the world: a ratio higher than what had earlier been described in the literature [1]. Sea ice extent has decreased substantially since 1979, with summer 2021 recording the second-lowest amount of multi-year ice since 1985 [2]. Sea ice volume was also at a record low since 2010 [2]. Some climate models projected that the Arctic might essentially be ice-free in summer by the late 2030s [3]. The thawing of permafrost—perennially frozen soils covering about 25% of the Northern Hemisphere—threatens to release an unknown quantity of the nearly 1700 billion metric tons of carbon it stores [4], accelerating climate change through a process known as permafrost-carbon feedback [5]. Aside from the above indicators, research has examined many other aspects of the changing Arctic, from eroding coasts and browning tundra to increasing river discharge [6,7,8]. As the National Oceanic and Atmospheric Administration’s annual Arctic Report Card concludes, “cascading disruptions, extreme events, and increasing variability throughout the Arctic impact the safety and well-being of communities within and far away from the Arctic” [2] (p. 2).
As climate change continues to intensify and drive the evolution of the Arctic environment, there is a rising demand for comprehensive and rigorous monitoring methods to document trends in critical environmental indicators and assess their implications for the sustainability of natural and social systems. Advances in remote-sensing technology, high-performance and high-throughput computing, and deep learning have created transformational opportunities to assess the breadth and dynamics of environmental changes [9,10]. For example, researchers have identified and mapped 1.2 billion ice-wedge polygons using commercial satellite imagery and neural networks [11,12]. The results—updated periodically on an interactive visualization platform [13]—enable researchers to develop a near real-time understanding of changing permafrost. Other examples include identifying the distribution of algal aggregates in the central Arctic [14] and assessing the infrastructure degradation due to thawing permafrost [15]. Environmental monitoring based on big-imagery analysis greatly assists in the research, policy making, and public outreach related to the sustainable development of the Arctic.
Alongside the growing application of big-imagery analysis, there is an equally fervent interest in community-based monitoring (CBM) [16]. CBM refers to “a process where concerned citizens, government agencies, industry, academia, community groups, and local institutions collaborate to monitor, track, and respond to issues of common community concern” [17] (p. 4). CBM complements traditional, large-scale monitoring. The Arctic encompasses a large area with little infrastructure, making it difficult and costly to collect local environmental data [18]. CBM can expand the breadth and density of environmental monitoring, allowing scientists to collect data from areas that would otherwise be inaccessible. Local communities, especially Indigenous communities who have lived in the area for generations, often possess intimate knowledge of the local environment and have a keen interest in sustainability and resiliency. Involving community members and scientists in environmental monitoring aligns scientific investigation together with “cumulated and transmitted knowledge, experience, and wisdom of human communities with a long-term attachment to place” [19] (p. 29). Given these and other advantages, there are over 170 CBM programs in the Arctic, contributing to achieving 16 of the 17 United Nations’ Sustainable Development Goals [20].
Despite CBM’s promise and robust presence in the Arctic, CBM data remain under-utilized in scientific and policy decision making [21]. Scientific publications using CBM data are not as common as anticipated, even though some long-running CBM programs have accumulated a wealth of carefully validated and calibrated data [22]. Among many reasons for the inadequate use of the CBM data, a key challenge is the qualitative nature of the data. Observations from community members can be reported through blog posts, field documents, local media reports, and transcripts of oral histories, interviews, and semi-structured surveys. Although many diverse methods are available for qualitative data, the results are often not quantifiable, limiting the potential to synthesize the qualitative data with other approaches to environmental monitoring that rely on quantitative methodologies. Additional challenges arise from the scale of data due, in part, to the widespread application of new technologies to CBM. New technology, such as smartphone apps, social media, and online crowdsourcing platforms, allows community members to easily document and share their observations of unusual environmental events, catalyzing community involvement and creating a voluminous amount of unstructured data [23]. The burden of analyzing big, unstructured data becomes unattainable at the human scale, necessitating the development of innovative analytical methods.
Computational techniques, and natural language processing in particular, are promising tools for deriving quantitative insights from big, unstructured data [24]. While the intersection of natural language processing and research on sustainability is emerging in the literature, this integration has yet to be explored in the context of CBM in the Arctic. Hence, the primary motivation of this study is to harness computational techniques to assist with identifying environmental changes and their implications for sustainability in the Arctic. In the following sections, we discuss two computational, unsupervised learning methods widely used for big, qualitative data: topic modeling and network analysis with a focus on the strengths and limitations of each method as they apply to CBM data in the Arctic. We synthesize the two methods and demonstrate their applicability here with a large corpus of unusual environmental events that occurred in the Arctic between 2010 and 2022. Finally, we discuss the contributions to CBM for resilient, sustainable development in the Arctic and future directions for addressing the interoperability of quantitative, qualitative, and spatial data related to environmental changes in the Arctic.

2. Natural Language Processing and Unsupervised Learning

Natural language processing is an active area of research and application at the intersection of multiple scientific disciplines, including computer science, mathematics, artificial intelligence, communication, linguistics, and engineering [25]. Natural language processing employs supervised or unsupervised learning algorithms to automatically identify semantic structures in textual information, providing a reference framework to extrapolate meaning from large, text-based unstructured data [25]. Two approaches are the most common and relevant to mining data from CBM in the Arctic: topic modeling and semantic network analysis.

2.1. Topic Modeling

Topic modeling is a statistical model that infers what events or concepts a document describes [26]. Although topics are clear to humans reading a document, it is a challenging task for learning algorithms, where the only input is the text without any a priori knowledge about the subject matter of the document or the context in which the document is written. Central to topic modeling are the ideas that a document can be represented as a probability distribution over a predefined number of topics and that a topic can be modeled as a probability distribution over the words that it contains [27]. In other words, topic modeling enables quantitative analyses of big textual data by assigning probabilities to a set of latent topics presumed to constitute each document. Unlike traditional analyses that describe topics through archetypal examples, topic modeling identifies topics based on how words are distributed in the documents and the extent to which the cluster of words leads to clear and coherent semantic meaning [28]. Previous work has applied topic modeling to various areas of sustainability, such as smart factories [29] and logistics [30], and has used a diverse set of datasets, including scientific literature [29], patent applications [30], and social media posts [31].
However, topic modeling is not without limitations when used for sustainability research on the Arctic. The Arctic is an integrated system where changes in one component of the physical system are likely to induce changes in other components through interactions and feedback mechanisms [32]. This means that researchers are not only interested in what events are described in a document but also how the events from those documents are interrelated: in the parlance of topic modeling, the interrelations between topics. Yet, topic modeling focuses primarily on what words describe a topic and what topics are discussed in a document, providing limited data about how the topics are related. As such, topic modeling is a useful but limited tool for analyzing qualitative reports from CBM in the Arctic.

2.2. Semantic Network Analysis

An alternative approach to the computational analysis of textual data is semantic network analysis. A network is defined by a set of identifiable entities called nodes and dyadic links between them called edges [33]. As a special case of general networks, semantic networks concern words as nodes and their co-occurrences in the text as edges [34]. A general assumption of semantic network analysis is that events or concepts can be identified by understanding how words co-occur in a document. That is, the meaning of a text is inferred not from what words are included in a document but from how pairs of words appear together in the text. Given its emphasis on the pattern of word associations, semantic network analysis is considered a structural approach to natural language processing [35]. Semantic network analysis has also been widely used for sustainability research, uncovering how organizations discuss sustainability in annual reports [36] and how residents respond to biosphere reserves in local communities [37].
Similar to topic modeling, semantic network analysis has unique strengths and limitations for sustainability research in the Arctic. On the one hand, by using semantic networks, researchers can benefit from a large family of statistics developed in network research [33], unlocking the potential to assess the importance of words in a given text based on their connections with each other. On the other hand, with its focus on words, semantic networks may be limited to micro-linguistic units that are difficult to relate to higher-order concepts or events [38]. As such, the findings of a semantic network analysis may reveal more about how different terms are related than what events or concepts are discussed in the text.

2.3. The Current Study

Given the advantages and limitations of each approach, the present study combines topic modeling and network analysis to identify and analyze unusual environmental events in the Arctic. Our analysis proceeded in three steps. First, we used topic modeling to extract latent topics from the corpus of textual data. This step allowed us to identify a list of unusual environmental events from the collection of documents. Second, we situated the identified topics in a series of networks segmented by time. In these networks, nodes are documents and topics and the relationships indicate whether a document describes certain topics. While the first step results in a pool of potential events, the second step—with the support of network measures—quantifies the importance of these events and their underlying documents. Finally, we used a network model—the bipartite exponential random graph model [39]—to predict what documents are likely to describe similar topics. This last step extends beyond the descriptive approach, which defines the majority of studies using natural language processing for sustainability research, and instead explores the generative mechanism underlying the document–topic relationship.

3. Materials and Methods

3.1. Data Curation

Data used in this study were collected from the Local Environmental Observer (LEO) network. The LEO network is an environmental monitoring platform based on a social network [16]. The LEO connects scientists and volunteers to collect and report unusual environmental events in their local communities. By 2018, the LEO network has included over 1800 members in 35 countries, collecting reports of field observations across a variety of environmental and physical issues, ranging from permafrost thawing to infrastructure degradation. The reports submitted to the LEO network provided ideal data for this project because each event was independently verified by scientists in the communities. The LEO establishes a rigorous peer-review process to ensure the quality of members’ reports. Each submission is evaluated by expert coordinators based on several criteria, including (1) whether it specifies time and location, (2) whether the member witnesses the event, (3) whether the submission includes all the required content, (4) whether it is professionally appropriate, and (5) whether it respects the privacy of local residents [16]. The data for the reports include textual descriptions, images, latitudes and longitudes, timestamps, and information sources.
The data were collected from 2010 to 2022, leading to a corpus of 5651 reports of field observations around the globe. Using the longitude and latitude associated with each report, we identified a subset of events that occurred in the northern circumpolar (Arctic) region. This process resulted in 705 reports between 2010 and 2022. Together, the reports included 158,540 words (M = 225, SD = 112). Most reports were submitted between 2017 and 2021 (n = 555, 78.7%). About 36% of reports described events that occurred in the United States. Other locations included Canada, Finland, Greenland, Norway, Russia, and Sweden. Figure 1 shows the geographical distribution of the reported events across the northern circumpolar region.

3.2. Topic Identification with Latent Dirichlet Allocation

3.2.1. Latent Dirichlet Allocation

We employed latent Dirichlet allocation (LDA; [40]) to identify themes from the sample of reports about unusual environmental events in the northern circumpolar region. The LDA does not presume a priori knowledge about the topical structure in the corpus of the documents. Using a Bayesian generative model, the LDA produces two matrices to infer the latent topical structure in a collection of documents: a term–topic matrix and a document–topic matrix. Conceptually, the term–topic matrix indicates the most important terms that define a topic and the document–topic matrix suggests the most probable topics that appear in a document. When combined, the two matrices assist researchers in interpreting and labeling the topical structure that governs the documents of interest.

3.2.2. Data Processing and Calibration

The validity of the LDA results depends on the quality of the input data. Our analysis followed best practices recommended by Maier and colleagues [28], who detailed a sequence of specific steps to increase the validity and interpretation of modeling results. Briefly, the first step was to prepare the textual data by tokenizing words, removing punctuation, special characters, and stop-words, and reducing each word to its word stem. Next, we used a maximization algorithm to determine the optimal number of topics that characterized the document corpus [41]. The optimal number of topics was identified when the algorithm estimation peaked, suggesting that no substantial improvement would be made by adding more topics. As seen in Figure 2, the maximization index peaked near 20 to 25 topics. It is not uncommon for the maximization algorithm to suggest a range of optimal topics. When that occurs, researchers are advised to use the lower end of the range in the interest of parsimony. Hence, we determined that the sampled reports of unusual environmental events were best represented with 20 topics.

3.2.3. Reliability

The estimation of LDA begins with randomly assigning the probabilities of words to topics and the probabilities of topics to documents. Because of the random initialization and the subsequent stochastic inference, the results from LDA models are not deterministic [28]. This means that the results may vary, sometimes substantially, with initial parameter selection and estimation processes. Hence, it is important to conduct reliability checks to assess the robustness of the model results. To test reliability, we randomly selected 80% of the text data and developed a topic model using this subsample. The model developed from this 80% subset was then applied to the remaining 20% to examine if the same topics could be replicated. Our results were replicated with a smaller dataset, suggesting that the topic identification was reliable and robust.

3.2.4. Topic Interpretation and Labeling

We assessed each term’s relative importance in defining each topic. Specifically, the relative importance was calculated by computing the binary logarithm of the ratio between a term’s relationship to a given topic and its relationship to all of the other topics [42]. The measurement is formally represented as
l o g   r a t i o = l o g 2 φ k ,   i j k φ j ,   i
where l o g 2 is the binary algorithm function, φ k ,   i denotes the relationship between term i to topic k, and j k φ j ,   i represents the aggregate of the relationships of term i to all topics other than k. For interpretation, a log ratio index of 1 indicates that a specific term i has twice the likelihood of defining the topic k than that of defining the rest of the topics in the model [42]. After that, we interpreted topics with three sets of information: (1) the words with the highest probabilities assigned to a given topic, (2) the words that are prevalent and exclusive to a topic, and (3) the documents that are most representative of a topic [38].

3.3. Topic–Document Network Analysis

3.3.1. Network Construction

We built upon the LDA results to create a topic–document network. This network includes two types of nodes (reports and topics) and connections are the probabilities of a report describing one or more topics. In network parlance, this is known as a bipartite network [33]. Because the LDA estimates the probabilities of a document for all of the potential topics, the resulting network is saturated such that each document is connected to all topics and each topic is connected to all documents, regardless of how large or small the probability is. A saturated network is not particularly informative in distinguishing the relative importance of topics and documents. Hence, much of the existing work imposes a predefined threshold to screen out topic–document connections with low probabilities and focus only on the most probable documents for each topic [43]. Following prior work, we set the threshold to the 75th percentile in the probability ranking. That is, a document is connected to a topic in the network if its probability is at the 75th percentile or higher among the probabilities of all the other documents under the same topic. In this way, the network represents topics and a set of most probable documents that describe these topics.

3.3.2. Network Measures

Representing topic modeling results as networks enables us to benefit from a rich family of centrality measures developed in network science to quantify the structural importance of a node in a network. In this study, we focused on degree and betweenness centrality. Degree centrality assesses the importance of a focal node by counting the number of other nodes that directly connect to it. A topic is more important than others if it is described in more documents. Betweenness centrality estimates the number of shortest connections that pass through one node between two other nodes in the network. Nodes with high betweenness scores are often considered liaisons in the network, bridging the otherwise disconnected components together. In the present context, a topic with high betweenness centrality suggests that it often links documents that mention different topics. Formally, betweenness centrality in a bipartite network is defined as [44]
C k = 1 2 i k n j k , i n g i k j g i j
where C k indicates the betweenness centrality of a node k, g i k j is the number of geodesic paths between nodes i and j that pass through node k, and g i j is the number of geodesic paths from nodes i to j.

3.3.3. Bipartite Exponential Random Graph Models

Another benefit of expressing topic modeling results in networks is that we can explicitly test the mechanisms underlying the formation of topic–document networks. For sustainability research related to the Arctic, this means that we can not only describe what documents or topics are important but also predict what documents are more or less likely to report certain environmental events. For this predictive analysis, we used a statistical model known as bipartite exponential random graph models (B-ERGM; [39]). The dependent variable in B-ERGM is the probability of a document describing a certain topic. B-ERGM accounts for this probability by simultaneously modeling the document characteristics (e.g., source of information; location) and the dyadic characteristics (e.g., the differences or similarities between documents). All analyses were conducted using R (version 4.2.1). The data for this study are available in the Open Science Framework.

4. Results

The results are organized into three sections. First, we describe the key topics identified by the LDA and provide examples from the corpus of the documents. Second, we discuss the importance of topics using network centrality measures and explore how their importance changes over time. Finally, we report the B-ERGM results for how document characteristics and their similarities or differences predict the probabilities of describing an environmental event. Together, these findings approach the questions of using CBM for sustainability research with qualitative, descriptive, and predictive insights.

4.1. Extracting Topics from Arctic Community Monitoring Reports

We first explored what topics were described in the corpus of documents from community environmental monitoring in the Arctic. The results based on LDA revealed eight clusters of topics. Table 1 presents the pairwise intersections of different topics and their corresponding Jaccard index. Of note, the pairwise intersection shows the number of documents containing information about two topics of interest. Similarly, the Jaccard index assesses the extent of intersection between two sets of samples (i.e., documents) and is a normalized measure of similarity. The Jaccard index ranges from 0 (completely dissimilar) to 1 (completely similar).
Cluster 1 describes animal behavior in the Arctic, covering topics about sea and land mammals, birds, migration, and population changes. For example, a document from the residents living in the Christiansen Lake area in Alaska reported significant changes in the lake ecosystem since 2019, including fewer nesting birds and mammals around the lake and a substantial increase in the leech population and harmful algal blooms. As another example, scientists and volunteers from the Western Arctic Caribou Herd Working Group reported that the population of one of the largest caribou herds in North America had decreased by nearly a quarter in the past two years. Animal behavior is one of the most frequently described topics, appearing in about 25% (n = 174) of all of the documents in the corpus.
Clusters 2 and 3 describe climate change and natural disasters, covering topics such as extreme weather events and temperature change. An example report from this cluster described the record heat wave in Kodiak, Alaska, where the warmest temperature in history was recorded for the region. Similarly, the rising temperature in Greenland drove record precipitation, which was estimated to dump 7 billion tons of water. The documents in this cluster not only reported the occurrence of extreme climate events but also described the impacts of the events on human behavior. Several documents reported flight cancellations and forced evacuations due to extreme climate events in the area. Documents on climate change and natural disasters accounted for 25% (n = 176) and 22.3% (n = 157), respectively.
Cluster 4 focuses on permafrost changes and their impacts on the region (18%, n = 127). Observations of disappearing lakes and slumping hillsides, which may be linked to permafrost degradation [45,46], were recorded across the area. For example, community members reported that a lake about 3.2 miles northeast of Kotzebue had drained, leaving a sinkhole about 4 to 5 feet deep. The resident’s report was confirmed by scientists using Sentinel-2 satellite imagery. In another document, a member of the LEO network reported thawing permafrost in Western Alaska, along with an image that shows exposed permafrost on the tundra.
Cluster 5 details infrastructure and transportation (25%, n = 176). These documents recorded infrastructure degradation, building damage, and transportation challenges due to the changing environment in the Arctic. Several documents described damage to the steel, concrete, or tarmac structures sitting on top of thawing permafrost. In one case, a report described how a building in the Arctic town of Chersky, Russia, was snapped in the middle as the permafrost was no longer solid enough to support the building’s foundation. In another case, the bluff was receding at a rate of about 3 feet each year near Kenai City and Saint Michael, Alaska, threatening homes and community infrastructure. Community residents additionally reported degrading water wells and transmission lines due to bank erosion near Noatak, Alaska.
Clusters 6 and 7 are concerned with fisheries (17%, n = 120) and community life (17.3%, n = 122). Several documents reported the challenges to fisheries due to the changing environment and human activities. For example, fishing fleets in the region have been experiencing decreased productivity as the Bering Sea ice melts, with downstream impacts unfolding in the food chain. Public officials had to close commercial fishing on the Copper River in Alaska in 2020 due to an extremely low sockeye number. Given the importance of fisheries in communities’ economies and cultural traditions, the disruptions are profound and far-reaching. As a community member noted in a report, “it was scary to think about the depleting fishing resource when communities’ survival depends on it.”
Cluster 8 focuses on energy (21.4%, n = 151), describing the relationships among energy supply, resource extraction, and environmental conservation. Reports described oil spills in the region and their environmental impacts. For example, it was reported that 20,000 tons of diesel were leaked into the river system in the Norilsk region, Russia, prompting the local government to declare a state of emergency. Other reports described power outages due to extreme environmental events in the region.

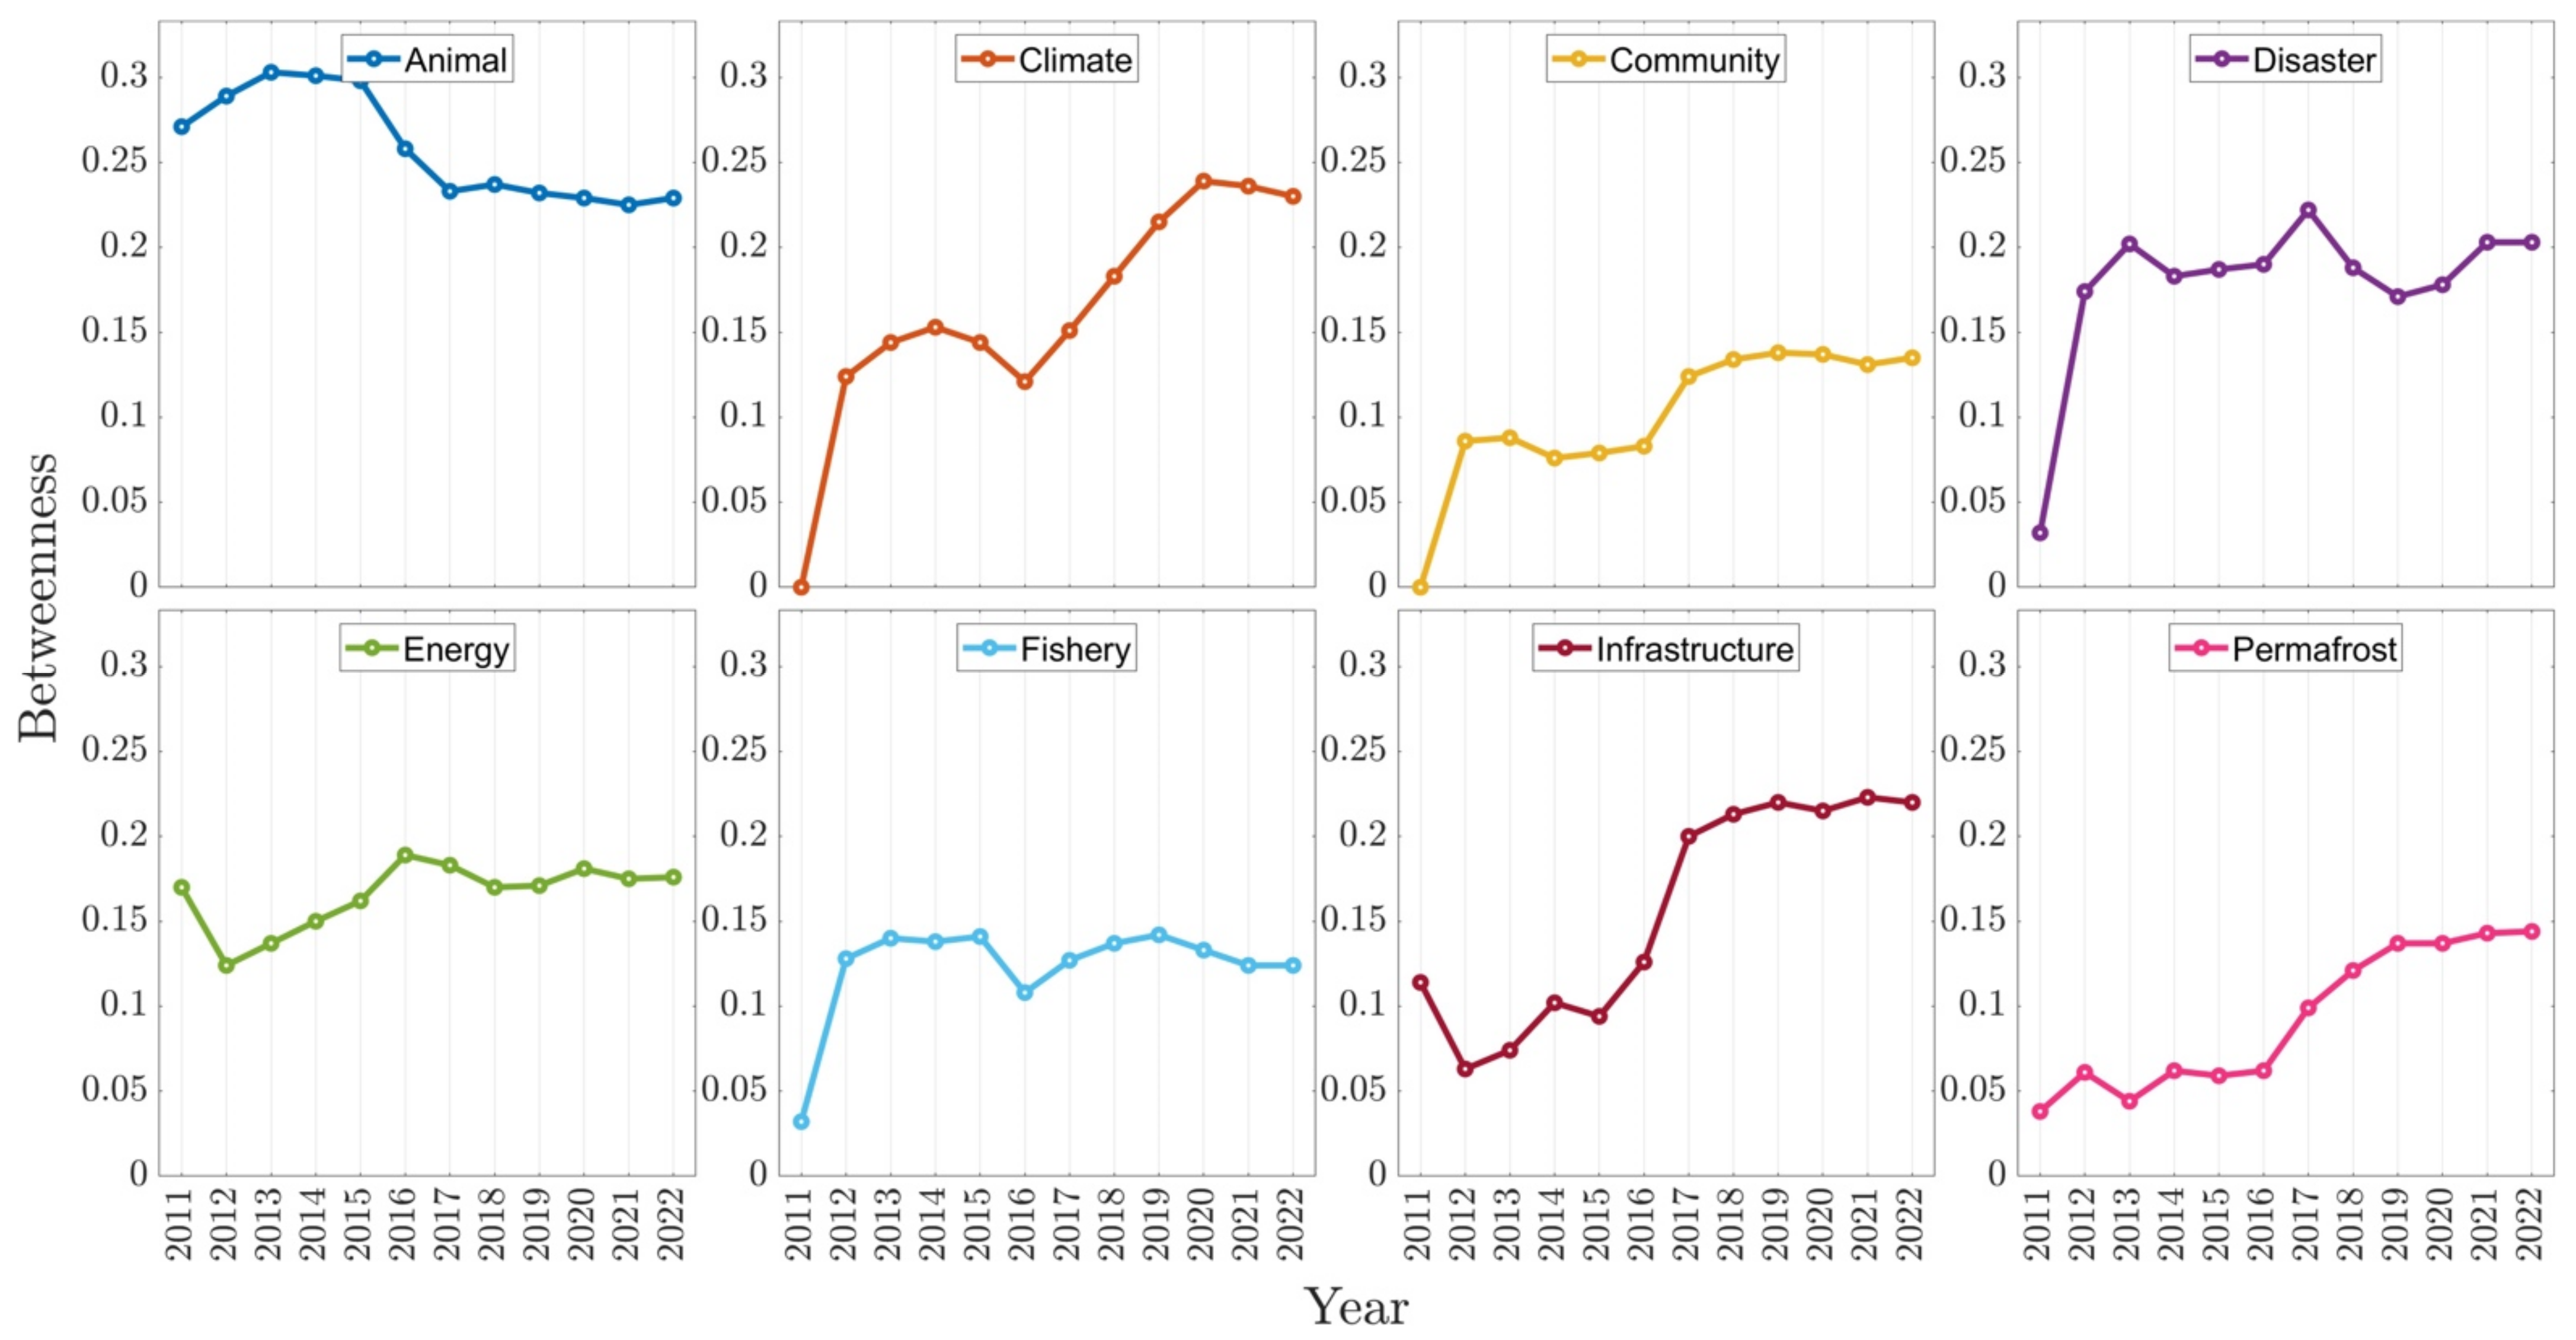
4.2. Tracking the Evolving Importance of Topics with Network Centrality

Next, we assessed the importance of the topics and their trajectories over time, leveraging network analysis. Figure 3 shows the topic–document networks in 2014, 2016, and 2020. Over time, more reports were submitted to the LEO network, suggesting increasing community participation in environmental monitoring. Furthermore, the networks became densely connected, transforming from a system where there were two disconnected subgroups of topics in 2014 to a system where every topic was mutually connected through multiple documents in 2020. To illustrate this transformation, we examined the changes in the pattern of connections associated with the topic of permafrost. As seen in Figure 3, the topic of permafrost was only connected to two other topics (i.e., transportation and energy) in 2014. In the network of 2016, the topic of permafrost was connected to the topics of community life and natural disasters, in addition to the topics of transportation and energy. In a more recent network of 2020, permafrost was closely connected to every other topic we identified in the corpus of documents. As different environmental challenges in the Arctic have become connected, small perturbations in one environmental sphere may spread to affect or co-vary with other spheres via multiple pathways, increasing the likelihood of system-wide changes. Nelson and colleagues [47] defined resiliency as “the amount of change a system can undergo and still retain the same controls on function and structure while maintaining options to develop” (p. 398). The dense interconnections among environmental concerns, as reflected in the community monitoring reports, indicate that communities face an increasingly intertwined set of environmental challenges. This necessitates closer monitoring of the interaction between different environmental concerns and more research on increasing communities’ resiliency to challenges.
We further examined the trend of topic importance as indicated by network centrality. Our data were interdependent such that centrality scores for each year were nested under topics. This interdependence violated the statistical assumption of traditional regressions with the OLS method, which could produce biased estimates for standard errors. We used multilevel modeling (MLM) to address interdependence [48]. We regressed network centrality (i.e., degree or betweenness) on the year while accounting for the interdependence due to topics. The intraclass correlations for degree and betweenness centrality were 0.41 and 0.55, respectively. These correlation coefficients were substantial, suggesting that the centrality scores of the same topic were much more similar than those of a different topic. The regression coefficient for degree centrality was positive and significant (b = 0.01, p < 0.001, 95% CI [0.007, 0.011]). Recall that degree centrality is measured by the number of documents connected to a given topic. The increasing degree centrality means that the topics, on average, are covered by more reports from community environmental monitoring in the Arctic. Similarly, the regression coefficient for betweenness centrality was positive and significant (b = 0.007, p < 0.001, 95% CI [0.005, 0.010]). Because betweenness centrality assesses the degree to which a node serves as a bridge connecting two other nodes, the results suggest that topics are increasingly connected to the documents that describe other topics.
Finally, we plotted the trend of network centrality for each topic. As seen in Figure 4 and Figure 5, all of the topics—except the topic of animal behavior—witnessed an increase in degree and betweenness centrality over time, although the patterns of increase varied by topic. The topics related to climate change, energy, and permafrost experienced a gradual increase in network centrality, suggesting that these topics had a steady growth in both the number of documents that directly described them and the number of documents that described other topics indirectly related to them. By contrast, the centrality scores for the topics of natural disasters and fisheries experienced an increase before 2014 but remained steady afterward. This means that community attention to these topics grew substantially in earlier years and has remained high since then. Despite a small decrease in centrality scores, animal behavior remained a prominent issue in the reports from community environmental monitoring in the Arctic over the years.

4.3. Predicting the Formation of Topic–Document Networks

Finally, we explored the factors that accounted for topic–document connections. We considered a set of exploratory factors, including the location and time of environmental events and the source of documents. Table 2 presents the model estimates and Figure A1 and Figure A2 in the Appendix A show the diagnostics of the model fit. The estimated models achieved a reasonable fit with the data. Controlling for network density and degree centrality, the probability of a document describing a certain topic was not associated with the environmental event’s location (b = 0.12, SE = 0.09, p > 0.05) and time (b = −0.01, SE = 0.01, p > 0.05), nor was it associated with the source of the documents (b = −0.12, SE = 0.11, p > 0.05). Furthermore, the documents from nearby locations were more likely to describe the same topic than the documents from faraway locations (b = 0.005, SE = 0.001, p < 0.01). This suggests that geographically proximal communities may experience similar environmental events. It is also possible that community members may collectively act to respond to environmental challenges as a report from LEO participants inspires others to submit their own observations when they witness a similar event. The documents were also more likely to describe the same topic if they were submitted in the same month. This suggests that unusual Arctic environmental events tended to occur clustered with other events of a similar type in proximal time and areas (b = 0.01, SE = 0.006, p = 0.05). Finally, whether or not the documents were from the same source was not associated with their probabilities of predicting the same topic (b = 0.001, SE = 0.001, p > 0.05). Taken together, these results suggest that when it comes to predicting what documents are likely to describe a certain topic, the similarities or differences between these documents are more important than the attributes of individual documents.

5. Discussion

5.1. Theoretical and Practical Contributions

The Arctic environment is under considerable stress from a complex and intertwined set of factors, including climate change, altered ecosystems, economic development, long-range pollutants, and other drivers of change [2]. The changing Arctic will not only alter the living conditions of the communities inhabiting the region or at the margins but also, because of the Arctic’s role in global systems, affect communities worldwide. To achieve sustainable Arctic futures, it is critical to equip policymakers and global and regional stake- and rights-holders with knowledge and data, including predictive visualization and analytics, about the ongoing changes in the Arctic environment. Community-based monitoring has been an important component of the data generation system in the Arctic but the data are under-utilized and under-represented in the scientific literature [21]. One challenge is the fact that community-based monitoring often consists of large, qualitative datasets. Such data are rich but unstructured, making them not readily synthesizable with quantitative data from dominant approaches in environmental monitoring. Furthermore, the scope of the data renders it analytically unattainable at human scale, necessitating machine learning, AI integration, and other advanced computational models. The primary motivation of this study was to provide an analytical framework by integrating two computational methods for large, qualitative data: topic modeling and network analysis. Here, we demonstrate the applicability of the proposed approach with community monitoring reports of unusual environmental events in the Arctic that span a decade.
The study offered a scalable method readily applicable to a large corpus of qualitative reports on unusual environmental events in the Arctic, which may be extrapolated to other global regions. Although the topics identified in this study can also be extracted with traditional manual coding, our approach based on natural language processing—unsupervised learning methods in particular—is better positioned to analyze very large document corpora. Similar applications are emerging in Arctic research. For example, one recent study conducted a computer-assisted literature review of permafrost research between 1948 and 2020 [49]. The study collected a large corpus of 16,249 scientific publications on permafrost and used natural language processing to identify salient themes in the literature, ranging from surface temperature and active layer thickness to permafrost distribution and rock glaciers. To the best of our knowledge, this study is the first to apply topic modeling to the corpus of documents from community-based environmental monitoring in the Arctic. With over 170 community-based monitoring programs currently active in the Arctic [20], the proposed method may be well-suited to assist with the analysis of increasingly rich and complex community reports.
The current method has the potential to increase the representation and usage of data from community environmental monitoring in the broader scientific investigation. As we discussed earlier, community monitoring data are under-utilized in part because the qualitative descriptions of unusual environmental events are not quantifiable, making it difficult to be included in environmental forecasting or modeling that relies on quantitative information. Using topic modeling and network analysis, the current method provides various ways to quantify the salience of environmental events described in a qualitative report. With topic modeling, for example, each report can be characterized as a combination of environmental events, each of which is characterized by a probability indicating the likelihood of the report to describe a focal event. Then, the probabilities can be included in statistical models predicting outcomes of interest. Indeed, research beyond environmental science has demonstrated the utility of incorporating text-mining results into predictive modeling [31,50]. For example, text-mining results were found to improve the accuracy of machine learning models predicting information utility in online platforms [50]. Topic modeling also enables researchers to predict anxiety as people cope with traumatic events [31]. We believe that the quantitative information derived from topic modeling can complement other sources of environmental data to assist in researchers’ efforts to describe and forecast the changes in the Arctic.
An important motivation for researchers studying sustainability and resiliency in the Arctic is to understand how different environmental events are interrelated across time. Topic modeling is instrumental in extracting topics from a corpus of documents [27,40] but it is limited to revealing the connections between these topics [38]. The current study approached this question by integrating topic modeling with network analysis. Specifically, we represented topic modeling results in a series of document–topic networks segmented by time. Network analysis complemented topic modeling in important ways. Network diagrams are an intuitive and compelling tool for visualizing the connections between different topics. By visualizing the document–topic networks over time, the present study revealed a trend where environmental and societal issues became increasingly intertwined. Indeed, a large proportion of documents contained substantial information about two or more topics and the topics—such as climate change, natural disasters, permafrost changes, infrastructure, and transportation—intersected with each other. The variety of the topics reflected multidimensionality along which the changing Arctic environment unfolds, while the intersectionality of these topics indicates the interdependent nature of the Arctic system.
Environmental concerns and their interconnections are certainly not new to the literature [2]. However, what network analysis contributes are diverse sets of statistics that enable us to precisely assess the relative importance of different environmental concerns based on how they are linked with each other. In particular, this study discusses two indicators of topical importance in a network: degree and betweenness centralities. Environmental concerns with high degree centrality are important because they are mentioned in many documents. This is akin to the notion of prevalence: an environmental issue may be worthy of attention because it appears across many reports. By contrast, environmental concerns with high betweenness centrality are important because they are the ones that link the documents describing different concerns together. Put differently, these concerns are intermediaries that can act as a conduit between spheres of environmental challenges. Importantly, degree and betweenness centralities do not always align with each other and the discrepancy between the two is especially informative [33]. For example, an environmental concern bridging different spheres together (i.e., high betweenness) may not be described in many documents (i.e., high degree). This would indicate that an environmental issue that has a high potential for creating rippling effects on the rest of the system has yet to receive much attention from community monitoring. By contrast, an environmental event mentioned in many documents (i.e., high degree) may primarily intersect with documents describing similar events (i.e., low betweenness). This would suggest that the event, albeit salient and perhaps urgent, is likely a concern for specific regions or communities and may not induce system-wide disruption.
The findings show that different topics had distinct growth trajectories in the topic networks. The topics of climate change, energy, and permafrost experienced a gradual increase in both the number of documents that directly described them (i.e., degree centrality) and the number of documents that described other topics indirectly related to them (i.e., betweenness centrality). By contrast, the topics of natural disasters and fisheries experienced an increase in earlier years and have remained high since then. However, there were no discrepancies between the two types of centralities across topics, indicating that the identified concerns are salient and have implications for the entire system. This may be because we used data from one source of community environmental monitoring (i.e., the LEO network). As future work expands to include monitoring data from a variety of sources, including interviews and narratives from indigenous communities, the proposed method may signal emerging areas of concern that have yet to be widely documented.
Finally, network analysis enables us to extend beyond the descriptive analysis that characterizes most studies on sustainability that use topic modeling. Using a sophisticated network model, we investigated the generative mechanism that resulted in the patterns of the document–topic networks. Our results show that different documents were more likely to include substantial information about the same topic if they were from the same month or described environmental events from nearby locations. The results highlight the need to consider similarities or differences between the documents as opposed to individual documents in and of themselves in order to best predict how unusual environmental events are related and their implications for sustainability.

5.2. Limitations and Future Directions

The study has important limitations worthy of additional research. First, this study focused on the trends of critical indicators in environmental systems but paid less attention to the changes in social systems and the implications for communities inhabiting the Arctic regions. Changes in environments and landscapes are the dominant drivers of economic, cultural, and societal transformations in the Arctic [51]. The notion of place is central in many indigenous cultures, where livelihoods and cultural identity deeply intertwine with physical spaces [52]. Transformations to the environments not only threaten the living conditions and livelihoods of local communities but also disrupt cultural practices and communal well-being. For example, research shows that reduced access to subsistence harvesting forced some Inuit communities from land-based to aquatic-based livelihoods, inducing intense feelings of grief associated with the losses of ecosystems and landscapes [53]. While stimulating economic activities of the local areas [54], exploration and extraction of natural resources in the Arctic profoundly disrupt the traditional crafts and values of indigenous communities [55]. To understand how communities cope with changing conditions and how different agencies can assist communities in adaptation, it is important to develop “a system of collection, analysis and inventory of data aimed at addressing the emerging problems and the development of methodological framework and analytics in regards to prospective lines of the development of the Artic territory” [56] (p. 1010). The Arctic is a highly diverse area encompassing remote regions with very low population densities as well as more populated areas. It is characterized by different demographic structures, geopolitical realities, and cultural traditions. This means that the same environmental changes may affect communities differently across the Arctic. While this study presented an analytical method for unstructured, qualitative data, the value of the insights from the present method will depend on the diversity and depth of data from environmental monitoring networks. To that end, we believe a fruitful direction of research is to create an ongoing and sustainable data collection system that reflects the scope and complexity of emerging environmental and social problems faced by diverse communities across the Arctic region.
Second, we used community monitoring reports from the LEO network because of its robust and transparent process of assessing the veracity and quality of the submissions. However, the number of reports from the LEO network was relatively small and covered a large area, which limited our ability to investigate the precise spatial distribution of the unusual environmental events in the Arctic. A fruitful direction for future research would be to collect a large number of geo-tagged documents by integrating data from multiple community monitoring networks, including community networks led by research teams, government organizations, indigenous communities, and other residents of the circumpolar global Arctic.
Third, our current sample focused exclusively on unusual environmental events and their impacts on the communities. However, other issues for sustainability in the Arctic exist, such as sustainable governance and indigenous rights, equity and equality in access to natural resources, resilient knowledge preservation systems, employment and economic development, and resource exploration and extraction, among others [55]. Future research is encouraged to include more diverse sets of documents to cover a more diverse, richer landscape of challenges and emerging issues on Arctic sustainability.
Finally, we constructed networks by imposing a predefined threshold to screen out topic–document connections with low probabilities based on prior studies [43]. It is possible that the network structure may change as a result of the thresholds. Future research is encouraged to assess the effects of different thresholds on network inference and develop a framework for threshold selection.

6. Conclusions

With the Arctic environment undergoing rapid and profound changes, groups of concerned citizens, civilians and federal researchers, indigenous communities, students, and others have been increasingly involved in collecting and submitting environmental data. However, the data from these community efforts are under-utilized and under-represented in scientific and policy decision making, in part due to the challenges associated with analyzing large, qualitative data. The present study approached this challenge by integrating topic modeling and network analysis. Using an independently verified corpus of documents from the LEO network, we identified the key clusters of emerging topics, tracked their evolving importance over time, and explored contributing factors to document–topic connections.
The proposed method in this study can contribute to an environmental monitoring system featuring a process of knowledge co-production by local stake- and rights-holders, scientists, entrepreneurs, policymakers, and the general public. An example of this process is from the LEO network [16]. Local residents and volunteers can document environmental events in their communities and submit their observations to an interactive platform. Submitters are encouraged to provide the meta-data of the events, such as time, location, and witnessed impacts. Independent experts review the accuracy of the submission while ensuring the descriptions are respectful of personal privacy and community traditions. The data, as well as the analytical findings, are provided on the platform and are open to various groups of interested users and the general public. For local residents, the findings can inform them of social, economic, and environmental concerns in their communities. The platform is also a venue through which they can share community concerns with relevant agencies. For scientists, the findings can be another source of data that complements other indicators to form a more complete understanding of the changing Arctic. For entrepreneurs and policymakers, it is a window into the challenges and opportunities faced by local communities, which can guide strategic planning and define priorities. For sustainability research, more broadly, this study paves the way for harnessing computational techniques to extract insights from increasingly large, complex, and diverse data.

Author Contributions

Conceptualization, X.Z. and T.J.P.; methodology, X.Z.; formal analysis, X.Z.; data curation, X.Z., T.J.P., M.A.A. and A.B.; writing—original draft preparation, X.Z.; writing—review and editing, X.Z., T.J.P., M.A.A. and A.B.; visualization, X.Z. and M.A.A.; supervision, T.J.P., A.B. and X.Z.; project administration, T.J.P., A.B. and X.Z.; funding acquisition, T.J.P. All authors have read and agreed to the published version of the manuscript.

Funding

Approved for Public Release. Distribution is Unlimited. This material is based upon work supported by the Broad Agency Announcement Program and the Cold Regions Research and Engineering Laboratory (ERDC-CRREL) under Contract W913E522C0001.

Institutional Review Board Statement

Not applicable.

Informed Consent Statement

Not applicable.

Data Availability Statement

The data for this study are available in the Open Science Framework at https://osf.io/emcsx/?view_only=60dcca91126e4ae69cdc6aeeac4b9398.

Acknowledgments

The authors want to thank three anonymous reviewers for their substantive and constructive feedback on an earlier version of the paper and the Local Environmental Observer (LEO) network for providing the data used in this study.

Conflicts of Interest

The authors declare no conflict of interest. The funders had no role in the design of the study; in the collection, analyses, or interpretation of data; in the writing of the manuscript; or in the decision to publish the results.

Disclaimer

Any opinions, findings and conclusions or recommendations expressed in this material are those of the authors and do not necessarily reflect the views of the Broad Agency Announcement Program and ERDC-CRREL.

Appendix A

Figure A1. Markov chain Monte Carlo (MCMC) diagnostics for ERGM (Model 3).
Sustainability 14 16493 g0a1
Figure A2. Goodness-of-fit diagnostics for ERGM (Model 3).
Sustainability 14 16493 g0a2

References

  1. Rantanen, M.; Karpechko, A.Y.; Lipponen, A.; Nordling, K.; Hyvärinen, O.; Ruosteenoja, K.; Vihma, T.; Laaksonen, A. The Arctic Has Warmed Nearly Four Times Faster than the Globe since 1979. Commun. Earth Environ. 2022, 3, 168. [Google Scholar] [CrossRef]
  2. Moon, T.A.; Druckenmiller, M.L.; Thoman, R.L. Arctic Report Card; NOAA: Washington, DC, USA, 2021. [CrossRef]
  3. Peng, G.; Matthews, J.L.; Wang, M.; Vose, R.; Sun, L. What Do Global Climate Models Tell Us about Future Arctic Sea Ice Coverage Changes? Climate 2020, 8, 15. [Google Scholar] [CrossRef] [Green Version]
  4. Miner, K.R.; Turetsky, M.R.; Malina, E.; Bartsch, A.; Tamminen, J.; McGuire, A.D.; Fix, A.; Sweeney, C.; Elder, C.D.; Miller, C.E. Permafrost Carbon Emissions in a Changing Arctic. Nat. Rev. Earth Environ. 2022, 3, 55–67. [Google Scholar] [CrossRef]
  5. Schuur, E.A.G.; McGuire, A.D.; Schädel, C.; Grosse, G.; Harden, J.W.; Hayes, D.J.; Hugelius, G.; Koven, C.D.; Kuhry, P.; Lawrence, D.M.; et al. Climate Change and the Permafrost Carbon Feedback. Nature 2015, 520, 171–179. [Google Scholar] [CrossRef] [PubMed]
  6. Nielsen, D.M.; Pieper, P.; Barkhordarian, A.; Overduin, P.; Ilyina, T.; Brovkin, V.; Baehr, J.; Dobrynin, M. Increase in Arctic Coastal Erosion and Its Sensitivity to Warming in the Twenty-First Century. Nat. Clim. Change 2022, 12, 263–270. [Google Scholar] [CrossRef]
  7. Lara, M.J.; Nitze, I.; Grosse, G.; Martin, P.; McGuire, A.D. Reduced Arctic Tundra Productivity Linked with Landform and Climate Change Interactions. Sci. Rep. 2018, 8, 2345. [Google Scholar] [CrossRef] [Green Version]
  8. Feng, D.; Gleason, C.J.; Lin, P.; Yang, X.; Pan, M.; Ishitsuka, Y. Recent Changes to Arctic River Discharge. Nat. Commun. 2021, 12, 6917. [Google Scholar] [CrossRef]
  9. Udawalpola, M.R.; Hasan, A.; Liljedahl, A.; Soliman, A.; Terstriep, J.; Witharana, C. An Optimal GeoAI Workflow for Pan-Arctic Permafrost Feature Detection from High-Resolution Satellite Imagery. Photogramm. Eng. Remote Sens. 2022, 88, 181–188. [Google Scholar] [CrossRef]
  10. Zhang, W.; Witharana, C.; Liljedahl, A.; Kanevskiy, M. Deep Convolutional Neural Networks for Automated Characterization of Arctic Ice-Wedge Polygons in Very High Spatial Resolution Aerial Imagery. Remote Sens. 2018, 10, 1487. [Google Scholar] [CrossRef]
  11. Bhuiyan, M.A.E.; Witharana, C.; Liljedahl, A.K. Use of Very High Spatial Resolution Commercial Satellite Imagery and Deep Learning to Automatically Map Ice-Wedge Polygons across Tundra Vegetation Types. J. Imaging 2020, 6, 137. [Google Scholar] [CrossRef]
  12. Witharana, C.; Bhuiyan, M.A.E.; Liljedahl, A.K.; Kanevskiy, M.; Epstein, H.E.; Jones, B.M.; Daanen, R.; Griffin, C.G.; Kent, K.; Ward Jones, M.K. Understanding the Synergies of Deep Learning and Data Fusion of Multispectral and Panchromatic High Resolution Commercial Satellite Imagery for Automated Ice-Wedge Polygon Detection. ISPRS J. Photogramm. Remote Sens. 2020, 170, 174–191. [Google Scholar] [CrossRef]
  13. Liljedahl, A.K.; Jones, B.M.; Brubaker, M.; Budden, A.E.; Cervenec, J.M.; Grosse, G.; Jones, M.B.; Marini, L.; McHenry, K.; Moss, J.; et al. Permafrost Discovery Gateway: A Web Platform to Enable Discovery and Knowledge-Generation of Permafrost Big Imagery Products. In Proceedings of the EPIC3AGU Fall Meeting 2019, San Francisco, CA, USA, 9–13 December 2019; AGU: San Francisco, CA, USA, 2019. [Google Scholar]
  14. Katlein, C.; Fernández-Méndez, M.; Wenzhöfer, F.; Nicolaus, M. Distribution of Algal Aggregates under Summer Sea Ice in the Central Arctic. Polar Biol. 2015, 38, 719–731. [Google Scholar] [CrossRef] [Green Version]
  15. Manos, E.; Witharana, C.; Udawalpola, M.R.; Hasan, A.; Liljedahl, A.K. Convolutional Neural Networks for Automated Built Infrastructure Detection in the Arctic Using Sub-Meter Spatial Resolution Satellite Imagery. Remote Sens. 2022, 14, 2719. [Google Scholar] [CrossRef]
  16. Mosites, E.; Lujan, E.; Brook, M.; Brubaker, M.; Roehl, D.; Tcheripanoff, M.; Hennessy, T. Environmental Observation, Social Media, and One Health Action: A Description of the Local Environmental Observer (LEO) Network. One Health 2018, 6, 29–33. [Google Scholar] [CrossRef]
  17. EMAN. Improving Local Decision-Making through Community Based Monitoring: Toward a Canadian Community Monitoring Network; Environment Canada: Ottawa, ON, Canada, 2003; ISBN 978-0-662-33894-9.
  18. Danielsen, F.; Topp-Jørgensen, E.; Levermann, N.; Løvstrøm, P.; Schiøtz, M.; Enghoff, M.; Jakobsen, P. Counting What Counts: Using Local Knowledge to Improve Arctic Resource Management. Polar Geogr. 2014, 37, 69–91. [Google Scholar] [CrossRef]
  19. Johnson, N.; Alessa, L.; Behe, C.; Danielsen, F.; Gearheard, S.; Gofman-Wallingford, V.; Kliskey, A.; Krümmel, E.-M.; Lynch, A.; Mustonen, T.; et al. The Contributions of Community-Based Monitoring and Traditional Knowledge to Arctic Observing Networks: Reflections on the State of the Field. ARCTIC 2015, 68, 28. [Google Scholar] [CrossRef] [Green Version]
  20. Danielsen, F.; Johnson, N.; Lee, O.; Fidel, M.; Iversen, L.; Poulsen, M.K.; Eicken, H.; Albin, A.; Hansen, S.G.; Pulsifer, P.L.; et al. Community-Based Monitoring in the Arctic; University of Alaska Press: Fairbanks, AK, USA, 2021. [Google Scholar]
  21. Huntington, H.P. The Local Perspective. Nature 2011, 478, 182–183. [Google Scholar] [CrossRef]
  22. Conrad, C.C.; Hilchey, K.G. A Review of Citizen Science and Community-Based Environmental Monitoring: Issues and Opportunities. Environ. Monit. Assess. 2011, 176, 273–291. [Google Scholar] [CrossRef]
  23. Andrachuk, M.; Marschke, M.; Hings, C.; Armitage, D. Smartphone Technologies Supporting Community-Based Environmental Monitoring and Implementation: A Systematic Scoping Review. Biol. Conserv. 2019, 237, 430–442. [Google Scholar] [CrossRef]
  24. Lazer, D.M.J.; Pentland, A.; Watts, D.J.; Aral, S.; Athey, S.; Contractor, N.; Freelon, D.; Gonzalez-Bailon, S.; King, G.; Margetts, H.; et al. Computational Social Science: Obstacles and Opportunities. Science 2020, 369, 1060–1062. [Google Scholar] [CrossRef]
  25. Hirschberg, J.; Manning, C.D. Advances in Natural Language Processing. Science 2015, 349, 261–266. [Google Scholar] [CrossRef] [PubMed]
  26. Vayansky, I.; Kumar, S.A.P. A Review of Topic Modeling Methods. Inf. Syst. 2020, 94, 101582. [Google Scholar] [CrossRef]
  27. Blei, D.M. Probabilistic Topic Models. Commun. ACM 2012, 55, 77–84. [Google Scholar] [CrossRef] [Green Version]
  28. Maier, D.; Waldherr, A.; Miltner, P.; Wiedemann, G.; Niekler, A.; Keinert, A.; Pfetsch, B.; Heyer, G.; Reber, U.; Häussler, T.; et al. Applying LDA Topic Modeling in Communication Research: Toward a Valid and Reliable Methodology. Commun. Methods Meas. 2018, 12, 93–118. [Google Scholar] [CrossRef]
  29. Yang, H.-L.; Chang, T.-W.; Choi, Y. Exploring the Research Trend of Smart Factory with Topic Modeling. Sustainability 2018, 10, 2779. [Google Scholar] [CrossRef] [Green Version]
  30. Choi, D.; Song, B. Exploring Technological Trends in Logistics: Topic Modeling-Based Patent Analysis. Sustainability 2018, 10, 2810. [Google Scholar] [CrossRef] [Green Version]
  31. Zhu, X. Mapping Linguistic Shifts during Psychological Coping with the COVID-19 Pandemic. J. Lang. Soc. Psychol. 2022, 1–14. [Google Scholar] [CrossRef]
  32. Vincent, W.F.; Lemay, M.; Allard, M. Arctic Permafrost Landscapes in Transition: Towards an Integrated Earth System Approach. Arct. Sci. 2017, 3, 39–64. [Google Scholar] [CrossRef] [Green Version]
  33. Wasserman, S.; Faust, K. Social Network Analysis, Methods and Applications; Cambridge University Press: Cambridge, UK, 1994. [Google Scholar]
  34. Doerfel, M.L. What Constitutes Semantic Network Analysis? A Comparison of Research and Methodologies. Connections 1998, 21, 16–26. [Google Scholar]
  35. Borge-Holthoefer, J.; Arenas, A. Semantic Networks: Structure and Dynamics. Entropy 2010, 12, 1264–1302. [Google Scholar] [CrossRef]
  36. Park, K.; Kim, H.; Rim, H. Exploring Variations in Corporations’ Communication after a CA versus CSR Crisis: A Semantic Network Analysis of Sustainability Reports. Int. J. Bus. Commun. 2020, 2329488420907148. [Google Scholar] [CrossRef]
  37. Lee, J. Analyzing Local Opposition to Biosphere Reserve Creation through Semantic Network Analysis: The Case of Baekdu Mountain Range, Korea. Land Use Policy 2019, 82, 61–69. [Google Scholar] [CrossRef]
  38. Walter, D.; Ophir, Y. News Frame Analysis: An Inductive Mixed-Method Computational Approach. Commun. Methods Meas. 2019, 13, 248–266. [Google Scholar] [CrossRef]
  39. Wang, P.; Pattison, P.; Robins, G. Exponential Random Graph Model Specifications for Bipartite Networks—A Dependence Hierarchy. Soc. Netw. 2013, 35, 211–222. [Google Scholar] [CrossRef]
  40. Blei, D.M.; Ng, A.Y.; Jordan, M.I. Latent Dirichlet Allocation. J. Mach. Learn. Res. 2003, 3, 993–1022. [Google Scholar]
  41. Griffiths, T.L.; Steyvers, M. Finding Scientific Topics. Proc. Natl. Acad. Sci. 2004, 101, 5228–5235. [Google Scholar] [CrossRef] [Green Version]
  42. Britt, B.C.; Britt, R.K. From Waifus to Whales: The Evolution of Discourse in a Mobile Game-Based Competitive Community of Practice. Mob. Media Commun. 2021, 9, 3–29. [Google Scholar] [CrossRef]
  43. Wang, Y.; Taylor, J.E. DUET: Data-Driven Approach Based on Latent Dirichlet Allocation Topic Modeling. J. Comput. Civ. Eng. 2019, 33, 04019023. [Google Scholar] [CrossRef]
  44. Borgatti, S.P.; Halgin, D.S. Analyzing Affiliation Networks. In The SAGE Handbook of Social Network Analysis; SAGE Publications Ltd.: London, UK, 2014; pp. 417–433. ISBN 978-1-84787-395-8. [Google Scholar]
  45. Nitze, I.; Cooley, S.W.; Duguay, C.R.; Jones, B.M.; Grosse, G. The Catastrophic Thermokarst Lake Drainage Events of 2018 in Northwestern Alaska: Fast-Forward into the Future. Cryosphere 2020, 14, 4279–4297. [Google Scholar] [CrossRef]
  46. Jorgenson, M.T.; Grosse, G. Remote Sensing of Landscape Change in Permafrost Regions. Permafr. Periglac. Process. 2016, 27, 324–338. [Google Scholar] [CrossRef]
  47. Nelson, D.R.; Adger, W.N.; Brown, K. Adaptation to Environmental Change: Contributions of a Resilience Framework. Annu. Rev. Environ. Resour. 2007, 32, 395–419. [Google Scholar] [CrossRef]
  48. Hox, J. Multilevel Analysis: Techniques and Applications, 3rd ed.; Routledge Academic: New York, NY, USA, 2018. [Google Scholar]
  49. Bordignon, F. A Scientometric Review of Permafrost Research Based on Textual Analysis (1948–2020). Scientometrics 2021, 126, 417–436. [Google Scholar] [CrossRef]
  50. Krishnamoorthy, S. Linguistic Features for Review Helpfulness Prediction. Expert Syst. Appl. 2015, 42, 3751–3759. [Google Scholar] [CrossRef]
  51. Stephen, K. Societal Impacts of a Rapidly Changing Arctic. Curr. Clim. Change Rep. 2018, 4, 223–237. [Google Scholar] [CrossRef] [Green Version]
  52. Ford, J.D.; King, N.; Galappaththi, E.K.; Pearce, T.; McDowell, G.; Harper, S.L. The Resilience of Indigenous Peoples to Environmental Change. One Earth 2020, 2, 532–543. [Google Scholar] [CrossRef]
  53. Cunsolo, A.; Ellis, N.R. Ecological Grief as a Mental Health Response to Climate Change-Related Loss. Nat. Clim. Change 2018, 8, 275–281. [Google Scholar] [CrossRef]
  54. Gassiy, V.; Potravny, I. The Compensation for Losses to Indigenous Peoples Due to the Arctic Industrial Development in Benefit Sharing Paradigm. Resources 2019, 8, 71. [Google Scholar] [CrossRef] [Green Version]
  55. Potravnaya, E.; Kim, H.-J. Economic Behavior of the Indigenous Peoples in the Context of the Industrial Development of the Russian Arctic: A Gender-Sensitive Approach. Reg. Reg. Stud. Russ. East. Eur. Cent. Asia 2020, 9, 101–126. [Google Scholar] [CrossRef]
  56. Potravnaya, E.V. Social Problems of Industrial Development of the Arctic Territories. J. Sib. Fed. Univ. Humanit. Soc. Sci. 2021, 14. [Google Scholar] [CrossRef]
Figure 1. Geographic distribution of the reported events across the northern circumpolar region.
Sustainability 14 16493 g001
Figure 2. Optimal number of topics based on Griffiths and Steyvers’ maximization algorithm [41].
Sustainability 14 16493 g002
Figure 3. Topic–document networks over the years.
Sustainability 14 16493 g003
Figure 4. Topic degree centrality.
Sustainability 14 16493 g004
Figure 5. Topic betweenness centrality.
Sustainability 14 16493 g005
Table 1. Cluster pairwise intersections between topics.
1234567
1. Animal behavior
2. Climate change0.10 (27)
3. Natural disasters0.06 (18)0.08 (22)
4. Permafrost changes0.08 (20)0.05 (13)0.10 (22)
5. Infrastructure/Transportation0.10 (26)0.17 (40)0.10 (25)0.13 (29)
6. Fisheries0.10 (22)0.11 (25)0.13 (26)0.09 (18)0.07 (17)
7. Community life0.16 (32)0.07 (18)0.05 (12)0.10 (19)0.10 (23)0.14 (24)
8. Energy0.12 (28)0.11 (27)0.14 (31)0.14 (28)0.15 (33)0.11 (22)0.10 (21)
Note: Jaccard index is shown outside the parentheses. Inside the parentheses are cluster pairwise intersections.
Table 2. B-ERGM predicting document–topic association.
Model 1Model 2Model 3
Network Parameters
 Density−1.54 ** (0.04)−1.46 ** (0.13)−2.21 ** (0.16)
 Degree1.65 ** (0.19)1.68 ** (0.20)1.71 ** (0.20)
Document Attributes
 Location 0.12 (0.09)
 Source −0.12 (0.11)
 Month −0.01 (0.01)
Shared Attributes
 Nearby location 0.005 ** (0.001)
 Same source 0.001 (0.001)
 Same month 0.01 (0.006)
Model Information
 Akaike information criterion574657475736
Notes. B-ERGM refers to bipartite exponential random graph modeling. Standard errors of the model parameters are enclosed in parentheses. Network parameters are statistical terms that control for endogenous effects due to network structure. Document attributes are variables that describe individual documents. Shared attributes are variables that describe a pair of documents (i.e., their similarities or differences). ** p < 0.01, p = 0.05.
Publisher’s Note: MDPI stays neutral with regard to jurisdictional claims in published maps and institutional affiliations.

