Article

Does Local Confucian Culture Affect Corporate Environmental, Social, and Governance Ratings? Evidence from China

1
College of Finance & Statistics, Hunan University, Changsha 410006, China
2
Asia Pacific Applied Economics Association, Melbourne 3000, Australia
3
Faculty of Environment, School of Environment, Enterprise and Development (SEED), University of Waterloo, 200 University Avenue West, Waterloo, ON N2L 3G1, Canada
4
Business School, Hunan University, Changsha 410012, China
5
Research Institute of Digital Society and Blockchain, Hunan University, Changsha 410082, China
6
School of Public Administration, Hunan University, Changsha 410082, China
7
Centre for Resource and Environmental Management, Hunan University, Changsha 410082, China
8
The Energy Centre, University of Auckland, Auckland 1010, New Zealand
*
Authors to whom correspondence should be addressed.
Sustainability 2022, 14(24), 16374; https://doi.org/10.3390/su142416374
Submission received: 24 October 2022 / Revised: 22 November 2022 / Accepted: 6 December 2022 / Published: 7 December 2022
(This article belongs to the Topic Energy Economics and Sustainable Development)

Abstract

:
We investigate the influence of local Confucian culture on firms’ commitment to environment, social, and governance (ESG). We hypothesize that local Confucian culture will encourage firms to increase their commitment and effort to ESG practices, as a basic idea of Confucianism is akin to the golden rule, which dictates that one must treat people fairly and well if one wishes to be treated the same manner. Using geographic distances to local Confucian temples and centers to create geographic proximity-based measures of local Confucian culture, we confirm that local Confucian culture in the vicinity of corporate headquarters is positively associated with firms’ ESG performance. Further, we hypothesize and find that the role of local Confucian culture is more prominent in state-owned firms, larger firms, firms with greater media coverage and analyst following, and in more recent years, when environmental, social, and governance practices are more relevant and receive greater attention. Our research shed light on studies evaluating the influence of local cultural norms on investment decisions within the framework of ESG.

1. Introduction

Environmental and climate issues are becoming more and more serious in recent years, and academia is paying more and more attention to related topics such as sustainability, carbon dioxide emissions, energy efficiency, and green investment, etc. [1,2,3,4,5]. Corporations around the world play a vital role in affecting the environment and the global climate. The debate on whether corporations should only care about the benefits of shareholders or the interests of a broad set of stakeholders including employees, customers, and other societal members, i.e., shareholder value versus stakeholder society, has attracted increasing attention from policymakers, practitioners, and academics and is becoming a burning topic because of increasing attention on global warming and other global environmental risks [6,7,8]. More importantly, a growing number of firms have incorporated environmental, social, and governance (ESG), which considers the interests of broad stakeholders, into their corporate policies [9,10,11]. In addition, a substantial number of investors have incorporated ESG criteria into their portfolio construction decisions [12,13]. Studies have examined the economic implications of ESG such as crash risk [14], financial performance [15], etc., and the resilient role of ESG during bad times [16,17]. Yet, what determines firms’ commitment to ESG has been an under-explored arena for scholars. Recent literature has mainly concentrated on regulations such as environmental regulations and mandatory disclosures [18,19,20], increasing demand from investors (see also, e.g., Jon Hale, “The ESG Fund Universe Is Rapidly Expanding”, Morningstar, 19 March 2020; McGee Suzanne, “‘Climate Funds’: Who’s Driving the Increased Demand”, Wall Street Journal, 18 November 2021) [21,22,23], competition [24], and firm characteristics such as board size and gender diversity [25], environmental sensitivity [26], firm size [27], and cross-listing [28], etc. Scarce literature has examined the influences of social values on corporate ESG commitment. Among a few, the effect of factors such as religious atmosphere [29,30], social capital [31], and national culture [32] on corporate social responsibility has been examined by scholars. However, these studies have only focused on social responsibility, which stands for a small portion of ESG connotation. Since individuals (managers) are susceptible to the surrounding social environments where they reside [33], we posit that some social values, i.e., Confucianism, could also add fuel to the engine of corporate commitment to ESG.
Confucianism, as a collection of doctrines to teach individuals to achieve a state of harmony with surrounding people and environment [34], would naturally provide firms an internal impetus to practice high-standard ESG and treat the broad set of interest groups well. Confucianism has influenced or shaped the culture of many Asian countries. The main idea of Confucianism is the importance of having good moral character and then influencing the world around that person through the idea of “universal harmony”. In addition, the moral quality of an individual is achieved through the virtues of benevolence or “humanity”, which can lead firms to treat their shareholders and other stakeholders, i.e., employees, customers, debt holders, etc., well. Therefore, local Confucian culture would have an impact on residing firms’ investment decisions in ESG-related activities such as improving the working environment, reducing polluting emissions, and treating the shareholders fairly and well. We hypothesize that the local Confucian culture surrounding corporate headquarters would be positively associated with firms ESG practices, i.e., higher ESG scores.
The potential of Confucianism on corporate social responsibility (CSR) has been discussed by several scholars theoretically [35,36]. However, few studies have empirically examined the role of Confucianism on CSR and a broader set of societal responsibilities on all stakeholders, that is, ESG per se. In this paper, we attempt to fill this gap by empirically examining the effect of Confucianism on firms’ ESG ratings. We collected the Confucian temples and centers and constructed the geographic proximity-based measures of the Confucian culture surrounding corporate headquarters. Our empirical evidence supports our hypothesis that firms surrounded by denser Confucian culture exhibit higher ESG scores.
We further examine whether certain factors would alter the relationship between local Confucian culture and ESG practices. First, the major constraint for local Confucian firms to devote to ESG practices is the payoff of such investment, and the payoff of the investment depends on whether related stakeholders can realize the benefits of ESG. For example, ESG investment could attract more socially responsible customers and investors if such investment could be better broadcasted among these parties. We postulate that the role of local Confucian culture may be more pronounced if firms receive more outside attention. Second, the objective of state-owned enterprises (SOE) firms is two-folds, creating wealth for their shareholders as well as maintaining society stability for all society members. As such, SOE managers would naturally be more inclined to perform ESG practices. We conjecture that local Confucian culture may play a more important role in firms’ ESG performances than in non-SOE firms. Furthermore, large firms are more likely to care about the ESG scores because of more available resources for ESG disclosure [27], and we postulate that local Confucian culture is more important in supporting ESG activities in large firms than in small firms. Finally, ESG is becoming more and more popular from the media and catching more and more investors’ eyes in recent years; thus, we conjecture that the role of local Confucian culture should be more prominent. Our empirical results support the above conjectures. We show that the role of local Confucian culture in improving ESG performance is more pronounced in SOE firms, in larger firms, in firms that are followed by a higher number of analysts and receive higher media coverage, and in the more recent period when ESG is becoming more relevant.
We contribute to the existing literature in several ways. First, we provide first-hand empirical evidence on the relationship between Confucianism and firms’ commitment to ESG. Second, we extend the existing literature on determinants of firms’ ESG to social cultures such as Confucian teaching. Third, we confirm that firms can benefit from the Confucian commitment to ESG, including achieving a lower cost of debt, higher return on assets (ROA), and higher valuation, which add to the long-lasting debate on whether firms should care about the interests of stakeholders. Finally, we add to a better understanding of the relationship between culture and firms’ decision making and policies, supplementing the emerging literature on culture and finance [37,38].
The remaining sections are structured as follows: Section 2 is the hypotheses development part. Section 3 outlines data and methodology. Section 4 provides empirical results, and Section 5 concludes.

2. Hypotheses Development

Confucianism, which was developed by Confucius and recorded and transmitted by his disciples around 2500 years ago, has played a crucial role in shaping the moral code of people historically. Confucian culture is still prevailing in society. Even though Confucianism has undergone some setbacks during the New Culture Movement in 1919 and the Culture Revolution during 1966–1976, the concept of Confucian culture has gradually recovered during the more recent period in China [39,40]. The core idea of Confucianism has an impact on the ideology of many politicians.
Many concepts from Confucianism are naturally related to ESG. The primary aim of Confucianism is to achieve ren, which describes a harmonious relationship among individuals in a society and, in particular, among stakeholders [41]. In addition, Confucianism addresses many virtuous personal moralities such as benevolence, righteousness, trustworthiness, etc., that can be applied to managers’ conscientiousness to the interests of shareholders and other stakeholders [34]. Furthermore, as discussed in the literature, ESG can be beneficial to firms in many aspects. For example, a better working environment will attract more talented people, generate high-quality patents, and improve working efficiency [42,43]; better CSR will improve consumers’ perception of brand image [44,45]; and better ESG performance is associated with easier access to the capital market and lower cost of capital [46,47]. The target for pursuing profits and the commitment to ESG can be unified under the Confucianism framework that cares about a broad set of interests of stakeholders and that aims to achieve a harmonious state in society. Accordingly, Confucian managers who are accountable to their shareholders will also contribute to ESG investment. Based on the above discussion, we formulate the following hypothesis:
Hypothesis 1 (H1).
Ceteris paribus, ESG scores are positively associated with local Confucian culture surrounding corporate headquarters.
The primary obstacle for firms to invest in ESG is the fiduciary duty of managers. That is, managers should only be accountable for their employers, the vast shareholders. Hoverer, if public view toward firms’ ESG investment is not negative and sometimes changed to positive due to increasing risks of not caring about environmental issues, i.e., more fines from violating environment laws, and due to more addressing on the benefits of ESG from various aspects, i.e., improving the public image of firms, attracting talented employees, and increasing efficiency from satisfied workers, etc., Confucianism may complement ESG, especially in firms receiving high attention, i.e., high media coverage and more analyst following, where the benefits of such ESG commitment could be more clearly illustrated by analysts and better achieved by broadcasting through media. In addition, local Confucian culture may also play a more important role in recent years because of the resonance between the rising emphasis on ESG and the internal impetus on consideration of the interests of a broader set of stakeholders provided by Confucianism. Accordingly, we purpose the following two hypotheses:
Hypothesis 2 (H2).
Ceteris paribus, local Confucian culture can improve ESG more in firms with higher media coverage or analyst following.
Hypothesis 3 (H3).
The positive relationship between local Confucian culture and ESG is more significant in the more recent period.
SOE firms occupy a considerable proportion of both the number and the capitalization of the listed firms in China [48]. The mission of state-owned firms is not only to pursue profits but also to convey political and social objectives such as reducing the unemployment rate and retaining social stability, which is somewhat in accordance with Confucianism. Thus, SOE firms may give Confucianism more space in implementing ESG policies, and Confucian managers in SOEs may practice better ESG since Confucianism inherently will care about the interests of the broad set of stakeholders and so do the SOE firms. Therefore, we formulate the following hypothesis:
Hypothesis 4 (H4).
The role of local Confucian culture could be more pronounced in spurring ESG performance in SOE firms than in private-owned ones.
Previous studies suggest that firm size is a determinant factor that influence firms’ ESG scores [27,49,50]. They generally show that large firms have better ESG ratings since large firms may have more extra resources to deploy for ESG efforts than smaller firms. If local Confucian culture is an internal driving factor for firms’ commitment and effort to ESG activities, firms surrounded by a denser local Confucian culture would be more willing to deploy ESG-friendly actions. However, such willingness for ESG activities should be constrained by firms’ usable resources. Larger firms would have more resources and therefore are subject to lower resources constrains, whereas small firms would have limited resources and therefore have higher constrains in performing ESG activities. Thus, we should observe that the effect of local Confucian culture on ESG scores is more pronounced in large-sized firms than in small-sized firms. Based on the discussion, we formulate the following hypothesis.
Hypothesis 5 (H5).
The role of local Confucian culture could be more pronounced in spurring ESG performance in large firms than in small ones.

3. Research Design

3.1. Variables Definition and Sample Construction

Confucius temples and centers are always surrounded by dense Confucian teaching activities [51]. Based on this, we collected the addresses of Confucius temples and Confucius centers by hand from various sources such as the Baidu map, Baidu search engine, and the website http://www.chinakongmiao.org (accessed on 1 January 2020), etc. We eventually collected 513 Confucius temples and centers. The measurement procedure of Confucian culture is as follows: First, we used Google Earth to check and record the latitude and longitude of each Confucius temple or center. Secondly, we obtained the latitude and longitude of the headquarter of each listed firm from CAMAR. Thirdly, we calculated paired distance between each Confucius temple or center and the address of the headquarter of each listed firm using the geodist command in Stata. Geodist calculates geographical distances using Vincenty’s (1975) [52] formula, which measures the length of the shortest path between two points along the surface of a spheroid. At last, following Du [40], the Confucianism measure was finally obtained as the natural logarithm of one plus the number of Confucius temples and centers surrounding the corporate headquarter within a radius of, say, 100 km (CONFUC1), 200 km (CONFUC2), or 300 km (CONFUC3).
The measure can capture local Confucian culture for two main reasons. First, in Confucianism history, all Confucius temples are accompanied by Confucian academies. The Confucian academics play a vital role in teaching and transmitting Confucian ideas, which can largely influence the perception of Confucianism in local communities surrounding the Confucian temple. Second, the academy students may succeed in the imperial examinations and become government officials, which can also encourage the transmission of Confucian culture locally.
The ESG ratings of each firm were obtained from the Wind database, and the rating agency is the Sino-Securities Index, which is a leading ESG rating provider focusing on the Chinese A-share market firms. The evaluation system of Sino-Securities Index consists of three levels: The first-level indicators are environment, society, and corporate governance. The second-level indicators are 14 subjects under the three first-level indicators. For example, the second-level indicators under the first-level environmental indicator include environmental management and environmental events. The third-level indicator contains 26 key indicators. The Sino-Securities Index adopts the industry weighted average method for ESG scoring and gives nine grades of AAA-C according to the scores.
The various control variables were collected from the China Securities Market and Accounting Research database (CSMAR). Definitions of variables are presented in Table 1. We excluded firms in the financial industry because of the different accounting standards for these firms. Our data span from 2009 to 2020 and consists of 29,922 firm-year observations. All the variables were winsorized at 1% and 99%.
Panel A of Table 2 reports the summary statistics of local Confucian culture measures. The mean values of CONFUC1, CONFUC2, and CONFUC3 are 1.883, 2.733, and 3.307, respectively, suggesting that on average the number of Confucius temples and centers located within the radius of 100 km, 200 km, and 300 km surrounding the corporate headquarters are 5.573 (e^1.883−1), 14.379 (e^2.733−1), and 26.303 (e^3.307−1), separately. The standard deviations are 0.711, 0.762, and 0.749, respectively, indicating that there are relatively sufficient variations in our local Confucian culture measures. In Panel B and C, we report the summary statistics of local Confucian cultures in large versus small-sized firms and in SOE versus non-SOE firms, respectively.
In Table 2, Panel D, we sort firms into high and low Confucianism cohorts based on the median value of CONFUC1 and compare the key variables between the two cohorts. At the first glimpse, ESG scores are significantly higher in firms with high Confucianism, supporting Hypothesis 1.

3.2. Model Specification

To examine the relationship between Confucianism and ESG performance outlined in Hypothesis 1, we employed two model specifications, i.e., the OLS and ordered probit models. The OSL model specification is as follows:
E S G i t = β 0 + β 1 C o n f u c i a n i t + β 2 C o n t r o l s i t + I n d u s t r y   F E + Y e a r   F E + ε i t
where E S G i t is the ESG ratings of firm i in year t. The original ESG ratings are ranked as AAA, AA, A, BBB, BB, B, CCC, CC, and C. For regression purposes, we reassign them as 9, 8, …, and 1, accordingly. C o n f u c i a n i t represents the local Confucian culture. We include a set of variables that are widely used in corporate finance studies, including Size, BTM, Leverage, ROA, FCF, and SOE. Size is the natural logarithm of the total asset. BTM is the ratio of the book value of equity to the market value of equity. Leverage is the ratio of a firm’s total debt to its total asset. ROA is the return on assets. FCF is free cash flow. SOE is an indicator variable that takes the value of 1 if the firm’s final controller is a state-owned asset management agency and 0 otherwise. The detailed definitions of variables can be found in Table 1. I n d u s t r y   F E and Y e a r   F E stands for the industry and year fixed effects, which can partly roll out omitted variables fixed over time and within industries. We also employed an ordered probit model because the dependent variable is an ordinal variable spanning from 1 to 9 according to firms’ ESG ratings. Note that in the robustness checks and cross-sectional analysis, we only employ fixed-effect panel regressions in our model specifications for interpretation convenience.

4. Empirical Results

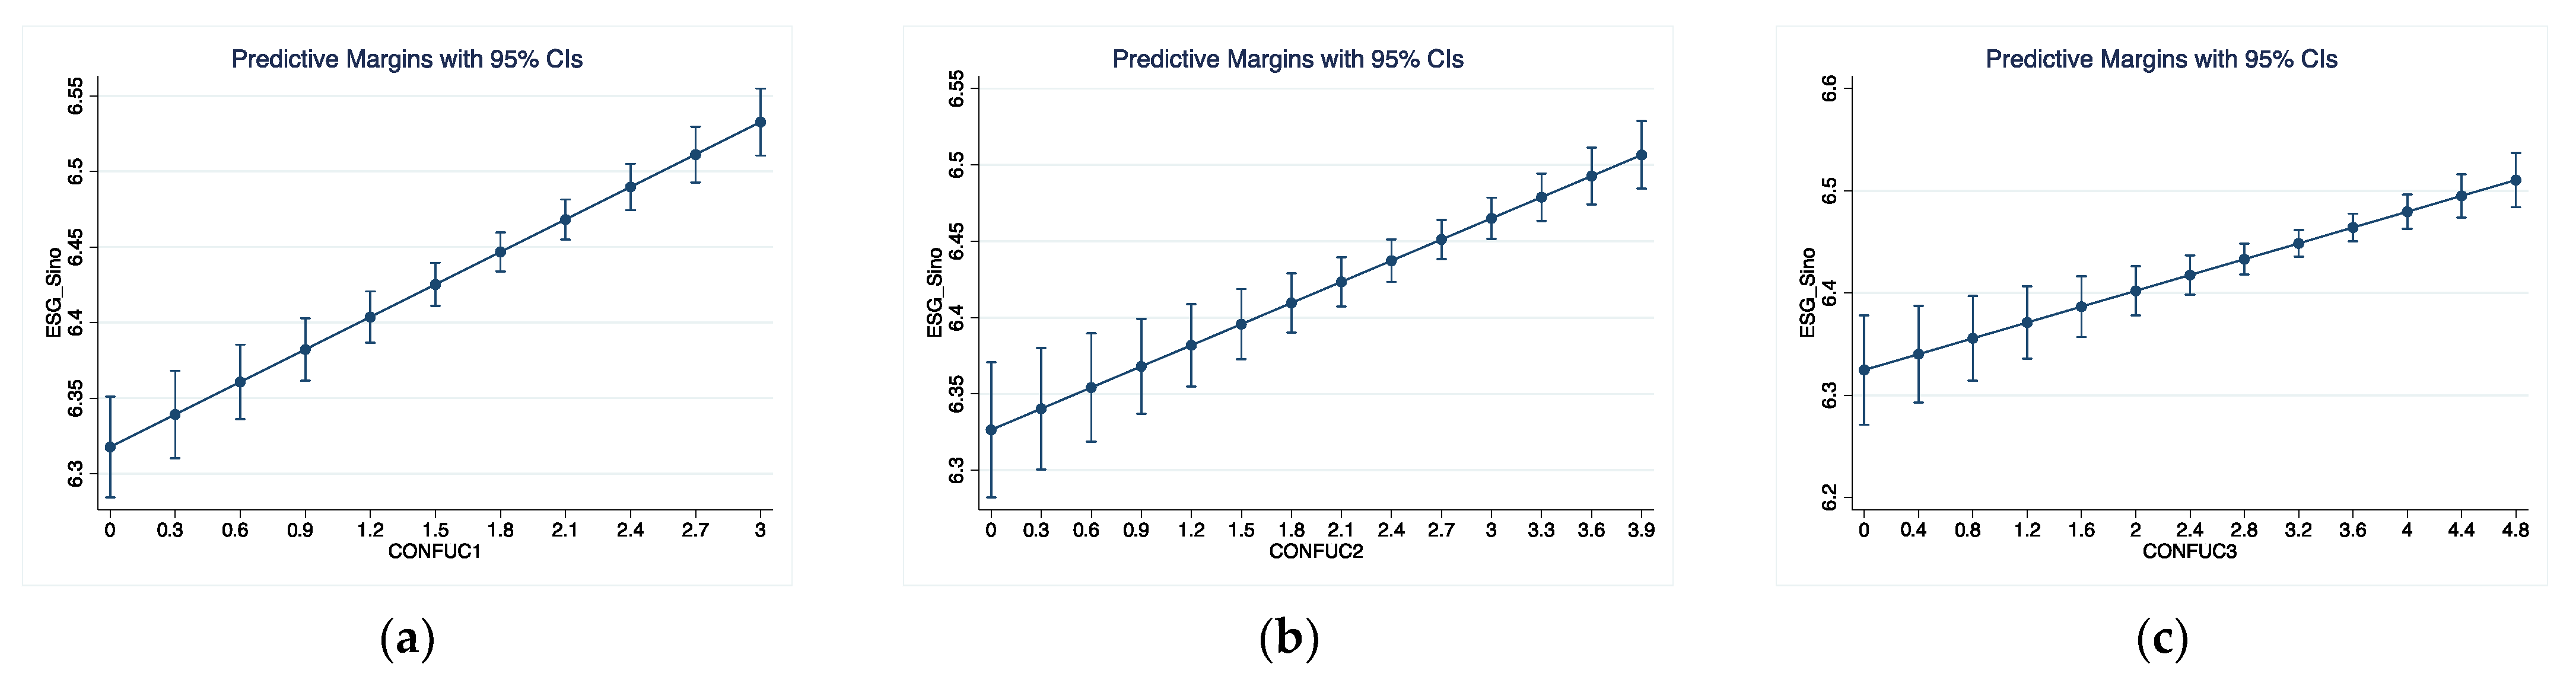
4.1. Baseline Regression

Table 3 presents the baseline results with fixed-effect panel regressions and ordered probit models. The coefficients of the three measures of Confucianism, namely CONFUC1, CONFUC2, and CONFUC3, from the fixed-effect regressions in column (1) to column (3) are all positive and significant at the 1% level, indicating a consistent positive relationship between Confucianism and firms’ ESG performance. The significance has not only statistical meanings but also economic implications. Take column (1) for example: one standard deviation increase in CONFUC1 is associated with an increment of 0.031 in corporate ESG scores, that is, a 3.1% of possibility of going to the next rating level. Under the ordered probit model, column (4) through column (6) also confirm that a denser Confucianism is associated with a higher likelihood of higher ESG scores. The above evidence consistently supports Hypothesis 1.
With reference to the control variables, the coefficients on Size in all the six columns are positive and significant, indicating that in larger firms the ESG performance is better than in smaller firms. BTM is negatively related to firms’ ESG performance, suggesting that firms with a higher valuation exhibit better ESG practices. ROA and free cash flow (FCF) are positively related to firms’ ESG. The reason could be that firms with higher profitability are more likely to care about all the stakeholders. The coefficients on SOE are positive and significant at the 1% significance level across all columns, which is consistent with the public view that SOE firms are more socially responsible.
Next, we plotted the average marginal effect of Confucian culture measures on ESG in Figure 1 using the Stata command “margins” and “marginsplot”, which indicates the average change in ESG ratings when the local Confucian culture changes holding other covariates constant. The plotted margins are based on the OLS model from column (1) through column (3) in Table 3. As shown in all the subfigures of Figure 1, the lines representing the marginal effects of Confucian culture are steep, which indicates that firms’ ESG ratings are positively associated with their surrounding Confucian culture values.

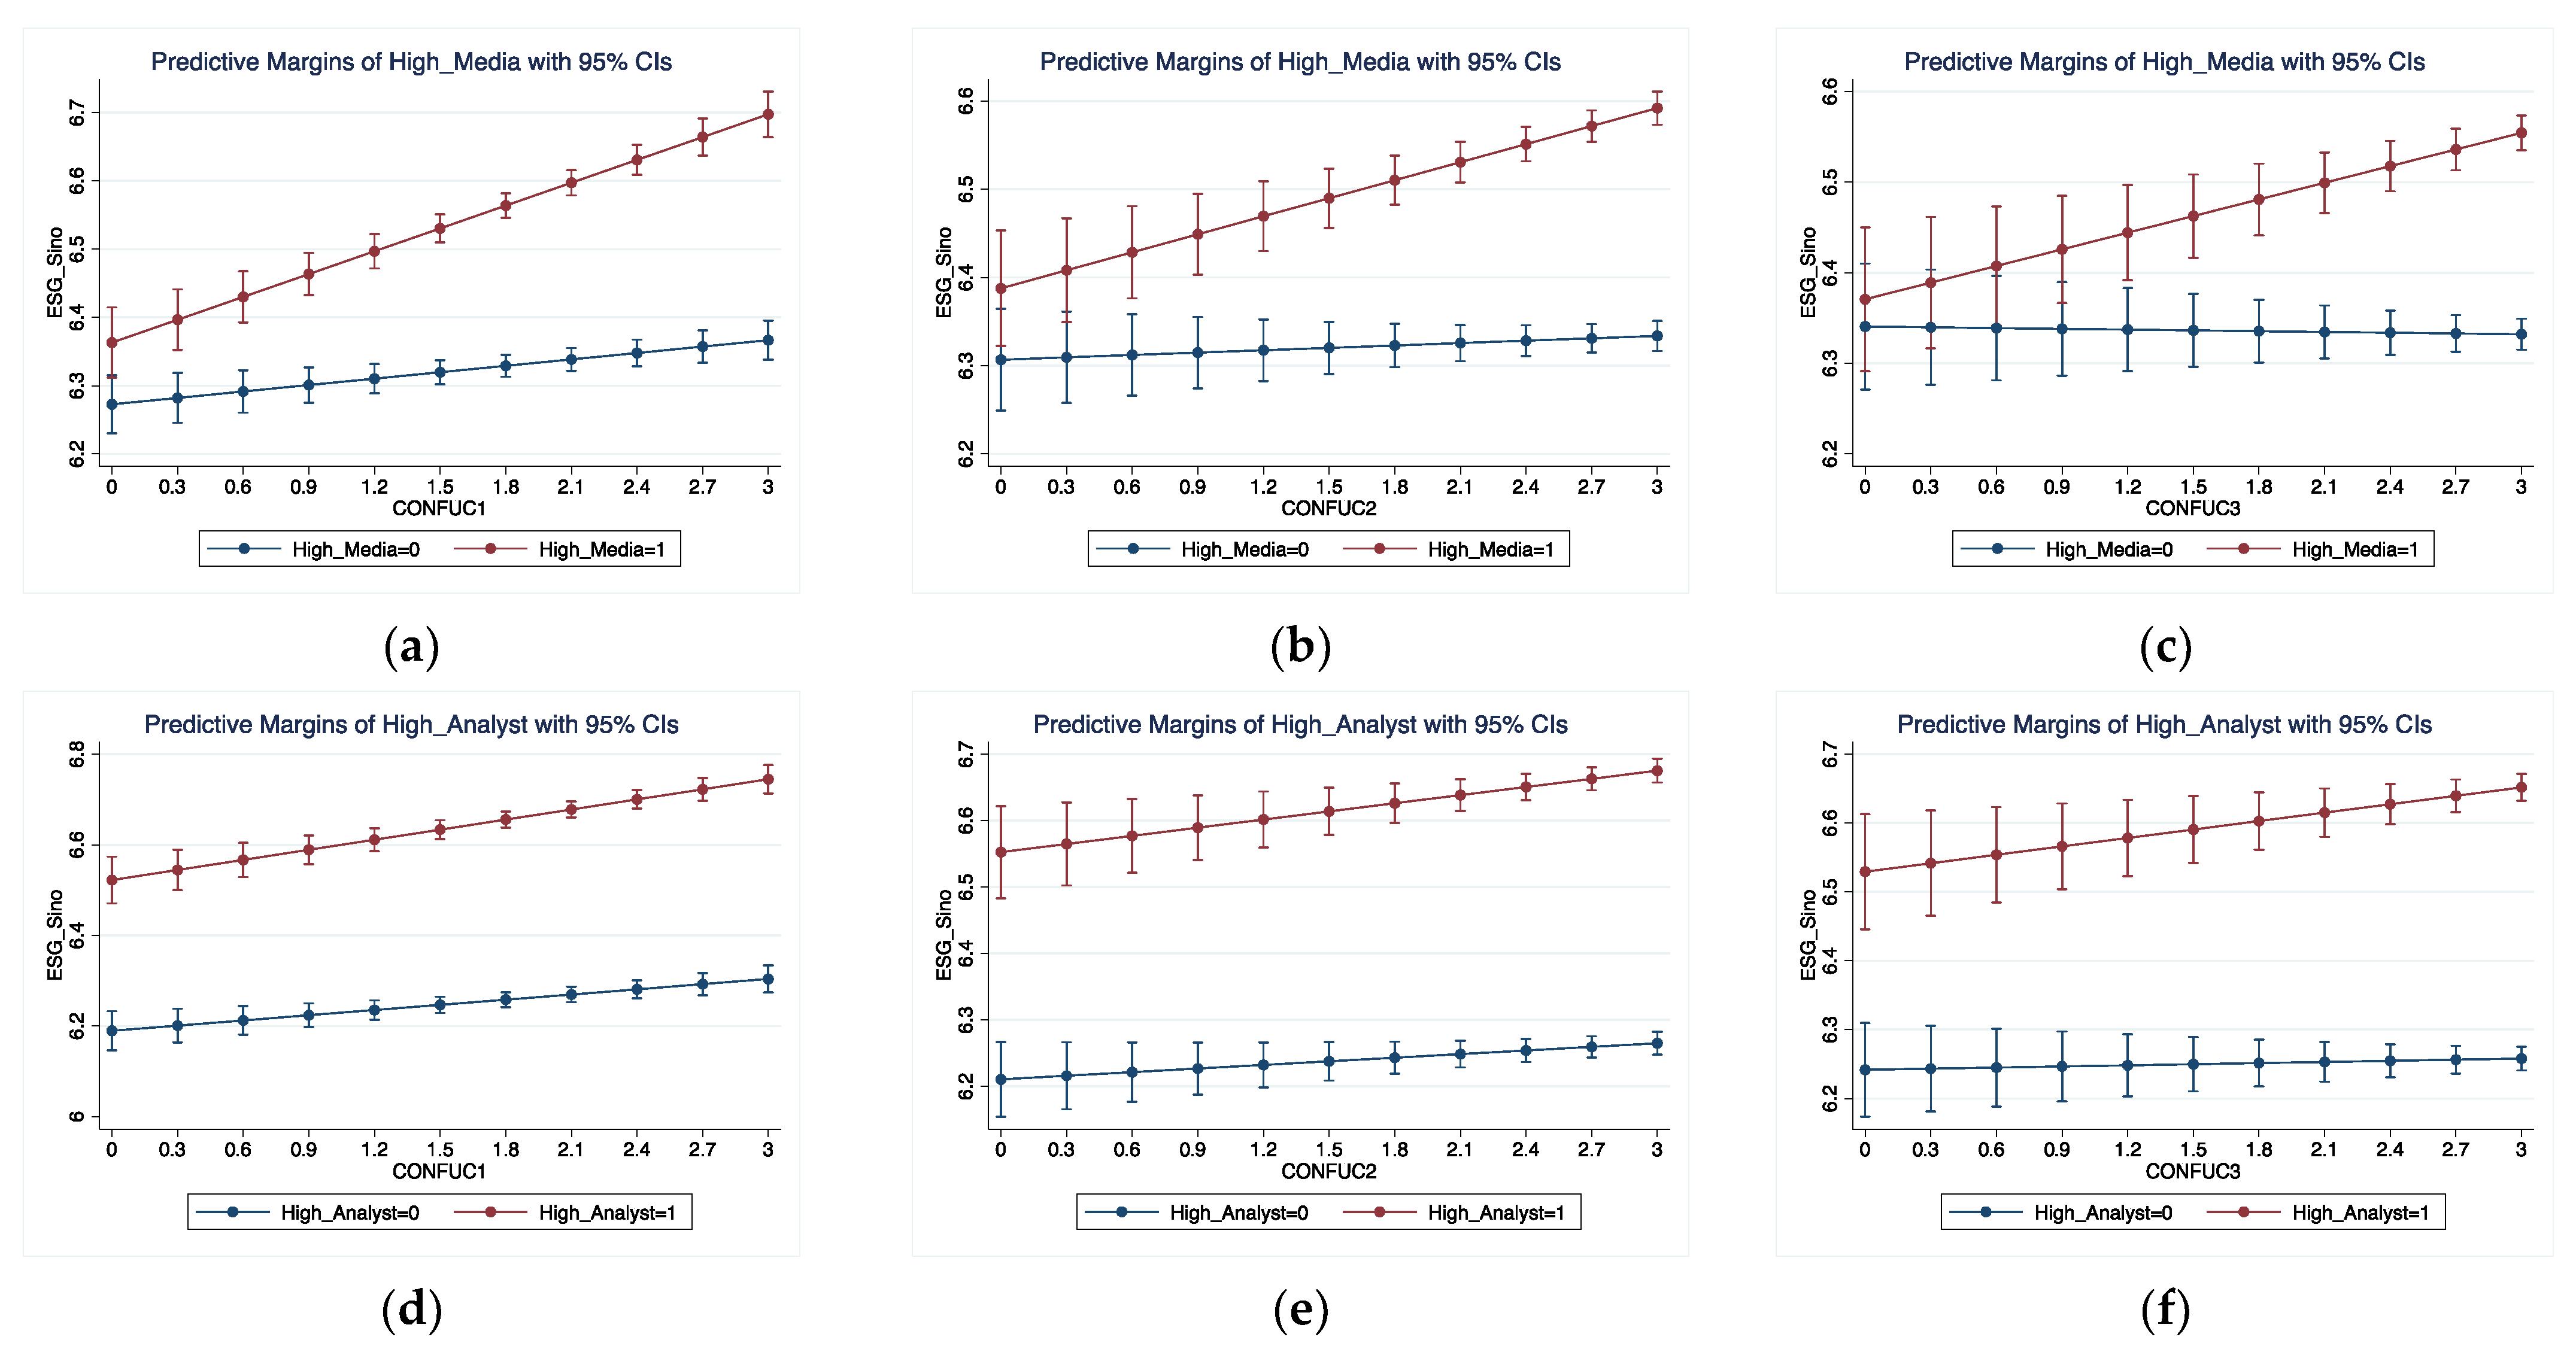
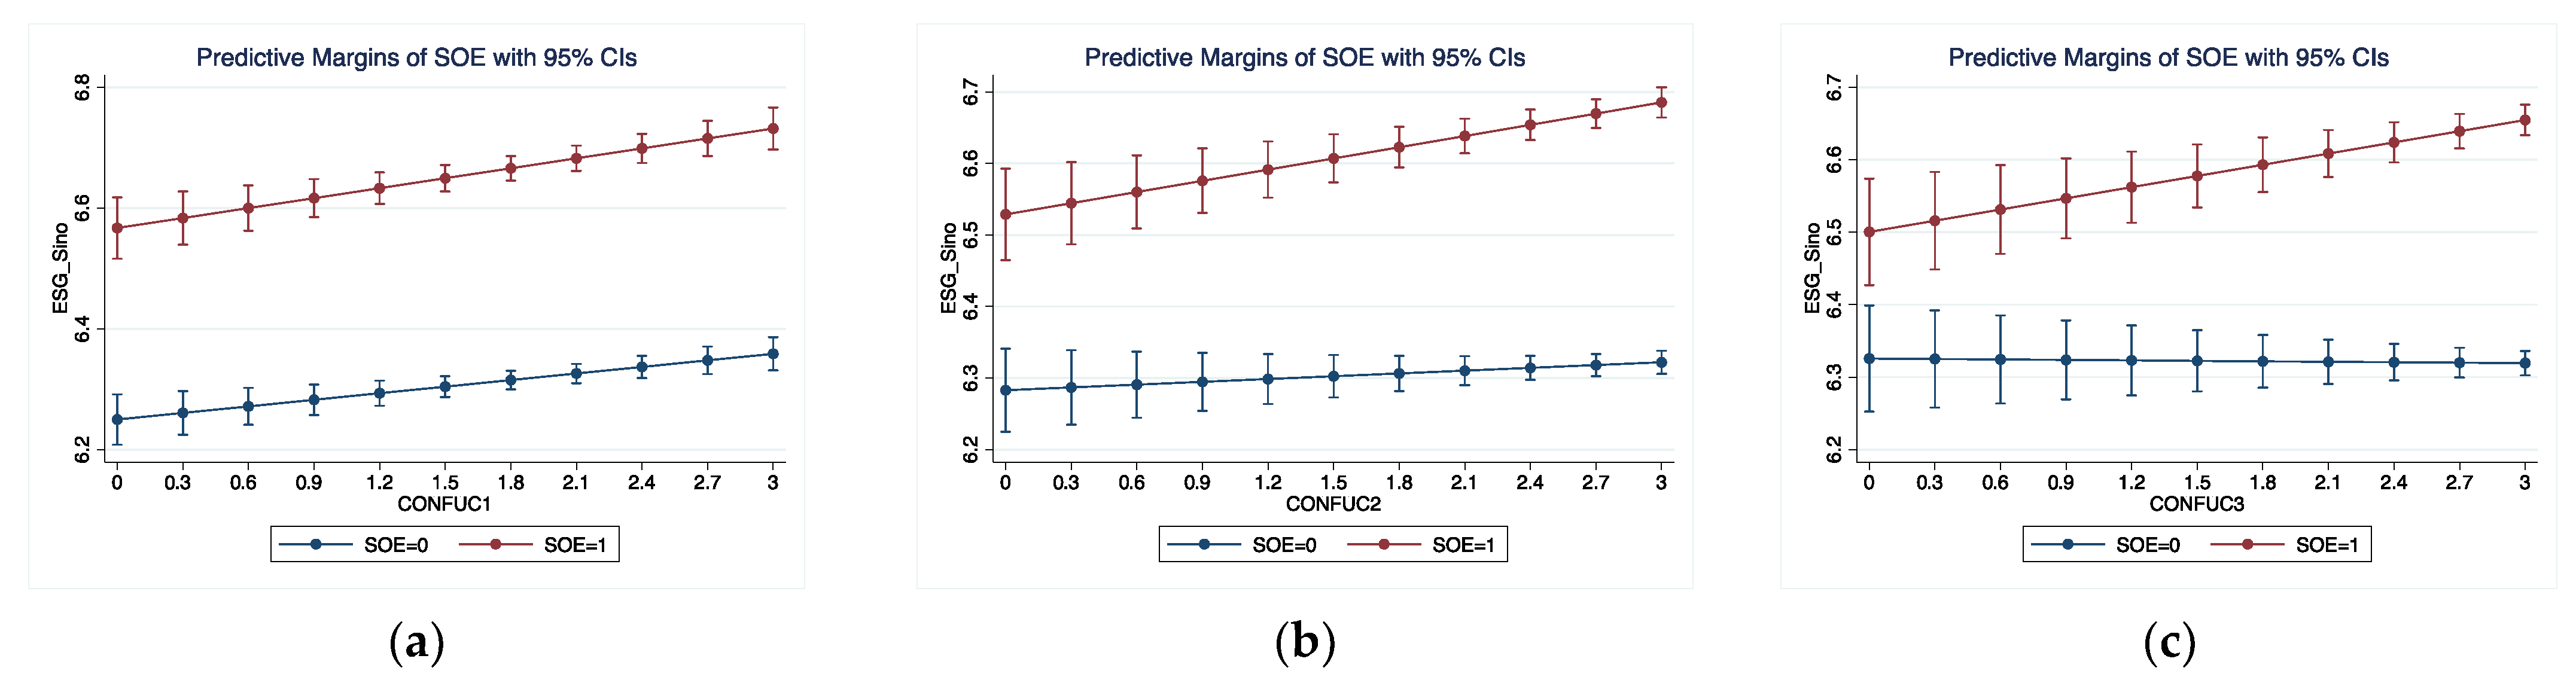
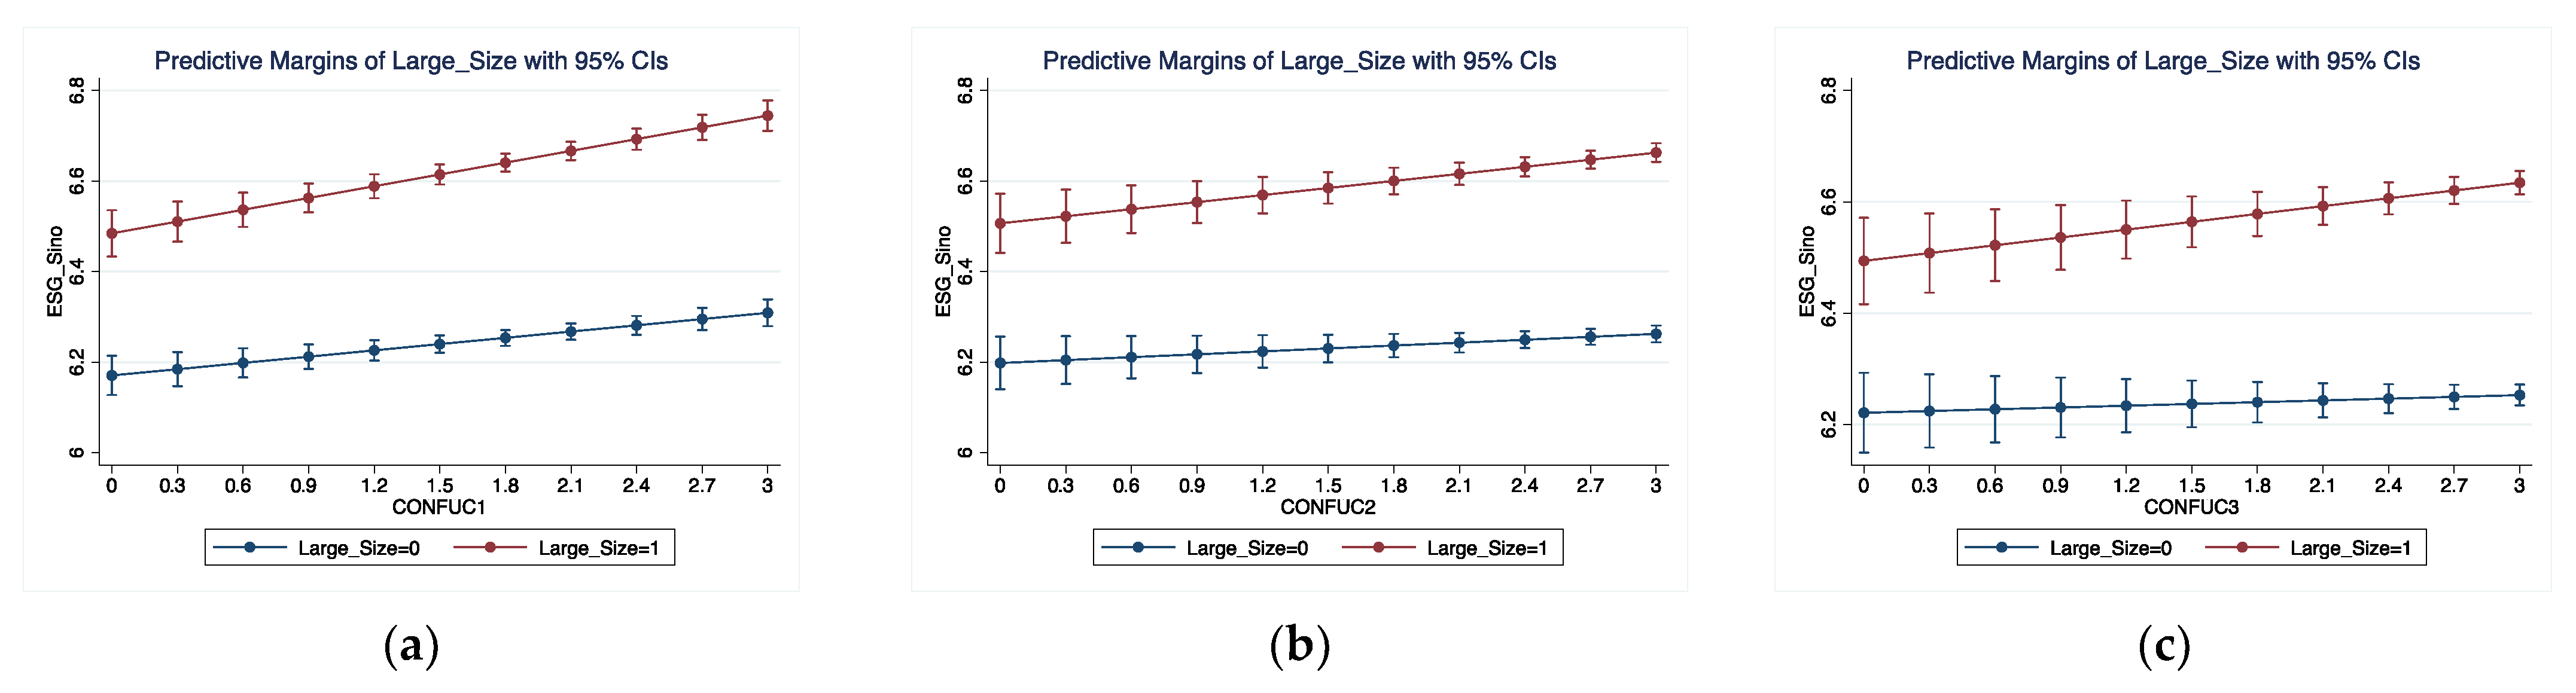
4.2. Test of Hypotheses 2~5

In this section, we provide empirical evidence testing Hypotheses 2 to 5. We first provide evidence regarding Hypothesis 2 in Table 4. Because media coverage may contribute to better awareness of firms’ ESG commitment to related stakeholders, i.e., customers, socially responsible investors, etc., the role of local Confucian culture could be more pronounced in firms with higher media coverage. We constructed the media coverage variable by aggregating all pieces of news appearing in more than 500 media outlets from CNRDS and define High_Media as an indicator variable that equals 1 if the number of news pieces exceeds the annual sample median, and 0 otherwise. In Panel A, we include the interaction term between High_Media and local Confucian culture measures, i.e., CONFUC1, CONFUC2, and CONFUC3 in the baseline regression as presented in Equation (1). In Panel A, the coefficients of the interaction term between the high media coverage dummy High_Media and Confucian culture measures are all positive and significant at the 1% level, indicating that Confucianism could increase ESG ratings more in firms receiving high media coverage, which is consistent with Hypothesis 2.
We plotted the interaction effects of attention in Figure 2. The regression models used in the margins plot graph are the same as in Table 4. As seen in Figure 2a–c, the “High_Media = 1” lines are steeper than the “High_Media = 0” lines, indicating that the effects of Confucian culture on firms’ ESG ratings are stronger in firms with higher media coverage than that with lower media coverage, vividly supporting Hypothesis 2. We also plotted the interaction effects of analyst coverage in Figure 2. As seen in Figure 2d–f, the “High_Analyst = 1” lines are steeper than the “High_Analyst = 0” lines, indicating that the effect of Confucian culture on firms’ ESG ratings are stronger if firms are followed by higher numbers of analysts, which also supports Hypothesis 2.
We also constructed another attention variable, High_Analyst, which is a dummy variable that takes the value of 1 if the annual number of analysts following a particular firm exceeds the annual sample median of the number of analysts and 0 otherwise. In Panel B, the interaction terms between High_Analyst and all the three Confucian culture measures are positive and significant at or above the 5% significance level, suggesting that Confucianism is more important in improving ESG performance if firms are followed by more analysts. The above results also provide supportive evidence for Hypothesis 2.
We next examine whether the role of Confucian culture is more relevant in improving corporate ESG performance in the more recent period. As discussed in the hypotheses development section, ESG is receiving increasing attention recently, and if local Confucian culture can echo firms’ efforts to ESG, we should observe a more pronounced role of Confucian culture. In Table 5, we provide evidence regarding Hypothesis 3. We use the year 2013 as a cut-off between recent and early periods because after President Xi Jinping took the office in 2013, the government placed more importance on environmental issues. In Table 5, we report the baseline regression estimates in the period between 2009–2012 and 2013–2020 in the odd-numbered and even-numbered columns, respectively. Consistent with our anticipation from Hypothesis 3, the evidence shows that the significance levels and the magnitudes of the coefficients on all the three Confucian culture measures are higher in the relatively later regression period.
We plotted the interaction effects of property rights in Figure 3. The regression models used in the margins plot graph are the same as in Table 6. As can be seen in the figure, the slope of “SOE = 1” line and the “SOE = 0” line show no difference in Figure 3a, whereas the “SOE = 1” lines are steeper than the “SOE = 0” lines in both Figure 3b,c, indicating that the effects of Confucian culture on firms’ ESG ratings are stronger in SOE firms than that in non-SOE firms, which generally supports Hypothesis 4.
Then, we check whether Confucian culture is more important in encouraging firms to perform good ESG practices in SOE firms. SOE firms have dual objectives in daily operating practices. One is to create wealth for shareholders, and the other is to maintain society stability, such as reducing the unemployment rate. In addition, the managers of SOEs are supervised by the State-owned Assets Supervision and Administration Commission of the State Council (SASAC). Managers in SOEs value political promotion as well as other benefits such as compensation, and a better personal reputation in improving ESG-related activities may add value to their political careers. Therefore, local Confucian culture may play a more important role in affecting firms’ ESG practices in SOEs than in non-SOES. We test the conjecture in Table 6.
In Table 6, we define SOE as a dummy variable that is equal to 1 if the firm’s ultimate controller is a state-owned asset management agency and 0 otherwise. We include the interaction term between the SOE indicator and local Confucian culture measures in our baseline regression as presented in Equation (1). We expect a positive coefficient on the interaction term. As one can see from Table 6, the coefficients on CONFUC1(CONFUC2, CONFUC3) × SOE are all positive, with two out of three being significant at or above the 5% significance levels, generally supporting Hypothesis 4 that local Confucian culture is more important in improving ESG practices among SOE firms.
At last, we check Hypothesis 5. That is, whether local Confucian culture is more important in ESG supply in large firms than in small firms. We defined Large_Size as a dummy variable that equals to 1 if one firm’s total asset at the end of the fiscal year is above the sample median at the end of the fiscal year and 0 otherwise. We incorporated the interplay between three measures of local Confucian culture and the large firm dummy (Large_Size) in the baseline regression in Equation (1). We expect that the coefficient on the interplay of local Confucian culture and Large_Size is positive and significant. The empirical results from Table 7 confirm the conjecture. As shown in Table 7, the coefficient on three interplay terms, CONFUC1 × Large_Size, CONFUC2 × Large_Size, and CONFUC3 × Large_Size in three equations are all positive and significant at the 5% level. The above results show that local Confucian culture plays a more prominent role in spurring ESG activities among large firms than among small firms, supporting Hypothesis 5.
We plotted the interaction effects of firm size in Figure 4. The regression models used in the margins plot graph are the same as in Table 7. As seen in Figure 4a–c, the “Large_Size = 1” lines are steeper than the “Large_Size = 0” lines, indicating that the effects of Confucian culture on firms’ ESG ratings are stronger in large firms than in small firms, vividly supporting Hypothesis 5.

4.3. Robustness Checks

To better ascertain the relationship between local Confucian culture and firms’ ESG performance, we perform two main robustness tests in the following. The first is related to an instrumental variable approach, and the second is related to the change of measurement of key dependent and independent variables.

4.3.1. Instrumental Variable Regression

To account for potential endogeneity biases, following Fu, Ma, and Tian [51], we used the natural logarithm of one plus the number of Jinshi, the most prestigious degree from the ancient imperial examination system, in each province as the instrument of Confucianism. A valid instrument variable should satisfy two criteria: one is that the instrument should be correlated with the local Confucian culture measure, and two is that the instrument should not be correlated with the residual in the regression of ESG (the exclusion restriction). The number of Jinshi in one province should be correlated with Confucius teaching activities in one province since the Confucian academies are accompanied by the Confucian temples in history, which is the driving force for the success of acquiring Jinshi in the ancient time. However, there is no reason that the number of Jinshi in ancient times can have an impact on ESG.
In Panel B of Table 8, we report the results regarding the first stage of the instrumental variable regression. The coefficients on Jinshi are all positive and significant through all three columns, confirming a strong positive relation between Jinshi and three Confucianism proxies. In Panel A of Table 8, we report the second stage results of the IV-2SLS and IV-ordered-probit regressions. The first three columns are related to the IV-2SLS, and the last three columns are related to the IV-ordered-probit model. The results show that coefficients on CONFUC1, CONFUC2, and CONFUC3 are all positive and significant, further supporting Hypothesis 1 that local Confucian culture can have a positive impact on firms’ ESG performance.

4.3.2. Alternative Measures of Local Confucian Culture and ESG

In this section, we change measures of local Confucian culture and use ESG scores from different assessing agencies to further test the relationship between local Confucian culture and firms’ ESG performance. The results are presented in Table 9. In Panel A, we change the measuring radius of Confucianism to different distances such as 120 km, 140 km, etc., and obtain a set of Confucianism measures including CONFUC120, CONFUC140, etc. The regression estimates of corporate ESG on all Confucianism measures are consistently positive and significant at the 1% level. In Panel B, we calculate CONFUC1_prov, CONFUC2_prov, and CONFUC3_prov using Confucius temples and centers at or above the provincial level. The results are still consistent with the abovementioned results. In Panel C, we obtain ESG scores from another two rating sources, namely SynTao Green Finance (SynTao_ESG) and Wind (Wind_ESG). Since SynTao Green Finance and Wind only rate firms included in CSI 300 Index and CSI Smallcap 500 Index after 2016, we have a relatively smaller sample size. In Table 9, Panel C, all the coefficients on Confucianism measures are positive, and the significance levels are at or above the 5% significance level from the regressions. These results suggest a consistent positive relationship between Confucianism and firms’ ESG performance.

5. Concluding Remarks

This paper examines the relationship between Confucianism and firms’ ESG performance and finds that Confucianism as a moral philosophy and virtue teaching can improve firms’ ESG performance. The relationship between Confucianism and firms’ ESG scores is more prominent in state-owned firms, in firms with higher media coverage and analyst following, and when the authorities place more emphasis on environmental issues after 2013.
Overall, the results of this paper reveal an altruistic character of managers regarding Confucianism in that not only cares about the interest of shareholders but also the interests of a broad set of stakeholders. Finally, this character of doing good for a group of stakeholders can also contribute to better profitability, cheaper debt costs, and firm value through ESG commitments.

Author Contributions

Conceptualization, P.F., Y.T. and Y.-S.R.; methodology, P.F.; software, P.F. and Y.-S.R.; validation, P.F. and Y.T.; formal analysis, P.F., Y.T. and Y.-S.R.; investigation, P.F., Y.T. and Y.-S.R.; resources, S.W.N.; data curation, P.F.; writing—original draft preparation, P.F. and Y.T.; writing—review and editing, P.F., S.W.N., O.W. and Y.-S.R.; visualization, P.F. and Y.T.; supervision, S.W.N. and O.W.; project administration, S.W.N. and O.W.; funding acquisition, Y.-S.R. All authors have read and agreed to the published version of the manuscript.

Funding

This work was supported by the National Natural Science Foundation of China (grant number 71850012, 72104075), Hunan Provincial Science and Technology Department (grant number 2018GK1020), and National Social Science Fund of China (grant number 19AZD014), the Natural Science Foundation of Hunan Province (grant number 2022JJ40106), the Hunan Social Science Achievement Review Committee (grant number XSP21YBC087), and Outstanding Youth Scientific Research of Education Department in Hunan Province (grant number 19B314).

Conflicts of Interest

No potential conflict of interest was reported by the authors.

References

  1. Dietzenbacher, E.; Pei, J.; Yang, C. Trade, production fragmentation, and China’s carbon dioxide emissions. J. Environ. Econ. Manag. 2012, 64, 88–101. [Google Scholar] [CrossRef]
  2. Narayan, P.K.; Rizvi, S.A.R.; Sakti, A. Did green debt instruments aid diversification during the COVID-19 pandemic? Financ. Innov. 2022, 8, 21. [Google Scholar] [CrossRef] [PubMed]
  3. Narayan, P.K.; Saboori, B.; Soleymani, A. Economic growth and carbon emissions. Econ. Model. 2016, 53, 388–397. [Google Scholar] [CrossRef]
  4. Wen, F.; Wu, N.; Gong, X. China’s carbon emissions trading and stock returns. Energy Econ. 2020, 86, 104627. [Google Scholar] [CrossRef]
  5. Xia, Y.; Yang, C.; Chen, X. Structural decomposition analysis on China’s energy intensity change for 1987–2005. J. Syst. Sci. Complex. 2012, 25, 156–166. [Google Scholar] [CrossRef]
  6. Brower, J.; Mahajan, V. Driven to be good: A stakeholder theory perspective on the drivers of corporate social performance. J. Bus. Ethics 2013, 117, 313–331. [Google Scholar] [CrossRef]
  7. Laplume, A.O.; Sonpar, K.; Litz, R.A. Stakeholder theory: Reviewing a theory that moves us. J. Manag. 2008, 34, 1152–1189. [Google Scholar] [CrossRef]
  8. Hart, O.; Zingales, L. Companies should maximize shareholder welfare not market value. ECGI-Financ. Work. Pap. 2017, 2, 247–274. [Google Scholar]
  9. Bénabou, R.; Tirole, J. Individual and corporate social responsibility. Economica 2010, 77, 1–19. [Google Scholar] [CrossRef] [Green Version]
  10. Eccles, R.G.; Ioannou, I.; Serafeim, G. The impact of corporate sustainability on organizational processes and performance. Manag. Sci. 2014, 60, 2835–2857. [Google Scholar] [CrossRef] [Green Version]
  11. Flammer, C.; Kacperczyk, A. The impact of stakeholder orientation on innovation: Evidence from a natural experiment. Manag. Sci. 2016, 62, 1982–2001. [Google Scholar] [CrossRef]
  12. Christensen, D.M.; Serafeim, G.; Sikochi, S. Why is corporate virtue in the eye of the beholder? The case of ESG ratings. Account. Rev. 2022, 97, 147–175. [Google Scholar] [CrossRef]
  13. GSIA. Global Sustainable Investment Review. 2018. Available online: http://www.gsi-alliance.org/wp-content/uploads/2019/03/GSIR_Review2018.3.28.pdf (accessed on 8 August 2021).
  14. Feng, J.; Goodell, J.W.; Shen, D. ESG rating and stock price crash risk: Evidence from China. Financ. Res. Lett. 2021, 46, 102476. [Google Scholar] [CrossRef]
  15. Friede, G.; Busch, T.; Bassen, A. ESG and financial performance: Aggregated evidence from more than 2000 empirical studies. J. Sustain. Financ. Invest. 2015, 5, 210–233. [Google Scholar] [CrossRef] [Green Version]
  16. Broadstock, D.C.; Chan, K.; Cheng, L.T.; Wang, X. The role of ESG performance during times of financial crisis: Evidence from COVID-19 in China. Financ. Res. Lett. 2021, 38, 101716. [Google Scholar] [CrossRef] [PubMed]
  17. Singh, A. COVID-19 and safer investment bets. Financ. Res. Lett. 2020, 36, 101729. [Google Scholar] [CrossRef]
  18. Krueger, P.; Sautner, Z.; Tang, D.Y.; Zhong, R. The Effects of Mandatory ESG Disclosure around the World. SSRN 2021, 3832745. [Google Scholar] [CrossRef]
  19. Bruno, M.; Lagasio, V. An overview of the European policies on ESG in the banking sector. Sustainability 2021, 13, 12641. [Google Scholar] [CrossRef]
  20. Chen, Y.P.V.; Zhuo, Z.; Huang, Z.; Li, W. Environmental regulation and ESG of SMEs in China: Porter hypothesis re-tested. Sci. Total Environ. 2022, 850, 157967. [Google Scholar] [CrossRef]
  21. Friedman, H.L.; Heinle, M.S. Taste, information, and asset prices: Implications for the valuation of CSR. Rev. Account. Stud. 2016, 21, 740–767. [Google Scholar] [CrossRef] [Green Version]
  22. Geczy, C.; Stambaugh, R.F.; Levin, D. Investing in socially responsible mutual funds. SSRN 2005, 416380. [Google Scholar] [CrossRef]
  23. Heinkel, R.; Kraus, A.; Zechner, J. The effect of green investment on corporate behavior. J. Financ. Quant. Anal. 2001, 36, 431–449. [Google Scholar] [CrossRef]
  24. Martins, H.C. Competition and ESG practices in emerging markets: Evidence from a difference-in-differences model. Financ. Res. Lett. 2021, 46, 102371. [Google Scholar] [CrossRef]
  25. Dang, R.; Houanti, L.H.; Sahut, J.-M.; Simioni, M. Do women on corporate boards influence corporate social performance? A control function approach. Financ. Res. Lett. 2021, 39, 101645. [Google Scholar] [CrossRef]
  26. Garcia, A.S.; Mendes-Da-Silva, W.; Orsato, R.J. Sensitive industries produce better ESG performance: Evidence from emerging markets. J. Clean. Prod. 2017, 150, 135–147. [Google Scholar] [CrossRef]
  27. Drempetic, S.; Klein, C.; Zwergel, B. The influence of firm size on the ESG score: Corporate sustainability ratings under review. J. Bus. Ethics 2020, 167, 333–360. [Google Scholar] [CrossRef]
  28. Yu, E.P.-y.; Van Luu, B. International variations in ESG disclosure–Do cross-listed companies care more? Int. Rev. Financ. Anal. 2021, 75, 101731. [Google Scholar] [CrossRef]
  29. Du, X.; Du, Y.; Zeng, Q.; Pei, H.; Chang, Y. Religious atmosphere, law enforcement, and corporate social responsibility: Evidence from China. Asia Pac. J. Manag. 2016, 33, 229–265. [Google Scholar] [CrossRef]
  30. Zaman, R.; Roudaki, J.; Nadeem, M. Religiosity and corporate social responsibility practices: Evidence from an emerging economy. Soc. Responsib. J. 2018, 14, 368–395. [Google Scholar] [CrossRef]
  31. Hoi, C.K.; Wu, Q.; Zhang, H. Community social capital and corporate social responsibility. J. Bus. Ethics 2018, 152, 647–665. [Google Scholar] [CrossRef]
  32. Peng, Y.-S.; Dashdeleg, A.-U.; Chih, H.L. National Culture and Firm’s CSR Engagement: A Cross-Nation Study. J. Mark. Manag. 2014, 5, 38–49. [Google Scholar]
  33. Hoi, C.K.S.; Wu, Q.; Zhang, H. Does social capital mitigate agency problems? Evidence from Chief Executive Officer (CEO) compensation. J. Financ. Econ. 2019, 133, 498–519. [Google Scholar] [CrossRef]
  34. Yao, X. An Introduction to Confucianism; Cambridge University Press: Cambridge, UK, 2000. [Google Scholar]
  35. Low, K.C.P.; Ang, S.-L. Confucian leadership and corporate social responsibility (CSR), the way forward. J. Bus. Res. 2012, 2, 85–101. [Google Scholar] [CrossRef]
  36. Low, K.; Ang, S.-L. Confucian ethics, governance and corporate social responsibility. Int. J. Bus. Manag. 2013, 8, 30–43. [Google Scholar]
  37. Hilary, G.; Hui, K.W. Does religion matter in corporate decision making in America? J. Financ. Econ. 2009, 93, 455–473. [Google Scholar] [CrossRef]
  38. Deng, Y. Does Culture Matter in Corporate Cash Holdings? SSRN 2021, 3891206. [Google Scholar] [CrossRef]
  39. Du, X. Does religion matter to owner-manager agency costs? Evidence from China. J. Bus. Ethics 2013, 118, 319–347. [Google Scholar] [CrossRef] [Green Version]
  40. Du, X. Does Confucianism reduce minority shareholder expropriation? Evidence from China. J. Bus. Ethics 2015, 132, 661–716. [Google Scholar] [CrossRef]
  41. Wang, L.; Juslin, H. The impact of Chinese culture on corporate social responsibility: The harmony approach. J. Bus. Ethics 2009, 88, 433–451. [Google Scholar] [CrossRef]
  42. Chen, C.; Chen, Y.; Hsu, P.-H.; Podolski, E.J. Be nice to your innovators: Employee treatment and corporate innovation performance. J. Corp. Financ. 2016, 39, 78–98. [Google Scholar] [CrossRef] [Green Version]
  43. Huang, M.; Li, P.; Meschke, F.; Guthrie, J.P. Family firms, employee satisfaction, and corporate performance. J. Corp. Financ. 2015, 34, 108–127. [Google Scholar] [CrossRef]
  44. Melo, T.; Galan, J.I. Effects of corporate social responsibility on brand value. J. Brand Manag. 2011, 18, 423–437. [Google Scholar] [CrossRef] [Green Version]
  45. Servaes, H.; Tamayo, A. The impact of corporate social responsibility on firm value: The role of customer awareness. Manag. Sci. 2013, 59, 1045–1061. [Google Scholar] [CrossRef]
  46. El Ghoul, S.; Guedhami, O.; Kwok, C.C.; Mishra, D.R. Does corporate social responsibility affect the cost of capital? J. Bank. Financ. 2011, 35, 2388–2406. [Google Scholar] [CrossRef]
  47. Chi, W.; Chen, Y. Employee satisfaction and the cost of corporate borrowing. Financ. Res. Lett. 2021, 40, 101666. [Google Scholar] [CrossRef]
  48. Jiang, F.; Kim, K.A. Corporate governance in China: A survey. Rev. Financ. 2020, 24, 733–772. [Google Scholar] [CrossRef]
  49. Gregory, R.P. The influence of firm size on ESG score controlling for ratings agency and industrial sector. J. Sustain. Financ. Investig. 2022, 1–14. [Google Scholar] [CrossRef]
  50. Shakil, M.H. Environmental, social and governance performance and stock price volatility: A moderating role of firm size. J. Public Aff. 2022, 22, e2574. [Google Scholar] [CrossRef]
  51. Fu, P.; Ma, C.; Tian, Y. Does Confucianism mitigate informed insider trading? Evidence from China. SSRN 2021, 3953532. [Google Scholar] [CrossRef]
  52. Vincenty, T. Direct and inverse solutions of geodesics on the ellipsoid with application of nested equations. Surv. Rev. 1975, 23, 88–93. [Google Scholar] [CrossRef]
Figure 1. Average marginal effects of local Confucian culture on ESG performance. (a) Predictive margins as a function of CONFUC1. (b) Predictive margins as a function of CONFUC2. (c) Predictive margins as a function of CONFUC3.
Sustainability 14 16374 g001
Figure 2. Interaction plots of media coverage ((a)–(c)) and analyst coverage ((d)–(f)).
Sustainability 14 16374 g002
Figure 3. Interaction plots of property rights. (a) CONFUC1. (b) CONFUC2. (c) CONFUC3.
Sustainability 14 16374 g003
Figure 4. Interaction plots of firm size. (a) CONFUC1. (b) CONFUC2. (c) CONFUC3.
Sustainability 14 16374 g004
Table 1. Variable definitions.
VariablesDefinition
ESG_SinoESG scores are rated by the Sino-Securities Index. ESG was rated as AAA, AA, A, BBB, BB, B, CCC, CC, and C. We assigned them as 9, 8, …, and 1 correspondingly.
CONFUC1 (CONFUC2, CONFUC3)The natural logarithm of one plus the number of Confucius temples and centers within a radius of 100 (200, 300) km surrounding the headquarter of the listed firm.
SizeThe natural logarithm of the total asset at the end of the current fiscal year.
BTMThe ratio of the book value of equity to the market value of equity at the end of the current fiscal year.
LeverageThe ratio of a firm’s total debt to its total asset at the end of the current fiscal year.
ROAThe return on assets, calculated as the ratio of corporate annual earnings to its total asset at the end of the current fiscal year.
FCFFree cash flow, calculated as EBITDA (earnings before interest, taxes, depreciation, and amortization)—CWC (changes in working capital)—CAPEX (capital expenditure) then scaled by its total revenue at the end of the current fiscal year.
SOEAn indicator variable that takes the value of 1 if the firm’s final controller is a state-owned asset management agency and 0 otherwise.
High_MediaAn indicator variable that equals 1 if the number of news pieces mentioning one firm is above the median value across the fiscal year and 0 otherwise. The data are from the Chinese Research Data Services Platform.
High_AnalystA dummy variable that equals 1 if the number of analysts following the firm is above its median value in the fiscal year and 0 otherwise.
Table 2. Sample statistics and univariate comparison of key variables.
Panel A: Sample statistics of local Confucian culture measures
VariablesMeanP50SDP25P75N
CONFUC11.8832.0790.7111.6092.39829,922
CONFUC22.7332.8330.7622.7083.21929,922
CONFUC33.3073.4340.7493.3323.63829,922
Panel B: Sample statistics of local Confucian culture measures in large and small-sized firms
Large SizeSmall Size
VariablesMeanP50SDP25P75NMeanP50SDP25P75N
CONFUC11.8872.1970.7131.6092.39814,9591.8792.0790.7091.6092.39814,963
CONFUC22.7272.8330.7752.6393.21914,9592.7392.8330.7482.7083.21914,963
CONFUC33.3093.4340.7683.3323.66414,9593.3043.4660.7313.3323.63814,963
Panel C: Sample statistics of local Confucian culture measures in SOE and non-SOE firms
SOENon-SOE
MeanP50SDP25P75NMeanP50SDP25P75N
1.8312.0790.7551.3862.39811,4551.9152.0790.681.6092.39818,467
2.6712.8330.8362.6393.21911,4552.7712.8330.7092.7083.21918,467
3.273.4340.8453.3323.66411,4553.333.4660.6823.3323.63818,467
Panel D: Univariate comparison of key variables.
Full SampleHigh ConfuciusLow ConfuciusMean
(High-Low)
T-Stat
N = 29922N = 16226N = 13706
MeanMedianStd. Dev.MeanMedianStd. Dev.MeanMedianStd. Dev.
ESG_Sino6.45361.1326.49861.126.40261.1430.096 ***7.357
Size22.1321.971.33122.1922.011.39622.0621.921.2510.13 ***8.467
BTM0.6090.6070.250.6080.6040.250.610.610.249−0.002−0.782
Leverage0.4420.4330.2190.4370.4280.2180.4480.4380.22−0.011 ***−4.293
ROA0.03260.03490.07290.03460.03670.07120.03030.03280.07470.004 ***5.129
FCF−0.02540.02280.457−0.02320.02260.454−0.0280.02290.460.0050.905
SOE0.38300.4860.36900.4830.39800.489−0.029 ***−5.089
This table presents the summary statistics of three measures of local Confucian cultures in Panel A, summary statistics of local Confucian culture measures in large and small-sized firms based on the median value of the total assets of sample firms in Panel B, and summary statistics of local Confucian culture measures in SOE and non-SOE firms in Panel C. Panel D presents the univariate comparison of key variables from regions with high and low local Confucian cultures, respectively. The sample period spans from 2009 to 2020. The detailed definitions of variables are presented in Table 1. ***, represents p < 0.01.
Table 3. Baseline regression: ESG and Confucianism.
Dep. Var = ESG_Sino
Model: OLSModel: Ordered Probit
(1)(2)(3)(4)(5)(6)
CONFUC10.0442 *** 0.0497 ***
(0.0082) (0.009)
CONFUC2 0.031 *** 0.0348 ***
(0.0077) (0.0084)
CONFUC3 0.0239 *** 0.0258 ***
(0.0077) (0.0085)
Size0.3359 ***0.3377 ***0.3378 ***0.3731 ***0.3751 ***0.3752 ***
(0.0066)(0.0066)(0.0066)(0.0076)(0.0076)(0.0076)
BTM−0.329 ***−0.3335 ***−0.3349 ***−0.3652 ***−0.3702 ***−0.3717 ***
(0.0346)(0.0346)(0.0346)(0.038)(0.038)(0.0379)
Leverage−0.6603 ***−0.6641 ***−0.6652 ***−0.7226 ***−0.7267 ***−0.7278 ***
(0.0355)(0.0355)(0.0355)(0.0377)(0.0377)(0.0377)
ROA1.759 ***1.7537 ***1.7567 ***1.8532 ***1.8469 ***1.8503 ***
(0.1067)(0.1068)(0.1068)(0.1087)(0.1088)(0.1088)
FCF0.0444 ***0.0444 ***0.0444 ***0.0455 ***0.0455 ***0.0456 ***
(0.0139)(0.0139)(0.014)(0.0146)(0.0146)(0.0146)
SOE0.3515 ***0.3512 ***0.3503 ***0.391 ***0.3905 ***0.3894 ***
(0.014)(0.014)(0.014)(0.0156)(0.0156)(0.0156)
Constant−0.7625 ***−0.799 ***−0.7953 ***---
(0.1284)(0.1294)(0.1301)---
Year FEYesYesYesYesYesYes
Industry FEYesYesYesYesYesYes
Observations29,92229,92229,92229,92229,92229,922
Adj R20.2640.26370.2635---
Pseudo R2---0.10940.10920.1091
This table examines how local Confucian culture affects corporate ESG ratings. The first three columns present the results related to the OLS model, and columns (4) to (6) present results under the ordered probit model, respectively. Detailed definitions of variables can be retrieved from Table 1. Standard errors adjusted for heteroscedasticity and clustered at the firm level are presented in parentheses. *** represents p < 0.01.
Table 4. The moderation effect of attention.
Dep. Var =ESG_Sino
(1)(2)(3)
Panel A: Confucianism and media
CONFUC10.0179 *
(0.0107)
High_Media−0.0661 **−0.0921 **−0.1274 **
(0.033)(0.0434)(0.0523)
CONFUC1 × High_Media0.0522 ***
(0.0161)
CONFUC2 0.0073
(0.0104)
CONFUC2 × High_Media 0.0452 ***
(0.0151)
CONFUC3 −0.0018
(0.0105)
CONFUC3 × High_Media 0.0479 ***
(0.0153)
CONSTANT−0.6411 ***−0.6717 ***−0.6489 ***
(0.1389)(0.1399)(0.141)
ControlsYesYesYes
Year FEYesYesYes
Industry FEYesYesYes
Observations29,58129,58129,581
Adj R20.26530.2650.2648
Panel B: Confucianism and analysts following
CONFUC10.0215 **
(0.0109)
High_Analyst0.0688 **0.06010.0199
(0.0337)(0.0448)(0.0538)
CONFUC1 × High_Analyst0.0426 ***
(0.0162)
CONFUC2 0.0139
(0.0101)
CONFUC2 × High_Analyst 0.0329 **
(0.0155)
CONFUC3 0.0038
(0.0102)
CONFUC3 × High_Analyst 0.0396 **
(0.0156)
CONSTANT−0.0574−0.0853−0.0572
(0.1414)(0.1427)(0.1441)
ControlsYesYesYes
Year FEYesYesYes
Industry FEYesYesYes
Observations29,92229,92229,922
Adj R20.26710.26670.2666
Notes: This table examines whether outside attention from media or analysts would alter the relationship between local Confucian culture and firms’ ESG ratings. In Panel A, High_Media is an indicator variable that takes the value of 1 if the firm is in the cohort with the number of outsider media news that is related to the firm above the sample median and 0 otherwise. For a specific firm, we calculate the number of the media news following the firm from the CNRDS database, a database covering all the listed firm related news from more than 500 newspaper outlets. In Panel B, High_Analyst is a dummy variable that equals 1 if the number of following analysts exceeds the sample median and 0 otherwise. The number of analysts following a listed firm is retrieved from the CSMAR database. For presentational brevity purposes, we omitted coefficients on control variables that are the same as those in the baseline regressions that are presented in Table 2. Variable definitions can be found in Table 1. ***, **, and * denote p < 0.01, p < 0.05, and p < 0.1, respectively.
Table 5. The effect of Confucianism on ESG before and after 2013.
Dep. Var = ESG_Sino
2009–20122013–20202009–20122013–20202009–20122013–2020
(1)(2)(3)(4)(5)(6)
CONFUC10.0217 *0.0516 ***
(0.0127)(0.01)
CONFUC2 0.01650.0357 ***
(0.0114)(0.0095)
CONFUC3 0.01410.0268 ***
(0.0114)(0.0096)
Constant1.0622 ***−1.5981 ***1.0422 ***−1.6399 ***1.0395 ***−1.6333 ***
(0.2292)(0.1492)(0.2309)(0.1505)(0.2324)(0.1513)
ControlsYesYesYesYesYesYes
Year FEYesYesYesYesYesYes
Industry FEYesYesYesYesYesYes
Observations714722,775714722,775714722,775
Adj R20.25190.28690.25180.28650.25170.2863
Notes: This table examines whether the role of local Confucian culture has a more prominent influence on firms’ ESG ratings in more recent times. In the odd-numbered columns, we restrict our sample to spanning from 2009–2012. In the even-numbered columns, we restrict the sample from 2013 to 2020. The dependent variable is the ESG ratings of listed firms, and the independent variable is the local Confucian culture measured by CONFUC1, CONFUC2, and CONFUC3. For presentational convenience, we do not report coefficients on control variables that are the same as those in the baseline regressions that are presented in Table 2. Detailed definitions of variables can be found in Table 1. *** and * denote p < 0.01 and p < 0.1, respectively.
Table 6. The moderation effect of property rights.
Dep. Var = ESG_Sino
(1)(2)(3)
CONFUC10.0363 ***
(0.0105)
SOE0.3171 ***0.2458 ***0.1748 ***
(0.0338)(0.0443)(0.0534)
CONFUC1 × SOE0.0186
(0.0165)
CONFUC2 0.013
(0.0103)
CONFUC2 × SOE 0.0391 **
(0.0154)
CONFUC3 −0.0021
(0.011)
CONFUC3 × SOE 0.0536 ***
(0.0156)
CONSTANT−0.7385 ***−0.7355 ***−0.6934 ***
(0.1296)(0.1312)(0.1332)
ControlsYesYesYes
Year FEYesYesYes
Industry FEYesYesYes
Observations29,92229,92229,922
Adj R20.2640.26380.2638
Notes: This table presents results studying whether local Confucian culture plays a more important role in improving ESG ratings in state-controlled firms. SOE is an indicator variable that equals 1 if the firm’s ultimate controller is a state-owned asset management agency and 0 otherwise. The dependent variable is the ESG ratings of listed firms, and the independent variable is the local Confucian culture measured by CONFUC1, CONFUC2, and CONFUC3. For presentational convenience, we do not report coefficients on control variables that are the same as those in the baseline regressions that are presented in Table 2. Detailed definitions of variables can be found in Table 1. *** and ** denote p < 0.01 and p < 0.05, respectively.
Table 7. The moderation effect of firm size.
Dep. Var = ESG_Sino
(1)(2)(3)
CONFUC10.0461 ***
(0.0108)
Large_Size0.3137 ***0.3085 ***0.2726 ***
(0.0347)(0.0453)(0.0544)
CONFUC1 × Large_Size0.0406 **
(0.0165)
CONFUC2 0.0214 **
(0.0104)
CONFUC2 × Large_Size 0.0306 **
(0.0155)
CONFUC3 0.0106
(0.0107)
CONFUC3 × Large_Size 0.0363 **
(0.0157)
CONSTANT5.8871 ***5.9155 ***5.9405 ***
(0.0309)(0.0367)(0.0424)
ControlsYesYesYes
Year FEYesYesYes
Industry FEYesYesYes
Observations29,92229,92229,922
Adj R20.21740.21630.2161
Notes: This table presents results studying whether local Confucian culture plays a more important role in improving ESG ratings in larger firms than in smaller firms. Large_Size is an indicator variable that equals 1 if one firm’s total asset at the end of the fiscal year is above the sample median and 0 otherwise. The dependent variable is the ESG ratings of listed firms, and the independent variable is the local Confucian culture measured by CONFUC1, CONFUC2, and CONFUC3. For presentational convenience, we do not report coefficients on control variables that are the same as those in the baseline regressions that are presented in Table 2. Detailed definitions of variables can be found in Table 1. *** and ** denote p < 0.01 and p < 0.05, respectively.
Table 8. Instrumental variable regression results.
Panel A: Second stage of the instrumental variable regressions
Dep. Var = ESG_Sino
Model: IV-2SLSModel: IV-Ordered-Probit
(1)(2)(3)(4)(5)(6)
CONFUC10.11 *** 0.0746 ***
(0.0259) (0.0239)
CONFUC2 0.0621 *** 0.0452 ***
(0.0146) (0.0146)
CONFUC3 0.0563 *** 0.0396 ***
(0.0133) (0.0133)
Constant−1.2941 ***−1.3538 ***−1.3756 ***---
(0.1472)(0.1493)(0.1503)---
ControlsYesYesYesYesYesYes
Year FEYesYesYesYesYesYes
Industry FEYesYesYesYesYesYes
Observations29,42029,42029,42029,42029,42029,420
Adj R20.26480.26560.2654---
Panel B: First stage of the instrumental variable regressions
Dep. Var =CONFUC1CONFUC2CONFUC3
Jinshi0.1636 ***0.2888 ***0.3164 ***
(0.0028)(0.003)(0.003)
F-statistic for joint significance of the instruments2507.1912892.833196.32
F-statistic p-value0.00000.00000.0000
Observations29,42029,42029,420
Adj R20.16920.33770.411
Notes: This table presents the second and first stages of the instrumental regressions using Jinshi as the instrument variable. Jinshi is defined as the natural logarithm of one plus the number of people who acquired the most prestigious degree from the ancient imperial examination system of the Ming and Qing dynasties in each province. Standard errors adjusted for heteroscedasticity and clustered at the firm level are presented in parentheses. *** represents p < 0.01.
Table 9. Robustness Checks.
Panel A: Robustness tests utilizing other Confucius variables based on different distance standards
Dep. Var = ESG_Sino
(1)(2)(3)(4)(5)(6)(7)(8)
CONFUC1200.0512 ***
(0.0081)
CONFUC140 0.0483 ***
(0.0079)
CONFUC160 0.0426 ***
(0.0078)
CONFUC180 0.0341 ***
(0.0076)
CONFUC220 0.0333 ***
(0.0079)
CONFUC240 0.0305 ***
(0.0079)
CONFUC260 0.0251 ***
(0.0077)
CONFUC280 0.024 ***
(0.0077)
Constant−0.7938 ***−0.8055 ***−0.8084 ***−0.8 ***−0.8091 ***−0.804 ***−0.7948 ***−0.7935 ***
(0.1287)(0.1288)(0.1291)(0.1292)(0.1296)(0.1297)(0.1298)(0.13)
ControlsYesYesYesYesYesYesYesYes
Year FEYesYesYesYesYesYesYesYes
Industry FEYesYesYesYesYesYesYesYes
Observations29,92229,92229,92229,92229,92229,92229,92229,922
Adj R20.26420.26420.2640.26380.26370.26360.26350.2635
Panel B: Robustness checks on province-level Confucius temples
Dep. Var = ESG_Sino
(1)(2)(3)
CONFUC1_prov0.0378 ***
(0.0086)
CONFUC2_prov 0.0323 ***
(0.0082)
CONFUC3_prov 0.0289 ***
(0.0081)
Constant−0.7594 ***−0.7976 ***−0.7981 ***
(0.1283)(0.1293)(0.1296)
ControlsYesYesYes
Year FEYesYesYes
Industry FEYesYesYes
Observations29,92229,92229,922
Adj R20.26370.26370.2636
Panel C: Alternative measures of ESG
Dep. Var = ESG_SynTaoDep. Var = ESG_Wind
(1)(2)(3)(4)(5)(6)
CONFUC10.0524 ** 0.075 ***
(0.0244) (0.0268)
CONFUC2 0.0593 *** 0.0797 ***
(0.022) (0.0238)
CONFUC3 0.049 ** 0.0864 ***
(0.0233) (0.0239)
Constant0.33470.24230.2397−4.1648 ***−4.2768 ***−4.3056 ***
(0.5021)(0.5033)(0.503)(0.4932)(0.4968)(0.4967)
ControlsYesYesYesYesYesYes
Year FEYesYesYesYesYesYes
Industry FEYesYesYesYesYesYes
Observations290329032903260626062606
Adj R20.1790.17960.17890.33180.33240.3325
Notes: This table presents different robustness checks of the main results linking local Confucian culture to residing firms’ ESG ratings. In Panel A, we change measures of local Confucian cultures using different radius distances, i.e., 120 km, 140 km, etc., to construct measures of Confucian culture. In panel B, we restrict the Confucian temples at the province level and reconstruct the three measures of local Confucian culture, namely CONFUC1_prov, CONFUC2_prov, and CONFUC3_prov to examine how local Confucian culture impact ESG ratings of headquartered firms. In Panel C, we acquire ESG ratings from two other rating agencies, namely the SynTao Green Finance (SynTao_ESG) and Wind (Wind_ESG). Since SynTao Green Finance and Wind only rate firms included in CSI 300 Index and CSI Smallcap 500 Index after 2016, we have a relatively smaller sample size. For presentational convenience, we do not report coefficients on control variables that are the same as those in the baseline regressions that are presented in Table 2. Standard errors adjusted for heteroscedasticity and clustered at the firm level are presented in parentheses. *** and ** represent p < 0.01 and p < 0.05, respectively.
Publisher’s Note: MDPI stays neutral with regard to jurisdictional claims in published maps and institutional affiliations.

