Article

Simulation of Land Use/Land Cover Dynamics Using Google Earth Data and QGIS: A Case Study on Outer Ring Road, Southern India

by
SrinivasaPerumal Padma
1,*,
Sivakumar Vidhya Lakshmi
2,
Ramaiah Prakash
3,
Sundaresan Srividhya
4,
Aburpa Avanachari Sivakumar
5,
Nagarajan Divyah
6,
Cristian Canales
7 and
Erick I. Saavedra Flores
8,*
1
Department of Civil Engineering, Saveetha Engineering College, Chennai 602105, Tamilnadu, India
2
Department of Biosciences, Saveetha School of Engineering, Saveetha Institute of Medical and Technical Sciences, Chennai 602105, Tamilnadu, India
3
Department of Civil Engineering, Alagappa Chettiar Government College of Engineering and Technology, Karaikudi 630004, Tamilnadu, India
4
Department of Civil Engineering, Varuvan Vadivelan Institute of Technology, Dharmapuri 636703, Tamilnadu, India
5
Department of Mechanical Engineering, Varuvan Vadivelan Institute of Technology, Dharmapuri 636703, Tamilnadu, India
6
Department of Civil Engineering, PSG Institute of Technology and Applied Research, Coimbatore 641062, Tamilnadu, India
7
Department of Mechanical Engineering (DIM), Faculty of Engineering, University of Concepción, Edmundo Larenas 219, Concepcion 4070409, Chile
8
Departamento de Ingeniería en Obras Civiles, Universidad de Santiago de Chile, Av. Ecuador 3659, Estación Central, Santiago 9170201, Chile
*
Authors to whom correspondence should be addressed.
Sustainability 2022, 14(24), 16373; https://doi.org/10.3390/su142416373
Submission received: 15 November 2022 / Revised: 30 November 2022 / Accepted: 30 November 2022 / Published: 7 December 2022

Abstract

:
The land use and land cover change dynamics is in par with the increasing growth of urban developments and associated sprawl. The objective of the study is to quantify such land cover changes caused due to the urban expansion along the outer ring road using Remote Sensing and GIS. The land cover maps are created for four segments namely Chikkarayapuram, Nazarathpettai, Meppur, and Perungalathur for the years of 2009, 2012, and 2016, respectively. The land cover maps are analyzed for changes among seven classes, namely agriculture, barren land, residential units, industry, water body, other vegetation, and marshland (swamp). Further, the land cover maps of the four segments are analyzed for changes in terms of spatiotemporal aspects (area-based land cover change), environmental aspects (green cover change), and economical factors. The urban growth of the Chikkarayapuram, Nazarathpettai, Meppur, and Perungalathur segment along the outer ring road corridor in the years 2009, 2012, and 2016 are (5.16%, 20.10%, 7.14%, and 12.63%), (14.31%, 30.62%, 13.9%, and 22.18%), and (19.67%, 33.1%, 23.22%, and 40.27%), respectively. The urban areas have increased from 2009 to 2016 by 20, 76,530 sq. m. The agriculture regions have been reduced from 2009 to 2016 by 12, 62,700 sq. m. Besides, using the MOLUSCE plugin in open-source GIS (QGIS), simulated maps for the year 2022 were created based on the land cover maps of the three years (2009, 2012, and 2016) which are then validated with the ground-truth points obtained from Google Earth. The scope of the study utilization of Google Earth Engine (GEE) and automated feature extraction algorithms for predictive analysis.

1. Introduction

Sustainable development is dependent on land use/land cover (LULC) change, which is one of the major factors causing environmental change on a worldwide scale. These alterations in the landscape must be examined from varied aspects in order to analyze their causes, progression, and effects [1]. Urban growth, which is a sign of economic development, has contributed to such landscape related changes for a longer period. The geographical pattern of land development that occurred in order to meet the demands of the anthropogenic factors is considered urban dynamics, and it has a major impact on the land use pattern [2]. Statistically from 1901 to 2011, India’s urban population in comparison with the total population has expanded dramatically from 10.8% to 31.16%. The main elements in the current situation that could assist in managing the natural resources and environmental changes is the consistent monitoring of land use and land cover change [3]. Analyzing the patterns of urban heat island (UHI) formation [4,5], population sprawl patterns [6,7], and environmental variations are the outcomes of an effective change detection study. Geographic information systems (GIS) and remote sensing (RS) consist of large database of high-resolution imageries and innovative tools for sophisticated ecosystem management. The gathering of remotely sensed data makes it easier to conduct regional and global synoptic assessments of earth features. Such data paves way for intensive and localized research for the conservation of ecology and environment. Geographic Information Systems (GIS) is used to the conversion of remote sensing data at all forms into tangible and spatial information. The combination of these technologies allows urban planners to better comprehend how the landscape is changing and to provide associated environmental monitoring systems in view of upcoming developments [8,9]. With the availability of huge repositories of image datasets and data extraction algorithms, efficient multiscale analysis [10] can be done through the creation of land -use/land cover maps.
A time-series of five SPOT HRV pictures for a region of the State of Rondonia were used in a study on the analysis of land cover changes [11].In this study, image classification approaches and Geographic Information System (GIS) tools were used to calculate the total deforested area, and the percentage of land left for secondary vegetation were calculated. The development of novel spatial information extraction techniques and specialized geographical analysis tools for supporting the formulation and implementation of urban planning were made possible by the integrated use of remote sensing, GIS, and urban planning models [12]. Landsat (satellite) images of sensor Multispectral Scanner (MSS) and Enhanced Thematic Mapper (ETM) were employed to assess the areal changes that incurred in the agricultural lands, urban encroachment, and water areas [13]. Information systems shall be used for the interpretation and evaluation of physical data and other socio-economic data and thereby providing an important source of information for guidance in the overall planning process [14]. Three digital images were used to analyze the main trajectories of land use change in Bhubaneshwar city and employed entropy approach to find the degree of randomness in the sprawl pattern [15]. In addition to the utilization of standard supervised classification frameworks like Maximum Likelihood Classifier [16], several researches related to LULC analysis employed Artificial Neural Network (ANN), Machine Learning algorithms, Cellular Automata, and Markov chain analysis [17,18,19]. The urban agriculture of Chicago is classified into public and private places with the help of Google Earth imagery [20]. Using Elshayal Smart open source software, approximately 340 distinct tiles from Google Earth pictures covering the Vellore region of southern India were retrieved for urban mapping [21]. In a case study on land use characterization of Wuhan, China, the authors stated that Google Earth imagery has certain benefits for mapping in terms of good geometric, morphological, and contextual spatial properties [22]. In recent times, Google Earth Engine (GEE) [23] is employed to generate higher level LULC maps. Simulation or prediction of LULC dynamics is necessary for visualizing the interaction of natural habitat and future developmental scenarios. MOLUSCE plugin Quantum GIS (QGIS) has been used in recent studies to validate predicted LULC maps [24,25].
Simulating dynamically changing environment is highly imperative for analyzing the growth aspects of a city [26,27,28]. The challenges that occur due to a rapidly changing city’s landscape need to be analyzed for improved planning and management [29]. Several research [2,30,31] has highlighted the urban dynamics and related growth model analysis for Chennai region, one of the four major metropolitan cities in India, and is located in the southeastern part of the country. The average rate of population growth of the city is 25% per decade and this is recurrently reducing the green-covered area in the city. During the post-economic liberalization, it is seen that this urban region is trying to balance its environmental quotient with respect to its infrastructural development. The urban expansion in Chennai city varies in a periodic manner. The urban area of Chennai has increased from 1.46 % to 18.55% in two decades (1991–2012), in which 22% of vegetation land has reduced and around 36% of the total area was converted to urban area in 2016. According to another research, the amount of land covered by wetland classes between 2005 and 2016 reduced by 10.05 km2 (0.98%). Simultaneously, from 2005 to 2016, the built-up area significantly rose by 363.99 km2 (10.13%) [32]. In addition, the urban heat island scenario was also studied by characterizing the land surface temperature of Chennai using Support Vector Machine and Maximum Likelihood Classifiers [33]. Though urban expansion relates to economic development, it also influences the standards of living, land rate and nature of urban planning [2,
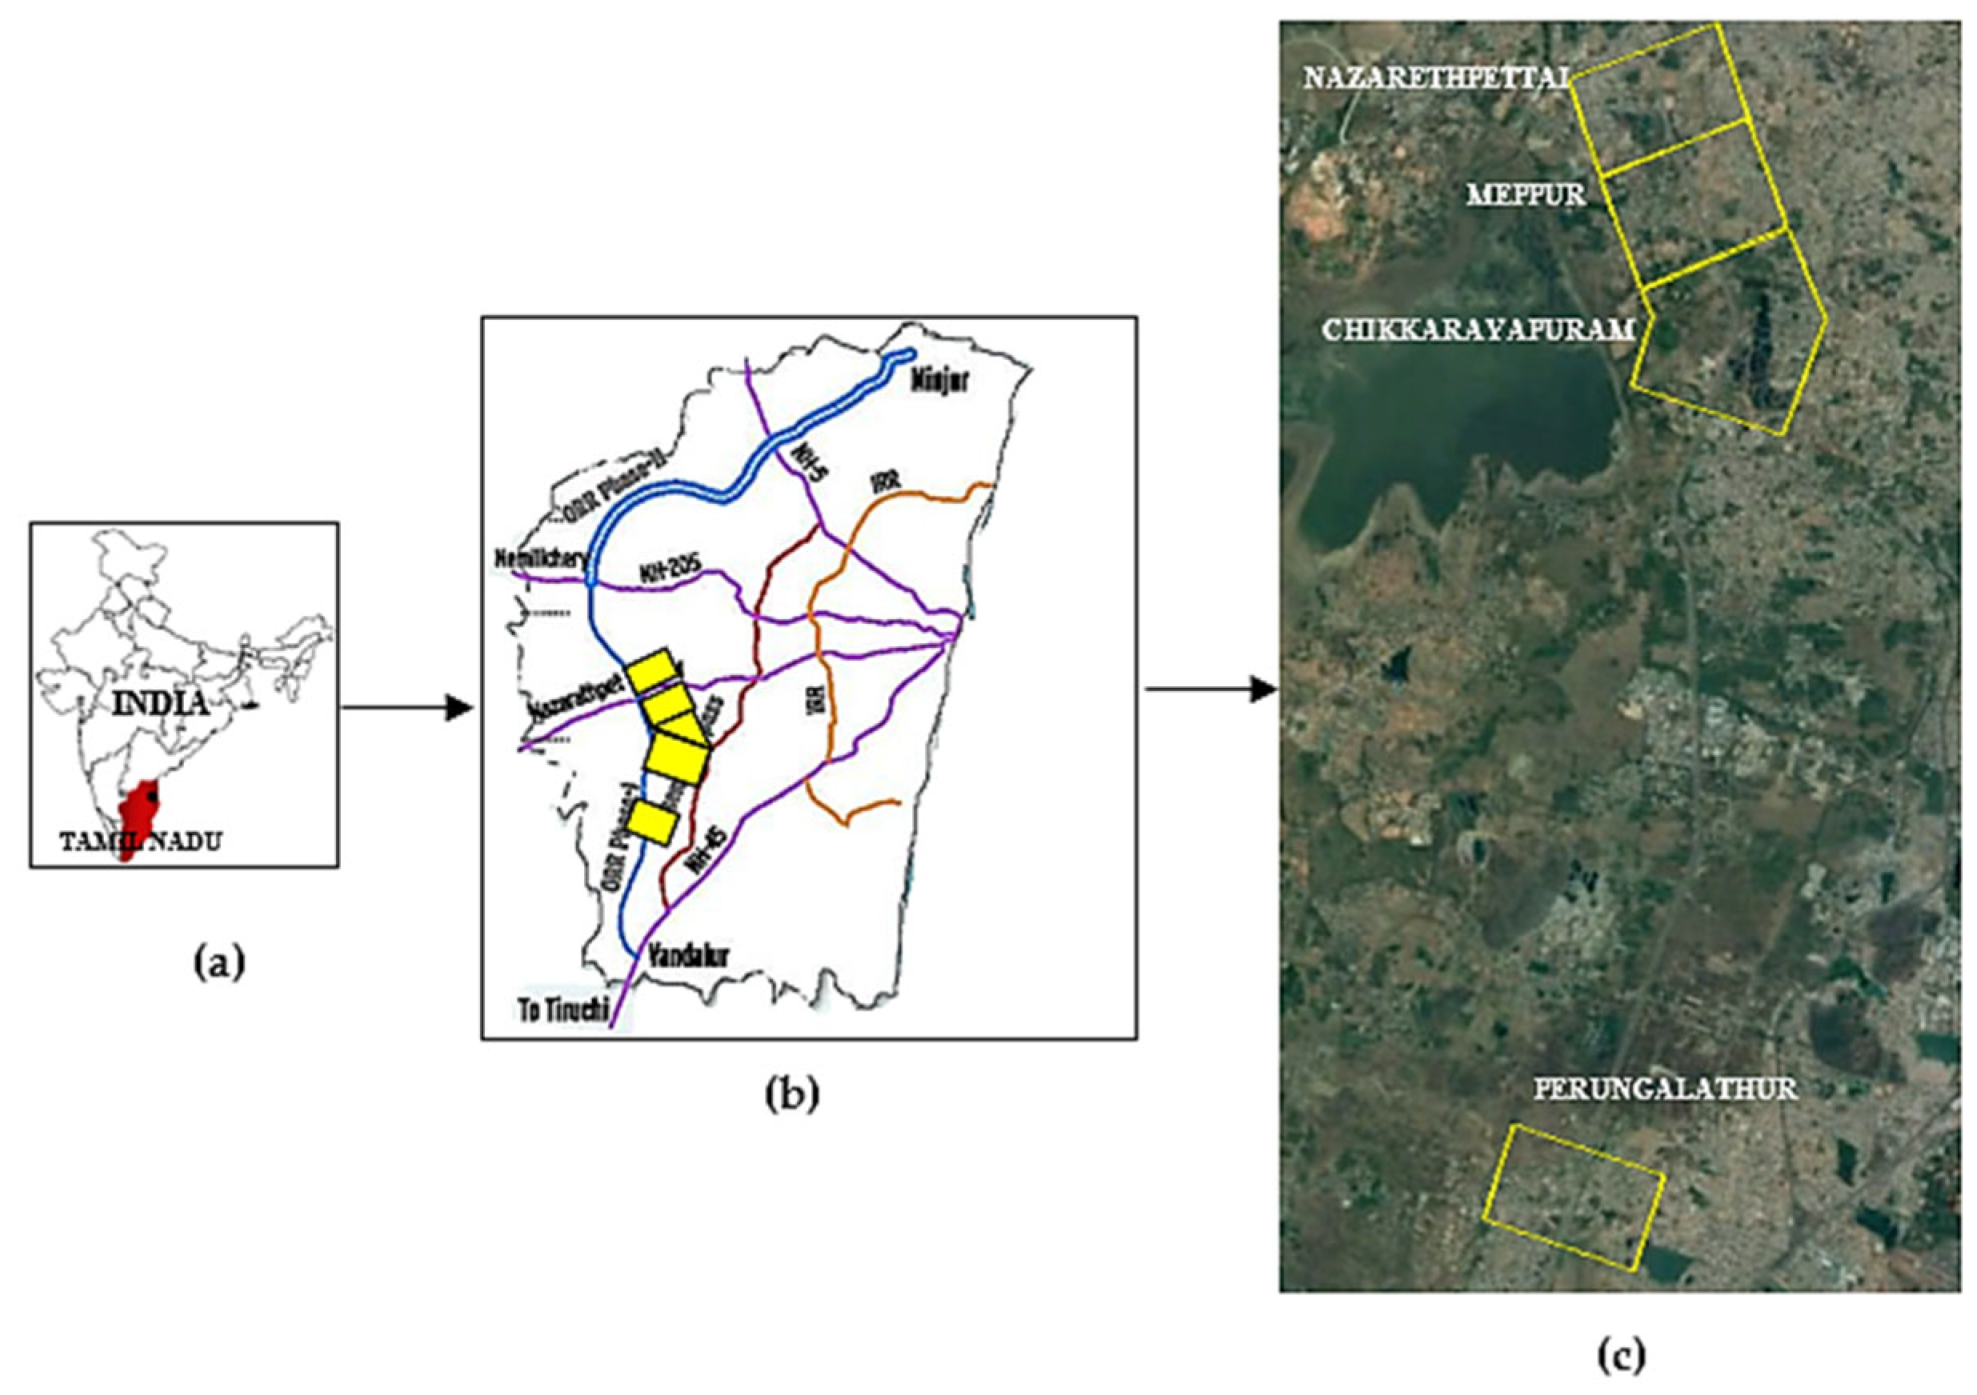
30]. The outer ring road (ORR) is a major transport corridor along Chennai Metropolitan Area which was initiated by 2010. At present, the nature of urban dynamics around the corridor needs to be studied to evaluate the related land use change in the region. Four study sites were selected along the ORR region based on their prominence in terms of urbanization and population dynamics for the study. These sites, which are considered to be hotspots along the initial phase of the ORR, need to be studied for the land use/land cover dynamics.
This study was aimed at characterizing the spatiotemporal changes that incurred in the land use/land cover aspects and relate them with the environmental, socio-economic parameters related to the study area. Instead of utilizing the temporal satellite datasets, the study relies on the history imagery available in the Google Earth database, which is of higher resolution thereby facilitating improve data extraction. In addition, the prediction of future LULC dynamics has been done using the MOLUSCE plugin available with the open-source GIS software (QGIS).

2. Study Site and Experimental Design

The study area (Figure 1) covers the outer ring road which is located between 13°2′33.47″ N latitude and 80°5′35.77″ E longitude in the Head North Region on NH32, Chennai. The entire National Highway road reaches by 63 km of distance to the inner part, starting from the Vandalur to Minjur. While Figure 1a depicts the locational aspect of the study area, Figure 1b depicts the coverage of the road structure, and Figure 1c represents the satellite image view of the segments selected for the study. This region is considered to be a major transport corridor and is also located along the margins of the Chennai Metropolitan Area. Several infrastructural developments, recreational zones, and residential amenities are opened up along the study area in order to make the region amicable for economic prosperity. Being a connecting hub, there is a high rate of urban dynamics in terms of transport and population in the region. A prospective study on the history of the region through spatiotemporal mapping and relating it with the simulated aspects of futuristic changes will be highly effective source of information for urban planning.
The methodology of the study is illustrated in Figure 2. The detailed workflow comprising of the classification of the study sites into segments, preparation of land use/land cover maps, change detection analysis, quantification of the resulting dynamics based on few factors and prediction of future maps are discussed.

2.1. Segment Classification

The Outer Ring Road region is divided into four segments: Chikkarayapuram, Nazarethpettai, Meppur, and Perungalathur based on the urban development along the corridor. The outer boundary of this segment was marked in a way that the land is covered up to 1 km stretch along both the sides of the road. The following are the four segments which are classified and digitized using the Geospatial software called Google Earth Pro [34,35,36]. The process of creating vector boundaries is called digitization. In the Google Earth Pro interface, special tools, namely place marks, paths, and polygons, are provided to create point, line, and polygon features. By using the tools, appropriate metadata or aspatial data shall be added to the digitized feature which is later retrieved as attribute or feature table in GIS domain.

2.2. Preparation of Time-Series (Land Use/Land Cover) Maps

In this study, totally seven land use/land cover classes were established as residential, industrial, barren land, agricultural land, water body, marsh land (swamp), and other vegetation. The description of these landcover classes is presented in Table 1. The land cover maps are digitized using Google Earth time series interface (historical imagery) [34,35,36] and imported into GIS environment for analysis. The historical imagery which is available under the timeline tool is a combination and repository of image data collected from various places from past decades. By scrolling over the timeline, the pointers are set for available time periods where the data can be utilized. In recent period, ‘time lapse’ options have emerged to give a virtual experience. The land cover maps of Chikkarayapuram, Nazarethpettai, Meppur, and Perungalathur segments for the years 2009, 2012, and 2016 are shown in Figure 3, Figure 4, Figure 5 and Figure 6, respectively. The digitized maps are validated based on image interpretation process where specific ground truth points in each class was compared with the selected points based on the above-mentioned validation protocol.

2.3. Change Detection Analysis

Change detection maps are created between two different years which gives the level of change occurred between the two years. Change detection maps are created in the GIS environment using the image analysis tool. Change detection map created as raster file is converted into vector files with the grids of cell size (0.00007–0.00009) approx. The comparison in each cell color between two maps is processed and the change detection between the two maps is given as a single map. The change detection maps are classified into four main categories namely very high change, high change, moderate change, low change, and very low change depending on the quantum of changes that occurred in the pixel proportions between the years. Using this change detection map the land use and land cover change of a particular area can be seen. The change detection maps created for Chikkarayapuram, Nazarethpettai, Meppur, and Perungalathur among the three years are shown in Figure 7, Figure 8, Figure 9 and Figure 10, respectively.

2.4. Prediction of Future Land Use/Landover Maps

The prediction of future maps (Figure 11) can be done with the help of previous year land use/lan- cover maps using open-source Quantum GIS (QGIS) software. The plugin MOLUSCE in QGIS provides a set of algorithms for land use change simulations, such as the Artificial Neural Network (ANN), Logistic Regression (LR), Weights of Evidence (WoE) and Multi Criteria Evaluation (MCE), along with a validation using kappa statistics. The MOLUSCE plugin of QGIS was chosen as it employed well-known algorithms and methods for modeling and simulating the land cover changes. Modeling and simulation tasks have become effective with MOLUSCE’s user-friendly and interactive plugin. Seven key elements are present in the MOLUSCE’s interface, namely: Inputs, Evaluation Correlation, Area Changes, Transition Potential Modeling, Cellular Automata Simulation, Validation, and Messages. After importing the raster files for the initial and final years of the map the prediction for the 2022 is initiated by setting the iteration count. This is followed by area analysis module which gives the percentage of change difference between the two years. The predicted map is generated at the transition modeling stage that can display land use changes between those states. In this plugin there are four models provided, in which the logistic regressions model is used for modeling.

3. Results and Discussion

Spatiotemporal analysis is the study of changes in land cover of a particular area between two or more years in terms of area quantity. The change of land cover from one class to another between different years indicates the growth of the area. The common increase and decrease in every segment are observed in urban and agriculture land, respectively. Environmental analysis of a land area is the change in the green belt of the area. It indicates the rate of decrease or increase of green cover on that area and the reason for the change can be identified in this analysis. The agricultural land and the other vegetation land are considered the green cover of the segment. The other vegetation lands will change to barren and vice versa from season to season. Economic growth analysis is the study of forces that determine the distribution of scarce resources. It provides insight into how markets operate and offers methods for attempting to predict future market behavior in response to events, trends, and cycles.

3.1. Chikkarayapuram Segment

The agriculture land area in this segment during 2009, 2012, and 2016 are 1,260,000 sq. m, 801,360 sq. m, and 655,740 sq. m, respectively (Table 2). The change difference during 2009–2012 was more when compared to 2012–2016. During the period (2009–2012), the reduction in agriculture land is because of the construction process carried out in the outer ring road. From Figure 7a, it was observed that the land areas nearby the road alignment were fully utilized for the construction work. The other agriculture lands, which were present on the sides of outer ring road, were converted to other vegetation and barren lands. During the period (2012–2016), the reduction in agricultural land is minimum because the outer ring road was constructed completely before 2016. The agricultural lands were mostly converted to empty barren lands and layouts that were taken up for residential purpose. A part of agricultural land was also converted into other vegetation on the left side of the segment (Figure 7b). The other vegetation land decreased to some extent since this classes increases and decreases from season to season, as there is a random growth in this segment. In the economic aspect, the guideline value for this segment from the year 2007–2012 is Rs.200 per sq. ft and from 2012, the revised guideline value increased between Rs.1300–1600 per sq. ft. These guideline values are obtained from the State Land Registration Portal for the respective years.

3.2. Nazarathpettai Segment

The area of agriculture and other vegetation class can be referred from Table 3. In this segment, the overall amount of agricultural land is very low with respect to the total area. The reason for this is that Nazarathpettai is the main point to enter Chennai from the north side, hence urban development is already high in that region. During the period 2009 to 2012, the agriculture land was cleared for the construction of the outer ring road to some extent, and a part was converted into other vegetation. From 2012 to 2016, the land was converted into layouts on the left side along the outer ring road which resulted in the reduction during this period. From 2009 to 2012 (Figure 8a), there is a smaller amount of reduction in the land area which is due to the area occupied by the outer ring road. During the period of 2012 to 2016 (Figure 8b), there is great change in other vegetation, particularly on the right side of the segment near Shrirdi Sai Nagar where most of the land was converted into urban class. Similarly, in Annai Indra streets and Annai Theresa streets, there is a transformation to urban land from the other vegetation. On the left side of the segment, most of the vegetation land was converted as barren land for layout, partly due to seasonal effects. The guideline value for Nazarathpettai segment from the year 2007–2012 is Rs.300 per sq. ft, and from 2012, the revised guideline value is between Rs.1200 per sq. ft.

3.3. Meppur Segment

In this segment, the green cover is high with respect to the total area when compared with other segments. From the period of 2009 to 2012 (Figure 9a), the decline in agricultural land is much less when compared to other segments. There is an increase in other vegetation land because most of the barren lands near Bakthavathsalam Nagar and Mahalakshmi Nagar in 2009 were converted into vegetation parcels. During the period of 2012 to 2016 (Figure 9b), there is large amount of reduction in agriculture land cover. On the left side of the segment, the agricultural parcel was converted to urban regions and layouts. Further, there was a much smaller amount of change in other vegetation land. The guideline value for Meppur segment from the year 2007–2012 is Rs.280 per sq. ft, and from 2012, the revised guideline value is between Rs.600–700 per sq. ft.

3.4. Perungalathur Segment

From the period of 2009 to 2012 (Figure 10a), there is random growth in agriculture land, as a part of other vegetation land was cleared out to pave way for agricultural activity. In this period from 2012 to 2016 (Figure 10b), the agricultural land was decreased which is lesser than 2009 due to urban sectors built near Shanthi Nagar and Parvathi Nagar. In 2009, the other vegetation class on the outer ring road alignment and the land which occupied this region were cleared for the construction. Further, there was a small decrease in other vegetation class due to negligible level of urbanization in this segment that occurred from 2012 to 2016.The guideline value for Perungalathur segment from the year 2007–2012 is Rs.300 per sq. ft, and from 2012, the revised guideline value is between Rs.1500–2400 per sq. ft.

3.5. Analysis of Predicted Output

Each segment of the outer ring road is predicted for future land cover change for the year 2022. The urban growth is estimated by adding the industrial class and residential class. The model gives the urban growth of the segments, and the land cover change occurred due to the urban growth. By comparing the predicted changes with the past condition, the environmental impacts and its related land issues can be analyzed. Further, a validation of the predicted outputs was carried out using ground control points on the Google Earth interface. A stratified random sampling approach was taken up to validate 100 control points in each segment for assessing the accuracy of the predicted output. From this validation, an urban growth of around 53.95% was estimated with respect to the total land area. An error matrix was derived to compute the omission and commission error thereby resulting in the overall accuracy of the digitized map. A prediction accuracy of 84.56%, 83.59%, 85.00%, and 86.12% was estimated through the MOLUSCE plugin for the segments, namely Chikkarayapuram, Nazarethpettai, Meppur, and Perungalathur, respectively.

3.5.1. Chikkarayapuram Segment

Based on the prediction map, the segment (Figure 11a) of each class is calculated and shown in Table 3. The total land area of Chikkarayapuram segment is 3,627,810 sq. m in which the urban contribution in the year 2009 was 5.29%, and in 2016 it was 19.55%. In the year 2022, it is expected to be nearly 32.88%. Due to this increase in the urban land, the vegetation land is reduced up to 11.69% and water body is reduced up to 1.955% from its land cover (2016). The impact due to urban growth is minimum in the water body, but there is a moderate decrease in vegetation land, which is a normal impact based on the development of Chennai city. The outer ring road plays a minor role in the urban development of the Chikkarayapuram segment. The barren land and swamp area has undergone changes, but does not have a great impact in environmental problems. These observations are confirmed by a detailed variation in area as shown in Figure 12.

3.5.2. Nazarathpettai Segment

Based on the prediction map (Figure 11b) the area of each class is calculated and shown in Table 3. The total land area of Nazarathpettai segment is 2,796,220 sq. m in which the urban contribution in 2009 was 19.63%, and in 2016 it was 32.52%. In the year 2022, it is expected to be nearly 45.86%. The urban growth was already high in 2009 and 2016 because Nazarathpettai is a main junction through which the north side route vehicles can enter the city. Due to the increase of urban land, the vegetation and water body gets reduced up to 7.03% and 1.04%, respectively, from its present land cover (2016). The increase in urban growth between (2016–2022) is more when compared with previous urban growth (Figure 13).

3.5.3. Meppur Segment

The total land area of Meppur segment (Table 4) is 2,950,272 sq. m in which the urban contribution in 2009 and 2016 was 6.764% and 23.35%, respectively. In 2022 (Figure 11c), it is expected to be 32.20%. In this segment, barren land is reduced very high up to 13.311% based on the land cover (2016). The vegetation land and water body has lesser amount of change, thereforethere will be no environmental impact due to these land covers. The urban growth in this segment is an expected development based on normal land development criteria. These observations are confirmed by detailed variations in area-wise parameters as shown in Figure 14.

3.5.4. Perungalathur Segment

Based on the prediction map (Figure 11d), the area of each class is calculated and shown in Table 5. The total land area in Perungalathur segment is 2,756,916 sq. m in which the urban contribution in 2009 and 2016 was 11.694% and 39.77%, respectively. In 2022, it is expected to be around 50.55% (as shown in Figure 15). In this segment, the urban growth is already high in 2009 and 2016, because Perungalathur is a main junction through which the entire south side route vehicles can enter the city. Due to increased urbanization, the impact on natural resources needs to be managed in a prior manner.

4. Conclusions

  • This work demonstrates the ability of remote sensing and GIS in capturing spatial-temporal capacity of datasets to analyze and predict the growth aspects and its impacts.
  • Most of the landscape of the outer ring road has undergone a transition due to the anthropogenic and developmental activities over the past decade. It is well known that the stretch is important for residential and migratory purpose because it connects the major national highways around Chennai metropolitan region.
  • From the above analysis, it is observed that due to the existing urban sprawl, the number of land use and land cover classes which currently exist will be decreased from seven classes to two or three classes. This may increase the future demand of natural resources, hence a consistent and proactive decision system needs to be created for managing the resource distribution.
  • Based on Figure 16, it could be inferred that the industrial and residential classes have been predicted to increase in comparison with the other classes in the four regions of interest. Further, the Perungalathur region has shown a contrasting variation where industrial zones increase with decrease in water body class. Besides, from Figure 17, the spread of area among the study sites have been depicted.
  • The primary socio-economic function of each site is reported by the categorical regionalized variable termed as ‘land use’ where the function is inferred from the pattern of land use. However, uncertainty in land use data arise in case of unreliable positional and categorical data. Effective utilization of metadata will reduce the issues surrounding the accuracy of the prepared land use data [37,38].
  • An enhanced impact analysis system, which has been set up in recent times for bringing a balance in the urban growth and natural landscape of the region, needs to be monitored in a consistent manner.
  • Besides improving the accuracy of mapping and avoiding the limitations caused due to the positional accuracy of existing images, change detection studies are planned to be carried out using Google Earth Engine (GEE) which caters to historical data of high resolution satellite imagery. Instead of digitization, automated algorithms of object-oriented models are being utilized in the GEE interface for future analysis.

Author Contributions

Conceptualization, S.P. and A.A.S.; Methodology, S.P.; Software, S.S.; Validation, R.P.; Formal analysis, S.V.L. and A.A.S.; Investigation, R.P.; Resources, S.S. and N.D.; Data curation, S.V.L. and S.S.; Writing—original draft, S.P.; Writing—review & editing, C.C.; Visualization, N.D.; Supervision, E.I.S.F.; Project administration, R.P.; Funding acquisition, E.I.S.F. All authors have read and agreed to the published version of the manuscript.

Funding

E.I. Saavedra Flores acknowledges the financial support from the Chilean National Agency for Research and Development (ANID), research grant FONDECYT REGULAR No. 1211767.

Institutional Review Board Statement

Not Applicable.

Informed Consent Statement

Not applicable.

Data Availability Statement

Data sharing not applicable.

Conflicts of Interest

The authors declare no conflict of interest.

Abbreviations

AbbreviationsFull Form
ANNArtificial Neural Networks
ETMEnhanced Thematic Mapper
GEEGoogle Earth Engine
GISGeographical Information System
LRLogistic Regression
LULCLand use Land cover
MCEMulti Criteria Evaluation
MOLUSCEModules for Land use Change Evaluation
MSSMultispectral Scanner
NHNational Highway
ORROuter Ring Road
QGISQuantum Geographical Information System
RSRemote Sensing
SPOT HRVSatellite Pour l’Observation de la Terre High Resolution Visible
UHIUrban Heat Island
WoEWeight of Evidence

References

  1. Turner, M.G. Spatial and Temporal Analysis of Landscape Patterns. Landsc. Ecol. 1990, 4, 21–30. [Google Scholar] [CrossRef]
  2. Aithal, D.B.; Ramachandra, T. V Visualization of Urban Growth Pattern in Chennai Using Geoinformatics and Spatial Metrics. J. Indian Soc. Remote Sens. 2016, 44, 617–633. [Google Scholar] [CrossRef]
  3. Hegazy, I.R.; Kaloop, M.R. Monitoring Urban Growth and Land Use Change Detection with GIS and Remote Sensing Techniques in Daqahlia Governorate Egypt. Int. J. Sustain. Built Environ. 2015, 4, 117–124. [Google Scholar] [CrossRef] [Green Version]
  4. Singh, P.; Kikon, N.; Verma, P. Impact of Land Use Change and Urbanization on Urban Heat Island in Lucknow City, Central India. A Remote Sensing Based Estimate. Sustain. Cities Soc. 2017, 32, 100–114. [Google Scholar] [CrossRef]
  5. Rahaman, S.; Jahangir, S.; Haque, M.S.; Chen, R.; Kumar, P. Spatio-Temporal Changes of Green Spaces and Their Impact on Urban Environment of Mumbai, India. Environ. Dev. Sustain. 2021, 23, 6481–6501. [Google Scholar] [CrossRef]
  6. Vani, M.; Prasad, P.R.C. Assessment of Spatio-Temporal Changes in Land Use and Land Cover, Urban Sprawl, and Land Surface Temperature in and around Vijayawada City, India. Environ. Dev. Sustain. 2020, 22, 3079–3095. [Google Scholar] [CrossRef]
  7. Ohri, A.; Yadav, P. Urban Sprawl Mapping and Land Use Change Detection Using Remote Sensing and GIS. Int. J. Remote Sens. GIS 2012, 1, 12–25. [Google Scholar]
  8. Jhawar, M.; Tyagi, N.; Dasgupta, V. Urban Planning Using Remote Sensing. Int. J. Innov. Res. Sci. Eng. Technol. 2013, 1, 42–57. [Google Scholar]
  9. Mundia, C.N.; Aniya, M. Analysis of Land Use/Cover Changes and Urban Expansion of Nairobi City Using Remote Sensing and GIS. Int. J. Remote Sens. 2005, 26, 2831–2849. [Google Scholar] [CrossRef]
  10. Kalyani, P.; Govindarajulu, P. A Multi-Scale Urban Analysis Using Remote Sensing and GIS. Geoinformatica 2013, 3, 373–379. [Google Scholar]
  11. Alves, D.S.; Skole, D.L. Characterizing Land Cover Dynamics Using Multi-Temporal Imagery. Int. J. Remote Sens. 1996, 17, 835–839. [Google Scholar] [CrossRef] [Green Version]
  12. Chen, J. Improving Urban Planning by Integrated Utilization of Remote Sensing and GIS’s. Int. Arch. Photogramm. Remote Sens. 1993, 29, 598. [Google Scholar]
  13. Belal, A.A.; Moghanm, F.S. Detecting Urban Growth Using Remote Sensing and GIS Techniques in Al Gharbiya Governorate, Egypt. Egypt. J. Remote Sens. Space Sci. 2011, 14, 73–79. [Google Scholar] [CrossRef] [Green Version]
  14. Rai, P.; V.K.Kumra, P. Role of Geoinformatics in Urban Planning. J. Sci. Res. 2011, 55, 11–24. [Google Scholar]
  15. Naik, M.G. Urban Sprawl of Bhubaneswar City Using GIS Applications and Entropy. UG. Dissertation/Thesis, National Institute of Technology, Rourkela, India, 2013. [Google Scholar]
  16. Sarif, M.O.; Gupta, R.D. Spatiotemporal Mapping of Land Use/Land Cover Dynamics Using Remote Sensing and GIS Approach: A Case Study of Prayagraj City, India (1988–2018). Environ. Dev. Sustain. 2022, 24, 888–920. [Google Scholar] [CrossRef]
  17. MohanRajan, S.N.; Loganathan, A.; Manoharan, P. Survey on Land Use/Land Cover (LU/LC) Change Analysis in Remote Sensing and GIS Environment: Techniques and Challenges. Environ. Sci. Pollut. Res. 2020, 27, 29900–29926. [Google Scholar] [CrossRef]
  18. Khan, A.; Sudheer, M. Machine Learning-Based Monitoring and Modeling for Spatio-Temporal Urban Growth of Islamabad. Egypt. J. Remote Sens. Space Sci. 2022, 25, 541–550. [Google Scholar] [CrossRef]
  19. Rimal, B.; Zhang, L.; Keshtkar, H.; Haack, B.N.; Rijal, S.; Zhang, P. Land Use/Land Cover Dynamics and Modeling of Urban Land Expansion by the Integration of Cellular Automata and Markov Chain. ISPRS Int. J. Geo-Inf. 2018, 7, 154. [Google Scholar] [CrossRef] [Green Version]
  20. Taylor, J.R.; Lovell, S.T. Mapping Public and Private Spaces of Urban Agriculture in Chicago through the Analysis of High-Resolution Aerial Images in Google Earth. Landsc. Urban Plan. 2012, 108, 57–70. [Google Scholar] [CrossRef]
  21. Malarvizhi, K.; Kumar, S.V.; Porchelvan, P. Use of High Resolution Google Earth Satellite Imagery in Landuse Map Preparation for Urban Related Applications. Procedia Technol. 2016, 24, 1835–1842. [Google Scholar] [CrossRef]
  22. Hu, Q.; Wu, W.; Xia, T.; Yu, Q.; Yang, P.; Li, Z.; Song, Q. Exploring the Use of Google Earth Imagery and Object-Based Methods in Land Use/Cover Mapping. Remote Sens. 2013, 5, 6026–6042. [Google Scholar] [CrossRef] [Green Version]
  23. Sathunuri, K.; Kumar, R.; Gogoi, K. Land Use/Land Cover Dynamics During 2001 And 2021 Using Google Earth Engine and GIS in Ramagundam Coal Mining Area, A Part of Pranhita Godavari Valley, Southern India. J. Sci. Res. 2022, 66, 63–68. [Google Scholar] [CrossRef]
  24. Muhammad, R.; Zhang, W.; Abbas, Z.; Guo, F.; Gwiazdzinski, L. Spatiotemporal Change Analysis and Prediction of Future Land Use and Land Cover Changes Using QGIS MOLUSCE Plugin and Remote Sensing Big Data: A Case Study of Linyi, China. Land 2022, 11, 419. [Google Scholar] [CrossRef]
  25. Kamaraj, M.; Rangarajan, S. Predicting the Future Land Use and Land Cover Changes for Bhavani Basin, Tamil Nadu, India, Using QGIS MOLUSCE Plugin. Environ. Sci. Pollut. Res. 2022, 29, 86337–86348. [Google Scholar] [CrossRef]
  26. Ning, J.; Liu, J.; Kuang, W.; Xu, X.; Zhang, S.; Yan, C.; Li, R.; Wu, S.; Hu, Y.; Du, G.; et al. Spatiotemporal Patterns and Characteristics of Land-Use Change in China during 2010–2015. J. Geogr. Sci. 2018, 28, 547–562. [Google Scholar] [CrossRef]
  27. Naikoo, M.W.; Rihan, M.; Ishtiaque, M. Shahfahad Analyses of Land Use Land Cover (LULC) Change and Built-up Expansion in the Suburb of a Metropolitan City: Spatio-Temporal Analysis of Delhi NCR Using Landsat Datasets. J. Urban Manag. 2020, 9, 347–359. [Google Scholar] [CrossRef]
  28. Appiah, D.O.; Schröder, D.; Forkuo, E.K.; Bugri, J.T. Application of Geo-Information Techniques in Land Use and Land Cover Change Analysis in a Peri-Urban District of Ghana. ISPRS Int. J. Geo-Inf. 2015, 4, 1265–1289. [Google Scholar] [CrossRef] [Green Version]
  29. Chatterjee, A.; Chattopadhyay, R.N. Metropolitan Regions of India: Rapid Growth, Changing Landuse and Challenges. In Satellite Towns in Neo-metropolitan Development in India; Springer: Berlin/Heidelberg, Germany, 2020; pp. 87–100. [Google Scholar]
  30. Sekar, S.P.; Kanchanamala, S. An Analysis of Growth Dynamics in Chennai Metropolitan Area. Inst. Town Planners 2011, 8, 31–57. [Google Scholar]
  31. Rajendran, V.; Kaneda, T. A Simulation of Land Use/Cover Change for Urbanization on Chennai Metropolitan Area, India. In Proceedings of the REAL CORP 2014—PLAN IT SMART! Clever Solutions for Smart Cities. 19th International Conference on Urban Planning, Regional Development and Information Society, Vienna, Austria, 21–23 May 2014; pp. 25–34. [Google Scholar]
  32. Chanu, C.S.; Elango, L.; Shankar, G.R. A Geospatial Approach for Assessing the Relation between Changing Land Use/Land Cover and Environmental Parameters Including Land Surface Temperature of Chennai Metropolitan City, India. Arab. J. Geosci. 2021, 14, 132. [Google Scholar] [CrossRef]
  33. Lilly Rose, A.; Devadas, M.D. Analysis of Land Surface Temperature and Land Use/Land Cover Types Using Remote Sensing Imagery-a Case in Chennai City, India. In Proceedings of the 7th International Conference on Urban Climate, Yokohama, Japan, 29 June–3 July 2009; Volume 29. [Google Scholar]
  34. Wibowo, A.; Osman Salleh, K.; Frans, F.T.; Semedi, J.M. Spatial Temporal Land Use Change Detection Using Google Earth Data. IOP Conf. Ser. Earth Environ. Sci. 2016, 47, 12031. [Google Scholar] [CrossRef]
  35. Zurqani, H.A.; Post, C.J.; Mikhailova, E.A.; Schlautman, M.A.; Sharp, J.L. Geospatial Analysis of Land Use Change in the Savannah River Basin Using Google Earth Engine. Int. J. Appl. Earth Obs. Geoinf. 2018, 69, 175–185. [Google Scholar] [CrossRef]
  36. Floreano, I.X.; de Moraes, L.A.F. Land Use/Land Cover (LULC) Analysis (2009–2019) with Google Earth Engine and 2030 Prediction Using Markov-CA in the Rondônia State, Brazil. Environ. Monit. Assess. 2021, 193, 239. [Google Scholar] [CrossRef]
  37. Castilla, G.; Hay, G. Uncertainties in Land Use Data. Hydrol. Earth Syst. Sci. 2007, 11, 1857–1868. [Google Scholar] [CrossRef] [Green Version]
  38. Congalton, R.; Gu, J.; Yadav, K.; Ozdogan, M. Global Land Cover Mapping: A Review and Uncertainty Analysis. Remote Sens. 2014, 6, 12070. [Google Scholar] [CrossRef]
Figure 1. (a) India Map showing the location of the study site; (b) Map layout depicting the four study sites along the outer ring road; (c) Google Earth (Geo Eye) images of the study sites namely Chikkarayapuram, Nazarathpettai, Meppur and Perungalathur.
Sustainability 14 16373 g001
Figure 2. Methodology depicting the workflow carried out in the study.
Sustainability 14 16373 g002
Figure 3. Land cover maps of Chikkarayapuram segment for the years (a) 2009, (b) 2012, and (c) 2016.
Sustainability 14 16373 g003
Figure 4. Land cover map of Nazarathpettai segment for the years (a) 2009, (b) 2012, and (c) 2016.
Sustainability 14 16373 g004
Figure 5. Land cover maps of Meppur segment for the years (a) 2009, (b) 2012, and (c) 2016.
Sustainability 14 16373 g005
Figure 6. Land cover maps of Perungalathur segment for the year (a) 2009, (b) 2012, and (c) 2016.
Sustainability 14 16373 g006
Figure 7. Change detection maps of Chikkarayapuram segment (a) 2009–2012, (b) 2012–2016, and (c) 2009–2016.
Sustainability 14 16373 g007
Figure 8. Change detection maps of Nazarathpettai segment (a) 2009–2012, (b) 2012–2016, and (c) 2009–2016.
Sustainability 14 16373 g008
Figure 9. Change detection maps of Meppur segment (a) 2009–2012, (b) 2012–2016, and (c) 2009–2016.
Sustainability 14 16373 g009
Figure 10. Change detection maps of Perungalathur segment (a) 2009–2012, (b) 2012–2016, and (c) 2009–2016.
Sustainability 14 16373 g010
Figure 11. Predicted land cover maps of (a) Chikkarayapuram segment, (b) Nazarathpettai segment, (c) Meppur segment, and (d) Perungalathur segment for the year 2022 using MOLUSCE plugin in QGIS.
Sustainability 14 16373 g011
Figure 12. Variation in the year-wise change in land cover classes in Chikkarayapuram segment. (* Predicted based on previous years).
Sustainability 14 16373 g012
Figure 13. Variation in the year-wise change in land cover classes in Nazarathpettai segment. (* Predicted based on previous years).
Sustainability 14 16373 g013
Figure 14. Variation in the year-wise change in land cover classes in Meppur segment. (* Predicted based on previous years).
Sustainability 14 16373 g014
Figure 15. Variation in the year-wise change in land cover classes in Perungalathur segment. (* Predicted based on previous years).
Sustainability 14 16373 g015
Figure 16. Variation in the class-wise areal changes in the predicted output map for the four study sites.
Sustainability 14 16373 g016
Figure 17. Trendline depicting the variation of spread among predicted class area in the four study sites.
Sustainability 14 16373 g017
Table 1. Land use/Land cover classification.
ClassDescription
ResidentialIncludes apartments, houses, huts, malls, stadiums and facilities.
IndustrialIncludes factories, mills and industries.
Barren landIncludes areas with no vegetation cover, stock quarry, stony areas, and uncultivated agricultural land.
Agricultural landInclude most of green gardens, cultivated lands, and croplands.
Water bodyIncludes river, lake, and pond.
Marshy landIncludes wetland dominated by herbaceous rather than woody plant species along with grasses, rushes and reeds.
Other vegetationIncludes areas of arid lands with short and long vegetation
Table 2. Land cover area of Chikkarayapuram segment.
ClassYear
2009201220162022 *
Area (in sq. m)
Agriculture1,260,000801,360655,740537,570
Other-vegetation1,109,0001,501,2001,450,170371,250
Water body499,000439,600396,810452,250
Residential103,000347,200437,5801,140,120
Barren603,000370,980400,41022,230
Industry86,700178,560285,030740,790
Swamp11,20013,400 24,930363,600
* Predicted based on previous years.
Table 3. Land cover area of Nazarathpettai segment.
ClassYear
2009201220162022 *
Area (in sq. m)
Agriculture309,540136,00034,7208960
Other-vegetation1,183,6001,104,000541,0001,036,910
Water body86,50065,00057,600168,280
Residential495,000765,000787,000383,390
Barren596,800558,2001,158,00053,480
Industry65,80089,200131,3001,114,120
Swamp52,00085,82059,36031,080
* Predicted based on previous years.
Table 4. Land cover area of Meppur segment.
ClassYear
2009201220162022 *
Area (in sq. m)
Agriculture944,000928,000569,100577,824
Other-vegetation807,3001,142,0001,144,900159,666
Water body117,300149,000115,50022,152
Residential209,000350,000677,0001,161,888
Barren846,500331,500393,00013,182
Industry46864,50019,400927,966
Swamp81,80025,50042,70087,594
* Predicted based on previous years.
Table 5. Land cover area of Perungalathur segment.
ClassYear
2009201220162022 *
Area (in sq. m)
Agriculture171,520233,000162,800133,598
Other-vegetation790,300453,000406,000688,894
Water body112,40087,90067,60031,825
Residential321,800577,0001,099,000396,640
Barren1,417,7201,360,000878,00088,172
Industry301540,80022,4001,362,043
Swamp616432,60097,80055,744
* Predicted based on previous years.
Publisher’s Note: MDPI stays neutral with regard to jurisdictional claims in published maps and institutional affiliations.

