Article

Which Provincial Regions in China Should Give Priority to the Redevelopment of Abandoned Coal Mines? A Redevelopment Potential Evaluation Based Analysis

1
School of Coal Engingeering, Shanxi Datong University, Datong 037003, China
2
School of Energy and Mining Engineering, China University of Mining and Technology (Beijing), Beijing 100083, China
3
School of Mining and Geomatics Engineering, Hebei University of Engineering, Handan 056038, China
*
Author to whom correspondence should be addressed.
Sustainability 2022, 14(23), 15923; https://doi.org/10.3390/su142315923
Submission received: 19 October 2022 / Revised: 18 November 2022 / Accepted: 24 November 2022 / Published: 29 November 2022

Abstract

:
Abandoned mines have a double nature consisting of resources and assets, and their rational redevelopment is one of the most important practices of the recycling economy. To direct the layout of the regional abandoned mine redevelopment, this paper constructs a comprehensive assessment framework for abandoned mine redevelopment potential based on the driving force–state–response (DSR) model. It is quantitatively evaluated by three-dimensional cloud models, and the results are coupled using a four-quadrant approach. From the perspective of space control, this paper proposes classification principles of redevelopment potential and redevelopment sequence and summarizes the important policy implementations for each category. The paper studies the redevelopment potential of abandoned mines from the provincial perspective in 25 coal-producing provinces of China. The results indicate that not all areas with high resource potential are suitable for redevelopment. In the northern and western regions, the regional abandoned mines have high resource potential and strong redevelopment drivers. However, the spatial pattern of the suitability of the development conditions is not distributed in the same way as the resources. The distribution of the abandoned mine redevelopment potential reveals that the eastern and east-central regions should give priority to the construction of demonstration projects. Different driving force scenarios confirm that most provinces have no obvious driving factor preference, with a few exceptions. This evaluation model is established from a more comprehensive perspective and is a valuable aid for decision makers when arranging abandoned mine regeneration projects.

1. Introduction

An abandoned mine, also known as a mine closure or a closed mine, refers to the mine being closed permanently due to the depletion of its reserves or because of other premature closure reasons, such as the failure to meet safe mining conditions, community pressures, no standard regulations or policies, etc. [1] (Amirshenava and Osanloo, 2018). Along with the circular economy gaining popularity in China, people have paid more and more attention to the redevelopment of abandoned mines, not only because they contain a large number of reusable energy resources, such as residual coal and coal-bed methane, but also because they have abundant mine drainage, geothermal energy, underground space, tourism resources, etc. [2]. The inappropriate and irrational use of abandoned mines brought not only a huge waste of coal but also serious deterioration. Such severe influences on-site and off-site are outstandingly shown in the sharp economic recession, unemployment, ecological environment pollution, and so on [3,4,5]. Therefore, from the perspective of China’s energy policy, environmental policy, and governance in general, the redevelopment of abandoned mines is imperative to mitigate the unintended consequences of the energy structure adjustment policies [6].
Abandoned mine redevelopment (AMR) refers to the reconfiguration of its functions by engineering, biological, and other measures to maximize the resource value. For example, the old underground tunnels can be reused as energy storage peaking power stations or heating centers [7], and the mining subsidence area can be reconstructed as a new energy base [8]. To improve the efficiency and quality of AMR and avoid the situation which is blossoming everywhere, it is urgent to make a quantitative assessment of the abandoned mine redevelopment potential (AMRP).
The AMRP means the potential ability that can be brought into play to promote the sustainable development of the AMR industry in competition with other regions under the comprehensive action of resource endowment, economic, social, and environmental demand, and social support capacity [9]. Consequently, as the basic work of AMR sequence planning, the assessment of AMRP has an important influence on maximizing the value of projects and reducing the investment risk [10].
As the world’s largest producer and consumer of coal, China still maintains high-intensity coal mining. With the gradual implementation of the policy on reducing the coal capacity, the coal mines with poor reserves (reserves–production ratio of less than 5 years) or with backward productivity are being closed, which is leading to a drastic increase in the number of closed mines [11]. In 2016–2017 alone, the number of closed coal mines in China was about 3000. The number of coal mines in China began to decrease from more than 14,000 in the early stage of the 12th five-year plan to about 5800 by the end of 2018. Despite China having a relatively large number of abandoned mines, the resourceful reutilization effect of the abandoned mines is unsatisfactory. AMR is faced with many challenges. The most prominent manifestation is that the assessment system of the AMRP is not perfect and lacks the necessary data for supporting the layout of the redevelopment industry, which directly affects the redevelopment quality. The absence of a quantitative evaluation framework of the abandoned mines’ values in China seriously hinders the redevelopment advancement.
According to the search conducted in Scopus, Google Scholar, and Crossref, there are few references for the assessment of AMRP. Currently, the scattered but valuable research is mainly concentrated on the aspects of value identification, management measures, and the development sequence of single resources such as mined land, industrial heritage, mining waste, and underground space. Bakhtavar et al. [12] studied the reuse of mined land and pointed out that the reuse model must be decided reasonably according to the effective evaluation of the economic factors and regional conditions. Sutherland [13] emphasized the industrial tourism value of abandoned mines and concluded that the development of industrial heritage should be combined with regional transformation to ensure the coordinated development of the economy and the environment. Lèbre et al. [14] revealed the recycling value of mining waste from three critical aspects: time, the extractive strategy, and the economic context. Kubit [15] comprehensively considered the influence of the regional economic development level, the labor force level, local employment, market demand, energy consumption, and the environmental conditions on the utilization of abandoned mining land after reclamation. Li et al. [16] proposed a driving force–state–response (DSR) model of abandoned coal mine industry square redevelopment, which integrates planning, land rehabilitation, and ecology, and analyzed the factors influencing the DSR framework. It can be seen that the current research is not comprehensive and in-depth with regard to the basic strategic issues, such as the study of regional abandoned mine redevelopment potential and redevelopment sequence. To our knowledge, no study has explored AMRP from the perspective of a provincial scale, and there is no quantitative assessment framework for AMRP, which presents an opportunity for the contributions of this paper.
Through analyzing the current research status and problems, this paper proposes a comprehensive indicator system for AMRP, including resource potential, driving force, and the suitability of development conditions based on the DSR mode. A complete index system is essential for assessing the comprehensive performance of AMRP. To reflect the contributions of the indicators, this paper calculates the indicators’ weights by the improved analytic hierarchy process (IAHP) method to avoid the coincidence examination and the adjustment of the judgment matrix. Then, the cloud model is employed to calculate the potential level of the resource potential, the driving force, and the suitability of the development conditions to take into account, respectively, the randomness and fuzziness of the indicators. The level of AMRP is determined by these three dimensions, and this paper therefore uses the four-quadrant method with a bubbles map to couple the results of the driving force (D), the resource potential (state), and the suitability of the development conditions (response) and, finally, to comprehensively classify the redevelopment potential and redevelopment sequence of regional abandoned mine development. Then, ArcGIS is used to discuss the spatial patterns of the three dimensions and to analyze the regional differences, respectively.

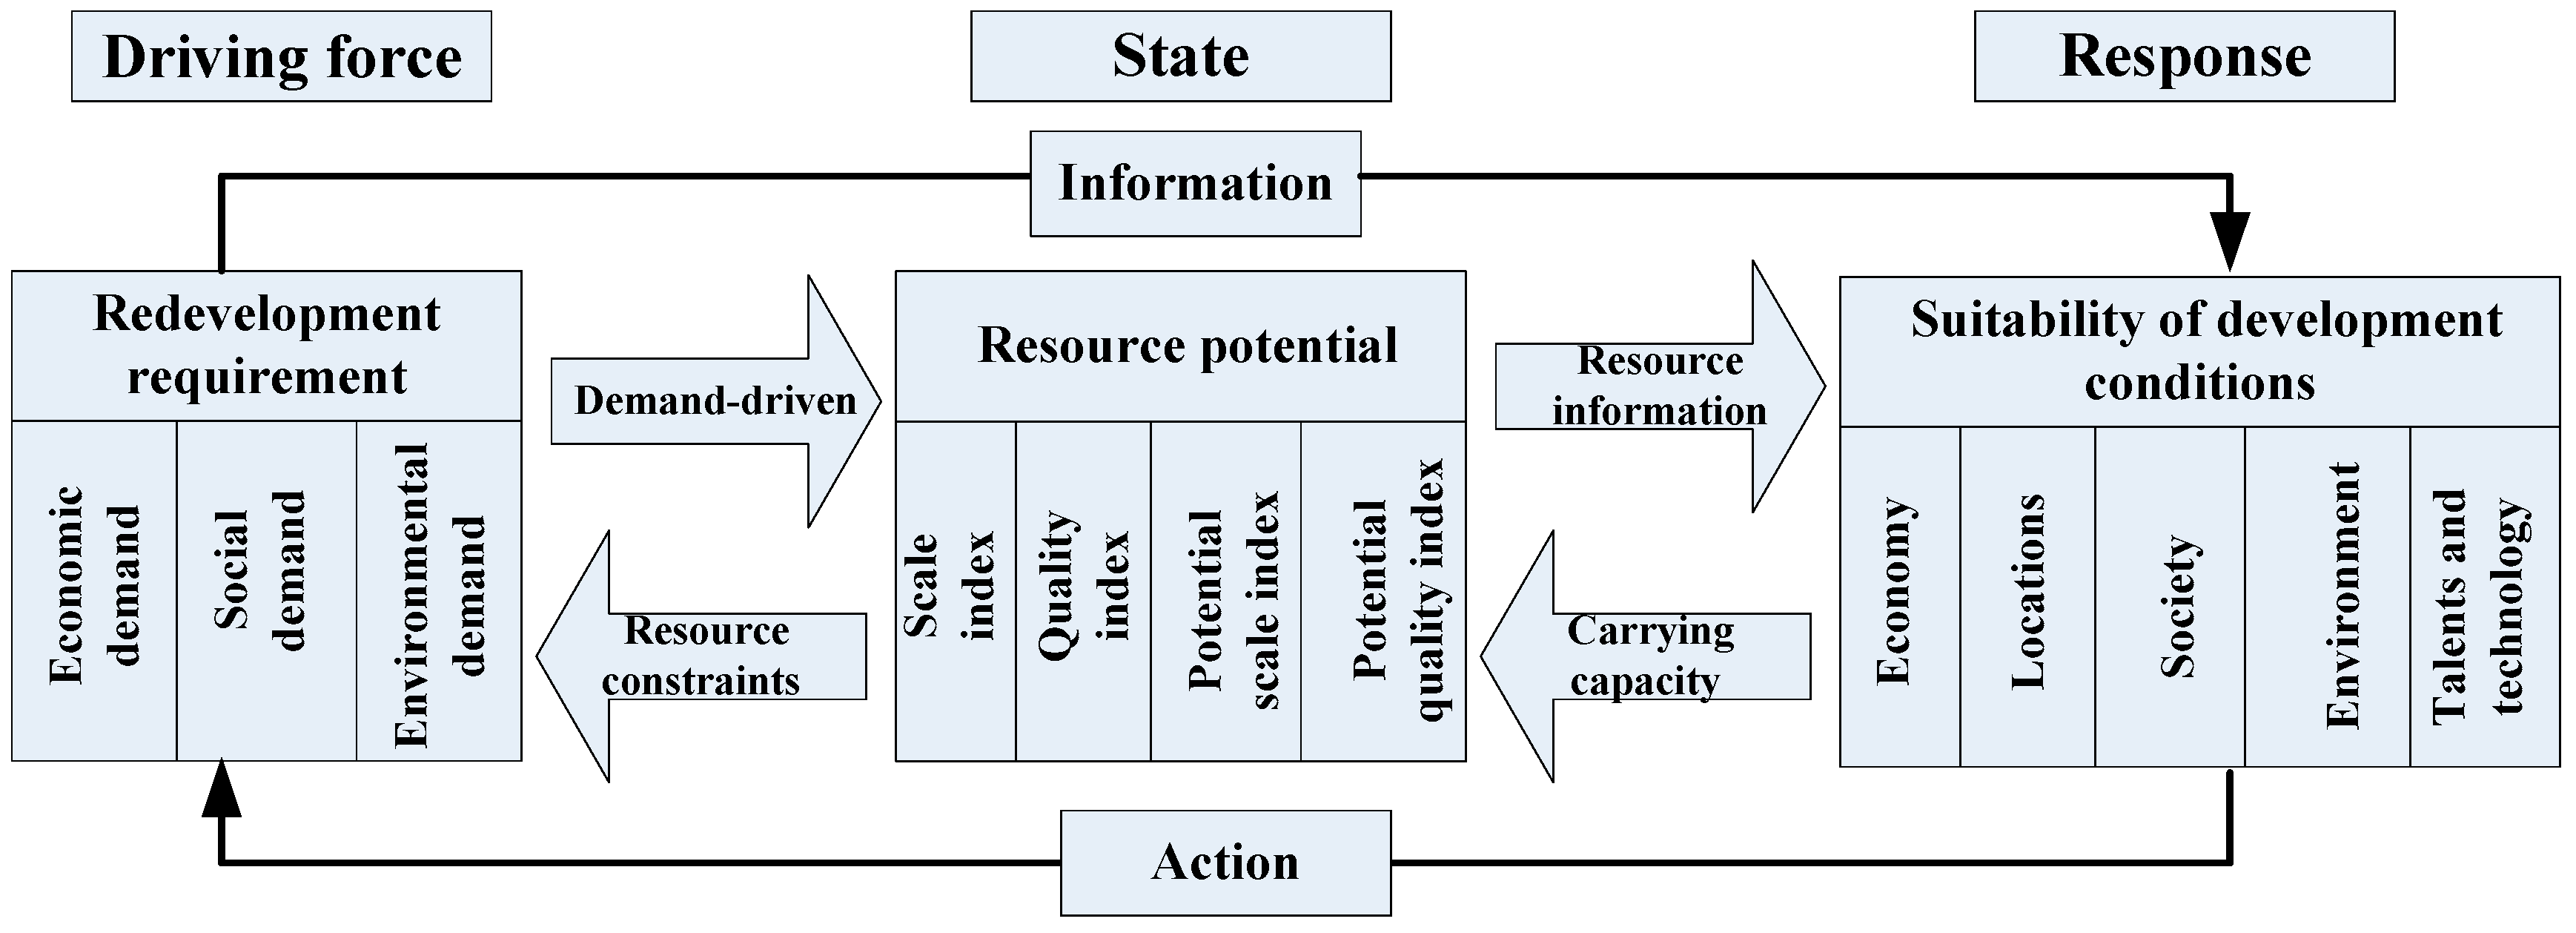
2. Components of Abandoned Mine Redevelopment Potential

Based on the PSR model developed by the United Nations Commission on Sustainable Development (UNCSD), the driving force–state–response (DSR) model was constructed for sustainable assessment [17]. According to the DSR framework, this paper proposed the assessment system of the AMRP from three dimensions. The interactions of the dimensions are demonstrated in Figure 1, where “driving force” is the fundamental factor that causes the changes of the “state”, “State” is the constraint condition for the realization of “Driving force” and the basic basis for the formulation of “Response”, and the “Response” is an important way to promote the change of the “State”.

2.1. Driving Force

As AMR can contribute to the region socially, economically, and ecologically, the driving force is oriented to the performance of AMR [18]. Due to the performance being difficult to express quantitatively, this paper adopts the requirements of the regional sustainable development of mining and society to reflect the driving force indirectly. The more in demand it is in the region, the better the benefit and the stronger the driving force. According to the triple bottom line principle of sustainability, the demands of AMR are mainly identified from the economic, social, and environmental aspects [19,20]. The economic demand indicators are selected from the impacts of mine closure on the regional economy and financial revenue. Due to the absence of added value data on the coal mining industry, this paper replaces this indicator with mining investment. The social demand indicators stem from two aspects: the influences of mine closure on society and the resource constraints of social development. The environmental demand indicators come from the environmental carrying capacity. As the emissions data of wastes in the provincial area are unavailable, this paper uses the “Per unit GDP energy consumption” to indirectly reflect the environmental pollution. All the detailed indicators of driving force are listed in Table 1.

2.2. State

The “State” refers to the basic conditions of the abandoned mines, which reflects the resource potential available for redevelopment. Due to a large number of abandoned mines, various types of residual resources, and the shortage of value classification standards for the various resources, it is difficult to recognize the value of the abandoned mine and evaluate the resource potential of the regional abandoned mines. Therefore, from the perspective of data availability and quantitative analysis, this paper adopts the scale index and quality index to measure the resource ontology characteristics of the abandoned mines [32]. The scaled index refers to the number of abandoned mines in a region, and a large number of abandoned mines is certain to bring out industry-scale effects [33]. The quality index is explained as the average capacity of the regional closed mines. The fact is that most of the small-scale mines operated using poor mining technology, which resulted in serious damage to the underground space. Moreover, the incomplete mine information causes the low redevelopment value of these mines. Therefore, the larger the capacity, the easier the abandoned mines will be to redevelop. The quantity and quality of the “potential resources” of the abandoned mines are the important basic foundation for future redevelopment. These indicators are the final determinants of whether the regional abandoned mines have the development possibility in the future. To facilitate quantitative analysis, the number of existing mines and the average capacity of these mines are adopted to reflect the value characteristics of the potential resources. The indicators of resource potential are presented in Table 2.

2.3. Response

The evaluation of AMRP cannot exist away from the regional conditions [25]. The “response” mainly considers the support degree of the local development conditions in the economy, infrastructure, technology, governmental ability, and so on. This paper uses the suitability of development conditions to reflect the response of a region. It should be pointed out that the locational conditions directly affect the redevelopment potential [39]. If the locational conditions are extremely good, the mail addressed to the area will get sent elsewhere. The better the support, the stronger the support degree became. Based on the works of the literature reviews, this paper classified the suitability of the external conditions into economy, locational conditions, talent science and technology, environmental support, and social support. The indicators of the response are shown in Table 3.

3. Methodologies

3.1. Cloud Model for Abandoned Mine Redevelopment Potential

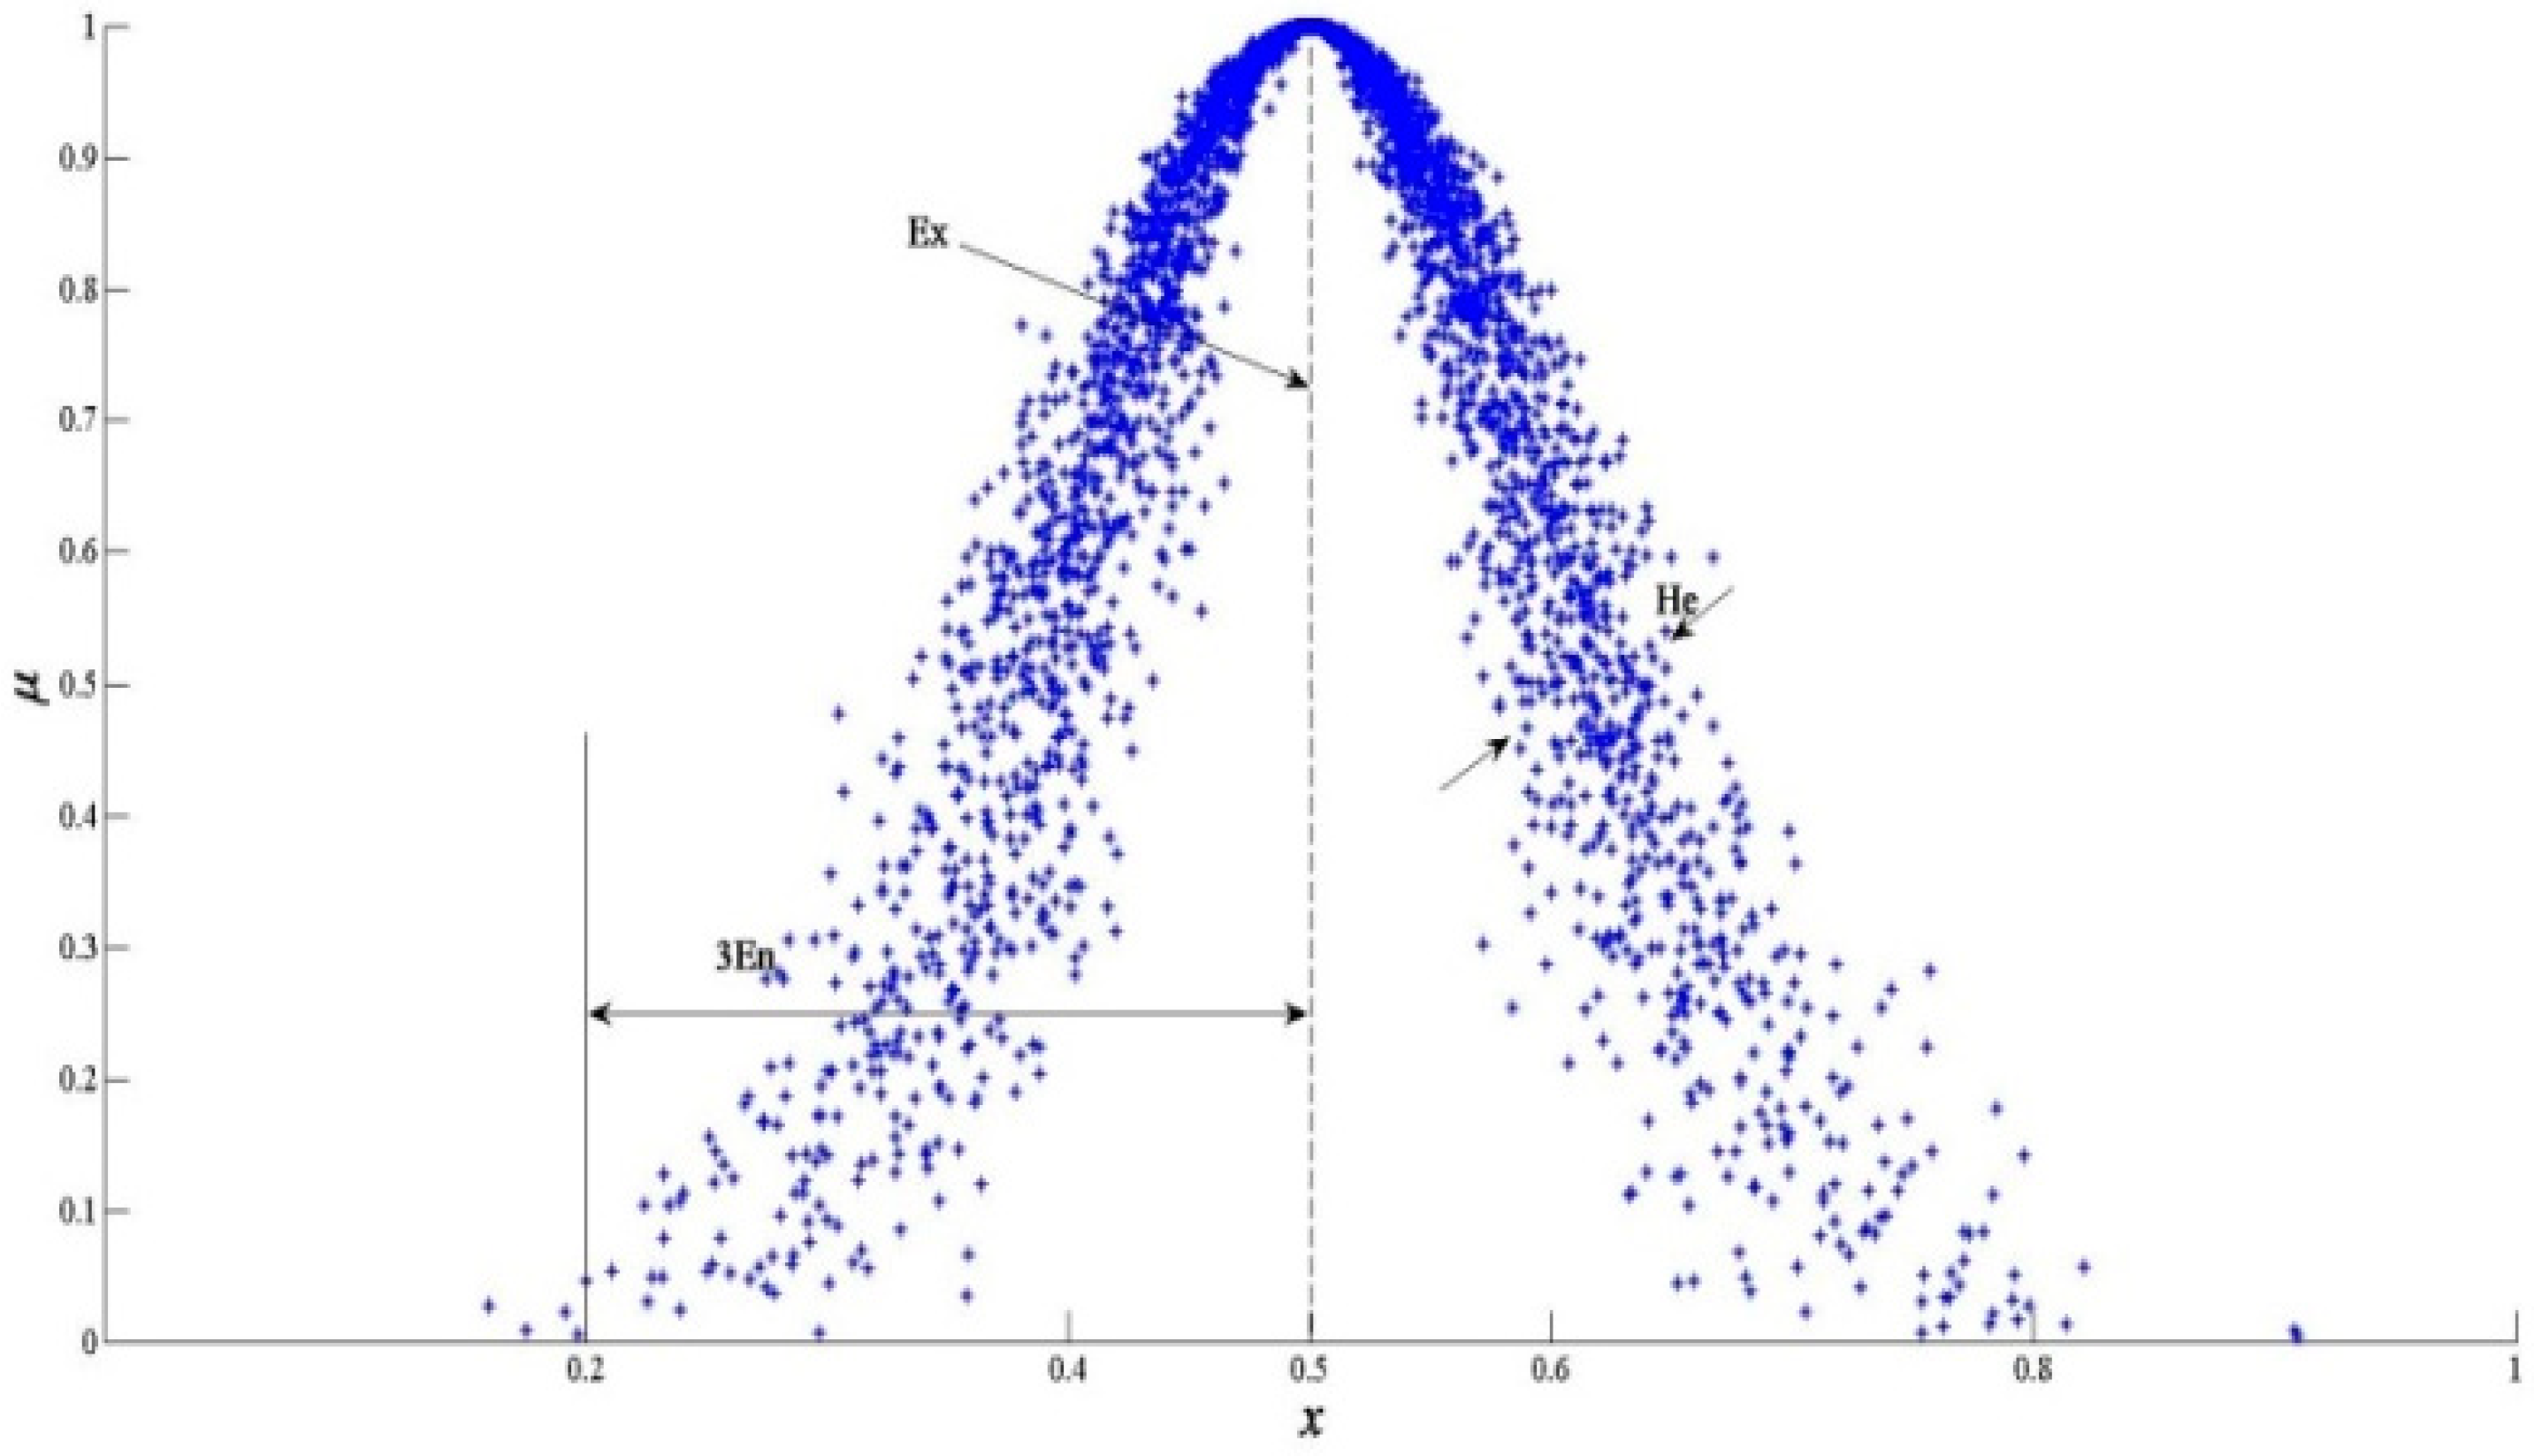
3.1.1. The Basic Theory of the Cloud Model

The evaluation of potential is a multi-dimensional decision-making process, and the evaluation method should take into account the randomness and fuzziness of uncertain concepts to obtain more scientific results. The cloud model is a powerful tool to realize the transformation between the quantitative concepts and the qualitative data by cloud generators. The forward cloud generator is used to convert the cloud model to the specific value. The algorithm is described in Table A1. The one-dimensional normal cloud, constructed based on the normal distribution and Gaussian membership function, is a very important cloud model with general applicability. It has been widely applied in environmental assessment [48], risk assessment [49], artificial intelligence [50], and so on. The normal cloud model discards the traditional membership function but uses three numerical features, namely expected (Ex), entropy (En), and super entropy (He), to describe the fuzziness and randomness of the indicators. The description of each parameter and the calculation formulas are shown in Table 4 by referring to [21]. To illustrate the cloud model more clearly, we present a cloud figure corresponding to the cloud parameters (0.5, 0.1, 0.02). It can be seen in Figure 2 that the expectation value is 0.5 with a variation range (0.2–0.8) based on the “3En criterion”. The span of the cloud image reflects the fuzziness, and the cloud image thickness interprets the randomness of the concept.

3.1.2. Evaluation Process for AMRP Based on Cloud Model

The assessment processes by the normal cloud method are shown as follows:
Step 1: Set the indicator sets, weight sets, and estimation sets
Based on the multidimensional decision theory, the paper proposed three indicator sets, U1 = {D1, D2, …, D8}, U2 = {R1, R2, R3, R4}, and U3 = {S1, S2, …, S12}, where the elements of these sets are derived from the driving force, the resource potential, and suitability of the development condition, respectively. Accordingly, there are three weight sets W1 = {WD1, WD2, …, WD8}, W2 = {WR1, WR2, WR3, WR4}, and W3 = {WS1, WS2, …, WS12} to respond to the three indicator sets. The estimation set can be described as V = {V1, V2, …, V5} = {Lower, Lower, Moderate, High, Higher}, where the number 5 represents 5 assessment grades.
Step 2: Grade the cloud model
The indicators’ intervals are first determined by the mean variance classification method. Then, the cloud parameters of all the indicators can be calculated by the computation formula given in Table 4. The cloud parameters of the indicators used in this paper are shown in Table A2.
Step 3: Obtain the certainty degrees of the indicators
Inputting the collected basic data of the 24 indicators into the forward cloud generator and calculating the average membership value by repeating 100 times, we can obtain the subordinate degrees of the evaluated indicators that belong to different grades. The three membership matrixes Ui (i = 1, 2, 3) are obtained by Equation (1):
U i = | μ 11 μ 15 μ n 1 μ n 5 |
where n refers to the indicator number of each dimension, and 5 represents the assessment grades.
Step 4: Determine the level of the three dimensions
Combining the weight matrices Wi (i = 1, 2, 3) calculated in Section 3.2, the grade memberships of the different dimensions are acquired by Equation (2):
R = W × U
where R = ( r 1 , r 2 , , r 5 ) , and rj indicates the degree of membership that belongs to Cj (j = 1, 2, 3, 4, 5). The unfitness of the maximum membership principle could be overcome by the feature value of grades (FVG) for the results quantification, and the calculation formula is given in Equation (3). The final assessment results are demonstrated in Table A3.
R = k = 1 5 k R k / k = 1 5 R k

3.2. Indicators Weights by Improved AHP

The analytic hierarchy process (AHP) is the most common method for determining the weight [51]. However, with the relatively complex indicator system of AMRP (three dimensions with 24 indexes), there are some problems in the AHP. The major problem in the practical application is how to examine and correct the consistency of the judgment matrix, which greatly limits its application. For the sake of the efficient determination of the indicators’ weights, this paper adopts the scale-extending method to improve the traditional AHP (IAHP). The construction processes of the judgment matrix by the IAHP are as follows. Firstly, all the criteria layer indicators are to be ranked according to the order of their importance. The importance value as judged by the individual expert’s opinion is referred to the nine-point scale proposed by Saaty (see Table A4). The obtained importance sequence of the indicators is set as x1 > x2 > x3 > ··· > xn. Then, the judgment matrix R which has a satisfactory consistency is shown in Equation (4). The indicators’ weights can be calculated by Equation (5).
When the criteria layer indicators’ weights are determined, we can determine the index layer indicators’ weights by the same algorithm. The global weights of all the indicators are calculated by multiplying the criteria layer indicators’ weights by the corresponding index layer indicators’ weights. The improved AHP method avoids the coincidence examination and the adjustment of the judgment matrix, which simplifies the calculation and defines the weighing more scientifically and more properly.
R = | 1 t 1 t 1 t 2 t 1 t 2 t 3 t 1 t 2 t n 1 1 / t 1 1 t 2 t 2 t 3 t 2 t 3 t n 1 1 / t 1 t 2 1 / t 2 1 t 3 t 3 t 4 t n 1 1 / t 1 t 2 t 3 1 / t 2 t 3 1 / t 3 1 t 4 t 5 t n 1 1 / t 1 t 2 t n 2 1 / t 2 t 3 t n 2 1 / t 3 t 4 t n 2 1 / t 4 t 5 t n 2 t n 1 1 / t 1 t 2 t n 1 1 / t 2 t 3 t n 1 1 / t 3 t 4 t n 1 1 / t 4 t 5 t n 1 1 |
w i = j = 1 n r i j n / i = 1 n j = 1 n r i j n
where wi is the weight value of the i-th indicator given by an individual expert; rij is the value of the preference of the i-th compared to the j-th element.
Due to the weights being determined by a group of experts, the experts’ preferences expressed by the IAHP judgment matrix in group decision making should be effectively integrated. The most common way is to fuse all the experts’ judgment matrices into one judgment matrix by the weighted geometric average (WGA) method [51]. The judgment matrix elements are calculated according to Equation (6):
a i j = ( a i j , 1 ) 2 1 × ( a i j , 2 ) 2 2 ( a i j , m ) 2 k
In Equation (6), k represents the number of experts, (aij, k) is the matrix element of the k-th expert, and λ k indicates the weight of each expert. As the weight of the experts is difficult to determine, this article assumes that the importance of each expert is of equal weight; so, Equation (6) can be simplified as Equation (7). The final weights results are listed in Table 5.
a i j = ( a i j , 1 ) × ( a i j , 2 ) ( a i j , m ) k

4. Results and Discussion

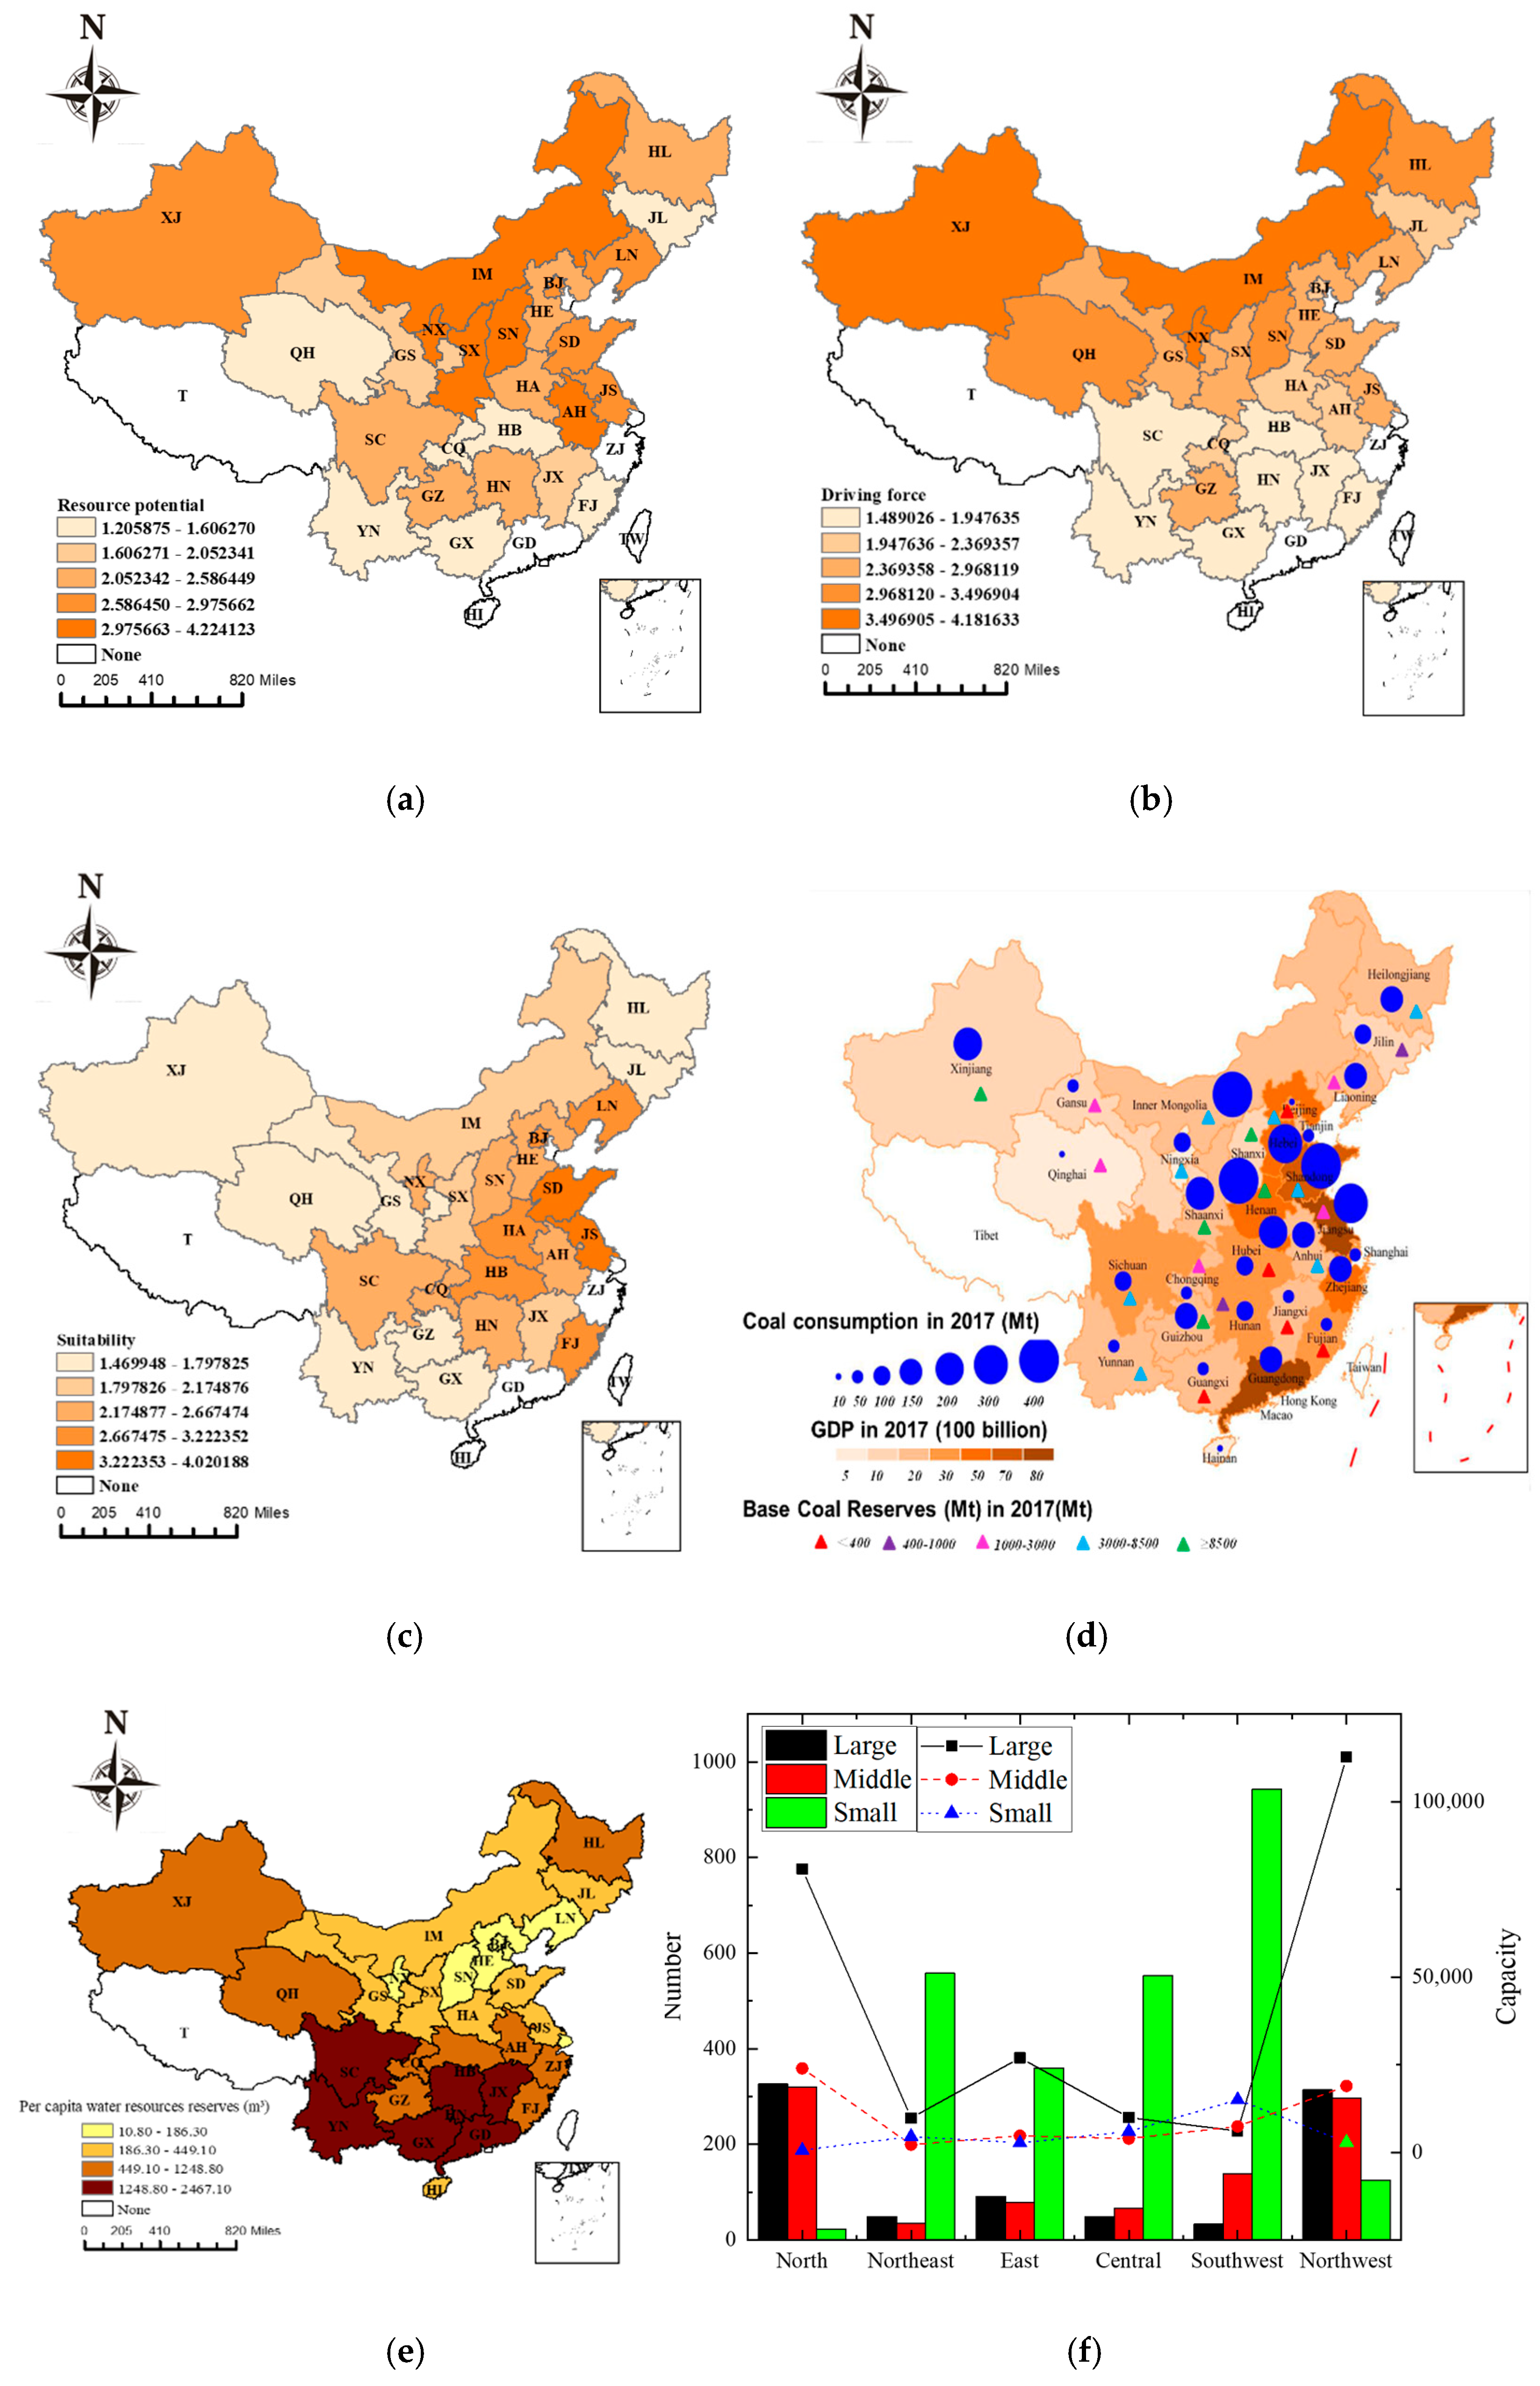
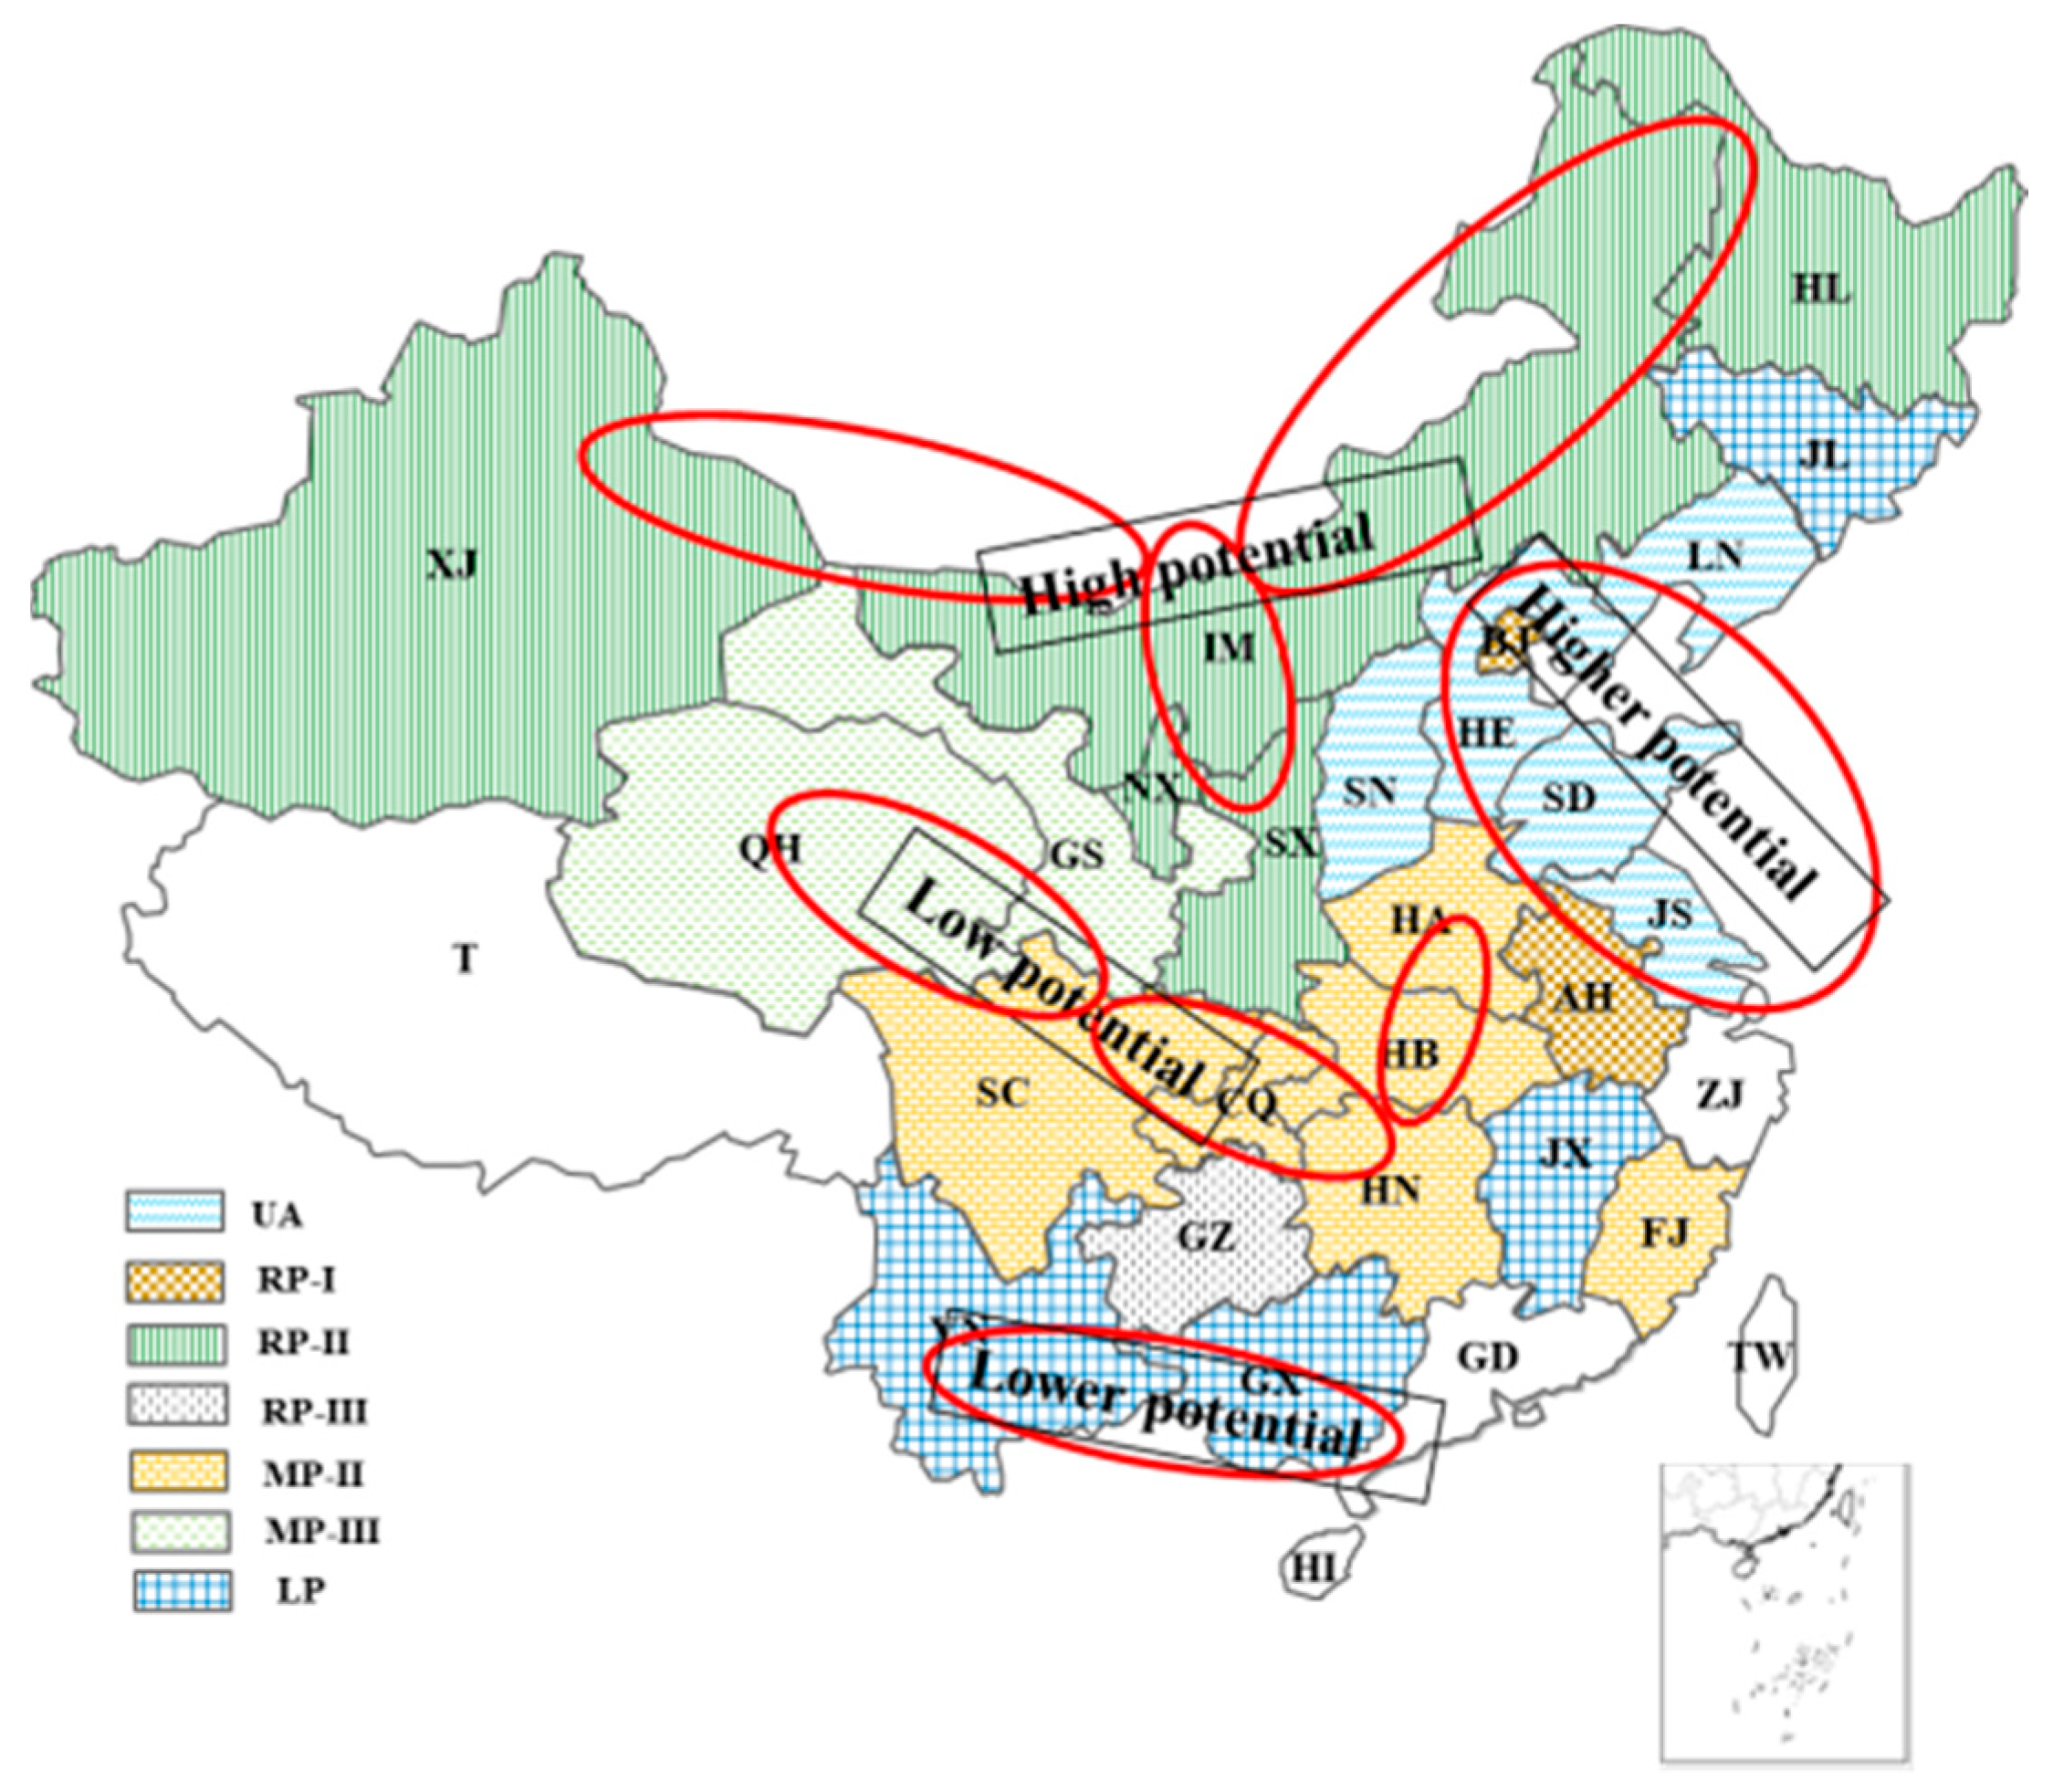
4.1. Spatial Patterns of AMRP

Because a coal mine that has been closed for many years is hard to reuse (except for the land and part of the facilities), this paper mainly focuses on the mine’s closed redevelopment since the implementation of the coal capacity cut policy in 2016. Based on the basic data collected in Table 1, Table 2 and Table 3 in 2017, this article adopts the normal cloud model to assess the grades of abandoned mine resource potential, the driving force, and the development condition suitability, respectively. The feature value of the grade results is shown in Table 6. The potential evaluation results of the three dimensions are divided into 5 grades by the Jenks method in ArcGIS 10.2, and the grade distribution diagrams are obtained through the technology of spatial visualization. As can be seen in Figure 3a–c, the darker the color, the higher the grade. To support the demonstration and analysis of the results, this paper also presents a spatial distribution diagram that reflects the information on the total coal consumption, the economic aggregate, and the basic reserves of coal in 2017 in Figure 3d. Furthermore, the per capita water resources and the number of mines and the coal production capacity by region in China are given in Figure 3e,f, respectively, to compare the evaluation results.
The driving force score is shown in Figure 3a; the provinces with a high driving force (FVGD ≥ 2.96) are Inner Mongolia, Xinjiang, Ningxia, Shanxi, and Shaanxi, which belong to the northwest region. Combined with Figure 3d, it can be seen that the richer the province in terms of natural resources, the stronger its driving force ranking. However, these provinces’ economies rely heavily on coal production. Such a phenomenon is outstandingly shown in three aspects: the high proportion of the added value of the coal industry, the huge coal consumption, and the high proportion of mining workers. With the changing international environment and market environment, the traditional industrial strategy of resource exploitation and simple economic structure would suffer more. As can be seen in Figure 3e, the distribution of water resource reserves is the reverse of that of the coal resources. As the carriers of ecological benefits, the water resources have been seriously damaged by the processes of coal exploitation. If the water resources are not effectively protected in the process of mine closure, the pollution and destruction will be further aggravated. With the continuous implementation of the policy of cutting the coal capacity, the development of these provinces with severe overcapacity will face more sustainable development problems, which could lead to a strong endogenous impetus for abandoned mine redevelopment [6]. The driving force of the southern provinces is relatively weak. The reason can be explained by two factors: the relatively optimized industrial structure and the low dependence on resource exploitation [43]. It should be noted that the driving force of some of the eastern provinces which have satisfactory economic situation, such as Shandong, Jiangsu, and Hebei, is stronger than that of the southern provinces, which may be caused by overpopulation density, lack of water resources, and strong resource constraints [52].
In terms of the resource potential demonstrated in Figure 3b, the areas with high resource potential (FVGR ≥ 2.97) include Shanxi, Inner Mongolia, Shaanxi, Ningxia, Xinjiang, Anhui, and Beijing. On the whole, the distribution of the abandoned mines’ resource potential corresponds to the reserve distribution of the coal resources, as shown in Figure 3d. It can be seen in Figure 3f that in north and northwest areas, the medium and large mines occupy the dominant position, while in the southwest, central, and northeast regions, the coal mines are driven mainly by small-scale operations. According to the 13th five-year plan of the coal industry [53], the central and eastern provinces such as Beijing and Anhui should compress the scale of coal production, and the northern and western provinces need to harmonize the environmental protection and coal mining due to the fragile ecological environment. Therefore, with the background that the country is devoted to reducing excess coal capacity and strengthening ecological protection, the resource potential of these provinces, which have a long history of coal mining and many backward mines, is high. As for the southern provinces, such as Fujian, Jiangxi, Guangxi, Sichuan, and Yunnan (southwest in Figure 3f), it is necessary to speed up the closure of coal mines because of the sporadic distribution of resources and backward production capacity. However, even though the numbers of abandoned mines look great, the vast majority of them belong to small mines. That is why the southern provinces have a low resource potential.
The suitability of the development conditions in China has greater diversity among various regions, as shown in Figure 3c. The reasons could be described by the fact that the differences in regional economic development, geographical location, and traffic conditions directly affect the level of suitability. The distribution pattern of this indicator can be described as follows: the east region is the best, followed by the middle, and the west and southwest are the weakest [21]. As can be seen in Figure 3d, relative to the western regions, the middle and east regions, including Beijing, Shandong, Jiangsu, Fujian, and Liaoning, have a good economic development basis and regional advantage. Therefore, according to the theory of the grades development, the abandoned mine redevelopment industry should give priority to the mining areas of the eastern and central regions because these are the regions with high resource potential and strong driving forces.

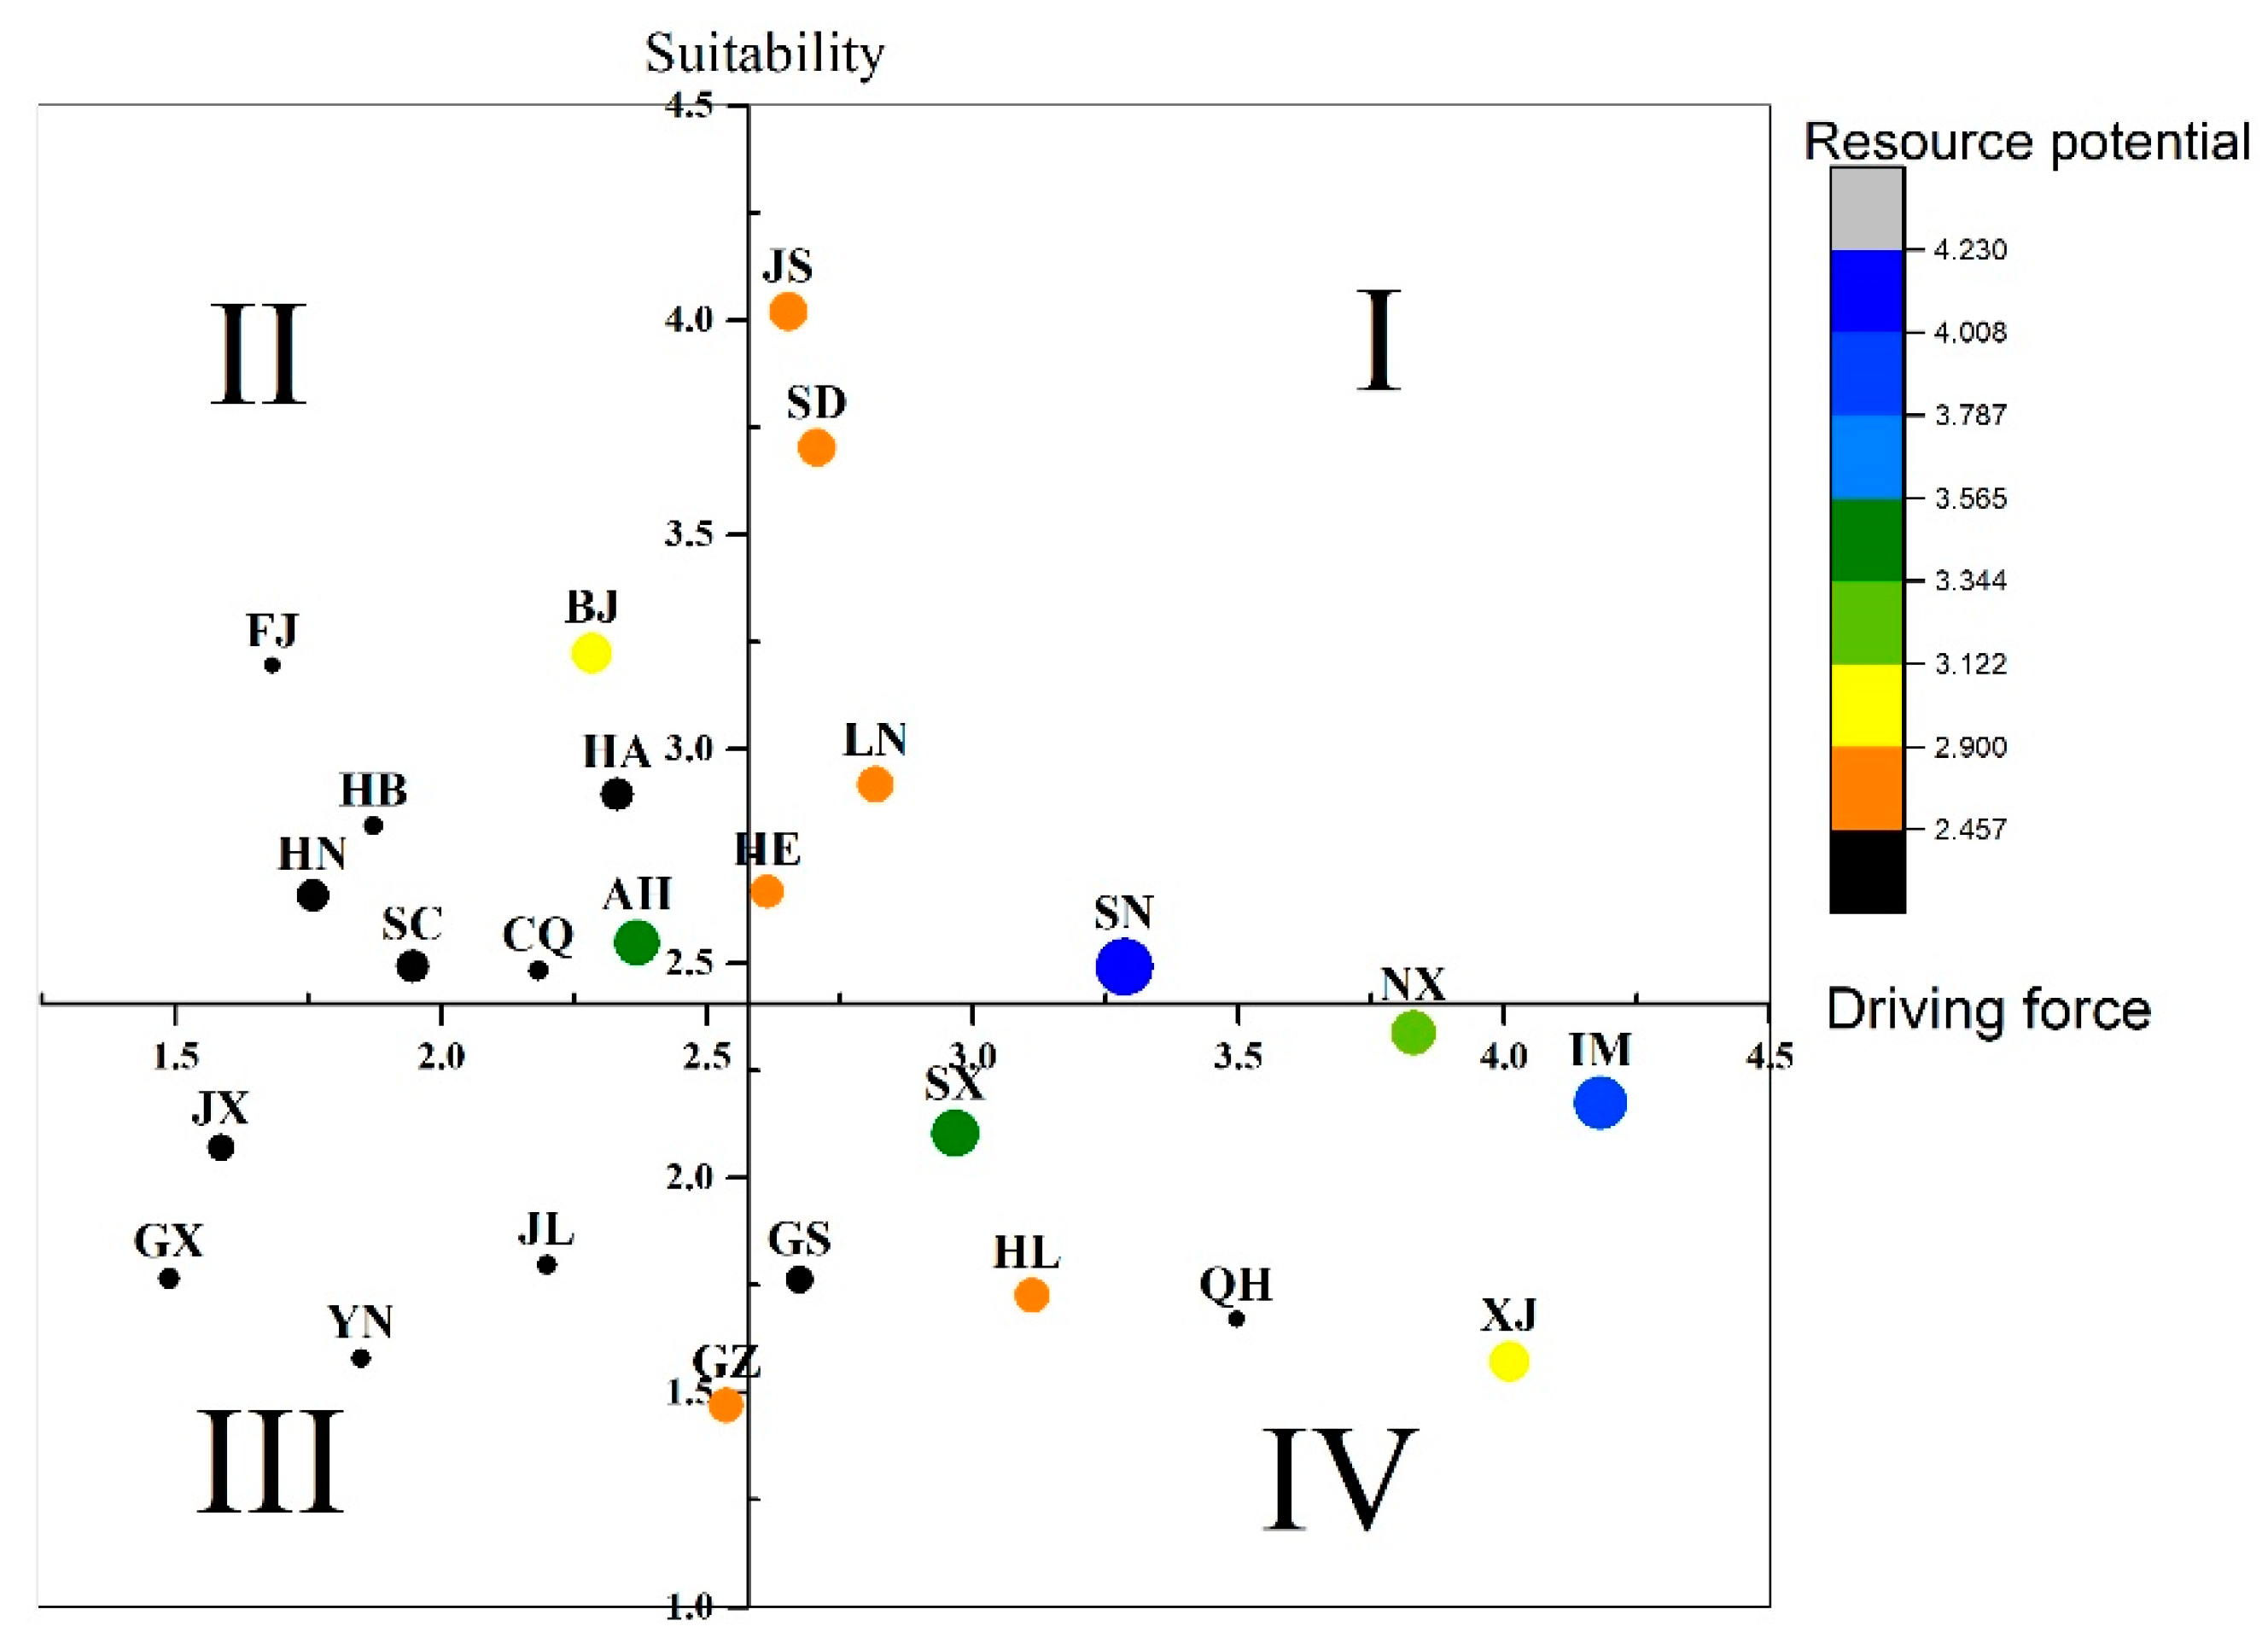
4.2. Category Classification of Redevelopment Potential and Redevelopment Sequence

Considering that the AMRP is influenced by three dimensions, this paper adopted the four-quadrant method combined with a bubbles map (Figure 4) to comprehensively position the AMRP level into specific categories, and finally, it sorted the four quadrants according to different goal orientations. Based on the comprehensive consideration of the basic conditions of the abandoned mines and the suitability of the development conditions, this article proposed the classification principles of “resource advance and coordinate development” and divided the AMRP into five classes: higher, high, moderate, low, and lower. Figure 5 is the scatter diagram with the values of the three dimensions of the 25 provinces. It is divided into four quadrants according to the feature value of the grade medians of the driving force and the suitability of the development conditions. The resource potential is displayed as a bubble map, with the various colors representing different grades of resource potential, where the colored bubbles indicate that the resource potential feature value of the grades is above the median, while the black bubbles represent the values below the median. In Figure 5, the first quadrant represents “High Driving Force-High Suitability (HDFHS)”, and the colored bubbles in this quadrant denote the higher redevelopment potential areas. The second quadrant is expressed as “Low Driving Force-High Suitability (LDFHS)”, and the colored bubbles in this quadrant indicate the high redevelopment potential areas, while the black bubbles are the low potential areas. The third quadrant signifies “Low Driving Force-Low Suitability ((LDFLS)”, and the black bubbles in this quadrant indicate the lower redevelopment potential areas. The fourth quadrant is depicted as “High Driving Force-Low Suitability (HDFLS)”, and the colored bubbles in this quadrant indicate the high redevelopment potential areas, while the black bubbles are the low potential areas. According to the planning principles of “progressive order, progressive development, long-term planning, and timely development”, the redevelopment sequence is classified into four broad categories: “Urgent action, Recent planning, Medium-term planning, and Long-term planning”. The “Recent planning” and “Medium-term planning” phases are further divided into three stages, respectively, according to the combined relationship between the three dimensions. The specific grades of redevelopment potential, redevelopment sequence, and the combination relationship between the conditions are shown in Table 7. According to the different redevelopment stages, the action and emphasis of policy implementation for each redevelopment stage are put forward, respectively.
Following the combination of Figure 5 and Table 7, the spatial pattern of the redevelopment potential and the redevelopment sequence of China’s provinces are shown in Figure 6. It can be observed that Jiangsu, Shandong, Liaoning, Hebei, Shanxi, Anhui, and Beijing are “higher potential” provinces. Among these provinces, the first five provinces with the higher resource potential, driving force, and suitability of development conditions values are suggested to be the first abandoned mine redevelopment project demonstration zones. Beijing and Anhui are at the “Recent planning-I (RP-I)” stage. Shaanxi, Ningxia, Inner Mongolia, Heilongjiang, and Xinjiang are regarded as the “Recent planning-I (RP-II)” stage. The regions with better performance in only one dimension, such as Guizhou, Fujian, Hubei, Hunan, Sichuan, Chongqing, Henan, Gansu, Qinghai, etc., can be evaluated as “potential development zones” for the abandoned mine resources redevelopment. Yunnan, Jiangxi, Guangxi, and Jilin performed the worst in all three dimensions; therefore, the abandoned mines in these areas were suggested only for ecological rehabilitation but not redevelopment.

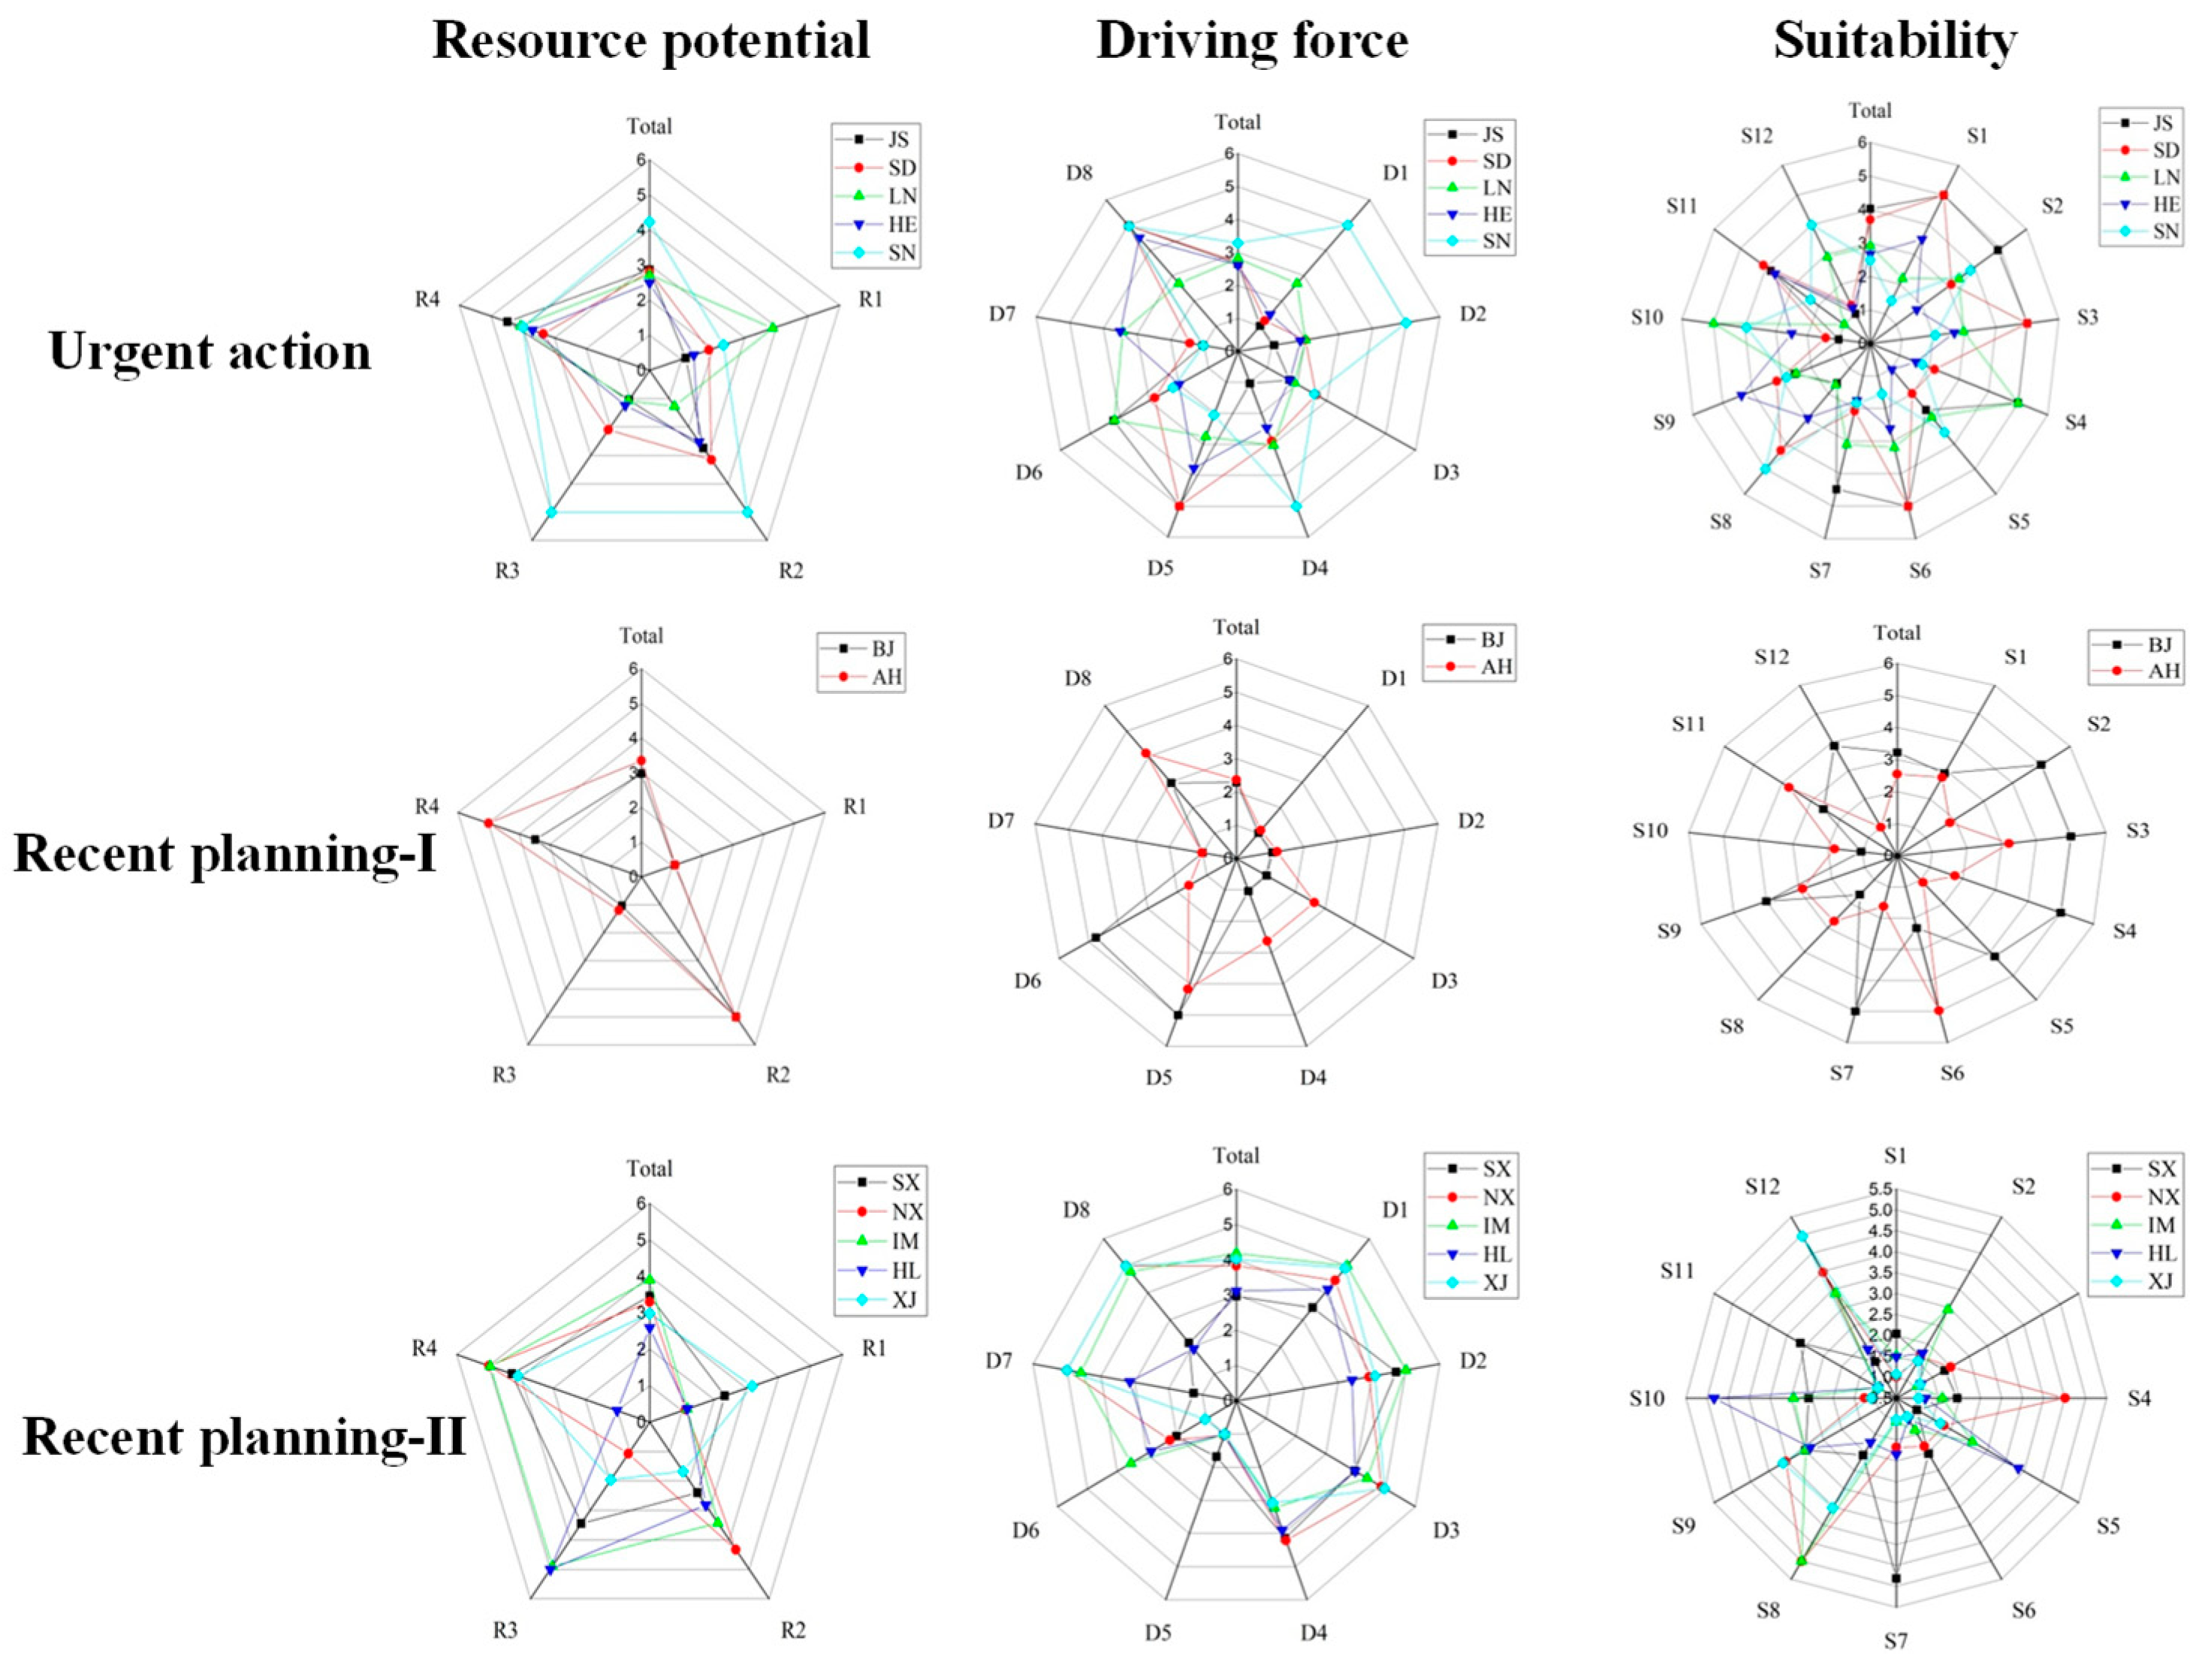
4.3. Key Indicators for AMRP

Owing to the various types of abandoned mines, China’s AMRP level varies according to the region, with differences in the regional advantage and the basis of the regional economy. The radar chart method was adopted to reflect the indicators’ difference of objects (Figure 6) in order to reveal the key indicators restricting the AMRP.
For the provinces in the “Urgent action” phase, although the three dimensions performed relatively better than in the other areas, they still need to improve the relatively weak indicators to enhance the redevelopment potential. Take Shanxi as an example; as the key coal producer in China, Shanxi has lots of abandoned mines with large sizes; so, the resource potential grade is high. Many typical phenomena of a resource-based economy, such as the simplification of a leading industry, unreasonable economic structure, and high dependence on resources, lead to the strong driving force in Shanxi. However, the suitability of the development conditions is lower than that of Jiangsu and Shandong, which is prominently manifested in the economic scale (S1), the traffic conditions (S3), the opening level (S4), the intensity of the input into science and technology (S6), and the investment in environmental protection (S9). Therefore, Shanxi should continue to strengthen investment in infrastructure construction, science and technology, and environmental protection and should actively introduce foreign capital to enhance the suitability of the external conditions [22].
For the provinces in the “Recent planning-I” phase, Anhui’s resource potential is higher than that of Beijing, but its development conditions are far behind those of Beijing. It should be pointed out that Beijing’s investment intensity in scientific research (S6), industrial pollution control (S8), and science, education, culture, and health (S11) is insufficient. As for the driving force, due to the high population density (D5) and strong environmental and resource constraints (D6 and D8), Beijing urgently needs to develop mined land and underground space to release more urban development space, while Anhui’s driving force mainly comes from the social and environmental impact caused by mine closure (D3 and D4).
For the provinces in the “Recent planning-II” phase, although the resource potential and driving force of these areas are strong, the suitability of the development conditions limits their redevelopment. It can be seen that the driving forces of Xinjiang and Inner Mongolia are significantly higher than those of Shaanxi, Ningxia, and Heilongjiang, but the resource potential of Xinjiang and Heilongjiang is not as good as that of Inner Mongolia. As for the indicators of the suitability for development conditions, except for the proportion of infrastructure investment, Xinjiang is at a disadvantage in terms of the economy, location, talent science and technology, social security, and other indicators. Ningxia has the best performance in capital opening and industrial pollution investment, while the other indicators need to be improved. However, driven by the development policy in western China, the infrastructure and economic scale of the western region will be greatly improved, and the suitability of the development conditions will change qualitatively [53].

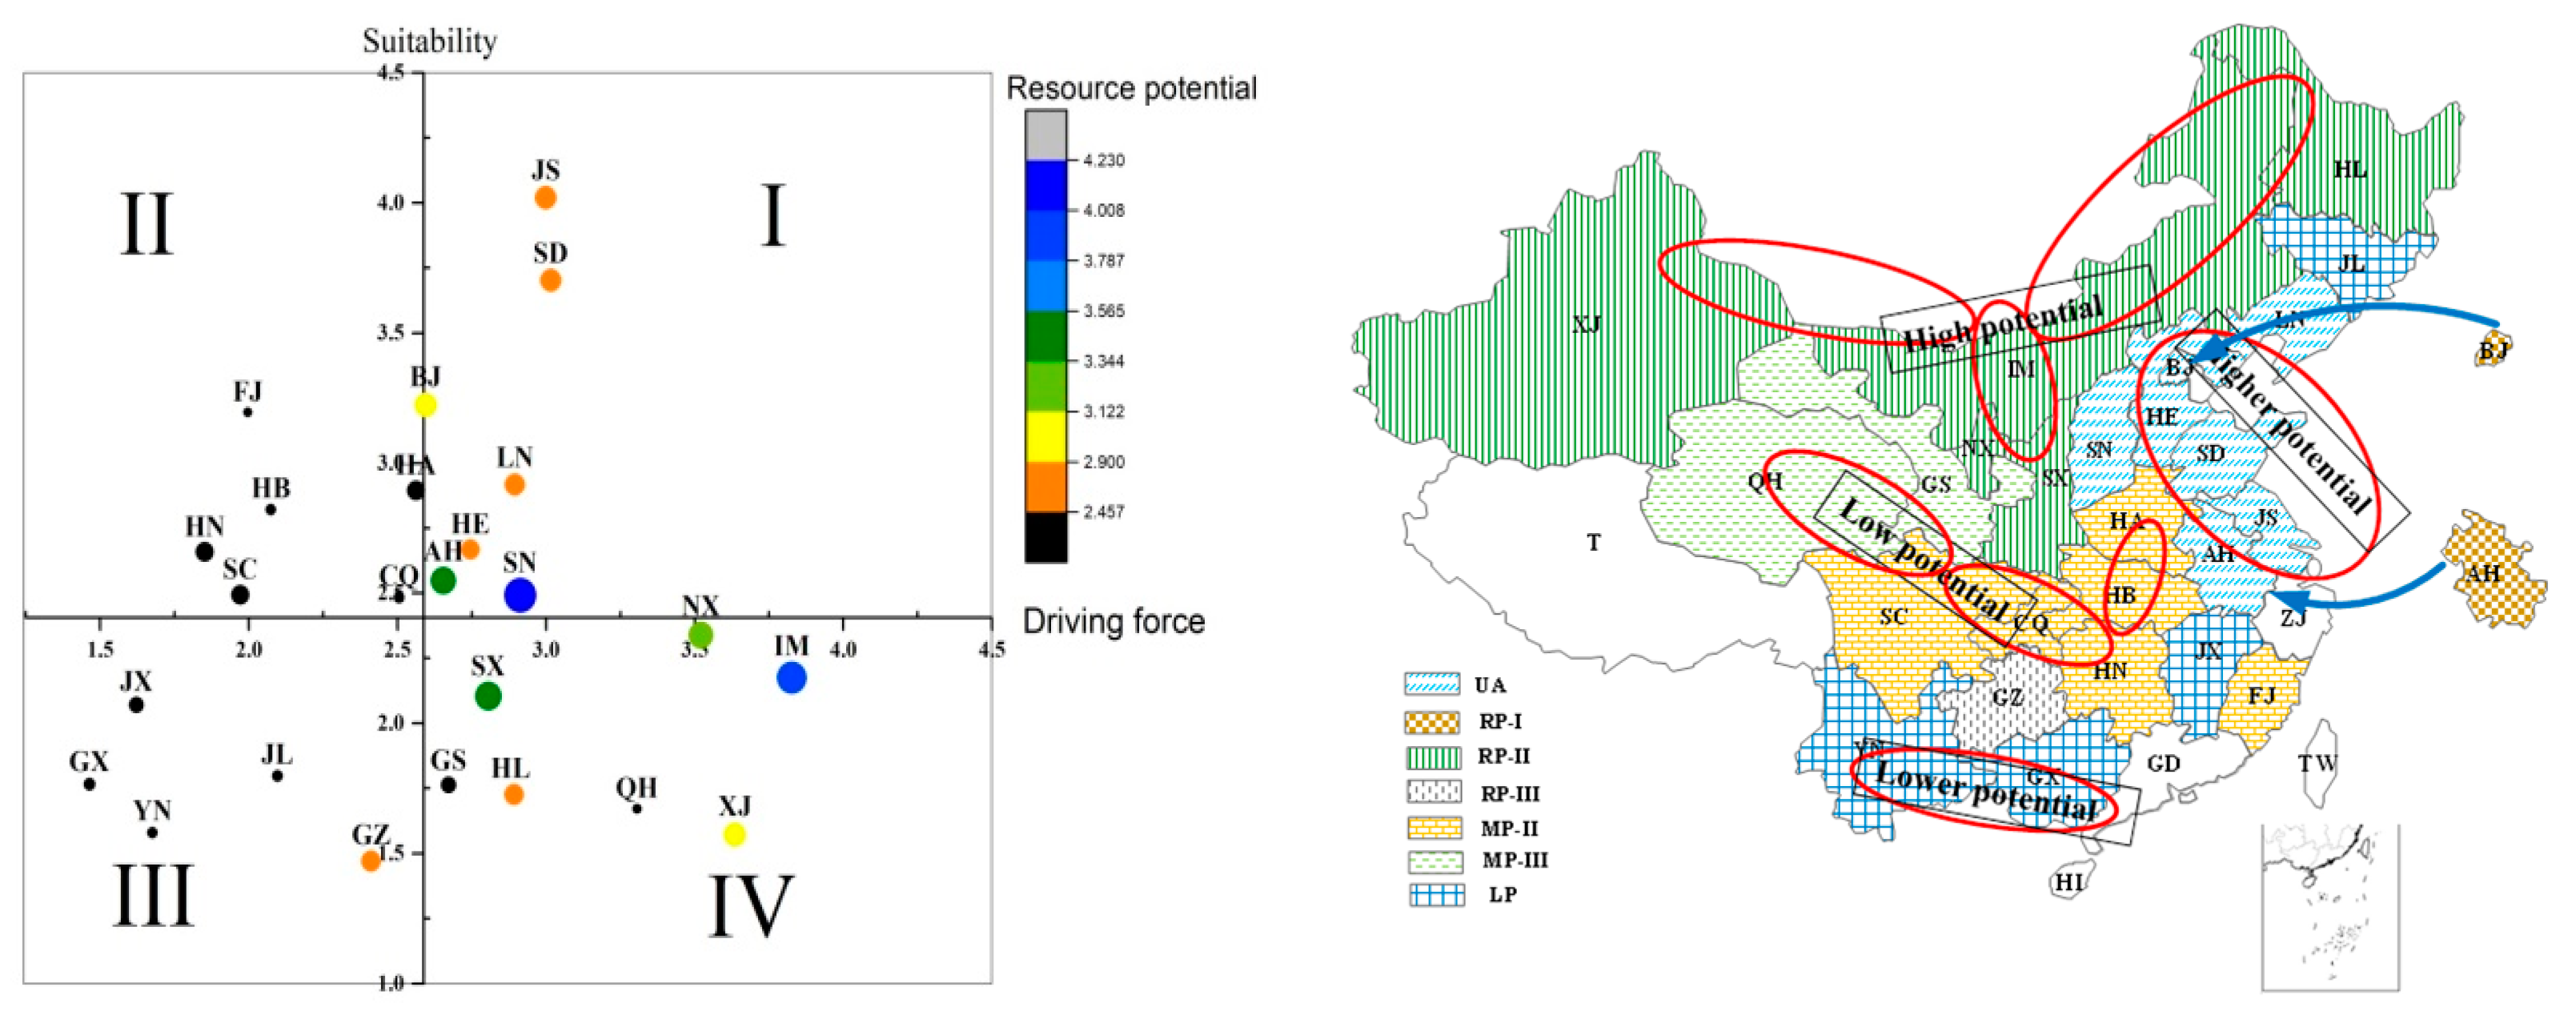
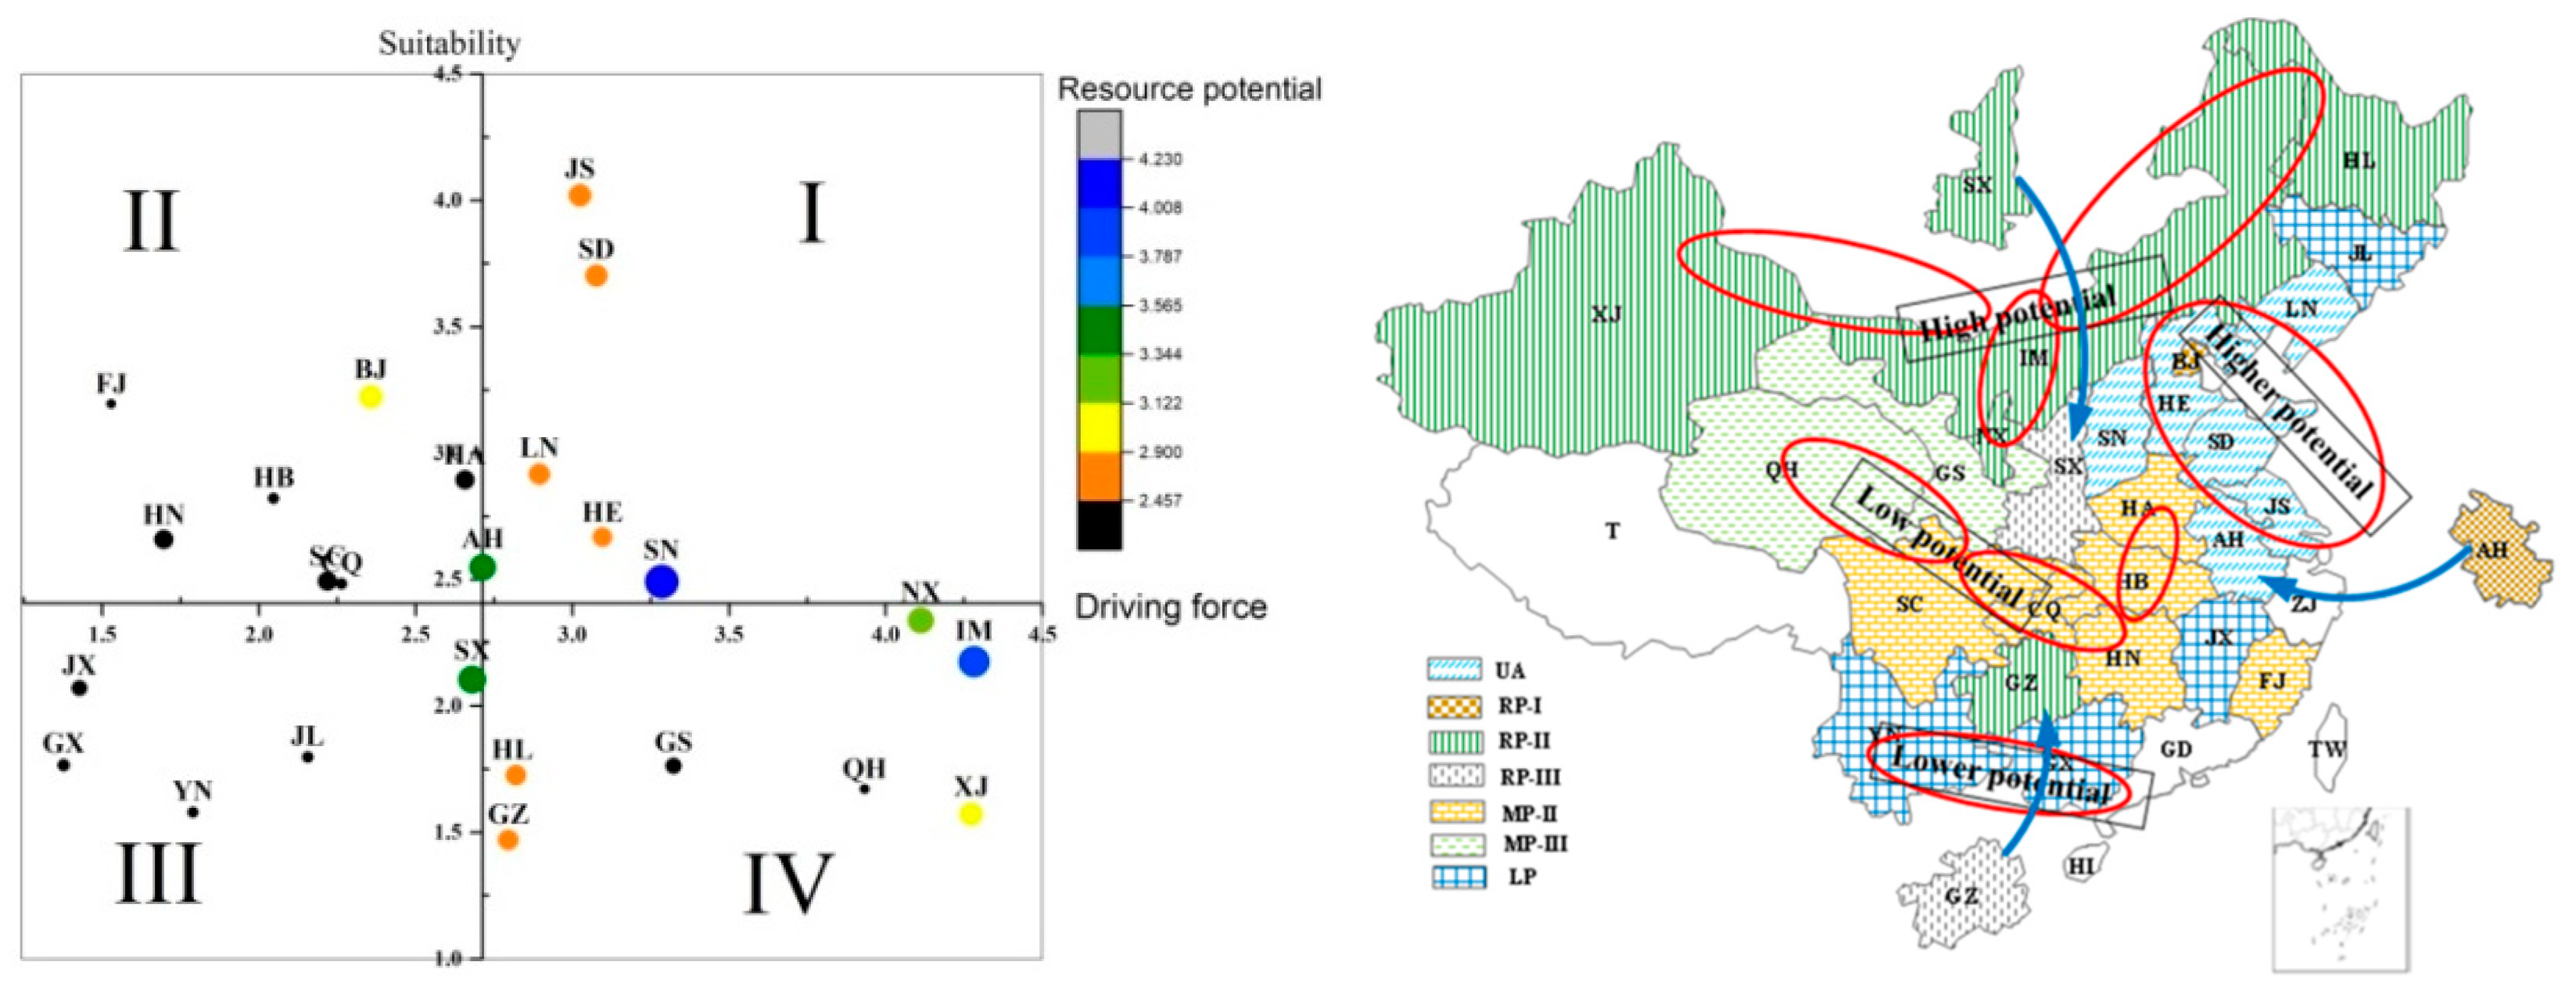
4.4. Different Driving Force Scenarios

It can be seen in Table 4 that the weights of economic demand account for 41% of the total driving force weights, while the weights of social demand and environmental demand account for 33% and 26%, respectively. Therefore, under the distribution of the existing weights, the redevelopment priority is given to meeting economic demand. This scenario was regarded as the economic priority scenario. However, different provinces may have various redevelopment preferences. Therefore, this article gives two other driving force scenarios to illustrate the performances of all the provinces under different demand priorities. The first one is the social priority scenario, which was devoted to increasing re-employment, reducing the impact on miners’ lives, and solving the resource constraints of sustainable development. In this scenario, the weights for social demand were set as 0.5, while the weights of economic demand and environmental demand were 0.25, respectively. The results in this scenario are shown in Figure 7. The second scenario is the environmental priority scenario, which emphasizes environmental protection and energy savings. In this scenario, the weight of environmental demand was set as 0.5, while the weights of economic demand and social demand were 0.25, respectively. The results are presented in Figure 8.
By comparing with the results of the economic priority scenario, it can be found that, although the indicators values were changed under different scenarios, the redevelopment potential and redevelopment sequence classification of most provinces remain unchanged, which proves that most provinces have no obvious preference for the benefits of abandoned mine redevelopment. However, under the social priority scenario (Figure 7), the redevelopment sequence of Beijing and Anhui moved from “Recent planning-I” up to “Urgency action”, which indicates that the redevelopment of abandoned mines in these two provinces should pay more attention to the social requirements compared to the economic needs. This conclusion has been verified in Section 4.3; that is, Anhui province should mainly address the problem of unemployment, while Beijing should focus on solving the resource and environmental constraints faced by urban development. In the environmental priority scenario, the redevelopment sequence of Anhui, Guizhou, and Shaanxi is changed (in Figure 8). Specifically, the redevelopment sequence of Anhui was changed from “Recent planning-I” up to “Urgency action”. The redevelopment sequence of Shaanxi was changed from “Recent planning-II” to “Recent planning-I”; however, Guizhou’s redevelopment sequence was just the opposite.

5. Conclusions and Policy Implications

This paper is the first study to provide a quantitative assessment of the basic information on the abandoned mine resource potential, the driving force, and the suitability of the redevelopment conditions and to put forward a priority list of abandoned mine redevelopment from the provincial perspective; this provides scientific foundation references for rational abandoned mine redevelopment industry distribution and regional eco-environment protection in the future.

5.1. Conclusions

(1) As for the theoretical contribution, this paper first constructs a comprehensive evaluation index system with the outstanding characteristics of the abandoned coal mines and the moderate scope. Secondly, the normal cloud model used in this paper, which discarded the traditional concept of membership but integrated the fuzziness and randomness of the indicators, provides a simple and reliable method for quantitative evaluation. This study evaluates the redevelopment potential of provincial abandoned mines from a more comprehensive perspective, which makes up for the deficiency of the current research in this field.
(2) For the problem of scientific decision making with regard to abandoned mine redevelopment, this article proposes the classification principles as “resource advance and coordinate development” and gives five types of potential levels and eight categories of redevelopment sequences. On this basis, it proposes policy emphasis suggestions for different redevelopment sequences; these suggestions have important value for practical redevelopment planning.
(3) The provinces with high potential for the redevelopment of abandoned mines in China are concentrated in the middle and eastern regions. The abandoned mines in most southwest provinces are not recommended for reuse, and the main focus should be on simple ecological restoration. The multi-driving force scenario simulation analysis shows that there is no obvious preference for abandoned mine development in most provinces of China, but Beijing, Anhui, Shaanxi, and Guizhou provinces should make further argumentation and analysis according to the demand preference.
(4) This paper provides a clear image of each province’s AMRP in China from the macrolevel of regional demand and the economic development stage, which will guide the government to introduce effective strategic plans. However, the evaluation of the abandoned mine resource potential is still rough, and the redevelopment modes selection of abandoned mines needs to be further studied.

5.2. Policy Implications

A correct regional policy of abandoned mine redevelopment is derived from the accurate judgment of the stage and the level of development, or it would be blind or negative. Based on the above evaluation and the conclusions on the abandoned mine redevelopment potential, this paper provides the following policy implications and recommendations:
(1) For the “Urgent action” provinces, it is suggested that they conduct unprecedented experiments with AMR and establish the first comprehensive experimental areas. Considering that these provinces bear the burden of formulating the industrial policies and relevant standards for the other provinces, the government would need to carry out a “carrot and stick” policy in dealing with abandoned mine redevelopment. On the one side, penalties should be adopted to force these provinces to redevelop abandoned mines. On the other side, the government could provide some rewarding policies, such as financial subsidies, tax reductions or exemptions, special funds, etc., to encourage enterprises to try to reuse abandoned mine resources.
(2) For the “Recent planning” provinces, considering that the difficulty and cost of abandoned mine reutilization will increase if it is not planned earlier, the government is advised to provide strong supporting policies and incentive policies, such as increasing the input of the soft- and hardware in these areas, providing more subsidies, and building more relevant research institutes to support these provinces in participating in the redevelopment of the abandoned mines.
(3) For the “Medium-term planning” provinces, the provinces with better development conditions are encouraged to invest capital and technology in the provinces with higher resource potential. The government also can provide specific funds to support the research on the resource identification and value evaluation of the abandoned mines and further demonstrate the feasibility of abandoned mine redevelopment.

Author Contributions

Conceptualization, Y.Y. and C.C.; methodology, C.C.; software, Y.Y.; validation, Y.Y. and C.C.; formal analysis, C.C.; investigation, Y.Y.; resources, C.C.; data curation, Y.Y.; writing—original draft preparation, C.C.; writing—review and editing, Y.Y.; visualization, Y.Y.; supervision, C.C.; project administration, C.C.; funding acquisition, Y.Y. All authors have read and agreed to the published version of the manuscript.

Funding

This research was funded by the National Natural Science Foundation of China (No. 71704178) and the Natural Science Foundation of Shanxi Province, (No. 20210302123336).

Institutional Review Board Statement

Not applicable.

Informed Consent Statement

Not applicable.

Data Availability Statement

Not applicable.

Acknowledgments

We gratefully acknowledge the National Natural Science Foundation of China (No. 71704178) and the Natural Science Foundation of Shanxi Province, (No. 20210302123336). The authors also appreciate the experts for giving helpful suggestions that improved the content.

Conflicts of Interest

The authors declare no conflict of interest.

Appendix A

Table A1. Algorithm of forward normal cloud.
Given the Three Numerical Descriptors of One Factor (Ex, En, He) and the Specific Value xi
Step 1Initially generate normal random E n i with expectation Ex and variance En;
Step 2Generate again normal random Xi with expectation En and variance He. The normal distribution function is expressed as NORM;
Step 3Calculate μ i = exp [ ( x i E x ) 2 / 2 ( E n i ) 2 ] ;
Step 4The cloud drops drop(x, μ(x));
Step 5Repeat steps 1–4 until n cloud drops are generated.
Table A2. The cloud parameters of indicators.
R121.5; 18.2; 0.0276.8; 28.8; 0.02144.6; 28.8; 0.02212.3; 28.8; 0.02381.7; 115.1; 0.02
R28.8; 7.5; 0.0229.3; 9.9; 0.0252.7; 9.9; 0.0276.1; 9.9; 0.02134.6; 39.7; 0.02
R334.9; 29.7; 0.02113.5; 37; 0.02200.6; 37; 0.02287.8; 37; 0.02505.7; 148.1; 0.02
R429.2; 24.8; 0.0281.1; 19.3; 0.02126.7; 19.3; 0.02172.2; 19.3; 0.02286.1; 77.4; 0.02
D16; 5.1; 0.0216.7; 4; 0.0226.2; 4; 0.0235.6; 4; 0.0259.3; 16.1; 0.02
D20.8; 0.7; 0.022.9; 1.1; 0.025.4; 1.1; 0.027.9; 1.1; 0.0214.1; 4.3; 0.02
D30.46; 0.39; 0.020.97; 0.05; 0.021.08; 0.05; 0.021.19; 0.05; 0.021.47; 0.19; 0.02
D49.5; 8.1; 0.0229.2; 8.6; 0.0249.6; 8.6; 0.0269.9; 8.6; 0.02120.9; 34.6; 0.02
D586.6; 73.5; 0.02229.1; 47.5; 0.02341.1; 47.5; 0.02453.1; 47.5; 0.02733.0; 190.2; 0.02
D625.8; 21.9; 0.0254.0; 2.0; 0.0258.6; 2.0; 0.0263.2; 2.0; 0.0274.8; 7.9; 0.02
D70.3; 0.2; 0.020.6; 0.1; 0.020.8; 01; 0.021.1; 0.1; 0.021.6; 0.4; 0.02
D866.1; 14.4; 0.0244.9; 3.6; 0.0236.4; 3.6; 0.0228.0; 3.6; 0.0211.9; 10.1; 0.02
S18186.6; 6952.5; 0.0221,200.8; 4099.9; 0.0230,856.1; 4099.9; 0.0240,511.4; 4099.9; 0.0264,649.7; 16399.7; 0.02
S210,022.0; 8511.3; 0.0222,087.4; 1735.3; 0.0226,174.1; 1735.3; 0.0230,260.8; 1735.3; 0.0240,477.5; 6941.3; 0.02
S30.4; 0.3; 0.021.3; 0.5; 0.022.4; 0.5; 0.023.5; 0.5; 0.026.3; 1.9; 0.02
S41; 0.9; 0.022.7; 0.6; 0.024.1; 0.6; 0.025.6; 0.6; 0.029.1; 2.4; 0.02
S522.5; 19.1; 0.0246.8; 1.6; 0.0250.6; 1.6; 0.0254.5; 1.6; 0.0264.0; 6.5; 0.02
S60.4; 0.3; 0.020.9; 0.1; 0.021.1; 0.1; 0.021.4; 0.1; 0.022.0; 0.4; 0.02
S71106.6; 939.8; 0.022399.4; 158.1; 0.022771.7; 158.1; 0.023144.0; 158.1; 0.024074.7; 632.3; 0.02
S80.3; 0.2; 0.020.7; 0.2; 0.021.1; 0.2; 0.021.5; 0.2; 0.022.5; 0.7; 0.02
S91.3; 1.1; 0.022.9; 0.2; 0.023.4; 0.2; 0.024.0; 0.2; 0.025.4; 1.0; 0.02
S106.3; 5.3; 0.0213.5; 0.8; 0.0215.3; 0.8; 0.0217.2; 0.8; 0.0221.8; 3.2; 0.02
S1113.2; 11.2; 0.0227.3; 0.8; 0.0229.1; 0.8; 0.0230.9; 0.8; 0.0235.5; 3.1; 0.02
S126.6; 5.6; 0.0214.5; 1.1; 0.0217.2; 1.1; 0.0219.9; 1.1; 0.0226.5; 4.5; 0.02
Table A3. Results by cloud model assessment approach.
ProvinceDimension
BJResource potential0.23000.01100.29150.09210.1788
Driving force0.42560.01130.16110.01530.1504
Suitability0.05560.13720.26520.02810.1847
HEResource potential0.33810.25000.29570.16150.0901
Driving force0.25460.37540.18330.16740.1417
Suitability0.19320.35650.40160.12290.1127
SNResource potential0.00000.09760.12420.28510.5582
Driving force0.14910.18950.10460.00460.3563
Suitability0.29920.46220.09990.22960.1101
IMResource potential0.11890.02230.18440.08010.4951
Driving force0.11320.00310.08480.14770.6035
Suitability0.48560.26730.25450.05170.1108
LNResource potential0.46200.07530.11340.39860.1336
Driving force0.07230.35800.53930.05360.1205
Suitability0.12960.35030.45000.10390.2016
JLResource potential0.61690.41810.03100.00000.0157
Driving force0.33320.33980.41900.00580.0433
Suitability0.49250.51580.05540.05270.0331
HLResource potential0.45410.09900.14670.00100.2968
Driving force0.21030.15120.35620.38330.1658
Suitability0.62310.41540.03600.06020.0476
JSResource potential0.30320.11200.13030.19260.1997
Driving force0.46820.05470.00000.00780.3406
Suitability0.11380.06520.06980.04920.5590
AHResource potential0.36510.06270.00010.00000.5702
Driving force0.53000.14410.07090.28350.1034
Suitability0.20450.45090.42510.06120.1154
FJResource potential0.83830.16430.00760.00000.0075
Driving force0.74240.04220.10620.07180.0566
Suitability0.13720.24050.39310.38860.1961
JXResource potential0.46780.24080.09750.10520.0488
Driving force0.57150.30790.09960.00030.0197
Suitability0.25750.81310.13640.03820.0449
SDResource potential0.03210.40510.57380.06750.0904
Driving force0.33560.20600.18850.01260.2821
Suitability0.08720.20860.20790.10720.5436
HAResource potential0.08570.65010.33660.03030.0590
Driving force0.39760.24680.02210.03780.2001
Suitability0.23450.26300.28070.22920.1887
HBResource potential0.76090.05840.11900.00710.0179
Driving force0.58550.12010.34000.00820.0304
Suitability0.16110.38020.36550.23020.1236
HNResource potential0.48240.09420.07890.27840.0963
Driving force0.46920.46240.13050.00310.0233
Suitability0.17050.45730.39900.15320.1030
GXResource potential0.47550.31110.07670.00010.0173
Driving force0.50850.39000.00410.00130.0114
Suitability0.43350.63020.03740.02690.0243
CQResource potential0.84650.08320.00000.00010.1084
Driving force0.56140.11720.18110.17660.0771
Suitability0.21380.48490.40040.07590.0913
SCResource potential0.54630.04670.07950.23240.1594
Driving force0.39030.35570.20340.02220.0300
Suitability0.35200.40130.17630.26140.0962
GZResource potential0.50630.10450.00020.01500.3408
Driving force0.16240.39790.36640.09830.0605
Suitability0.75270.20330.04570.03910.0219
YNResource potential0.61900.28210.00410.00000.0251
Driving force0.33360.42130.09430.01620.0242
Suitability0.67650.30780.05710.03170.0308
SXResource potential0.00020.26570.33460.40000.2104
Driving force0.16100.25950.33550.20720.1691
Suitability0.26680.77680.09870.03850.0741
GSResource potential0.44630.28170.35260.00980.0445
Driving force0.24920.42970.03350.13750.2209
Suitability0.70950.17220.09300.07090.0703
QHResource potential0.72190.20330.00040.00000.0079
Driving force0.11930.08000.35090.03120.3835
Suitability0.58040.23690.03420.03080.0587
NXResource potential0.38420.02790.00270.18210.4649
Driving force0.15720.05000.09420.30490.4808
Suitability0.38470.39740.03960.11330.1633
XJResource potential0.11890.39670.18280.34520.1303
Driving force0.13250.00940.07970.12140.5045
Suitability0.68220.14500.06770.01530.0568
Table A4. Comparison scale of analytic hierarchy process.
Factor of PreferenceImportance Definition
1Equal importance
3Moderate importance of one over another
5The strong or essential importance of one over another
7Very strong or demonstrated importance of one over another
9The extreme importance of one over another
2, 4, 6, 8Intermediate values
Table A5. Listing and abbreviations of the provincial-level administrative units.
ProvincesAbbreviationProvincesAbbreviation
BeijingBJHunanHN
TianjinTJGuangdongGD
HeibeiHEGuangxiGX
ShaanxiSXHainanHI
Inner MongoliaIMChongqingCQ
LiaoningLNSichuanSC
JilinJLGuizhouGZ
HeilongjiangHLYunnanYN
HenanHAShanxiSN
JiangsuJSGansuGS
ZhejiangZJQinghaiQH
AnhuiAHNingxiaNX
FujianFJXinjiangXJ
JiangxiJX
ShandongSD
HubeiHB

References

  1. Amirshenava, S.; Osanloo, M. Mine closure risk management: An integration of 3D risk model and MCDM techniques. J. Clean. Prod. 2018, 184, 389–401. [Google Scholar] [CrossRef]
  2. Yuan, L.; Jing, Y.; Wang, K.; Zhao, Y.; Hao, X.; Xu, C. Precision exploitation and utilization of closed/abandoned mine resources in China. J. China Coal Soc. 2018, 43, 14–20. (In Chinese) [Google Scholar] [CrossRef]
  3. Gorman, M.R.; Dzombak, D.A. A review of sustainable mining and resource management: Transitioning from the life cycle of the mine to the life cycle of the mineral. Resour. Conserv. Recycl. 2018, 137, 281–291. [Google Scholar] [CrossRef]
  4. Zhang, C.; Li, B.; Song, Z.; Liu, J.; Zhou, J. Breakage mechanism and pore evolution characteristics of gangue materials under compression. Acta Geotech. 2022, 17, 4823–4835. [Google Scholar] [CrossRef]
  5. Zhang, C.; Zhao, Y.; Bai, Q. 3D DEM method for compaction and breakage characteristics simulation of broken rock mass in goaf. Acta Geotech. 2022, 17, 2765–2781. [Google Scholar] [CrossRef]
  6. Shi, X.; Rioux, B.; Galkin, P. Unintended consequences of China’s coal capacity cut policy. Energy Policy 2018, 113, 478–486. [Google Scholar] [CrossRef]
  7. Luo, P.; Chen, N. Abandoned coal mine tunnels: Future heating/power supply centers. Min. Sci. Technol. 2011, 21, 637–640. [Google Scholar] [CrossRef]
  8. Pouran, H.M. From collapsed coal mines to floating solar farms, why China’s new power stations matter. Energy Policy 2018, 123, 414–420. [Google Scholar] [CrossRef]
  9. Ahmad, N.; Zhu, Y.; Shafait, Z.; Sahibzada, U.F.; Waheed, A. Critical barriers to brown field redevelopment in developing countries: The case of Pakistan. J. Clean. Prod. 2019, 212, 1193–1209. [Google Scholar] [CrossRef]
  10. Doyle, M.R. From hydro/geology to the streetscape: Evaluating urban underground resource potential. Tunn. Undergr. Sp. Technol. 2016, 55, 83–95. [Google Scholar] [CrossRef]
  11. Lin, J.; Fridley, D.; Lu, H.; Price, L.; Zhou, N. Has coal use peaked in China: Near-term trends in China’s coal consumption. Energy Policy 2018, 123, 208–214. [Google Scholar] [CrossRef]
  12. Bakhtavar, E.; Aghayarloo, R.; Youse, S.; Hewage, K.; Sadiq, R. Renewable energy based mine reclamation strategy: A hybrid fuzzy-based network analysis. J. Clean. Prod. 2019, 230, 253–263. [Google Scholar] [CrossRef]
  13. Sutherland, F. Community-driven mining heritage in the Cuyuna Iron Mining District: Past, present, and future projects. Extr. Ind. Soc. 2015, 2, 519–530. [Google Scholar] [CrossRef]
  14. Lèbre, É.; Corder, G.D.; Golev, A. Sustainable practices in the management of mining waste: A focus on the mineral resource. Miner. Eng. 2017, 107, 34–42. [Google Scholar] [CrossRef]
  15. Kubit, O.E.; Pluhar, C.J.; De Graff, J.V. A model for prioritizing sites and reclamation methods at abandoned mines. Environ. Earth Sci. 2015, 73, 7915–7931. [Google Scholar] [CrossRef]
  16. Li, X.; Yang, H.; Chen, Z.; Wang, Z.; Guo, L.; Song, Y.; Liu, L. Evaluation system for prioritization tool to redevelop abandoned coal mine industry square based on DSR model. Trans. Chin. Soc. Agric. Eng. 2018, 34, 224–231. (In Chinese) [Google Scholar] [CrossRef]
  17. Lu, W.; Xu, C.; Wu, J.; Cheng, S. Ecological effect assessment based on the DPSIR model of a polluted urban river during restoration: A case study of the Nanfei River, China. Ecol. Indic. 2019, 96, 146–152. [Google Scholar] [CrossRef]
  18. Han, S.; Chen, H.; Long, R.; Cui, X. Peak coal in China: A literature review. Resources. Conserv. Recycl. 2018, 129, 293–306. [Google Scholar] [CrossRef]
  19. Laurence, D. Establishing a sustainable mining operation: An overview. J. Clean. Prod. 2011, 19, 278–284. [Google Scholar] [CrossRef]
  20. Amirshenava, S.; Osanloo, M. A hybrid semi-quantitative approach for impact assessment of mining activities on sustainable development indexes. J. Clean. Prod. 2019, 218, 823–834. [Google Scholar] [CrossRef]
  21. Cui, C.; Wang, B.; Zhao, Y.; Wang, Q.; Sun, Z. China’s regional sustainability assessment on mineral resources: Results from an improved analytic hierarchy process-based normal cloud model. J. Clean. Prod. 2019, 210, 105–120. [Google Scholar] [CrossRef]
  22. Cao, X. Policy and regulatory responses to coal mine closure and coal resources consolidation for sustainability in Shanxi, China. J. Clean. Prod. 2017, 145, 199–208. [Google Scholar] [CrossRef]
  23. Batterham, R.J. The mine of the future—Even more sustainable. Miner. Eng. 2017, 107, 2–7. [Google Scholar] [CrossRef]
  24. Groth, C.; Schou, P. Growth and non-renewable resources: The different roles of capital and resource taxes. J. Environ. Econ. Manag. 2007, 53, 80–98. [Google Scholar] [CrossRef]
  25. Unger, C.J.; Lechner, A.M.; Kenway, J.; Glenn, V.; Walton, A. A jurisdictional maturity model for risk management, accountability and continual improvement of abandoned mine remediation programs. Resour. Policy 2015, 43, 1–10. [Google Scholar] [CrossRef]
  26. Nehring, M.; Cheng, X. An investigation into the impact of mine closure and its associated cost on life of mine planning and resource recovery. J. Clean. Prod. 2016, 127, 228–239. [Google Scholar] [CrossRef] [Green Version]
  27. Wang, B.; Mi, Z.; Nistor, I.; Yuan, X.-C. How does hydrogen-based renewable energy change with economic development? Empirical evidence from 32 countries. Int. J. Hydrogen Energy 2018, 43, 11629–11638. [Google Scholar] [CrossRef] [Green Version]
  28. Volk, R.; Müller, R.; Reinhardt, J.; Schultmann, F. An Integrated Material Flows, Stakeholders and Policies Approach to Identify and Exploit Regional Resource Potentials. Ecol. Econ. 2019, 161, 292–320. [Google Scholar] [CrossRef]
  29. Ruan, W.; Li, Y.; Zhang, S.; Liu, C. Evaluation and drive mechanism of tourism ecological security based on the DPSIR-DEA model. Tour. Manag. 2019, 75, 609–625. [Google Scholar] [CrossRef]
  30. Zhang, M.; Liu, Y.; Wu, J.; Wang, T. Index system of urban resource and environment carrying capacity based on ecological civilization. Environ. Impact Assess. Rev. 2018, 68, 90–97. [Google Scholar] [CrossRef]
  31. Mishra, S.K.; Hitzhusen, F.J.; Sohngen, B.L.; Guldmann, J. Costs of abandoned coal mine reclamation and associated recreation bene fits in Ohio. J. Environ. Manag. 2012, 100, 52–58. [Google Scholar] [CrossRef] [PubMed]
  32. Mhlongo, S.E.; Amponsah-dacosta, F. A review of problems and solutions of abandoned mines in South Africa. Int. J. Min. Reclam. Environ. 2016, 30, 279–294. [Google Scholar] [CrossRef]
  33. Yi, S. Resource recovery potentials by landfill mining and reclamation in South Korea. J. Environ. Manag. 2019, 242, 178–185. [Google Scholar] [CrossRef] [PubMed]
  34. Chang, J.; Chen, Y.; Li, Z.; Wang, H.; Feng, S. The characteristics and dynamic mechanism of regional development and evolution of Pan’an Lake. Coal Geol. Explor. 2022, 50, 25–34. [Google Scholar]
  35. Caulk, R.A.; Graduate, M.S.; Tomac, I. Reuse of abandoned oil and gas wells for geothermal energy production. Renew. Energy 2017, 112, 388–397. [Google Scholar] [CrossRef] [Green Version]
  36. Naidu, G.; Ryu, S.; Thiruvenkatachari, R.; Choi, Y.; Jeong, S.; Vigneswaran, S. A critical review on remediation, reuse, and resource recovery from acid mine drainage. Environ. Pollut. 2019, 247, 1110–1124. [Google Scholar] [CrossRef]
  37. Zhang, X.; Winchester, N.; Zhang, X. The future of coal in China. Energy Policy 2017, 110, 644–652. [Google Scholar] [CrossRef]
  38. Wang, D.; Wan, K.; Song, X. Quota allocation of coal overcapacity reduction among provinces in China. Energy Policy 2018, 116, 170–181. [Google Scholar] [CrossRef]
  39. Ramírez-alesón, M.; Fleta-asín, J. Is the Importance of Location Factors Different Depending on the Degree of Development of the Country? J. Int. Manag. 2016, 22, 29–43. [Google Scholar] [CrossRef]
  40. Bangian, A.H.; Ataei, M.; Sayadi, A.; Gholinejad, A. Optimizing post-mining land use for pit area in open-pit mining using fuzzy decision making method. Int. J. Environ. Sci. Technol. 2012, 9, 613–628. [Google Scholar] [CrossRef] [Green Version]
  41. Song, X.; Zhou, Y.; Jia, W. How do Economic Openness and R&D Investment Affect Green Economic Growth?—Evidence from China. Resour. Conserv. Recycl. 2019, 146, 405–415. [Google Scholar] [CrossRef]
  42. Lee, C.; Chou, P. Financial openness and market liquidity in emerging markets. Financ. Res. Lett. 2018, 25, 124–130. [Google Scholar] [CrossRef]
  43. Zhu, B.; Zhang, M.; Zhou, Y.; Wang, P.; Sheng, J.; He, K.; Wei, Y.; Xie, R. Exploring the effect of industrial structure adjustment on interprovincial green development efficiency in China: A novel integrated approach. Energy Policy 2019, 134, 110946. [Google Scholar] [CrossRef]
  44. Miremadi, I.; Saboohi, Y.; Arasti, M. The influence of public R&D and knowledge spillovers on the development of renewable energy sources: The case of the Nordic countries. Technol. Forecast. Soc. Chang. 2019, 146, 450–463. [Google Scholar] [CrossRef]
  45. Zhou, Y.; Guo, Y.; Liu, Y. High-level talent flow and its influence on regional unbalanced development in China. Appl. Geogr. 2018, 91, 89–98. [Google Scholar] [CrossRef]
  46. Knierzinger, J.; Sopelle, I.T. Mine closure from below: Transformative movements in two shrinking West African mining towns. Extr. Ind. Soc. 2019, 6, 145–153. [Google Scholar] [CrossRef]
  47. Wang, D.; Shi, Y.; Wan, K. Integrated evaluation of the carrying capacities of mineral resource-based cities considering synergy between subsystems. Ecol. Indic. 2020, 108, 105701. [Google Scholar] [CrossRef]
  48. Wang, D.; Liu, D.; Ding, H.; Singh, V.P.; Wang, Y.; Zeng, X.; Wu, J.; Wang, L. A cloud model-based approach for water quality assessment. Environ. Res. 2016, 148, 24–35. [Google Scholar] [CrossRef]
  49. Guo, Y.; Meng, X.; Meng, T.; Wang, D.; Liu, S. A novel method of risk assessment based on cloud inference for natural gas pipelines. J. Nat. Gas Sci. Eng. 2016, 30, 421–429. [Google Scholar] [CrossRef]
  50. Lü, X.; Chen, C.; Wang, P.; Meng, L. Status evaluation of mobile welding robot driven by fuel cell hybrid power system based on cloud model. Energy Convers. Manag. 2019, 198, 111904. [Google Scholar] [CrossRef]
  51. Senapati, T.; Yager, R.R. Fermatean fuzzy weighted averaging/geometric operators and its application in multi-criteria decision-making methods. Eng. Appl. Artif. Intell. 2019, 85, 112–121. [Google Scholar] [CrossRef]
  52. Wang, R.; Cheng, J.; Zhu, Y.; Lu, P. Evaluation on the coupling coordination of resources and environment carrying capacity in Chinese mining economic zones. Resour. Policy 2017, 53, 20–25. [Google Scholar] [CrossRef]
  53. Yang, F.; Yang, M.; Xue, B.; Luo, Q. The effects of China’s western development strategy implementation on local ecological economic performance. J. Clean. Prod. 2018, 202, 925–933. [Google Scholar] [CrossRef]
Figure 1. DSR model of abandoned mine redevelopment potential.
Sustainability 14 15923 g001
Figure 2. Normal cloud model corresponding to an indicator.
Sustainability 14 15923 g002
Figure 3. Spatial distribution in three dimensions of AMRP.
Sustainability 14 15923 g003
Figure 4. Scatter plot of the resource potential, driving force, and development conditions suitability.
Sustainability 14 15923 g004
Figure 5. Province classification of redevelopment potential and redevelopment sequence.
Sustainability 14 15923 g005
Figure 6. Inter-domain comparison in the same redevelopment stage.
Sustainability 14 15923 g006
Figure 7. Results under social priority scenario.
Sustainability 14 15923 g007
Figure 8. Results under environmental priority scenario.
Sustainability 14 15923 g008
Table 1. Summary of driving force indicators.
PrincipleCriteriaIndicatorsMeasureReference
Driving forceEconomic demandShare of mining investment D1 (‰)Investment of mining/Total investmentCui et al. [21]; Cao [22]
Share of resource tax D2 (%)Resources tax/Tax revenueBatterham [23]; Groth and Schou, [24]
Social demandShare of the average wage of mining staff D3The wage of mining employees/Average annualwageUnger et al. [25]; Nehring and Cheng [26]
Share of mining staff D4 (‰)Mining employees/Total employeesAmirshenava and Osanloo, [1]; Laurence [19]
Population density D5 (people/km2)Total population/Total areaWang et al. [27]; Volk et al. [28]
Urbanization rate D6 (%)Urban population/Total populationRuan et al. [29]; Zhang et al. [30]
Environmental demandPer unit GDP energy consumption D7 (tons/CNY 10,000)Unit GDP energy consumptionGorman and Dzombak [3]; Mishra et al. [31]
Vegetation coverage D8 (%)Coverage space of green areas/Total areaLaurence [19]; Amirshenava and Osanloo [20]
Table 2. Summary of resource potential indicators.
PrincipleCriteriaIndicatorsMeasureReference
Resource potentialResources status indexScale index R1 (a)Number of closed minesChang et al. [34]; Caulk et al. [35]
Quality index R2 (Mt/a)The average capacity of closed minesBakhtavar et al. [12]; Naidu et al. [36]
Potential resources indexPotential scale index R3 (a)Number of existing minesMishra et al. [26]; Zhang et al. [37]
Potential quality index R4 (Mt/a)The average capacity of existing minesNehring and Cheng [26]; Wang et al. [38]
Table 3. Summary of the suitability of redevelopment condition indicators.
PrincipleCriteriaIndicatorsMeasureReference
SuitabilityEconomic supportGDP S1 (CNY 100 million)--Unger et al. [25]; Bangian et al. [40]
Disposable income S2 (per capita)--Gorman and Dzombak [3]; Bangian et al. [40]
Locational conditionsRoad area ratio S3 (%)Road area/Total areaKubit [15]; Cui et al. [21]
Degree of openness S4 (%)Foreign investment/GDPSong et al. [41]; Lee and Chou [42]
Share of tertiary industry S5 (%)The GDP of tertiary industry/GDP Chang et al. [34]; Zhu et al. [43]
Talents and technologyResearch investment level S6 (%)The funds of R&D/GDPSong et al. [41]; Miremadi et al. [44]
Share of talents S7 (people)University and College student enrollmentper 100,000 persons Wang et al. [27]; Zhou et al. [45]
Environmental supportIndustrial pollution control investment level S8 (‰)Investment in industrial pollution control/GDPCui et al. [21]; Chang et al. [34]
Share of environmental protection charge S9 (%)Environmental protection charge/Financial expenditureNaidu et al. [36]; Bangian et al. [40]
Social supportSocial security and employment S10 (%)Social security and employment expenditure/Financial expenditureChang et al. [34]; Knierzinger and Sopelle [46]
Expenditure for S. E. C. H S11 (%)Science–education–culture–health expenditure/Financial expenditureCui et al. [21]; Wang et al. [47];
Share infrastructure investment S12 (%)Investment in electricity, gas, water, traffic, transport, storage, post/Fixed assets Wang et al. [27]; Zhang et al. [30]
Table 4. Descriptions of parameters.
ParametersOriginal Descriptions Algorithm of Cloud Parameter
ExThe best sample point of concept quantization E x i j = ( x i j min + x i j max ) / 2
EnFuzzy degree of a qualitative concept E n i j = ( x i j max x i j min ) / 2.355
HeUncertain degree of entropyDetermined by testing results
Note: the x i j min and x i j max represent the minimum and maximum values of one indicator with a bilateral constraint.
Table 5. Weights of indexes for AMRP.
IndicatorD1D2D3D4D5D6D7D8R1
Weight0.29520.11480.04950.06270.12210.09570.09620.16380.1190
IndicatorR2R3R4S1S2S3S4S5S6
Weight0.22100.29040.36960.26650.14350.16960.11200.03840.0434
IndicatorS7S8S9S10S11S12
Weight0.02660.05120.02880.01560.01560.0228
Note: D, R, and S correspond to 3 criteria in Table 1, Table 2 and Table 3, and each criterion has its representative indexes. For example, D1, D2; R1, R2.
Table 6. The results of FVG by cloud model-based assessment approach.
ProvincesFVGDFVGRFVGS
BJ2.28472.97343.2224
HE2.61342.48532.6675
SN3.28564.22412.4914
IM4.18163.89942.1749
LN2.81812.71822.9173
JL2.19921.50171.7978
HL3.11292.58641.7260
JS2.65352.86504.0202
AH2.36943.34822.5481
FU1.68311.20593.1962
JX1.58741.98612.0699
SD2.70712.81103.7028
HA2.33232.42062.8950
HB1.87281.40412.8215
HN1.75882.42932.6578
GX1.48901.60631.7661
CQ2.18341.49822.4834
SC1.94762.44752.4940
GZ2.53632.56521.4699
YN1.84921.41981.5801
SX2.96813.45812.1046
GS2.67432.05231.7637
QH3.49691.25261.6723
NX3.82973.29732.3382
XJ4.00992.97571.5724
Note: Table A5 lists the 25 provincial administrative units used for this study, with their abbreviations. FVGD, FVGR, and FVGS are the feature values of the grades of the driving force, resource potential, and the suitability of development conditions, respectively.
Table 7. Ranking of abandoned mine redevelopment potential and redevelopment sequence planning.
ConditionsRedevelopment PotentialRedevelopment SequenceAction and Emphasis
DSR
Higher potentialUrgent action (UA)
Compile urgent strategic planning
Correct improper development
Set standards and policies
Recent planning-I (RP-I)
Detailed development plan
Expand tactics and market benefit
Major project investment argument
High potentialRecent planning-II (RP-II)
Detailed development plan
Necessary project implementation guarantee
Extraterritorial capital and technical cooperation
ModerateRecent planning-III (RP-III)
Resource protection and enhancement measures
Cost-effectiveness argument
Major project implementation argument
Necessary project implementation guarantee
Low potentialMedium-term planning-I (MP-I)
Re-identify the resource potential
Extraterritorial deployment of capital technology
Lower potentialMedium-term planning-II (MP-II)
Re-identify the resource potential
Expand tactics and market benefit
Extraterritorial deployment of capital technology
Medium-term planning-III (MP-III)
Re-identify the resource potential
Major project implementation argument
Extraterritorial capital and technical cooperation
Long-term planning (LP)without considering
Note: D = driving force, S = resource potential, R = suitability of development conditions. The black dot ● indicates that the value is equal to or greater than the median, and a white dot ⃝ indicates that the value is less than the median.
Publisher’s Note: MDPI stays neutral with regard to jurisdictional claims in published maps and institutional affiliations.

