Article

Spatio-Temporal Characteristics and Influencing Factors of Urban Spatial Quality in Northeast China Based on DMSP-OLS and NPP-VIIRS Nighttime Light Data

College of Geography, Harbin Normal University, Harbin 150025, China
*
Author to whom correspondence should be addressed.
Sustainability 2022, 14(23), 15668; https://doi.org/10.3390/su142315668
Submission received: 8 October 2022 / Revised: 17 November 2022 / Accepted: 19 November 2022 / Published: 24 November 2022
(This article belongs to the Special Issue Advances in Community Resilience and Sustainable Urban Governance)

Abstract

:
The quality of urban spaces is a pivotal part of high-quality spatial development. It is directly connected to the comprehensive, coordinated and sustainable development of a region. In recent years, Northeast China has characterized urban space contraction and development. To study the quality of urban space in Northeast China, this paper fitted the Defense Meteorological Satellite Program’s Operational Linescan System (DMSP-OLS) and the Suomi National Polar-orbiting Partnership Visible Infrared Imaging Radiometer Suite (NPP-VIIRS) nighttime light data with 11 indicators related to high-quality urban development for the period 1992–2018. The feasibility of nighttime light data reflecting urban spatial quality was verified by a linear equation, and the temporal characteristics of urban spatial quality in Northeast China were obtained. The Exploratory Spatial Data Analysis Geographically and Temporally Weighted Regression (ESDA-GTWR) explores the spatial relevance and possible influencing factors of this kind of development. The results suggest that the overall trend of spatial quality in the three northeastern provinces is “initial slow growth and significantly weakened after”. The fast developing cities include Panjin, Liaoyang, Shenyang, and Dalian in the Liaoning Province. On the other hand, cities such as Heihe and Yichun in the Heilongjiang Province have relatively slow development speeds. Furthermore, the spatial quality development in the three northeastern provinces exhibits a trend of continuous concentration. The cities with high spatial qualities are concentrated near the Liaoning Province, with low spatial qualities in the north and high spatial qualities in the southern parts of the three provinces. As there is a notable gap between the northern and the southern regions, the central region represents an area in partial transition. The spatial quality of each city in the three northeastern provinces is the result of a number of intertwined factors, with significant differences in the degree of their influence. The significant degree of influence factors on spatial quality from higher to lower is urbanization, quality of life, rural revitalization, government promotion, and infrastructure.

1. Introduction

Within the framework of global sustainable development, China has come forward with the notion of high-quality economic development as part of dynamic development. The main connotation of high-quality development includes efficient growth, effective supply growth, medium and high-end structural growth, green growth, sustainable growth and harmonious growth. It puts forward five development concepts of innovation, coordination, green development, openness and sharing. Because of its continuous economic development, China has entered into the phase of high growth to high-quality development. At the present, the primary requirement is promoting high-quality development of ideas, economic policies, and macro-control. In addition, high-quality development is one of the main concerns of China’s 14th five-year plan and is thus related to the issue of socialist modernization. High quality development is an important development theory proposed by China. However, scholars from other countries have performed relatively little research on the theory of urban high-quality development. They paid more attention to the urban comfort [1], compactness [2], and sustainability [3] of major cities, conducting research on the theoretical connotation [4,5,6,7,8], indicator system construction, evaluation and analysis of livable cities, green cities, smart cities, low-carbon cities, sustainable development cities, and compact cities. Chinese scholars have extensively researched high-quality urban development from multiple perspectives, focusing primarily on its most pivotal notions [9,10,11,12,13,14,15,16,17]. At the same time, scholars have also begun to study the measurement and evaluation of high-quality development. In measuring high-quality development, the most critical research is the selection of indicators. There are two views on the selection of indicators in the academic community. One is to use single indicators such as total factor productivity to measure high-quality development [18,19,20,21,22,23]. The other is the construction of a comprehensive evaluation index system for high-quality development. The construction of a comprehensive evaluation index system for high-quality development by Chinese scholars can be roughly divided into two types: the first is to comprehensively measure high-quality development from the perspective of politics, economy, society, culture and ecology [24,25,26]. The second is to build a comprehensive evaluation index system around the five development concepts [27,28,29,30,31,32,33,34]. A significant number of scholars have conducted detailed analysis from the perspective of the “three domains” (domain, region, time domain): focusing mainly on high-quality economic and social development. However, while it is important to understand economically developed regions, the development process in other regions should not be neglected. It is not just a temporary development, but must adhere to high-quality development over time, so that scholars will focus on comprehensive high-quality development at the regional level [35]. The majority of scholars are concerned with urban evaluation of medium and small-scale high-quality development, such as the urban agglomeration in the Yellow River Basin and in the Yangtze River Delta [36,37]. The China Central Committee decided to implement a revitalization strategy of the old industrial base in Northeast China in 2003. This plan was concerned with upgrading the industrial structure, transforming the economic system, resolving the issue of employment growth, promoting the development of regional economic integration [38], enabling sustainable development of rural agriculture in the three northeastern provinces [39], and accelerating urbanization [40]. In addition, as a result of the national revitalization strategy and other policies, more and more scholars were able to shift their focus on the high-quality development of Northeast China [41,42,43,44,45]. In response to the national high-quality development strategy, Northeast China is facing huge challenges and opportunities, thus contributing to the study of spatial quality in Northeast China.
In order to accelerate the revitalization of Northeast China and cause new breakthroughs, high-quality research on the Northeast China is particularly important. Thus far, scholars have only examined the development quality of Northeast China through the development characteristics of the entire city, ignoring the development quality of regional units [41,42,43,44,45]. This study differs from other scholars’ research on the quality of urban macro time or the quality of the whole city but emphasizes the importance of spatial quality. Therefore, in the study of urban development, the consideration of space is added, and the concept of urban spatial quality (quality of development of unit area in urban space) is proposed. Using multi-source remote sensing data to simulate urban spatialization can analyze regional economic and social activities from a unit area, and the simulation of an urban spatial pattern with night light as the main indicator has been widely used. The nighttime light data provided by the US Defense Meteorological Satellite have the advantages of strong data availability, small processing capacity, and brightness indicators that reflect the intensity of economic activities. Even though the data still have issues with stability and compatibility [46,47], the abovementioned characteristics cause them to be suitable for large-scale and long-term regional spatial research, and the data can still effectively show the quality of urban spatial development. On the other hand, spatial simulation based on DMSP-OLS nighttime light data is known for its small data volume and strong comprehensiveness, causing it to be widely used in simulating regional and urban spatial distribution [48]. However, the DMSP-OLS data are only available until 2013, meaning they cannot be used to accurately analyze regional spatial characteristics in recent years. However, as a new light data source with high spatial and high temporal resolution, and a wide radiation detection range, NPP-VIIRS has shown great potential in retrieving detailed human activity distribution [49,50]. VIIRS nighttime light data are able to accurately reflect the relationship between nighttime light and socio-economic variables on a smaller scale [51,52], thus enhancing the spatial simulation accuracy of economic and social variables. However, as this data collection began in 2012, it is not convenient for long time series research. Because of this, many scholars have opted to combine two kinds of lighting data within their research on urban spatial economy and population [53,54,55,56,57]. Studies that use these types of data combinations have been shown to have better accuracy and can better reflect regional economic and social activities. In sum, the use of nighttime light data provides a detailed image of urban development in a macro and comprehensive way for the unit areas.
From the perspective of spatial quality, the present paper was based on the annual nighttime light data of the DMSP-OLS from 1992 to 2013 and the monthly NPP-VIIRS nighttime light data from 2013 to 2018. The latter has been transformed. Then, the study fitted and verified the light data with spatial quality index data and used the light data to analyze the spatial and temporal characteristics of urban spatial quality in the three northeastern provinces. In addition, the paper discusses its influencing factors through the spatio-temporal weighted regression model (GTWR), thus providing a theoretical basis for promoting the high-quality development of the three northeastern provinces. Moreover, research into spatial quality further supports high-quality and sustainable development, thus determining the future of both national and global urban development.

2. Materials and Methods
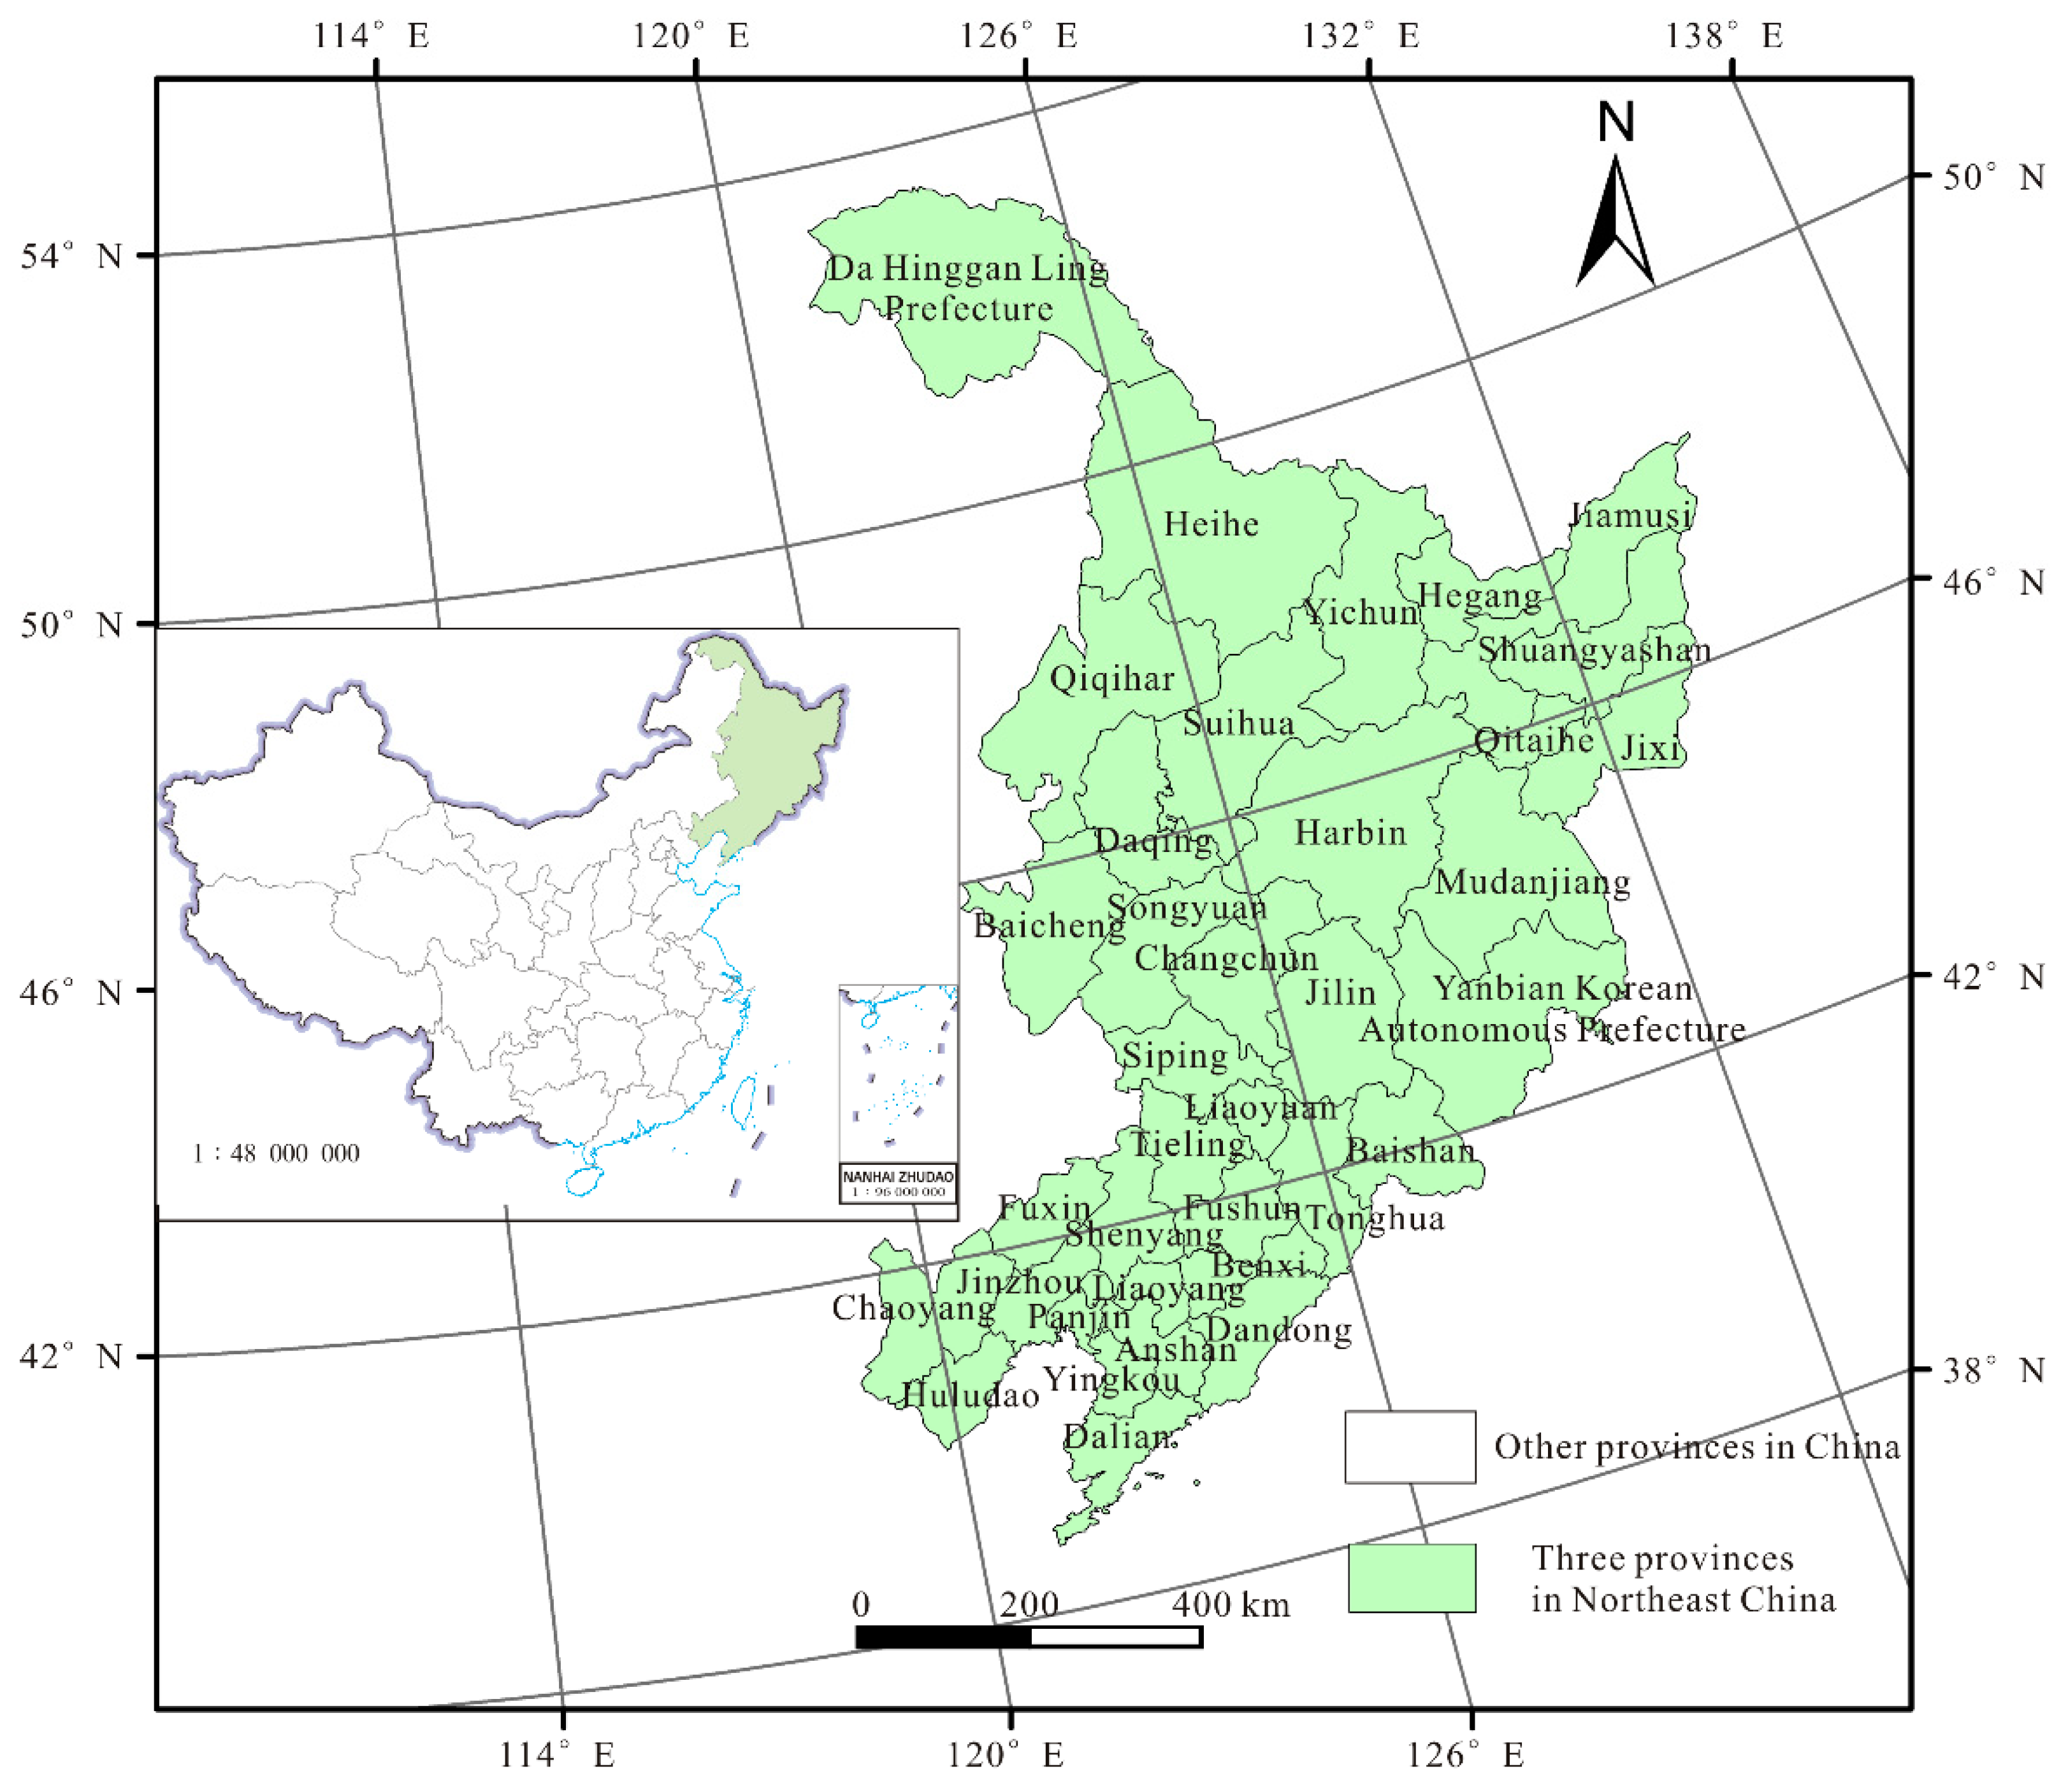
2.1. Study Area

The research area includes 34 prefecture level cities that are under the jurisdiction of three northeastern provinces, namely Liaoning Province, Jilin Province and Heilongjiang Province. The Great Khingan Mountains region and Yanbian Korean Autonomous Prefecture are excluded (Figure 1). The northeast economy started early, contributing to the development of New China and supporting national economic construction. However, due to slow economic development in the heavy industrial bases, economic development in Northeast China was backtracked during the 1990s. According to the China Urban Statistical Yearbook [58], the GDP of this region was only CNY 299.505 billion in 1992. In 2003, the Northeast Revitalization Strategy was proposed to “support the adjustment and transformation of the old industrial bases in the Northeast and support the development of continuous industries in resource-based cities and regions”. Thus, policies such as “supporting the development of major grain producing areas” [59] have established a new development strategy for Northeast China, effectively promoting the rapid economic and social development of this region. Between 2004 and 2007, the GDP of Northeast China had increased by 16.4% annually, while the regional economy had developed steadily through the years. In 2018, the regional GDP reached CNY 5675.159 billion. Because of the revitalization policy, Northeast China focused more of its attention on sustainable high-quality development. The 2018 National Science and Technology Investment Statistics Bulletin indicates that the research and experimental development funds in Northeast China amount to 71.01 billion yuan, showing a slow overall growth. The interaction between urban and rural areas in the region tends to ease, while the coordination adaptability between urban and rural areas continues to increase [60]. Furthermore, both the quality and quantity of green development in restricted development zones have been improved in the region [61]. Northeast China represents a window for China to open to Northeast Asia. The adjacent countries, such as Russia, North Korea, South Korea, and Japan, have their own strengths in terms of resources, markets, capital, technology, and advanced management experience [61]. Therefore, research into the spatial quality of Northeast China is able to answer the five developmental concepts of “innovation, coordination, green, openness, and sharing” [18]. These answers are further significant for the high-quality development of China’s regions, as well as for the overall economic cooperation and development of Northeast Asia.

2.2. Data Sources

2.2.1. Nighttime Light Data

As nighttime light data must be preprocessed, this paper corrects each image of the DMSP-OLS data from 1992 to 2013. Radiometric calibration is able to reduce pixel saturation and data fluctuations caused by system errors [62]. However, because there is no on-board calibration system, the complex algorithm makes it difficult to obtain the parameters necessary for radiometric calibration. In other words, it is complicated to perform absolute radiometric calibration. In order to obtain the DMSP-OLS nighttime light data from 1992 to 2013, this paper uses the invariant target area method for mutual correction of long time series for the DMSP-OLS image data sets. Furthermore, the monthly NPP-VIIRS cloud-free average radiation composite images between 2013 and 2018 were cut, projected, and transformed to uniformly convert spatial data into the WGS-84 coordinate system. After, the nighttime light data were set as the threshold of the effective value of the nighttime light for the entire study area. The image noise is processed by the eight-neighborhood window smoothing method [63,64] to remove short-term data related to fire, gas fire, volcano or aurora, and background noise from weak light reflected by snow-covered or dry lake beds [65]. In order to generate NPP-VIIRS nighttime light data from 2013 to 2018, the paper conducted the annual image synthesis by processing monthly light images through the annual average method. Lastly, the size of the output grid unit (30 m × 30 m) was obtained by resampling the light grid data. Since the official website of the National Oceanic and Atmospheric Administration (NOAA) does not provide a global nighttime light map for June 2018, the data for this particular month are not available.

2.2.2. Statistical Yearbook Data

A total of 11 indices (Table 1) were selected to measure the degree of spatial quality development in Northeast China. All of them were based on five development concepts, namely, innovation, coordination, green, openness and sharing [35]. The index data were obtained from the China Urban Statistical Yearbook from 1992 to 2018 [66]. The basic index data and nighttime light data were then logarithmically processed to weaken their heteroscedasticity and ensure the model is more appropriate.

2.2.3. Data Processing

A DMSP-OLS nighttime light image is defined as a stable light image without radiometric calibration. Its pixel Digital Number (DN) value is measured as the relative brightness radiation value without the radiometric calibration on the satellite (from 1992 to 2013). On the other hand, the DN value of the NPP-VIIRS image pixel represents the value after radiometric calibration (from 2012 to the present), with this unit being n W × cm−2 × sr−1. Since these two data types are inconsistent and incomparable in long time series, it is difficult to apply them directly to multi-source nighttime light image sets. Therefore, the present paper proposes a mutual correction method based on DMSP-OLS and NPP-VIIRS. This method establishes a regression correlation between DMSP-OLS and NPP-VIIRS in 2013. After, it uses the established regression equation to correct the VIIRS data between 2014 and 2017 (Table 2). A comparison of fitting coefficients indicates that the univariate cubic fitting coefficient is the highest. Thus, this paper chooses the univariate cubic regression model to transform and correct the NPP-VIIRS nighttime light data.
In general, the methods of regression analysis include the general linear regression model, the logarithmic model, and the quadratic regression model. The general linear regression model is most commonly used, as its fitting accuracy is relatively high [67]. In order for it to function accurately, the following steps need to be followed. Firstly, to carry out statistical inference, a logarithmic transformation between light data, and the statistical yearbook data is performed. Next, a linear regression analysis is conducted on the five development concepts through the Statistical Product and Service Solutions (SPSS) software. As a result, the formula of a general linear regression model of spatial quality development is obtained (Table 3). Within the model, x represents the secondary index of spatial quality development, while y denotes the DN value of nighttime light. Table 3 illustrates that the p-values of the linear fitting results of nighttime light and the four secondary indicators of spatial quality development are all less than 0.01, meaning that the fitting effect is good. Furthermore, the p-value of the linear fitting result of the green index is greater than 0.01 and less than 0.05, suggesting that nighttime light data effectively reflect the quality of urban development in Northeast China.

2.3. Research Method

2.3.1. Exploratory Spatial Data Analysis

Exploratory spatial data analysis (ESDA) analyzes and identifies the nature of spatial information using a combination of statistical principles, graphics, and charts [68]. In this paper, the overall spatial difference and degree of correlation are processed using the global Moran’s I (GMI). The autocorrelation degree of spatial quality development in Northeast China is examined by calculating the global Moran index of the degree of spatial quality development. The formula in question is as follows:
M o r a n s   I = i = 1 n j = 1 n W i j Y i Y ¯ ( Y j Y ) ¯ S 2 i = 1 n j = 1 n W i j
In the equation above, n denotes the number of cities in Northeast China, while Y i   represents the quality value of the i th urban spatial development. Next, W i j denotes the spatial adjacency relationship of the research unit. When the units in the two research areas are adjacent, then W i j is 1. Conversely, when these units are not adjacent, then W i j is 0. The Moran’s range of values is −1 ≤ I ≤ 1. An I value closer to 1 indicates that the quality of economic development in Northeast China has an agglomeration trend. On the other hand, when this value is closer to −1, the development quality presents a discrete state.
The Getis-Ord General G i * is able to measure the local correlation characteristics of spatial quality development and identify the pattern of spatial distribution of hot and cold spots of spatial development. The formula is as follows:
Z G i * = j n W i j d x j j n x j
The   G i * ( d ) is standardized as follows:
Z G i * = G i * E G V a r G i *
In the equation above, W i j ( d ) represents the spatial weight defined by distance, while E(G) and V a r G i * denote the G i * mathematical expectation and coefficient of variation, respectively. In the case that Z G i * is positive and significant, the value around the position i is considered to be relatively high (hot spot). Conversely, if Z G i * is negative and significant, the value around this position is relatively low (cold spot).

2.3.2. Spatiotemporal Geographic Weighted Regression Model

This paper analyzes the factors potentially influencing the spatial development in Northeast China using GTWR. As an extension of the spatial weighted regression model, the GTWR model represents a spatio-temporal and non-stationary regression model. The core is to add the time factor into the spatial geographical weighted regression model. This model is able to analyze the spatial (longitude and latitude) and temporal coordinates of cities in Northeast China and thus create a space-time weight matrix for the period between 1992 and 2018. Dissimilar from this model, the traditional geographically weighted regression analysis does not introduce a time dimension and has fixed spatial coordinate data. Furthermore, the GTWR model requires that the analyzed object has different spatial coordinates at different time phases. Based on time dimension analysis, more coordinate coincidence will cause the results to be closer to linear regression analysis [69]. The formula is as follows:
Y i = β 0 X i t , Y i t , T i + k β k X i t , Y i t , T i X i k + ε i
In the formula above, Y i represents the observed value, while X i t , Y i t , T i denotes the space-time coordinate of the i th sample point. Next, β 0 X i t , Y i t , T i represents the regression constant of point i , i.e., the constant term within the regression model. The term β k X i t , Y i t , T i denotes the k th regression parameter of point i , i.e., the weight of the model function at the spatio-temporal coordinates X i t , Y i t , T i . Next, X i k represents the value of the independent variable X k at point i . In other words, it represents the value of each quantitative index in the index system of the regression model. The symbol ε i   denotes the residual of the model function. Finally, X i t , Y i t represent the longitude and latitude coordinates of the spatial quality development point, respectively. The formula is as follows:
X i t = i = 1 n H i t X i i = 1 n H i t ,   Y i t = i = 1 n H i t Y i i = 1 n H i t
In the equation above, H i t represents the development value of the urban spatial quality of unit i in year t. Next,   X i , Y i   denote the longitude and latitude coordinates of the center of the built-up area of spatial unit i , respectively.

3. Results

3.1. Spatial and Temporal Characteristics of Spatial Quality in Northeast China

3.1.1. Temporal Characteristics of Spatial Quality in Northeast China

After the paper has transformed and sorted the nighttime light data of the DMSP-OLS (between 1992 and 2013) and the NPP-VIIRS (between 2014 and 2018), it obtains the general trend of spatial quality in Northeast China for this time period (Figure 2). It shows that the light index in Northeast China is increasing year by year and the index values in Yingkou, Shenyang, Dalian, Changchun, Harbin, and Daqing are increasing rapidly. However, the index value in Fushun, Baicheng, Baishan, Yichun, and Heihe slowly increased. The time analysis indicates that the figure is predominantly blue from 1992 to 2007. In general, the results suggest that the spatial quality of cities in Northeast China is relatively low. However, between 2007 and 2012, except for Baicheng, Baishan, and other regions, the spatial quality of cites in Northeast China significantly improved. Furthermore, between 2012 and 2018, the spatial quality of these cities grew rapidly, while Qitaihe, Panjin, and Liaoyang exhibited a significant downward trend.

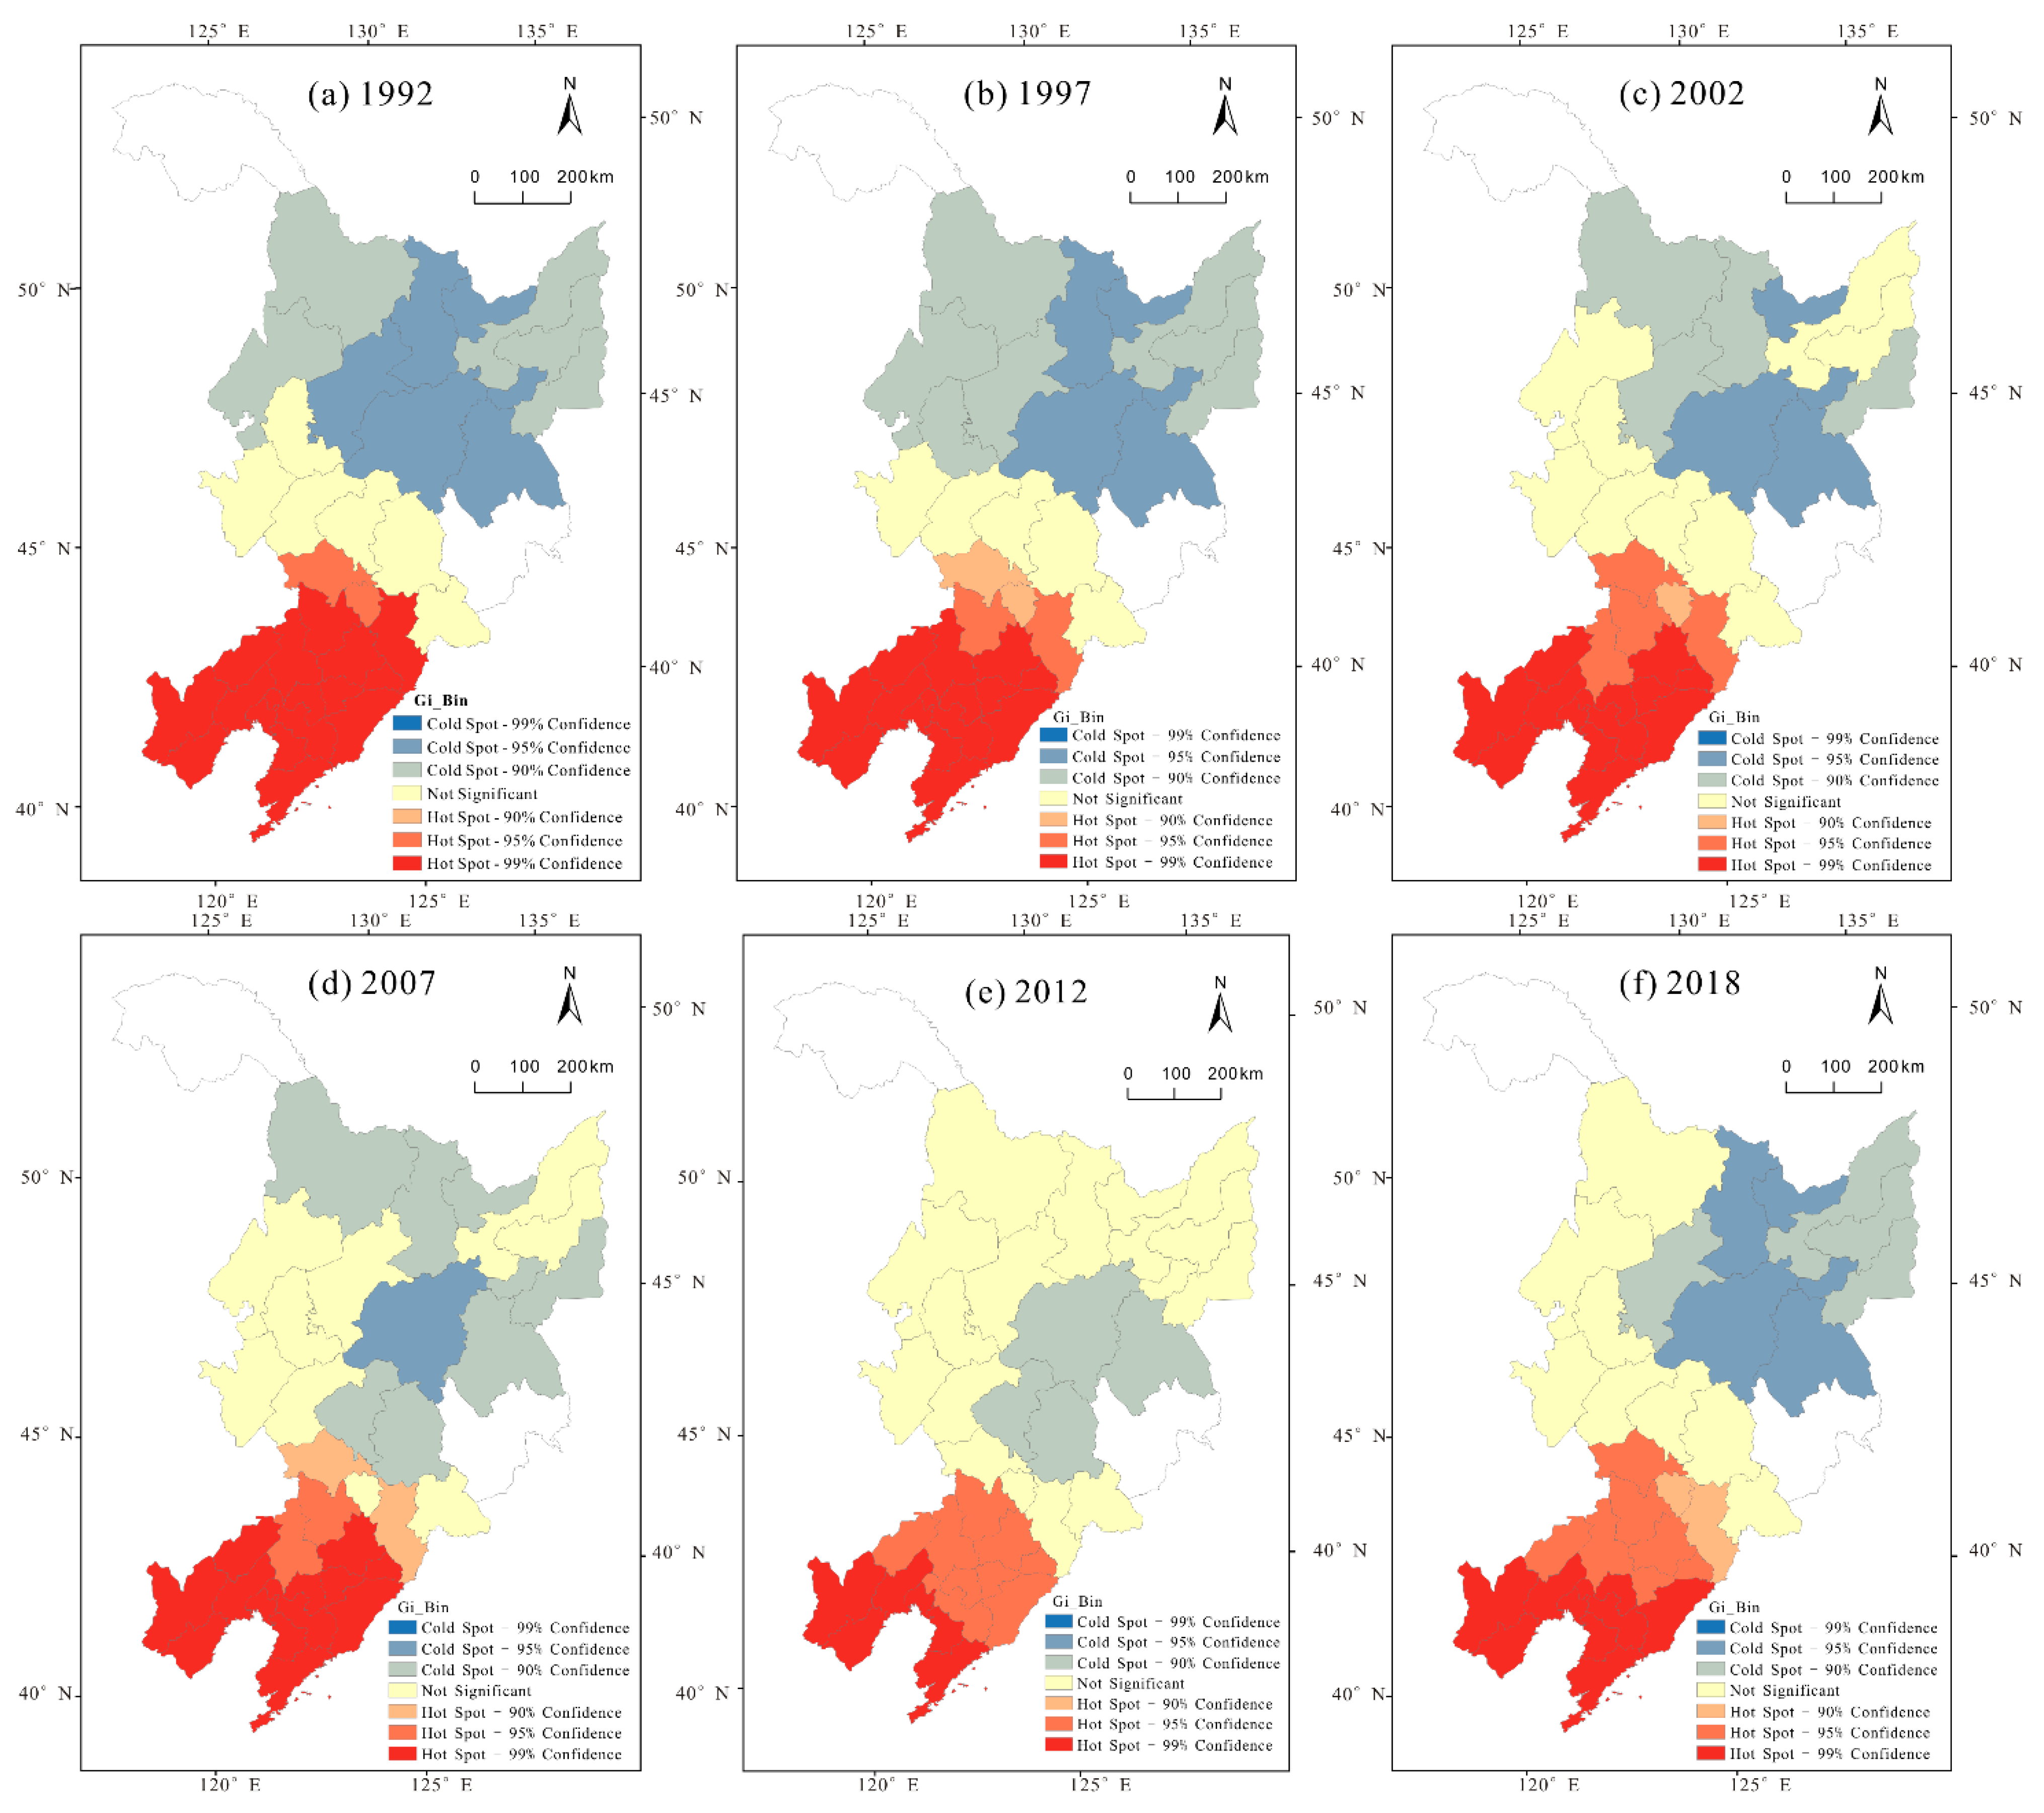
3.1.2. Spatial Characteristics of Spatial Quality in Northeast China

The spatial quality of Northeast China was analyzed. The years 1992, 1997, 2002, 2007, 2012, and 2018 were selected as the six time nodes. In order to obtain the distribution map of the spatial quality of Northeast China from 1992 to 2018 and according to the data characteristics of the urban spatial quality index, this paper used the Jenks natural breakpoint method to process the data from the aforementioned six years (Figure 3). As Figure 3 illustrates, the spatial quality of the southern prefecture level cities is higher than for those in the north. Furthermore, the spatial quality of Panjin, Liaoyang, Shenyang, and Dalian are higher than that of other prefecture level cities. Thus, the urban spatial quality and spatial development of these cities is higher. The spatial quality and development level of northern cities, such as Heihe, Baicheng, and Yichun are lower than in other areas; their spatial quality is lower. Between 1992 and 2002, the spatial quality of each region changed slightly. Cities such as Heihe and Yichun always had a low level of development, while the spatial quality of southern coastal cities was always high. In addition, the urban spatial quality of central regions experienced partial changes. Furthermore, between 2007 and 2012, there was no evident change between the regions with high and low urban spatial qualities. However, cities in Northeast China, such as Daqing and Changchun, had a trend of high spatial quality. Finally, from 2012 to 2018, areas with high spatial quality continued to develop, while those with lower spatial quality also showed improvements. The development of spatial quality in Northeast China has gradually become balanced.
Using Arcgis10.2 software, the paper was able to obtain the global Moran’s I index of the spatial quality in Northeast China from 1992 to 2018 (Table 4). The z-value between 1992 and 2018 was greater than 1.65 and the Moran’s I index was positive. The spatial quality values in Northeast China exhibited a clustering spatial pattern, with a p value less than 0.01, meaning that its confidence level was 99% and indicating that the spatial quality in Northeast China was clustered in space, that is, the high spatial quality was clustered together. It also shows that cities with low spatial qualities are closely connected. Furthermore, since the Northeast Revitalization Strategy was proposed, the Moran’s I index gradually decreased and the overall gap in the spatial quality gradually narrowed, while the degree of agglomeration was not significant between 2002 and 2018.
Using the Getis-Ord General G i * in ArcGIS10.2, the paper was able to obtain the distribution of cold and hot spots of spatial quality from 1992 to 2018 in Northeast China (Figure 4). The hot spots are concentrated in the southwest part of the region, primarily in the cities of the Liaoning Province. On the other hand, the cold spots are mainly distributed in the northern parts of the region, particularly in the Heilongjiang Province. This distribution suggests that the spatial quality of Northeast China exhibits a local agglomeration phenomenon. In other words, the prefecture level cities with both high and low spatial qualities exhibit a certain correlation, with the former concentrated in the southern part of the Liaoning Province and the latter situated in the Heilongjiang Province. In addition, through yearly comparison, it becomes clear that both the cold spots and the hot spots are decreasing, meaning that the spatial quality gap between the cities is narrowing.

3.2. Influencing Factors of Spatial Quality Spatio-Temporal Characteristics in Northeast China

In order to analyze the factors influencing spatial quality, the spatio-temporal weighted regression calculation was conducted for the economic and social indicators in Northeast China. According to the new urbanization strategies [70], 13 influencing factors were selected, the principal component analysis was used to reduce the dimensions of the 13 main impact indicators, and 5 main impact mechanisms were summarized. They are infrastructure, urbanization, rural revitalization, quality of life, and government promotion. The results show that the influence of five impact mechanisms on the urban spatial quality, from higher to lower, are urbanization, quality of life, rural revitalization, government promotion, and infrastructure. At the same time, the sum of the values of the influencing factors of all independent variables in each mechanism is the value of the intensity of the influence of the mechanism. The indicator system is provided in Table 5, while the influencing factors of spatial quality are analyzed using the GTWR with spatial quality.
After the above indicators had been calculated by the GTWR model, this paper was able to obtain the factors influencing the spatial and temporal evolution of spatial quality in Northeast China from 1992 to 2018 (Figure 5). The factors from F1 to F5 correspond to the impact of infrastructure, urban development, rural revitalization, residents’ quality of life, and government promotion, respectively.

3.2.1. Impact of Infrastructure on Spatial Quality

Infrastructure represents a public service system that ensures the normal social and economic activities of a country or region. Functioning social infrastructure guarantees the long-term sustainable and stable development of the regional economy. Furthermore, it is also an important foundation for building a livable city. The infrastructure systems most valued by residents are healthcare and education, while the one that affects regional development is the development degree of the traffic system. Therefore, the impact coefficient of spatial quality is calculated by the number of doctors per 10,000 people, teachers per 10,000 people and the density of the urban road network. Between 1992 and 2007, infrastructure had a significant role in driving the development of central and southern parts of Northeast China. On the contrary, infrastructure plays a small role in the north. The improvement of social infrastructure in southern parts of Northeast China was higher than that in Northern China (Figure 5). Namely, the social infrastructure in the Liaoning Province and Jilin Province was functioning adequately, promoting local spatial quality development and providing residents with living security. However, the social infrastructure in the Heilongjiang Province was relatively backward, resulting in a relatively low spatial quality. Between 2007 and 2018, cities in the central part of the region improved, while the development gap between them and the southern parts gradually narrowed. However, the development of the northern regions remained relatively low.

3.2.2. Impact of Urbanization on Spatial Quality

The level of urbanization is an important indicator of regional economic development and a standard for measuring the quality of urban space. Therefore, urbanization not only encourages regional economic development, but also promotes the improvement of urban residential quality. The urbanization process in Northeast China has a significant impact on the spatial quality of the central region (Figure 5). This impact is most evident between 2007 and 2018, when it spread to a certain extent near Shenyang, because the latter responded to China’s strategy of “Revitalizing the northeast” in 2003. The strategy aimed to build a “national central city”, coordinate urban and rural construction, vigorously promote the urbanization process, and drive the surrounding cities by jointly promoting the development of new urbanization and the spatial quality development of the region.

3.2.3. Impact of Rural Development on Spatial Quality

In recent years, rural revitalization has been one of the most frequently discussed topics in China. The discrepancy between the growing needs of the Chinese citizens and the unbalanced development is most prominent in the countryside. To a large extent, some rural areas in China are still in the primary stages of socialism. The development degree of northeast villages are obtained from the per capita rural GDP, the proportion of rural secondary and tertiary industries, and the total power of agricultural machinery (Figure 5). Based on this, the study concludes that prefecture level cities with a high rural development coefficient are distributed in the periphery. Furthermore, between 1997 and 2018, the influence degree gradually spread from Heihe to the east, being evident in the northern parts of the Heilongjiang Province in 2018. This influence was able to spread because rural agriculture in most northern and eastern areas of Northeast China has a good foundation. With technological and scientific development, the level of agricultural mechanization continues to improve, thus promoting the rapid development of the local agricultural economy. In addition, rural secondary and tertiary industries also encourage the development of non-agricultural industries in these areas thus improving their spatial quality as well.

3.2.4. Impact of the Quality of Life of the Residents on Spatial Quality

The residents’ qualiies of life reflect the livableness level of a city and may be used to measure the development level of a region. A good quality of life results in relatively high economic development, indicating that other conditions within the city are also excellent. By calculating the average wages of urban employees and the per capita consumption level of the city, the paper is able to determine that the quality of urban space in northern Northeast China has improved with the continuous improvement of residents’ qualities of life (Figure 5). Even though the economic development in this region was relatively slow, the Northeast Revitalization Strategy drastically improved residents’ qualities of life and the region’s spatial quality from 2007 to 2018. However, southern coastal cities were less impacted because of their high qualities of life of early residents.

3.2.5. Impact of Government Promotion on Spatial Quality

The government’s partial regulation is capable of promoting the rate of urban development. Its fiscal expenditure and revenue are able to determine the impact coefficient caused by government regulation under spatial quality development. Macro-regulation represents the overall management of the national economy by the government and the economic function of the national government, namely the central one. It is the state’s regulation and control of the overall social economy in order to promote market development and standardize market operation in the economic operation. By calculating the per capita fixed asset investment and the ratio of fixed asset investment for urban and rural areas, this paper concludes that the promotion of urban governments in Northeast China had an evident impact on the latter’s spatial quality between 1992 and 1997 (Figure 5). Because of the small scale of resource-based cities in the northeast of Heilongjiang Province, these cities have become the focus of government attention. The investment in these cities is relatively large, while the government regulation mechanism in them is more prominent. Because of the northeast revitalization strategy, all regional governments in Northeast China increased their investment in all cities. Because of this, the discrepancy in the influence of cities in this region has gradually stabilized between 2007 and 2018.

4. Discussion

4.1. Processing and Application of Nighttime Light Data

The application of nighttime light data included DMSP-OLS and NPP-VIIRS. Previous studies used logarithmic transformation to process the NPP-VIIRS data [55]. However, after analyzing the regression model of the DMSP and VIIRS nighttime light data, this paper concluded that the fitting effect of the univariate cubic regression model was better. Therefore, this paper used the univariate cubic regression model to convert and change the NPP-VIIRS data, and to transform and unify light data from two distinct sources. Furthermore, the light data were tested with eleven basic indicators, based on the five development concepts, namely innovation, coordination, green, openness and sharing. Scholars have analyzed the macro high-quality development of Northeast China from multiple angles [42]. This paper uses nighttime light data to microcosmically and comprehensively reflect the development of urban spatial quality from a unit area of the study area. It also shows that nighttime light data can effectively reflect the quality of urban space in Northeast China and may thus be used to analyze the temporal and spatial characteristics of urban spatial quality within the study area.

4.2. Analysis of Spatial and Temporal Characteristics and Factors Influencing Spatial Quality

By sorting the lighting data of cities in Northeast China from 1992 to 2018, the temporal and spatial characteristics of this region are analyzed. This paper uses GMI and the Getis-Ord General G i * to analyze the regional spatial characteristics, as it is more effective to analyze the agglomeration and dispersion characteristics of the Northeast’s spatial quality. For this analysis, the study selected thirteen indicators from five perspectives, namely infrastructure, urbanization, rural revitalization, residents’ qualities of life, and government promotion, which were calculated in order to represent the spatial quality using the GTWR model. Compared to the traditional GWR [71], the GTWR introduced time factors, considered temporal and spatial characteristics as influencing factors, and was thus able to conduct the influencing factor analysis from five distinct perspectives. Through the combination of ESDA-GTWR, this paper was able to analyze the spatio-temporal characteristics and influencing factors of spatial quality in greater detail. However, the GTWR model can still be modified further. For instance, the determination of the two-dimensional coordinates, the parameter ratio of spatio-temporal dimensions, the bandwidth optimization of the model, and the selection of time step units can all be further researched to improve the accuracy of influencing factor analysis.

4.3. Innovation and Shortcomings

At present, there is a limited number of studies focused on the development of urban spatial quality that have used nighttime light data. The present study thus provides a partial research foundation in this area and a further theoretical basis for the future research of urban development in Northeast China. Using DMSP-OLS and NPP-VIIRS nighttime light data extends the time span of the study. Compared with using only DMSP-OLS data, it can more accurately develop the spatio-temporal characteristics of Northeast China [35]. However, due to the lack of statistical yearbooks for the Da Hinggan Ling Prefecture and the Yanbian Korean Autonomous Prefecture, research into Northeast China is still incomplete. Therefore, future research should use other data collection methods to increase the data availability. Although the spatial quality of some cities has changed substantially since 2013, there is no mistake in referring to relevant research results [41,42,43,44,45]. Therefore, in the next research, we will analyze the causes, optimize data processing methods, and improve the conversion and analysis model in order to reduce errors. At the same time, this study also lays the foundation for the analysis of the temporal evolution of spatial quality and the simulation and prediction of spatial quality in the next decade.

5. Conclusions

The present paper fitted the nighttime lighting data with the urban spatial quality development index and examined the spatial correlation and influencing factors through ESDA-GTWR. Based on the result discussed above, this paper draws the following conclusions. Firstly, the prefecture level cities with high spatial qualities in Northeast China are concentrated in the Liaoning Province, whose development speed has accelerated since 2003. On the other hand, the spatial quality of the Heilongjiang Province remains relatively low and begins to improve only after 2013. In sum, the development of spatial quality in Northeast China is concentrated near Shenyang and Changchun, with a low spatial quality in the north and a high one in the south of the region. Secondly, the growth rate of the spatial quality in different regions was slow from 1992 to 2002. The northern region was continuously at a low level of development, while the spatial quality of the southern coastal cities was always relatively high. The urban spatial quality of the central region changed less significantly. From 2007 to 2012, there was no obvious change between the regions with high and low urban spatial qualities in Northeast China, but the medium quality of urban space in Central China tended to develop toward a high quality of space. Furthermore, between 2012 and 2018, the areas with high spatial qualities continued to spread, while areas with low spatial qualities improved. The development of the spatial quality in Northeast China was gradually balanced. Lastly, the influence mechanism on spatial quality in Northeast China includes the degree of infrastructure improvement, degree of urbanization, results of rural revitalization, residents’ living standards, and the impact of government promotion. Among them, the degree of infrastructure improvement and the urbanization level have a weak impact on northern cities and a more obvious impact on southern cities. However, rural development, residents’ living standards, and government promotion have a strong impact on cities in the Northeast.

Author Contributions

H.L. and X.C. conceived and designed the study. H.L. processed the data and performed analysis. Y.W., X.X. and M.Z. contributed to the interpretation of the results. All authors reviewed and edited the draft, approved the submitted manuscript, and agreed to be listed and accepted the version for publication. All authors have read and agreed to the published version of the manuscript.

Funding

This study was financially supported by the Natural Science Foundation of Heilongjiang Province (LH2019D008), the Humanities and Social Sciences Youth Fund of the Ministry of Education (19YJC630177), the Youth Innovative Talent Training Plan of Heilongjiang Ordinary Undergraduate Colleges and Universities (UNPYSCT-2018194), the Outstanding Young Scholars Support Project of Humanities and Social Sciences of Harbin Normal University (SYQ2014-06) and the Graduate Innovation Project of Harbin Normal University (HSDBSCX2021-08).

Institutional Review Board Statement

Not applicable.

Informed Consent Statement

Not applicable.

Data Availability Statement

Data sharing not applicable.

Conflicts of Interest

The authors declare no conflict of interest.

References

  1. Maridal, J.H. A worldwide measure of societal quality of life. Soc. Indic. Res. 2016, 134, 1–38. [Google Scholar] [CrossRef]
  2. Jungchan, L.; Kiyo, K. Development of the compact city index and its application to Japanese cities. Urban Stud. 2015, 52, 1054–1070. [Google Scholar] [CrossRef]
  3. Kilkis, S. Benchmarking South East European Cities with the Sustainable Development of Energy, Water and Environment Systems Index. J. Sustain. Dev. Energy Water Environ. Syst. 2018, 6, 162–209. [Google Scholar] [CrossRef]
  4. Feleki, E.; Vlachokostas, C.; Moussiopoulos, N. Characterisation of sustainability in urban areas: An analysis of assessment tools with emphasis on European cities. Sustain. Cities Soc. 2018, 43, 563–577. [Google Scholar] [CrossRef]
  5. Liu, L. A sustainability index with attention to environmental justice for eco-city classification and assessment. Ecol. Indic. 2018, 85, 904–914. [Google Scholar] [CrossRef]
  6. Krellenberg, K.; Koch, F.C. Urban Sustainability Transformations in lights of resource efficiency and resilient city concepts. Curr. Opin. Environ. Sustain. 2016, 22, 51–56. [Google Scholar] [CrossRef]
  7. Huovila, A.; Bosch, P.; Airaksinen, M. Comparative analysis of standardized indicators for Smart sustainable cities: What indicators and standards to use and when? Cities 2019, 89, 141–153. [Google Scholar] [CrossRef]
  8. Okulicz-Kozaryn, A.; Valente, R.R. Livability and subjective well-being across European cities. Appl. Res. Qual. Life 2019, 14, 197–220. [Google Scholar] [CrossRef]
  9. Li, C. Comprehensive evaluation of human settlements in 36 central cities of China. J. Arid. Land Resour. Environ. 2017, 31, 1–6. [Google Scholar] [CrossRef]
  10. Chen, Y.L.; Tao, T.H.; Ding, T. Spatial-Temporal Distribution Characteristics of Air Quality in the Urban Agglomeration of the Yangtze River Delta. Resour. Environ. Yangtze Basin 2017, 26, 687–697. [Google Scholar] [CrossRef]
  11. Dou, P.F.; Zuo, S.Z.; Ren, Y.; Huang, W. Construction of an Index System for Green Cities Based on Urban Classification. Chin. J. Ecol. 2019, 38, 1937–1948. [Google Scholar] [CrossRef]
  12. Wang, D.L. Comprehensive Measurement and Evolution Law of Urbanization Development Quality of Urban Agglomeration in China. Chin. J. Popul. Sci. 2018, 1, 46–59. [Google Scholar]
  13. Yu, Z.L.; Tang, Y.Y.; Zhang, H. Spatial Pattern and Driving Factors of Chinese Urban Amenities. Geogr. Res. 2016, 35, 1783–1798. [Google Scholar] [CrossRef]
  14. Cui, L.; Yang, K. Construction of Evaluation Index System of Smart City. Stat. Decis. 2018, 34, 33–38. [Google Scholar] [CrossRef]
  15. Shi, B.; Zhang, B.Y. Measurement and Analysis of High-Quality Economic Development of Cities Above Prefecture Level in China. Soc. Sci. Res. 2019, 3, 19–27. [Google Scholar]
  16. Cheng, J.H.; Peng, X.J.; Feng, Y. Evaluation on the Level of Ecological Civilization in Chinese Cities. J. China Univ. Geosci. (Soc. Sci. Ed.) 2018, 18, 102–113. [Google Scholar] [CrossRef]
  17. Zhu, J.H.; Qi, W.; Xiu, C.L. Spatial Structure and Evolution Mechanism of Municipal Districts in China. Geogr. Res. 2019, 38, 1003–1015. [Google Scholar] [CrossRef]
  18. He, X.Y.; Shen, K.R. Modernized Economic System, Total Factor Productivity and High Quality Deveopment. Shanghai J. Econ. 2018, 6, 25–34. [Google Scholar] [CrossRef]
  19. Chen, S.Y.; Chen, D.K. Air Pollution, Government Regulations and High-quality Economic Development. Econ. Res. J. 2018, 53, 20–34. [Google Scholar]
  20. Hui, N.; Chen, J.Q. Can the Integration of Internet and Real Economy Become a New Momentum to Promote High-Quality Development? J. Northwest Univ. (Philos. Soc. Sci. Ed.) 2020, 50, 47–61. [Google Scholar] [CrossRef]
  21. Zhang, Y.Y.; Dong, Q.C.; Ni, M. Differentiation and Analysis of Service Industry Development and ‘Structural Deceleration’. Econ. Perspect. 2018, 2, 23–35. [Google Scholar]
  22. Zhang, Z.D.; Liao, C.W. Total Factor Productivity and High-Quality Economic Development-An Empirical Research Based on the Perspective of Government Intervention. Soft Sci. 2019, 33, 29–35. [Google Scholar] [CrossRef]
  23. Yu, Y.Z.; Yang, X.Z.; Zhang, S.H. Research on the Characteristics of Time and Space Conversion of Chain’s Economy from High-speed Growth to High-quality Development. J. Quant. Technol. 2019, 36, 3–21. [Google Scholar] [CrossRef]
  24. Yao, S.M. Promoting Beautiful China Construction with High-quality Industrial Cluster Development-Comment on Research on Industrial Agglomeration, Environmental Pollution and Environmental Regulation. J. Nanjing Univ. Sci. Technol. 2022, 35, 45–51. [Google Scholar] [CrossRef]
  25. Zhang, H.L.; Wang, Y.H.; Wang, Y.Y. Measurement and Improvement of High Quality Development Level in Yellow River Basin. Reg. Econ. Rev. 2020, 4, 45–51. [Google Scholar] [CrossRef]
  26. Lu, B.K.; Xing, M.Y.; Yang, Q.L. Measurement and Spatio-temporal Differences Analysis of High Quality Development Level of China’s Economy. Stat. Decis. 2019, 35, 113–117. [Google Scholar] [CrossRef]
  27. Yang, R.F.; Yang, C. The high-quality development measurement of the Yangtze River Economic Belt and the Ecolution of time and space. J. Cent. China Norm. Univ. (Nat. Sci.) 2019, 53, 631–642. [Google Scholar] [CrossRef]
  28. Li, J.C.; Shi, L.M.; Xu, A.T. Probe into the Assessment Indicator System on High-quality Development. Stat. Res. 2019, 36, 4–14. [Google Scholar] [CrossRef]
  29. Zhao, D.Y.; Qiu, L.; Xu, W.Q. Measurement Model and Result Analysis of High Quality Development Index of Chinese Provinces, Districts and Municipalities. Mark. Res. 2018, 11, 15–26. [Google Scholar] [CrossRef]
  30. Fang, D.C.; Ma, W.B. Study on the Measurement of China’s Inter-Provincial High-Quality Development and Its Spatial-Temporal Characteristics. Reg. Econ. Rev. 2019, 2, 61–70. [Google Scholar] [CrossRef]
  31. Li, M.X.; Ren, B.P. Construction, Measurement and Comprehensive Evaluation of China’s High Quality Development Index in the New Era. China Policy Rev. 2019, 5, 49–57. [Google Scholar]
  32. Shi, D.; Li, P. Measurement and International Comparison of China’s High Quality Economic Development. Southeast Acad. Res. 2019, 5, 169–180. [Google Scholar] [CrossRef]
  33. Xu, Y.L.; Wang, H.Y. Construction and demonstration of regional high-quality development indicator system based on “five development concepts”. Stat. Decis. 2020, 36, 98–102. [Google Scholar] [CrossRef]
  34. Ou, J.F.; Xu, C.J.; Liu, Y.Q. The Measurement of High-Quality Development Level from Five Development Concepts: Empirical Analysis of 21 Prefecture-Level Cities in Guangdong Province. Econ. Geogr. 2020, 40, 77–86. [Google Scholar] [CrossRef]
  35. Liao, Z.J.; Wang, L. Urban Sprawl and High-quality Economic Development: The Research of Nighttime Satellite Light Data in China. Financ. Econ. 2019, 06, 106–119. [Google Scholar]
  36. Xu, L.T.; Yao, S.M.; Chen, S.; Xu, Y. Evaluation of Eco-city Under the Concept of High-quality Development: A Case Study of the Yangtze River Delta Urban Agglomeration. Sci. Geogr. Sin. 2019, 39, 1228–1237. [Google Scholar] [CrossRef]
  37. Fan, J.; Wang, Y.F.; Wang, Y.X. High Quality Regional Development Research Based on Geographical Units: Discuss on the Difference in Development Conditions and Priorities of the Yellow River Basin Compared to the Yangtze River Basin. Econ. Geogr. 2020, 40, 1–11. [Google Scholar] [CrossRef]
  38. Jin, F.J.; Chen, M.X. The Evaluation of Regional Policy in Northeast China Since 2003. Econ. Geogr. 2010, 30, 1259–1265. [Google Scholar] [CrossRef]
  39. Chen, Y.Q.; Zhang, P.Y. Study on Agriculture Sustainable Development in Northeast China. Econ. Geogr. 2006, 02, 300–3017. [Google Scholar] [CrossRef]
  40. Zhang, P.Y.; Ma, Y.J.; Liu, W.X.; Chen, Q. New Urbanization Strategy for Revitalizing the Tradianal Industrial Base of Northeast China. Acta Geogr. Sin. 2004, S1, 109–115. [Google Scholar]
  41. An, S.W.; Li, R.P. Strategic Choice of the Northeast Revitalization under the Background of High-quality Development. Reform 2018, 7, 64–74. [Google Scholar]
  42. Wang, W.; Wang, C.J. Evaluation and spatial differentiation of high-quality development in Northeast China. Sci. Geogr. Sin. 2020, 40, 1795–1802. [Google Scholar] [CrossRef]
  43. Wang, C.; Li, X.; Xie, Y.; Chen, P.; Xu, Y. Strategic Path of Revitalization Development of Northeast China under New Era. Bull. Chin. Acad. Sci. 2020, 35, 884–894. [Google Scholar] [CrossRef]
  44. Chen, X.H.; Wei, L.Y.; Zhang, H.F. Spatial and temporal pattern of urban smart development in China and its driving mechanism. Chin. Geogr. Sci. 2018, 28, 584–599. [Google Scholar] [CrossRef] [Green Version]
  45. MA, X.F.; Chen, X.H.; Du, Y.; Zhu, X.; Dai, Y.; Li, X.; Zhang, R.; Wang, Y. Evaluation of Urban Spatial Resilience and Its Influencing Factors: Case Study of the Harbin–Changchun Urban Agglomeration in China. Sustainability 2022, 14, 2899. [Google Scholar] [CrossRef]
  46. Liu, Y.; He, T.; Wang, Y.; Peng, C.; Du, H.; Yuan, S.; Li, P. Analysis and Prediction of Expansion of Central Cities Based on Nighttime Light Data in Hunan Province, China. Sustainability 2021, 13, 11982. [Google Scholar] [CrossRef]
  47. Wang, J.; Liu, H.; Peng, D.; Lv, Q.; Sun, Y.; Huang, H.; Liu, H. The County-Scale Economic Spatial Pattern and Influencing Factors of Seven Urban Agglomerations in the Yellow River Basin—A Study Based on the Integrated Nighttime Light Data. Sustainability 2021, 13, 4220. [Google Scholar] [CrossRef]
  48. Zhao, L.L.; Meng, F.; Ma, C.X. The Analysis on Spatial Distribution and Evolution of the Population in Wuhan City Based on Multi-source Remote Sensing Data. Areal Res. Dev. 2016, 35, 165–169. [Google Scholar]
  49. Zhuo, L.; Ichinose, T.; Zheng, J.; Chen, J.; Shi, P.J.; Li, X. Modelling the Population Density of China at the Pixel Level Based on DMSP / OLS Non-radiance-calibrated Night-time Light Images. Int. J. Remote Sens. 2009, 30, 1003–1018. [Google Scholar] [CrossRef]
  50. MA, T.; Zhou, Y.K.; Wang, Y.J.; Zhou, C.; Haynie, S.; Xu, T. Diverse Relation-ships between Suomi- NPP VIIRS Night-time Light and Multi-scale Socioeconomic Activity. Remote Sens. Lett. 2014, 5, 652–661. [Google Scholar] [CrossRef]
  51. Lo, C.P. Modeling the Population of China Using DMSP Operational Linescan System Nighttime Data. Photogramm. Eng. Remote Sens. 2001, 67, 1037–1048. [Google Scholar] [CrossRef]
  52. Levin, N. High Spatial Resolution Analysis of Night Lights as an Indicator of Spatial Inequalities. Remote Sens. Environ. 2012, 119, 1–10. [Google Scholar] [CrossRef]
  53. Li, X.; Xu, H.M.; Chen, X.L.; Li, C. Potential of NPP-VIIRS Nighttime Light Imagery for Modeling the Regional Economy of China. Remote Sens. 2013, 5, 3057–3081. [Google Scholar] [CrossRef] [Green Version]
  54. Zhao, M.; Zhou, Y.; Li, X.; Cheng, W.; Zhou, C.; Ma, T.; Li, M.; Huang, K. Mapping Urban Dynamics (1992–2018) in Southeast Asia Using Consistent Nighttime Light Data from DMSP and VIIRS. Remote Sens. Environ. 2020, 248, 111980. [Google Scholar] [CrossRef]
  55. Zhao, M.; Zhou, Y.; Li, X.; Zhou, C.; Cheng, W.; Li, M.; Huang, K. Building a Series of Consistent Night-Time Light Data (1992-2018) in Southeast Asia by Integraing DMSP-OLS and NPP-VIIRS. IEEE Trans. Geosci. Remote Sens. 2019, 99, 1–14. [Google Scholar] [CrossRef]
  56. Zheng, Q.; Weng, Q.; Wang, K. Developing a New Cross-sensor Calibration Model for DMSP-OLS and Suomi-NPP VIIRS Night-light Imageries. ISPRS J. Photogramm. Remote Sens. 2019, 153, 36–47. [Google Scholar] [CrossRef]
  57. Lu, D.; Wang, Y.; Yang, Q.; Su, K.; Zhang, H.; Li, Y. Modeling Spatiotemporal Population Changes by Integrating DMSP-OLS and NPP-VIIRS Nighttime Light Data in Chongqing, China. Remote Sens. 2021, 13, 284. [Google Scholar] [CrossRef]
  58. Wang, S.J.; Ma, L. Strategic thinking of Northeast China revitalization during the “14th Five-Year Plan” based on the macro situation and regional advantages. Sci. Gographica Sin. 2021, 41, 1935–1946. [Google Scholar] [CrossRef]
  59. Wang, Y.; Liu, H.; Chen, X.H.; Song, Y.T. Evolution Characteristics and Division of Regional Types of Correlation Coupling of Urban-Rural Systems: A Case Study of the Three Provinces of Northeast China. Sci. Geogr. Sin. 2020, 40, 1150–1159. [Google Scholar] [CrossRef]
  60. Guo, F.Y.; Hou, A.L.; Tong, L.J.; Ma, Z.X. Spatio-Temporal Pattern and Influencing Factors of Green Development in the Northeast Restricted Development Zone since the Revitalization of the Northeast China. Econ. Geogr. 2018, 38, 58–66. [Google Scholar] [CrossRef]
  61. Chen, C.; Wang, S.J. A Study on the Geopolitical Strategy of Northeast Economical Zone. Northeast. Asia Forum 2001, 03, 03–05. [Google Scholar] [CrossRef]
  62. Zhuo, L.; Zhang, X.F.; Zheng, J.; Tao, H.Y.; Guo, Y.B. An EVI-based method to reduce saturation of DMSP/OLS nighttime light data. Acta Geogr. Sin. 2015, 70, 1339–1350. [Google Scholar] [CrossRef]
  63. Hu, Y.F.; Zhao, G.H.; Zhang, Q.L. Spatial Distribution of Population Data Based on Nighttime Light and LUC Data in the Sichuan-Chongqing Region. J. Geo-Inf. Sci. 2018, 20, 68–78. [Google Scholar] [CrossRef]
  64. Miao, Y.; Su, X.B.; Song, J.P.; Hua, X.B. Study on the Processes and Characteristics of Urban Expansion in Ruili and Wanding Port Areas. Geogr. Res. 2021, 40, 1716–1731. [Google Scholar] [CrossRef]
  65. Kyba, C.; Garz, S.; Kuechly, H.; De Miguel, A.S.; Zamorano, J.; Fischer, J.; Hölker, F. High-resolution Imagery of Earth at Night: New Sources, Opportunities and Challenges. Remote Sens. 2014, 7, 1–23. [Google Scholar] [CrossRef] [Green Version]
  66. National Bureau of Statistics of China. National Bureau of Statistics of China, 1991–2019. China City Statistical Yearbook; China Statistics Press: Beijing, China, 2019.
  67. Shi, K.F.; Yu, B.L.; Huang, Y.X.; Hu, Y.; Yin, B.; Chen, Z.; Chen, L.; Wu, J. Evaluating the Ability of NPP-VIIRS Nighttime Light Data to Estimate the Gross Domestic Product and the Electric Power Consumption of China at Multiple Scales: A Comparison with DMSP—OLS Data. Remote Sens. 2014, 6, 1705–1724. [Google Scholar] [CrossRef] [Green Version]
  68. Ma, R.H.; Gu, C.L.; Pu, Y.X. Urban Spatial Sprawl Pattern and Metrics in South of Jiangsu Province along the Yangtze River. Acta Geogr. Sin. 2007, 10, 1011–1022. [Google Scholar] [CrossRef]
  69. Huang, B.; Wu, B.; Barry, M. Geographically and Temporally Weighted Regression for Modeling Spatio-temporal Variation in House Prices. Int. J. Geogr. Inf. Sci. 2010, 24, 383–401. [Google Scholar] [CrossRef]
  70. Yao, S.M.; Zhang, P.Y.; Yu, C.; Li, G.Y.; Wang, C.X. The Theory and Practice of New Urbanization in China. Sci. Geogr. Sin. 2014, 34, 641–647. [Google Scholar] [CrossRef]
  71. Zhang, Y.J.; Jin, H.; Gu, H. The Economic Spatial Pattern Evolution Based on ESDA-GER Multiple Variables Effect-The Yangtze River Middle Reaches Urban Agglomerations as an Example. Econ. Geogr. 2015, 35, 28–35. [Google Scholar] [CrossRef]
Figure 1. Location of Northeast China.
Sustainability 14 15668 g001
Figure 2. Spatial quality of Northeast China from 1992 to 2018.
Sustainability 14 15668 g002
Figure 3. Distribution of spatial quality in Northeast China from 1992 to 2018. Using the Jenks natural breakpoint method to process the data from the 1992, 1997, 2002, 2007, 2012, and 2018. DN value reflects the spatial quality.
Sustainability 14 15668 g003
Figure 4. Spatial quality hotspots in Northeast China from 1992 to 2018. Using the Getis-Ord General G i * in ArcGIS10.2 to obtain the distribution of cold and hot spots of spatial quality.
Sustainability 14 15668 g004
Figure 5. Factors influencing spatial and temporal evolution of spatial quality in Northeast China from 1992 to 2018. The Factors factors from F1 to F5 corre-spond to the impact of infrastructure, urban development, rural revitalization, residents’ quality of life, and government promotion, respectively. Using GTWR model to obtain the factors influencing the spatial and temporal evolution of spatial quality in Northeast China from 1992 to 2018.
Sustainability 14 15668 g005
Table 1. Evaluation index system of Spatial Quality in Northeast China.
First Level
Index
Second Level IndexBasic IndexUnit of
Measurement
Spatial QualityInnovationProportion of the value of tertiary industry growth in GDP%
Number of practitioners of scientific research and technical servicesTen thousand people
Expenditure on science and technologyTen thousand CNY
CoordinationUrban-Rural Coordination-
GreennessComprehensive utilization rate of industrial solid waste%
Centralized sewage treatment rate%
Harmless treatment rate of domestic waste%
OpennessNumber of foreign direct investment in cooperation projectsnumber
Gross output value of foreign invested enterprisesTen thousand CNY
ShareEducation expendituresTen thousand CNY
Number of practitioners in educationTen thousand people
Table 2. DMSP and VIIRS nighttime light regression model.
Expression EquationLinear Regression ModelR2F
Linear Y = 0.211 + 0.311 X 0.70681.775
Logarithm Y = 5.589 + L n 4.192 X 0.63158.063
Univariate quadratic Y = 0.738 + 0.225 X + 0.002 X 2 0.70940.219
Univariate cubic Y = 2.626 0.21 X + 0.028 X 2 0.00042 X 3 0.71927.285
Exponential Y = 1.313 + 0.068 X 0.54841.265
Table 3. Linear regression model for secondary indicators of spatial quality and nighttime light data.
Development ConceptLinear Regression ModelR2Fp
Innovation Y = 0.640 X 1 + 0.295 X 2 + 0.094 X 3 + 1.315 0.59415.1300.000
Coordination Y = 2.409 X 1 + 2.250 0.57043.7980.000
Greenness Y = 0.037 X 1 + 0.953 X 2 + 0.630 X 3 5.954 0.2653.9680.016
Openness Y = 0.054 X 1 + 0.354 X 2 4.965 0.42111.6130.000
Share Y = 0.255 X 1 + 1.207 X 2 7.907 0.33613.6500.000
Table 4. Moran’s I index of spatial quality in Northeast China from 1992 to 2018.
YearMoran’s I IndexZp
19920.37977.77920.0000
19970.33516.73610.0000
20020.37327.59770.0000
20070.34086.92110.0000
20120.30446.37780.0000
20180.21294.54450.0000
Table 5. Evaluation index system of factors influencing spatial quality in Northeast China.
Primary IndexSecondary IndexBasic IndexUnit of Measurement
Factors influencing spatial qualityInfrastructureNumber of doctors per million people in urban areaPerson
Number of teachers per million people in urban areaPerson
Highway network densitykm/100 km2
Urban developmentTotal urban population
Urban GDP
Urban built-up area
10,000 Person
100 million CNY
km2
Rural vitalizationRural GDP per capitaCNY
Proportion of rural secondary and tertiary industries%
Total power of agricultural machineryMillion kilowatts
Residents’ quality of lifeAverage wage of on-the-job employees in urban areasCNY
Urban consumption per capitaCNY
Government promotionRegional per capita investment in fixed assetsCNY
Rural investment ratio in fixed assets%
Publisher’s Note: MDPI stays neutral with regard to jurisdictional claims in published maps and institutional affiliations.

