
Multi-Response Design Optimisation of a Combined Fluidised Bed-Infrared Dryer for Terebinth (Pistacia atlantica L.) Fruit Drying Process Based on Energy and Exergy Assessments by Applying RSM-CCD Modelling
 ,
,  , ,
, ,  , and
, and 
Abstract
:1. Introduction
2. Materials and Methods
2.1. Terebinth Samples
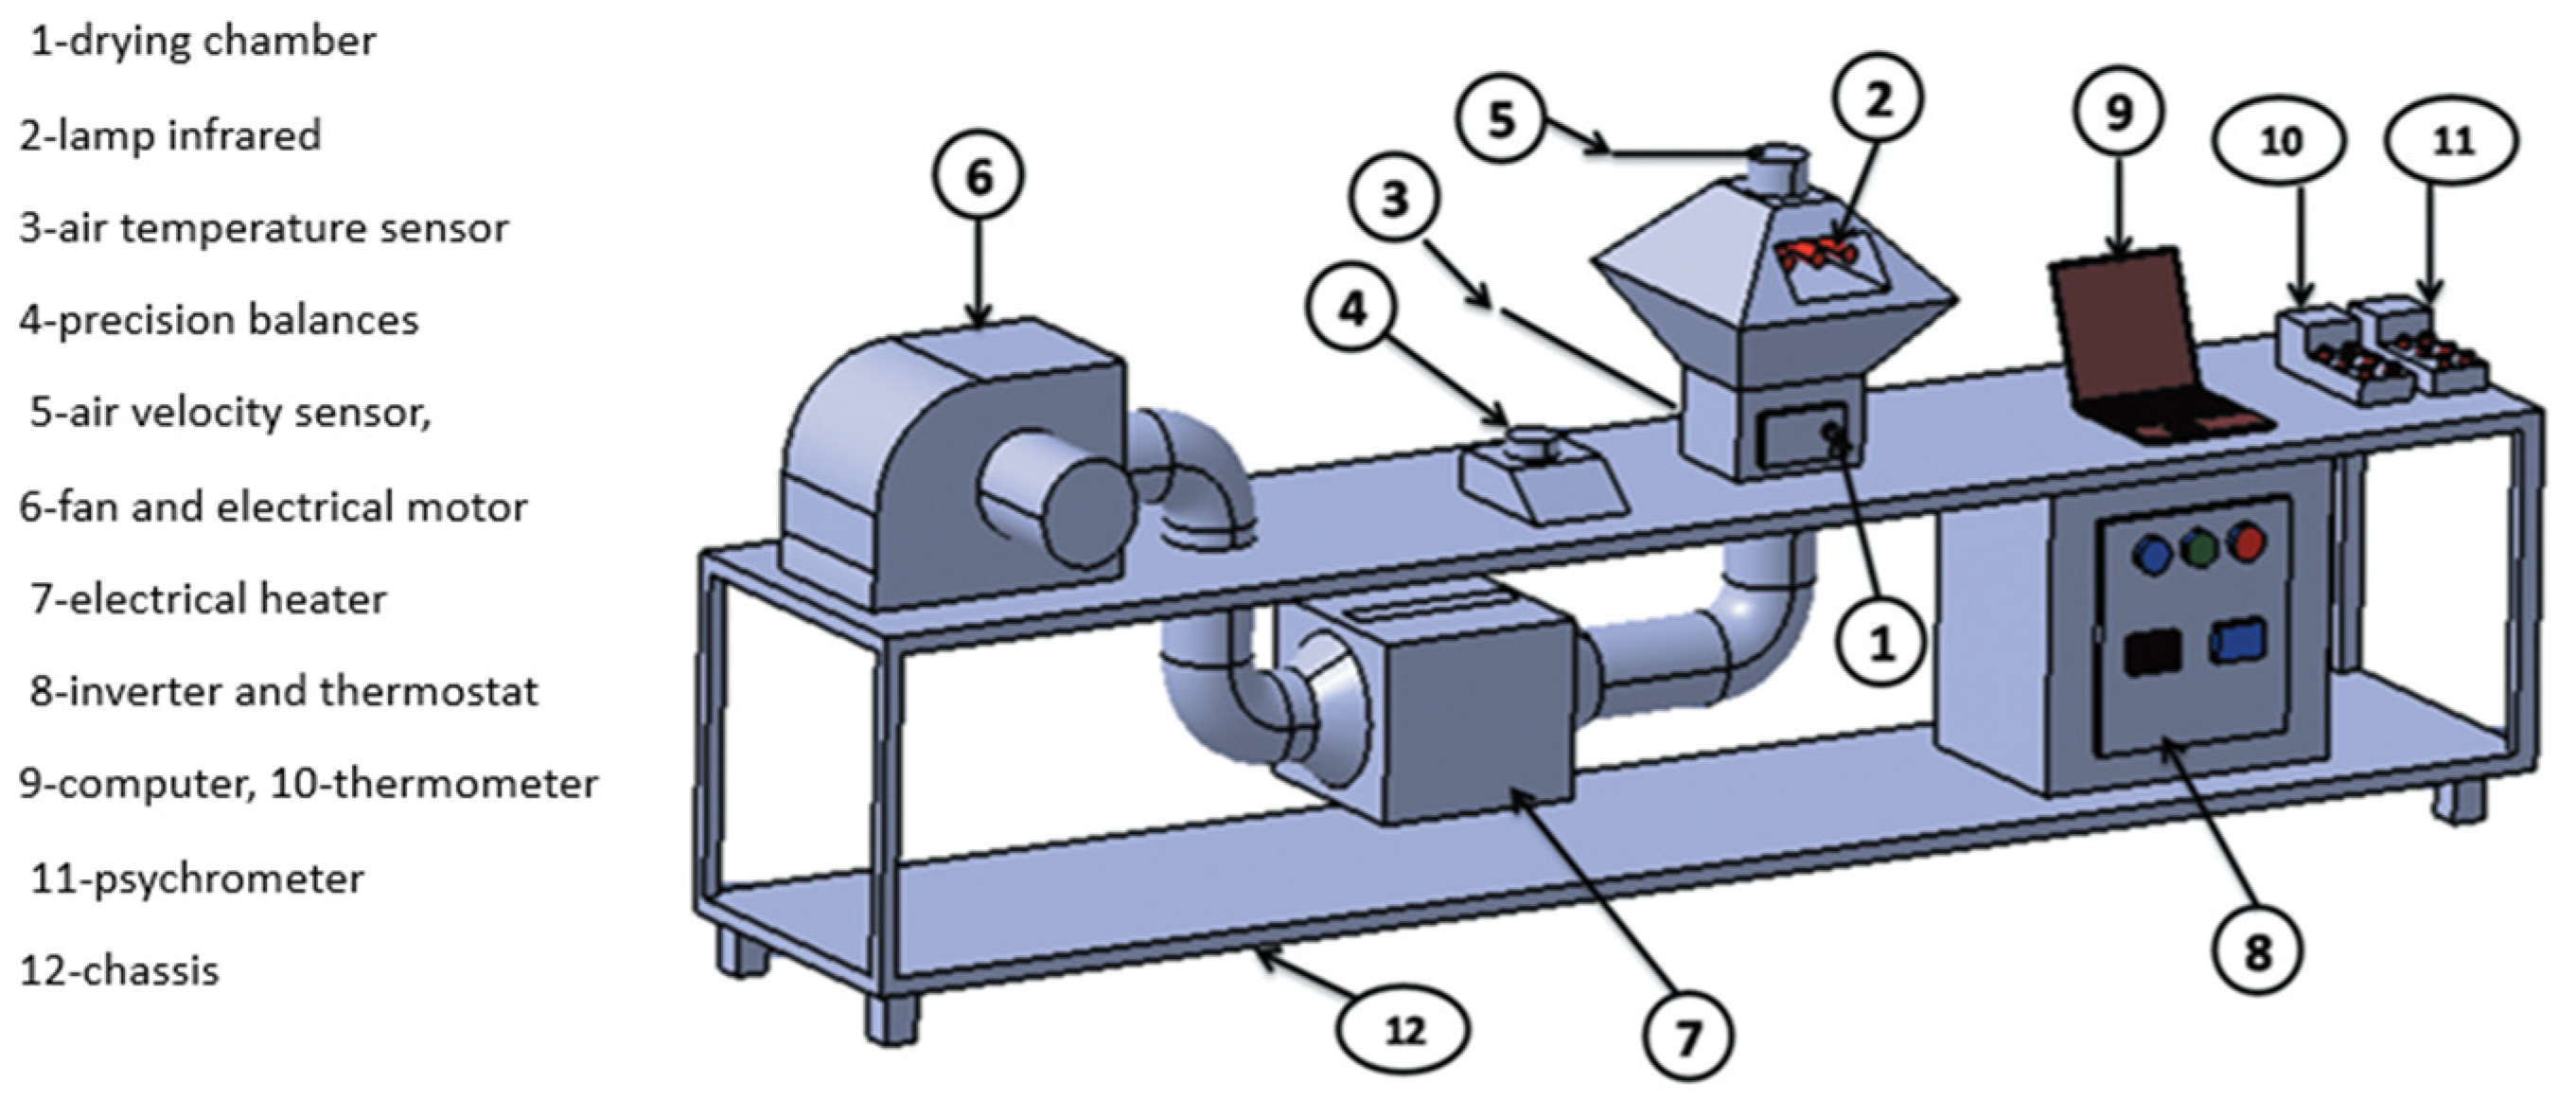
2.2. Equipment Description and Experimental Configuration
2.3. Comprehensive Energy and Exergy Analyses
- The system of the drying process and related main components were supposed to run in steady-state conditions.
- Kinetic and potential energies were considered negligible during the process.
- The temperature gradient available inside the terebinth samples was considered negligible.
- The temperature and the relative humidity of the ambient air during the drying experiments were assumed to be constant.
- The reference state temperature and pressure were 20 °C and 101.325 kPa, respectively.
- The change in the pressure of the inlet and outlet flows of the FBI dryer was considered negligible.
- There was no reaction in the calculation of mass balance.
2.4. Uncertainty Analysis
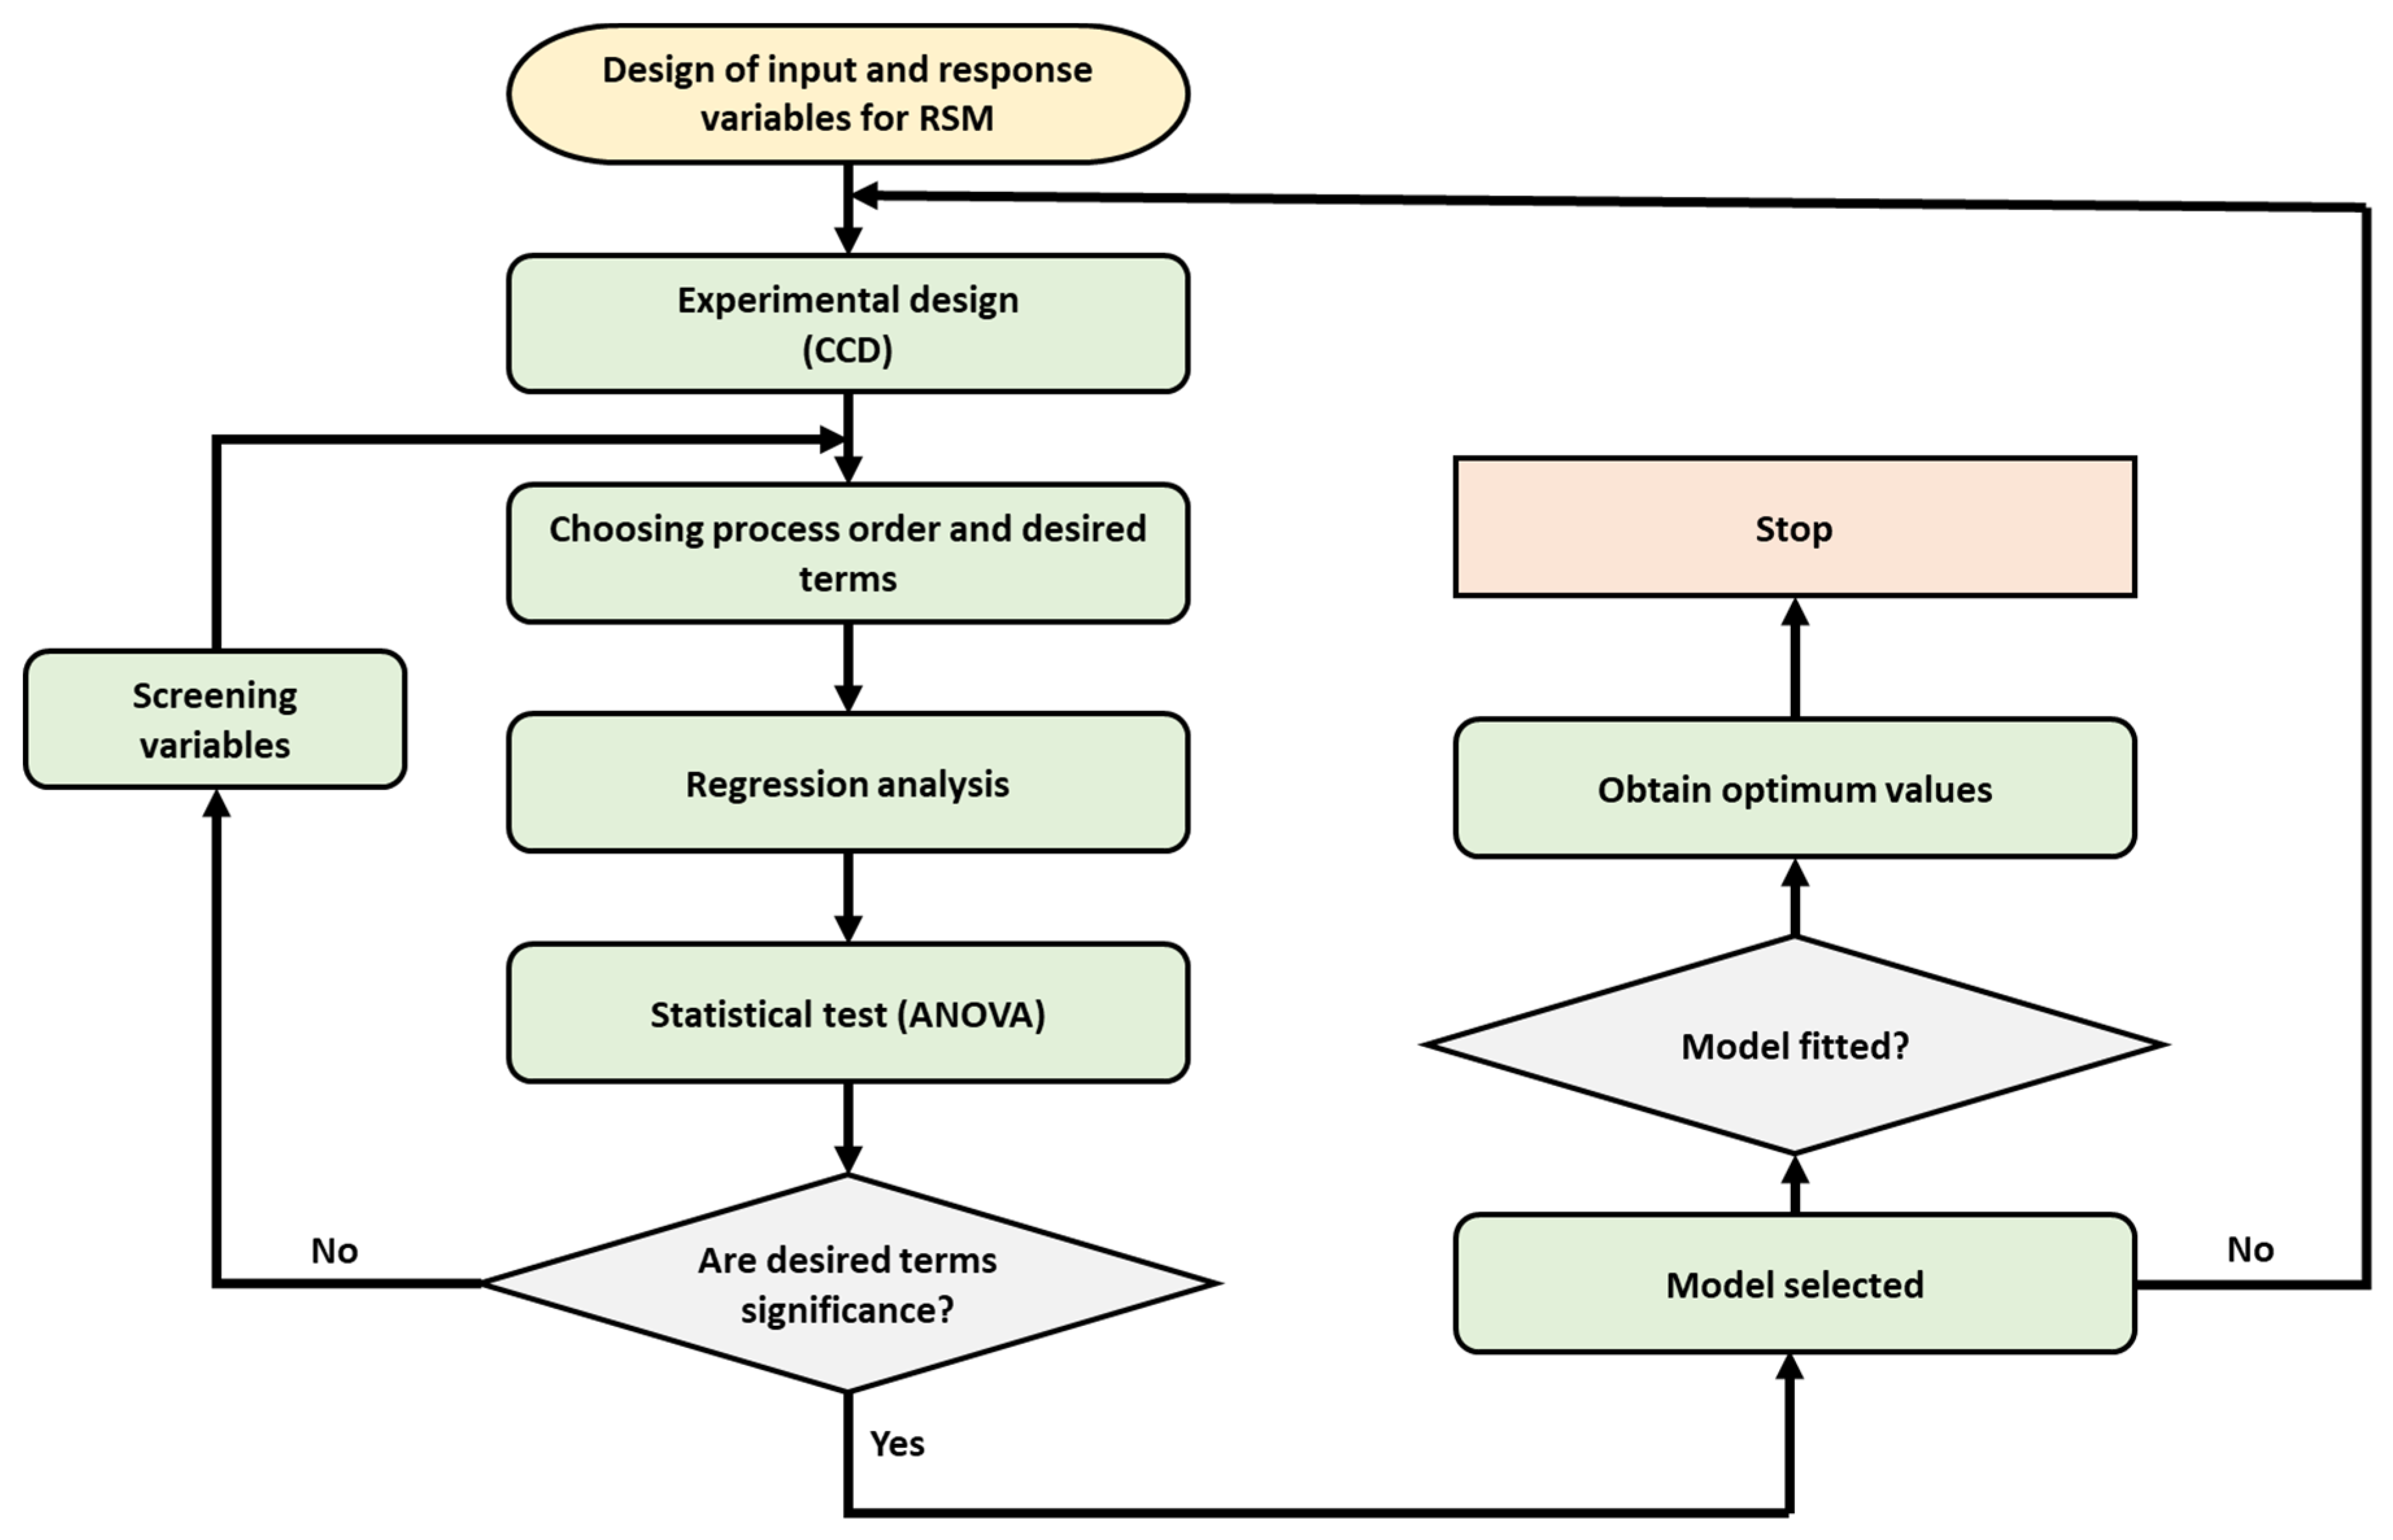
2.5. RSM Modelling
2.5.1. Multivariate Design of Experiment
2.5.2. Model Performance Evaluation
3. Results and Discussion
3.1. Experimental Uncertainty
3.2. Evaluation of EU and EUR
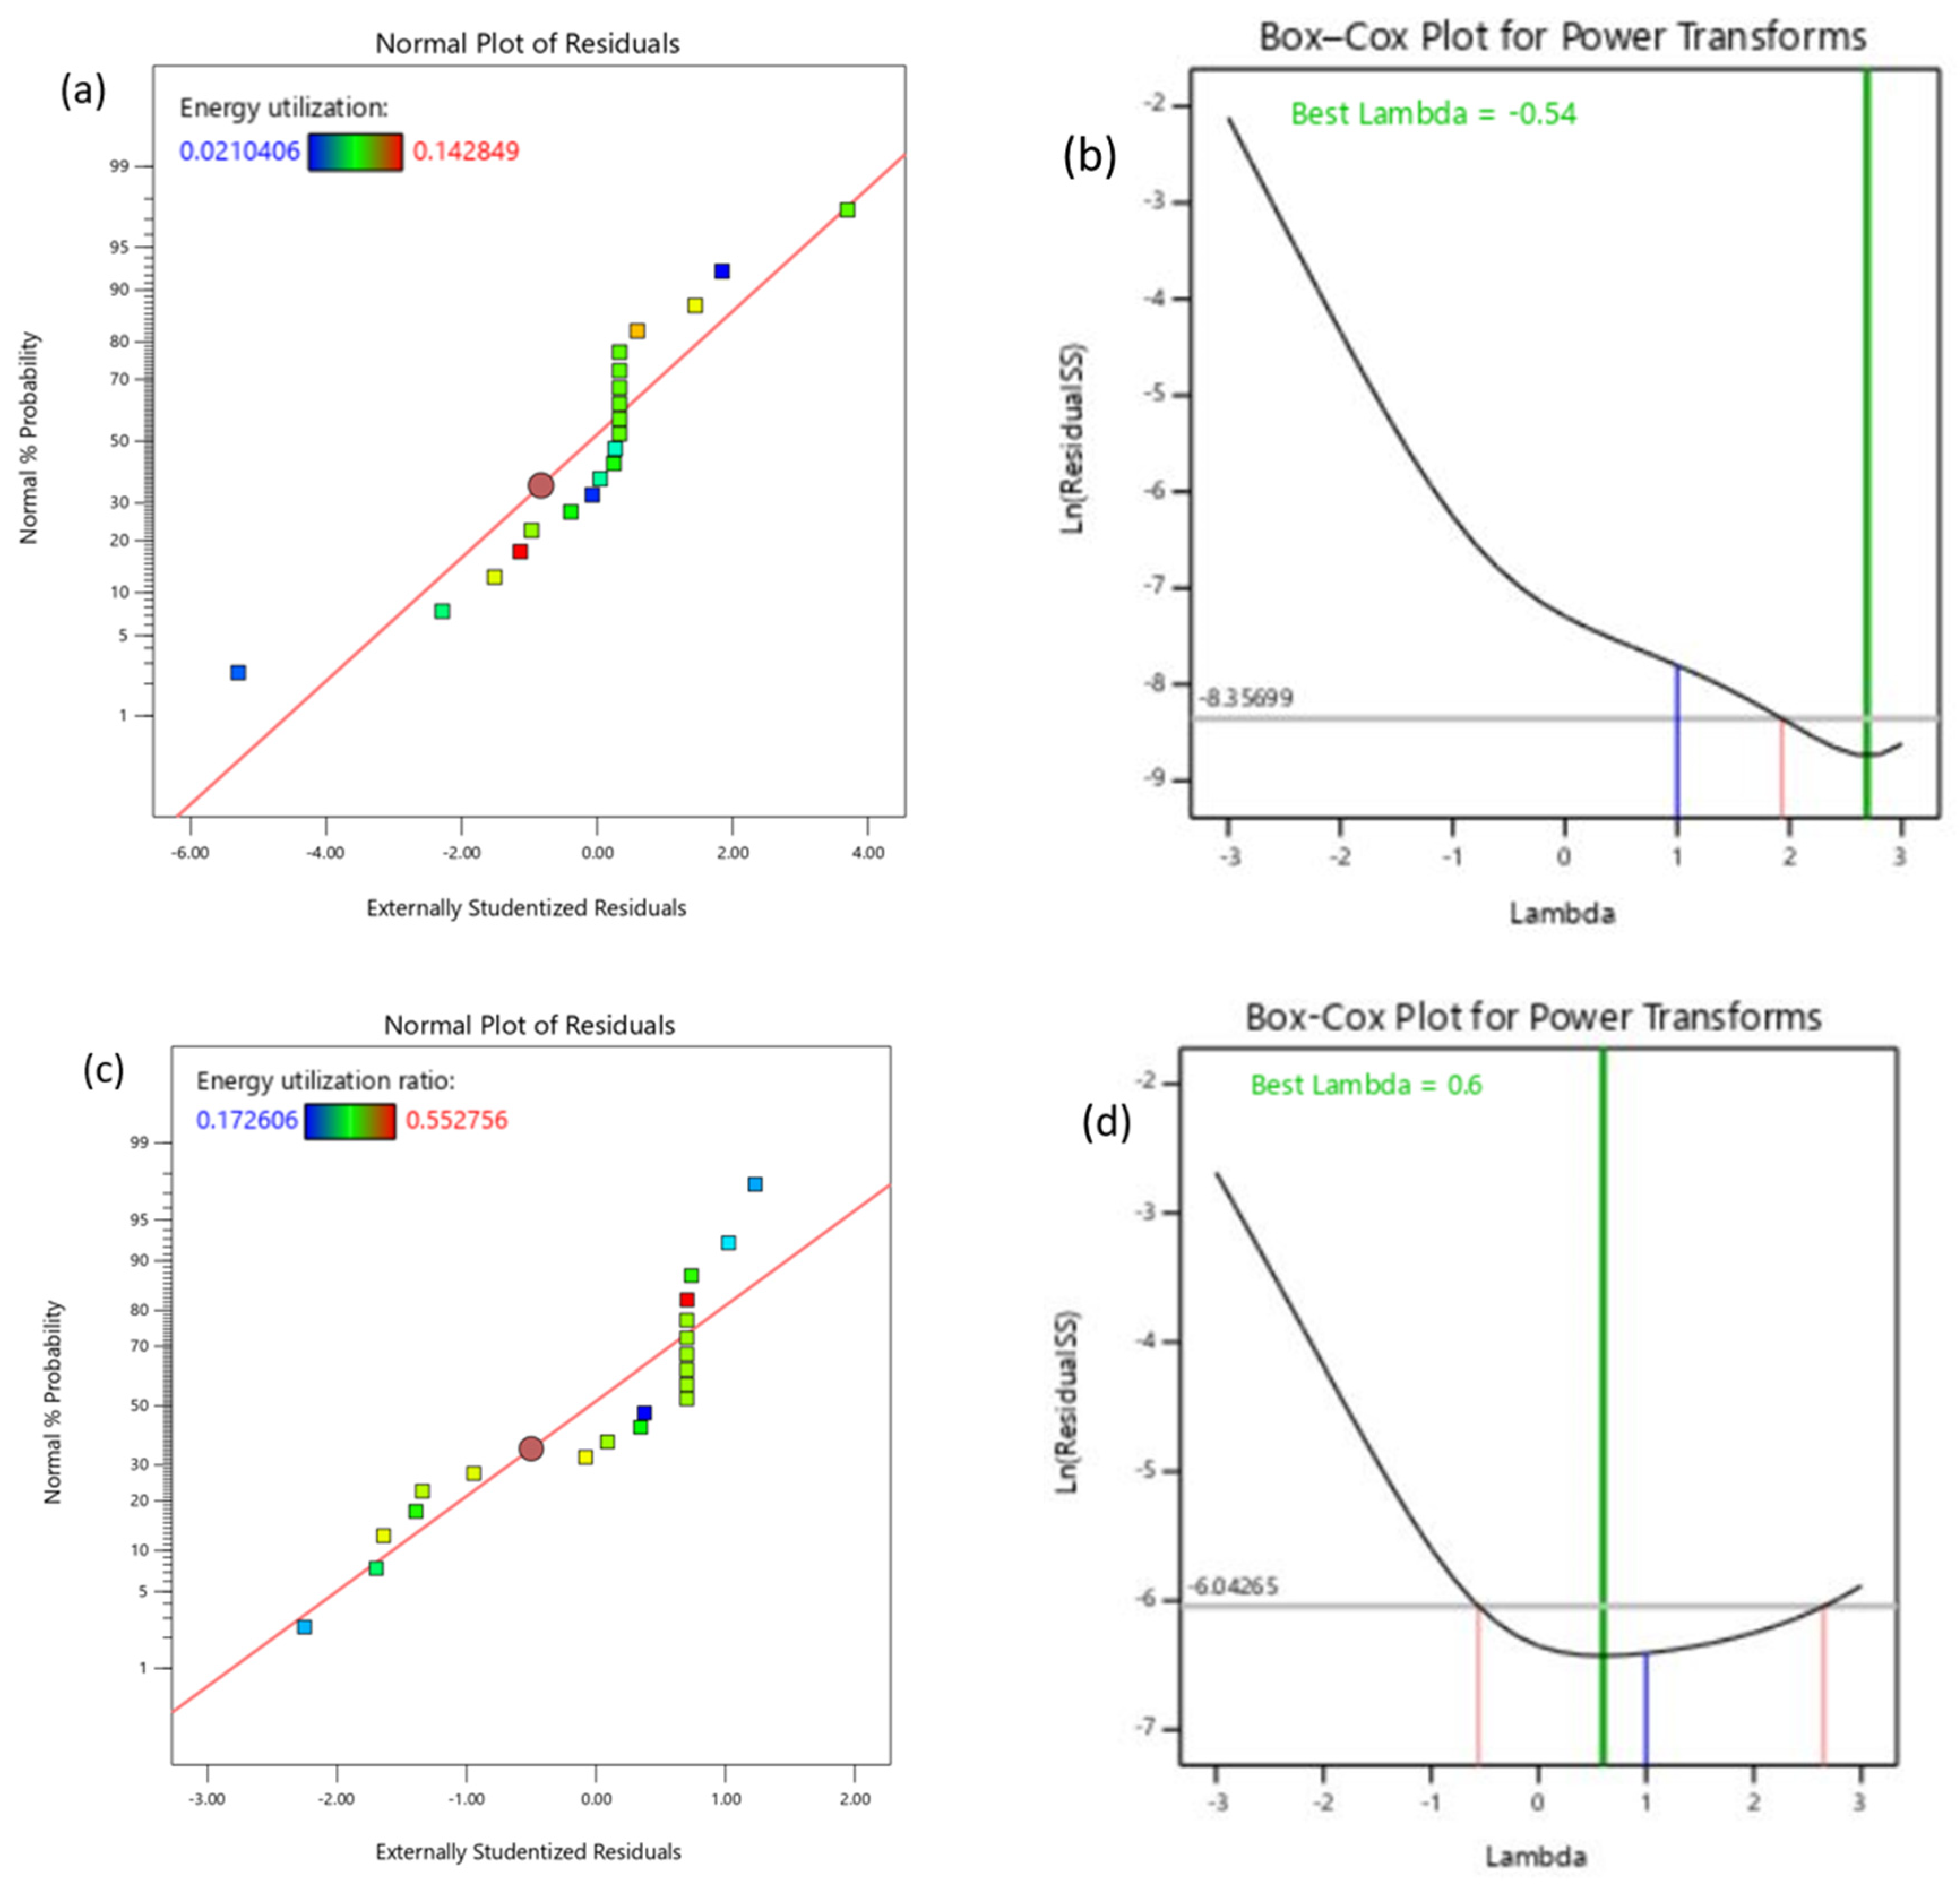
3.2.1. The Model Analysis and Assessment for EU and EUR
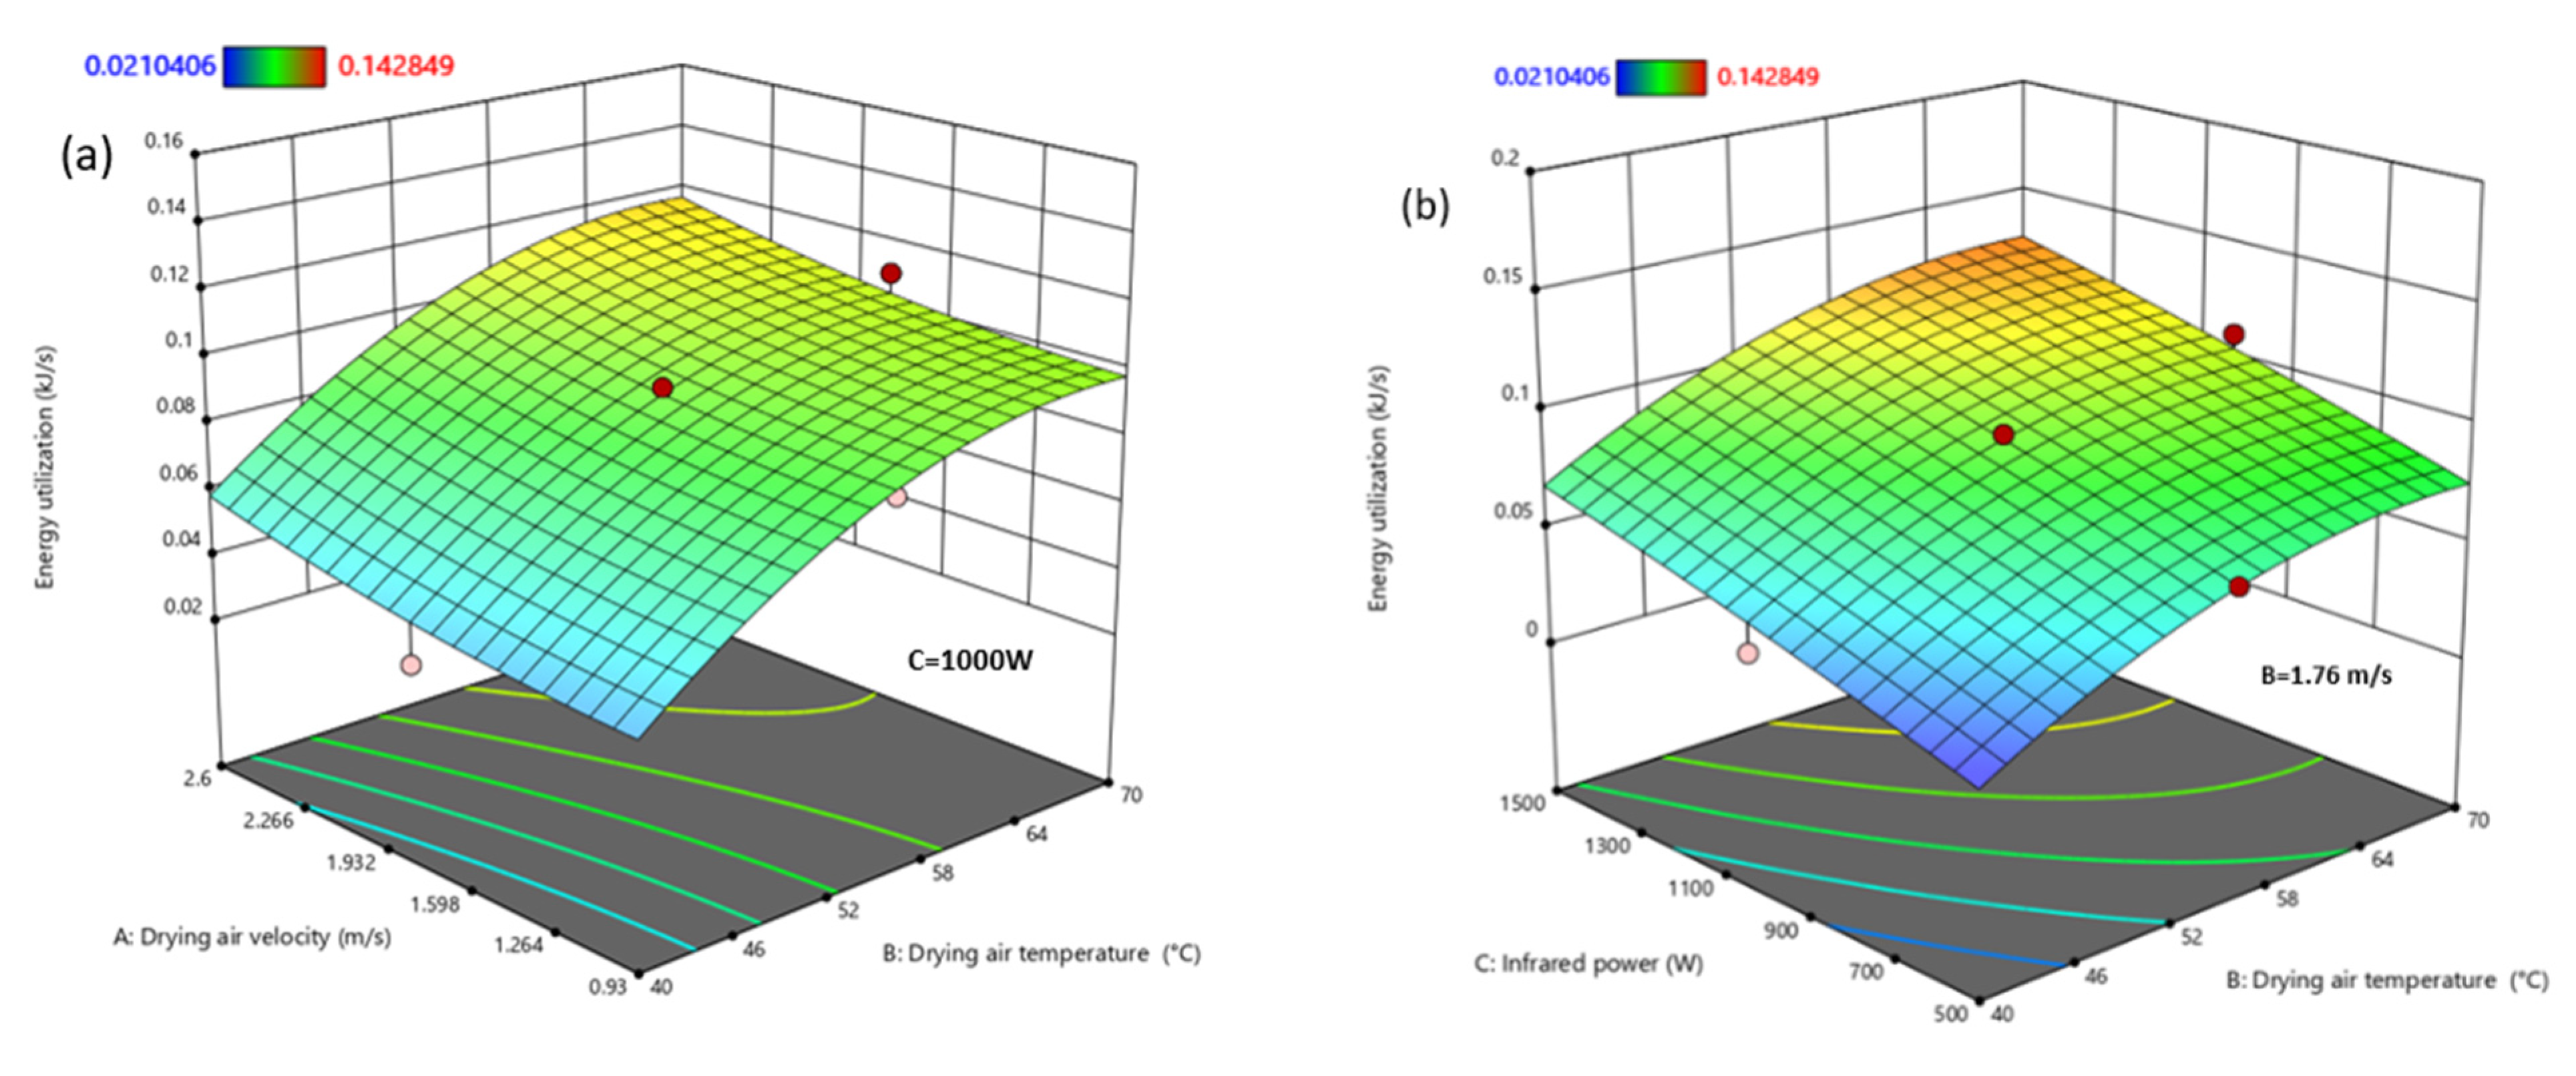
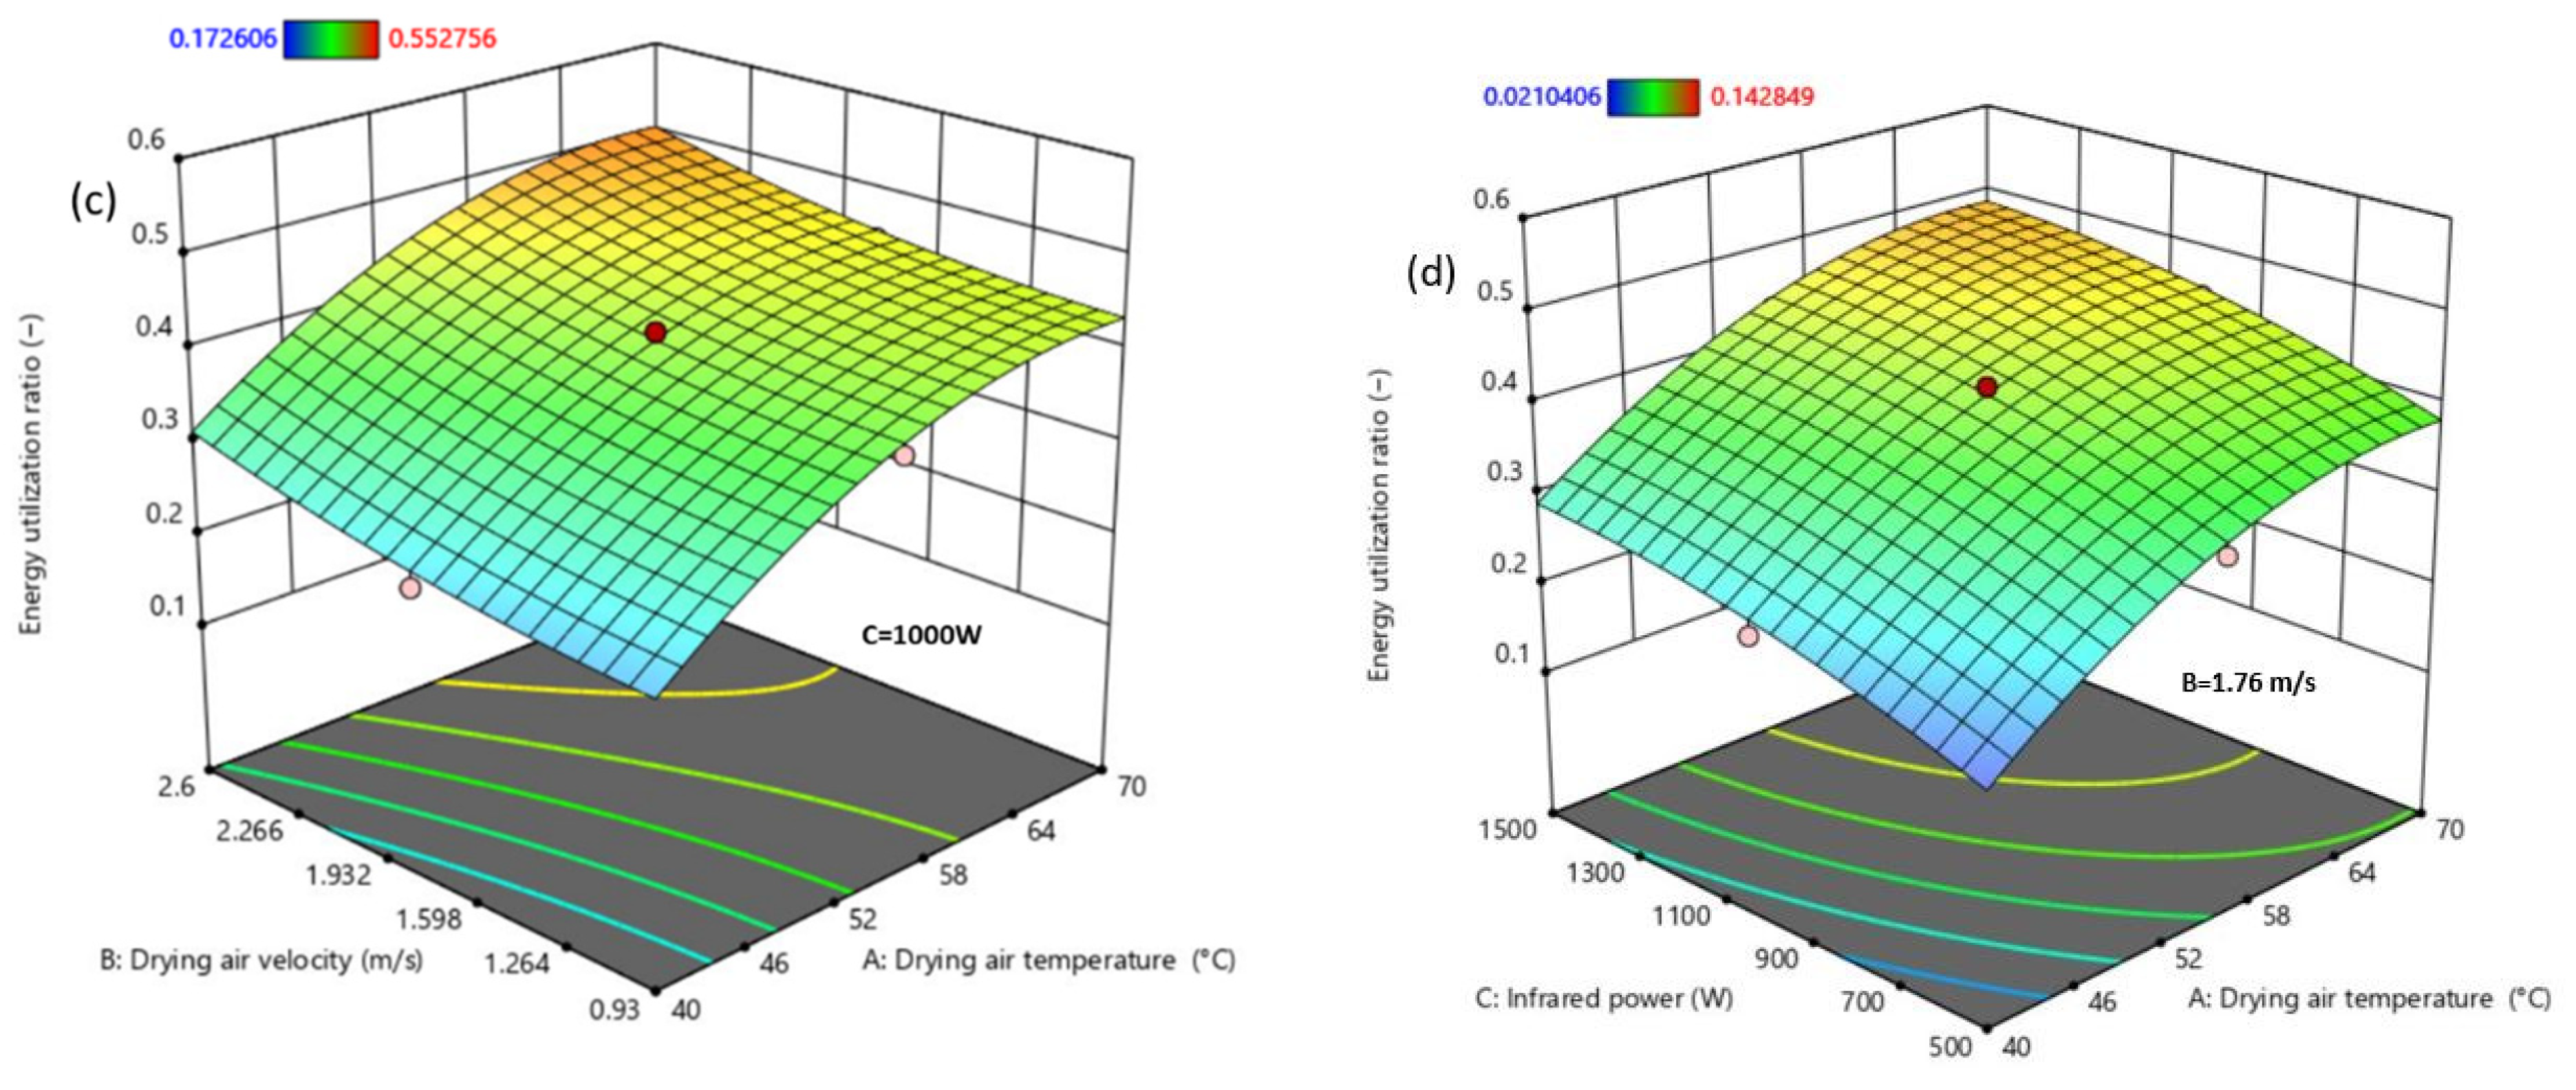
3.2.2. Impact of Drying Conditions on EU and EUR
3.3. Evaluation of EXeff and Exloss
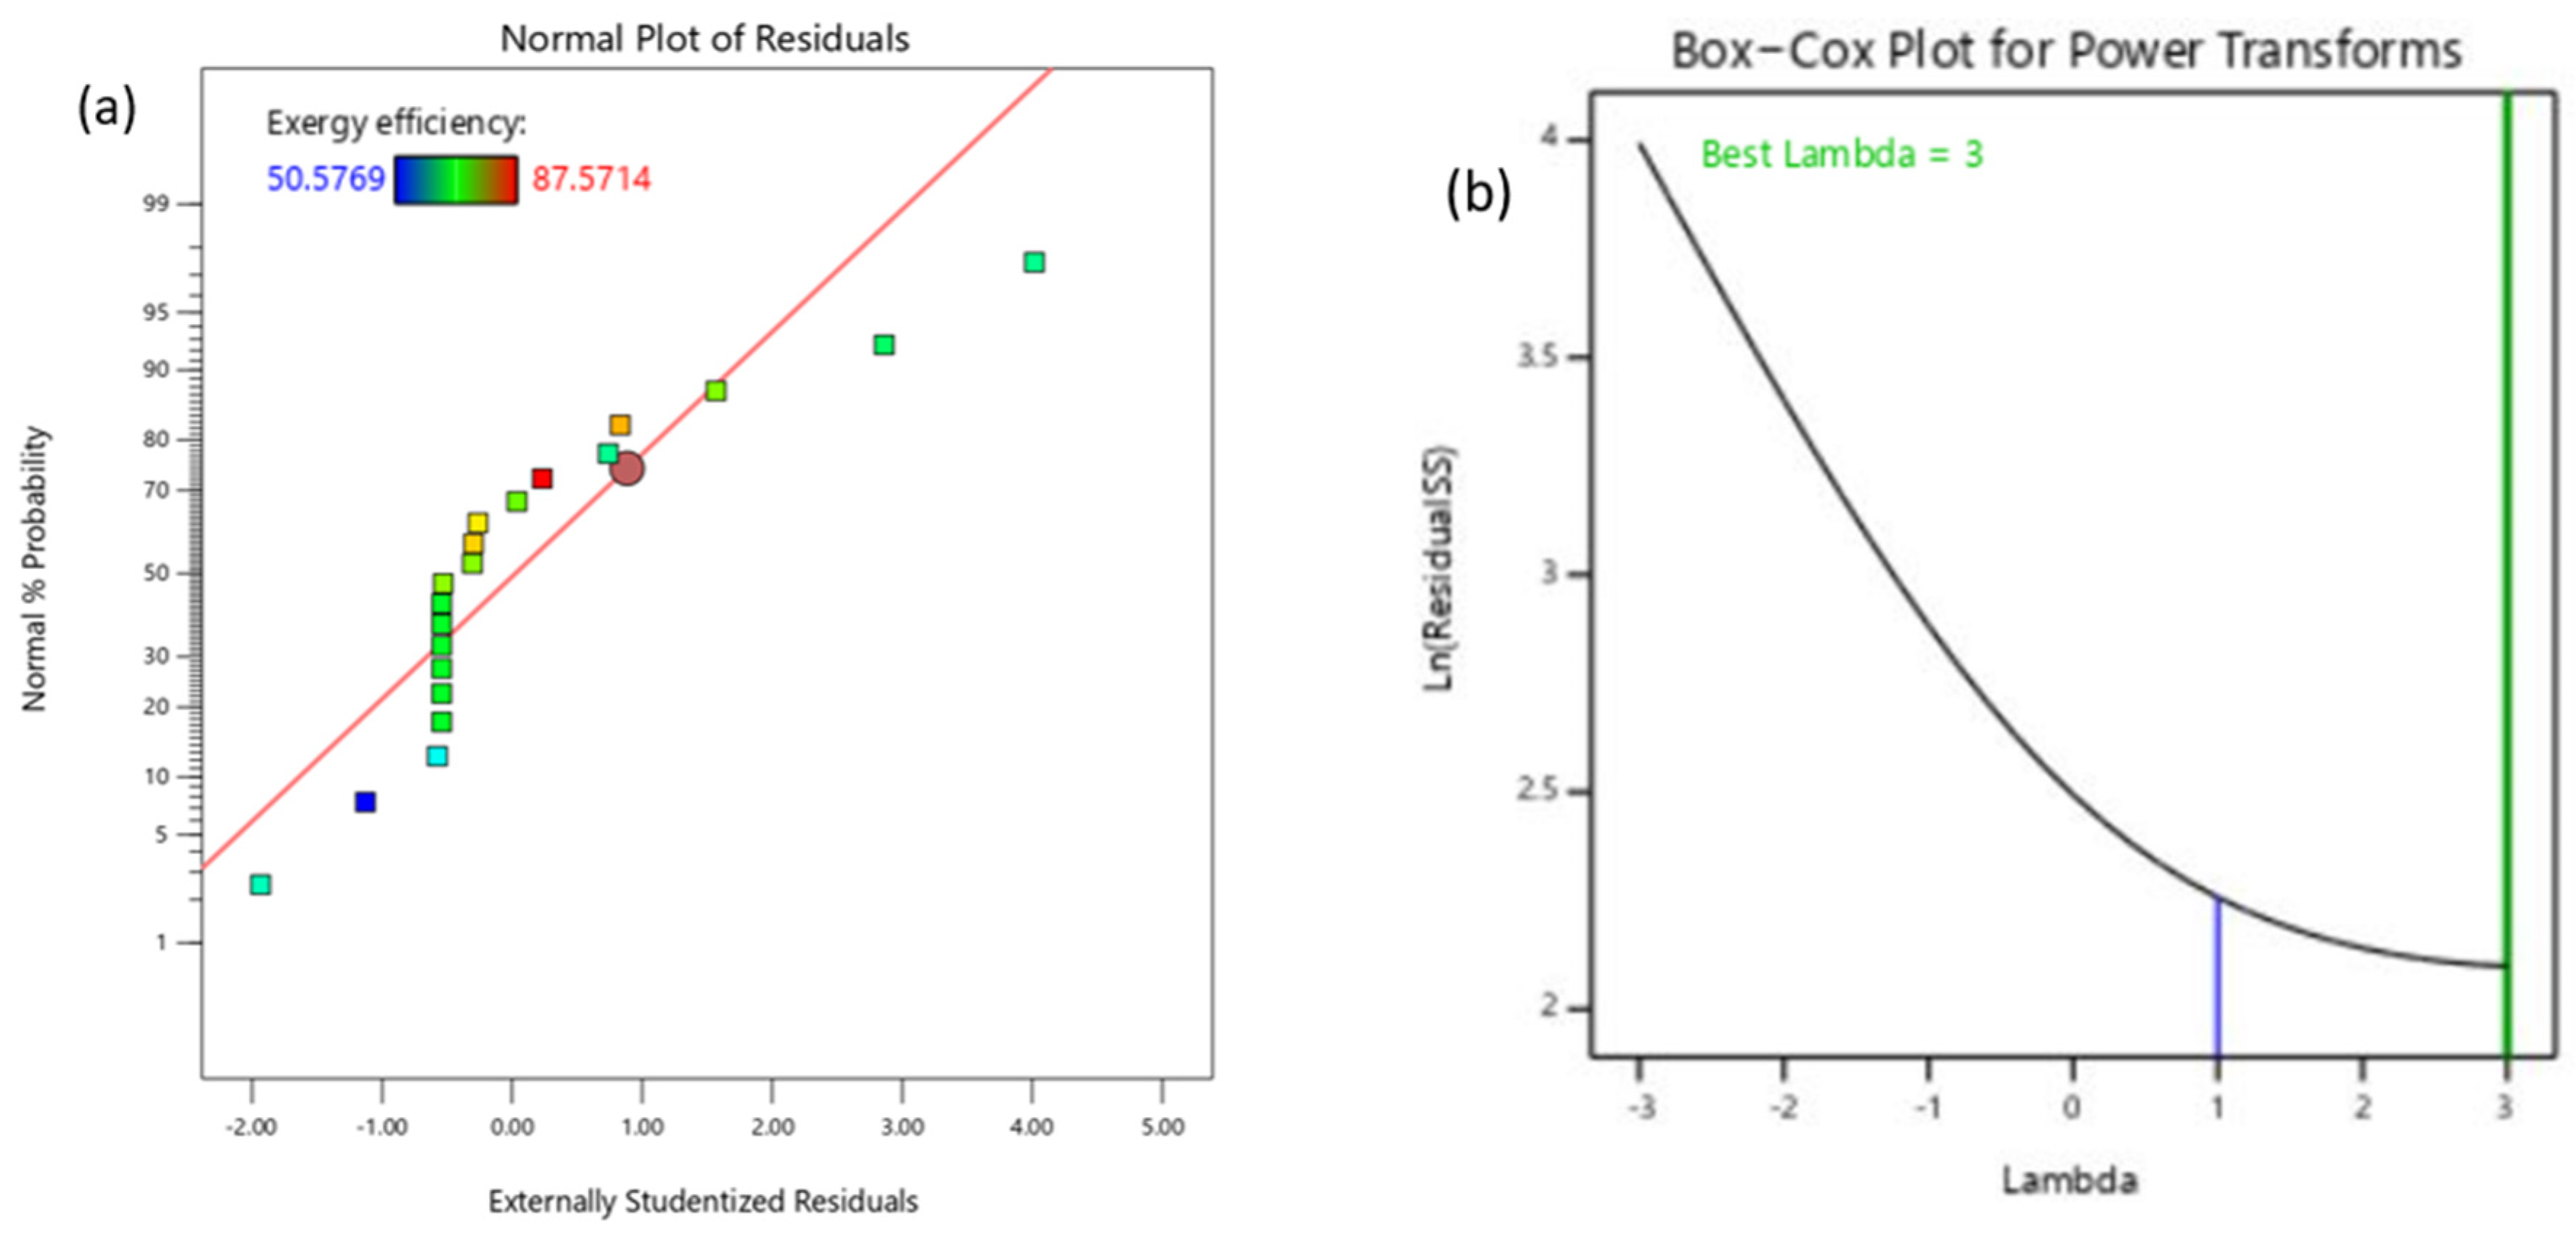
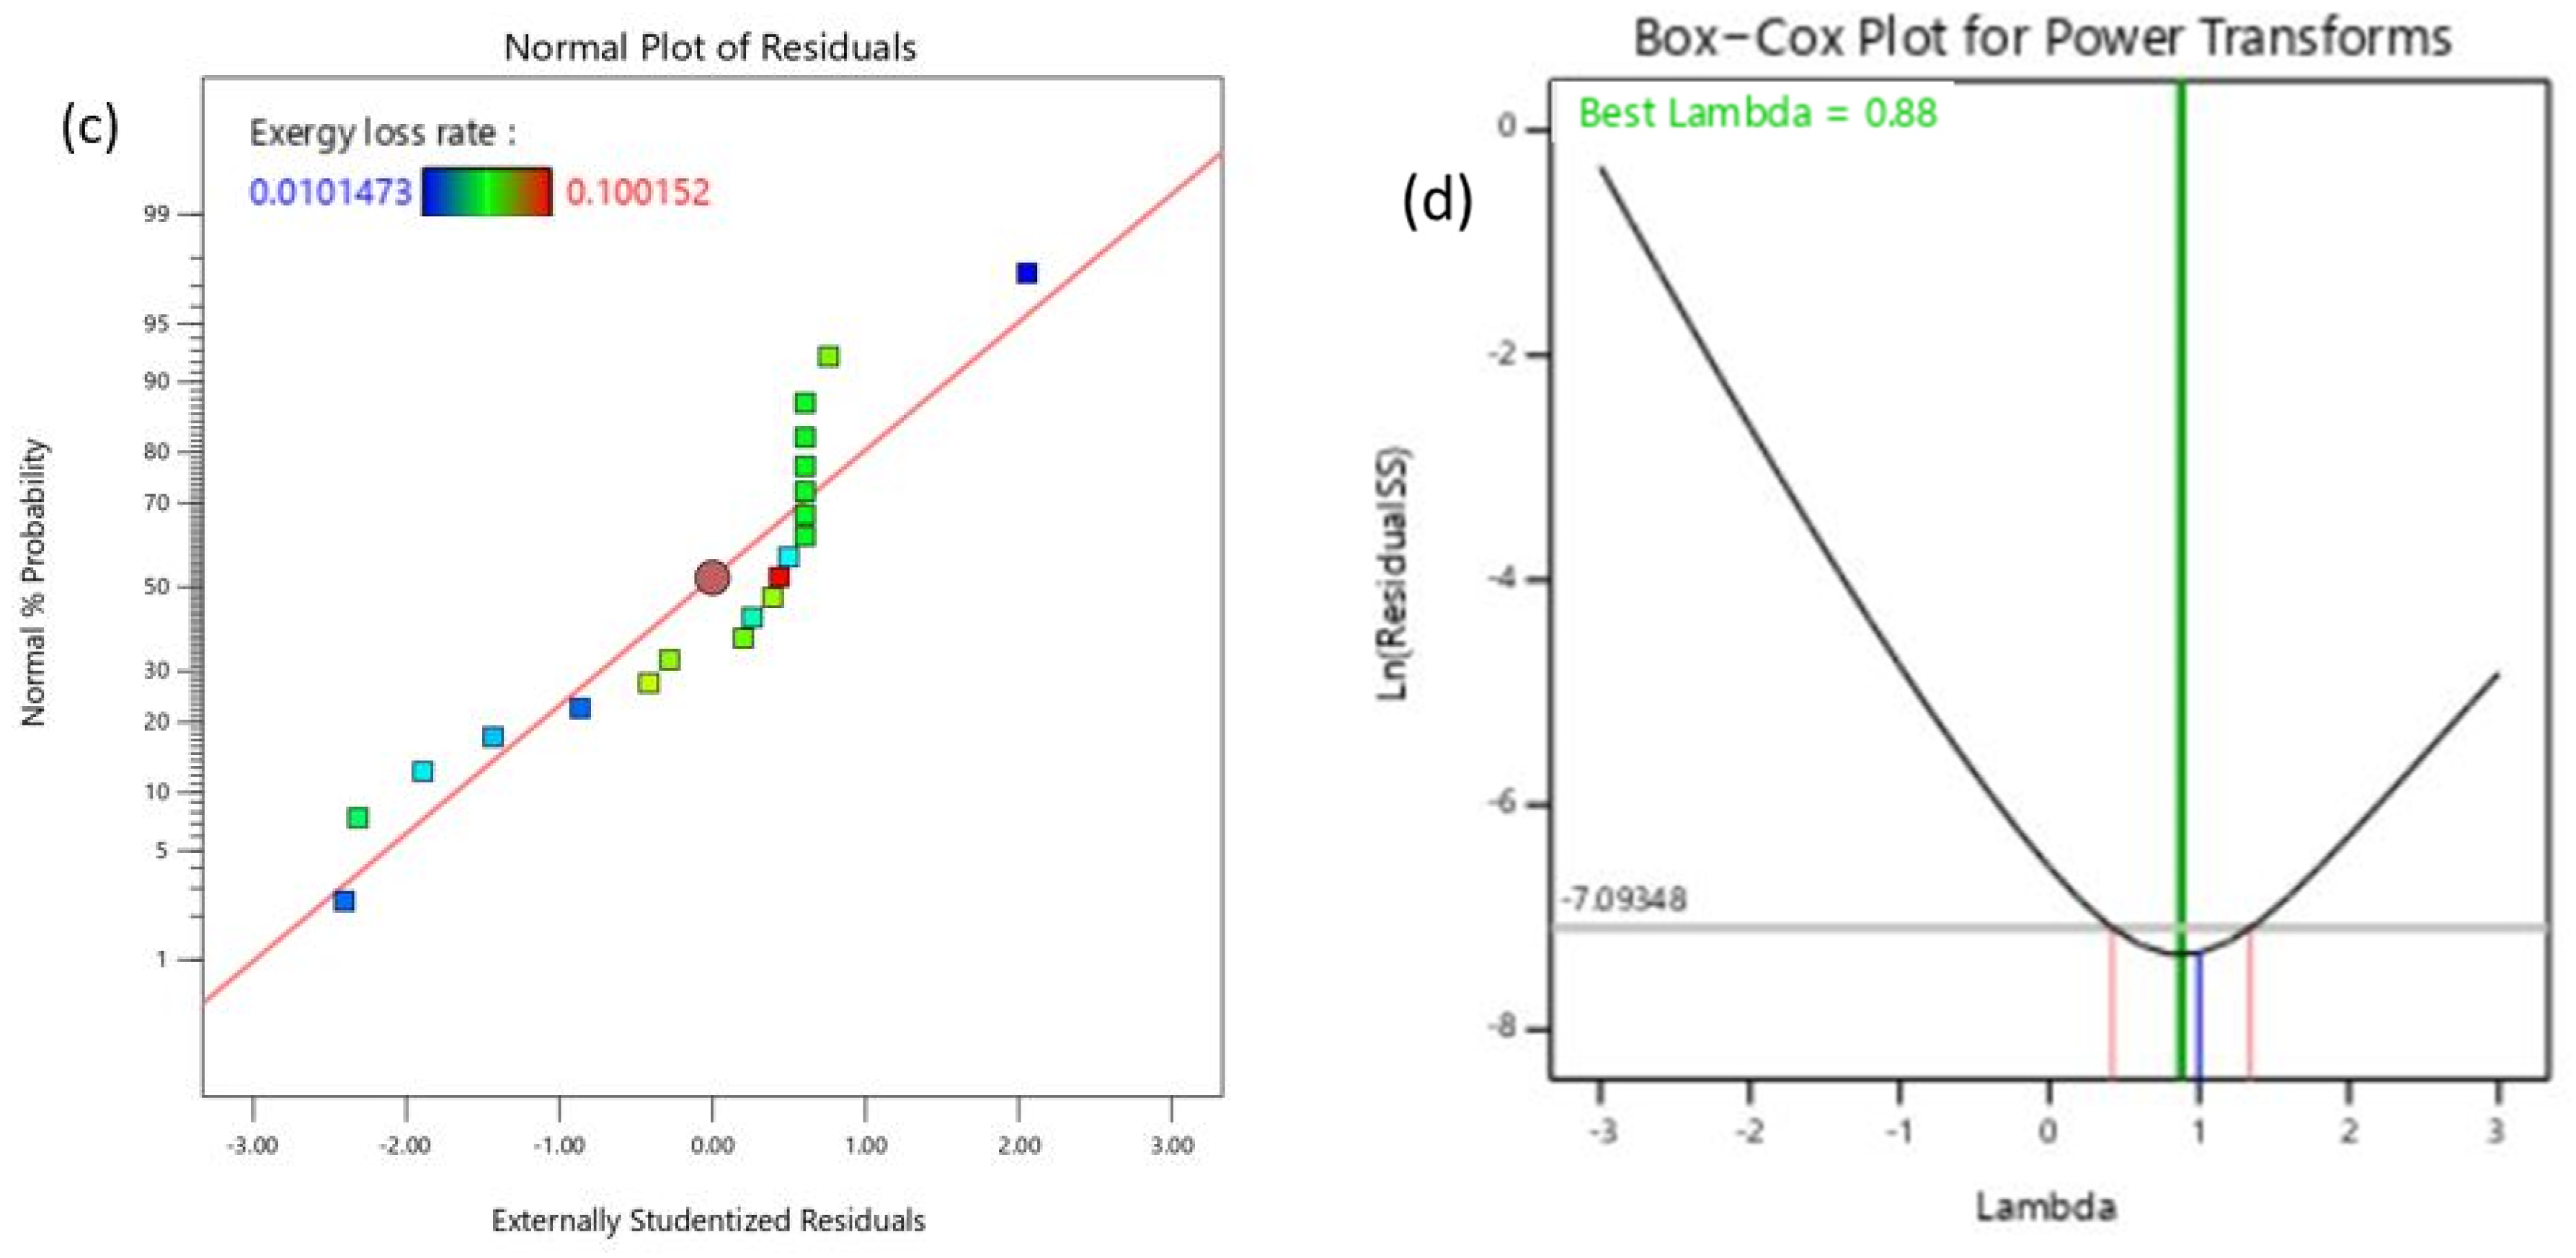
3.3.1. The Model Analysis and Assessment for EXeff and Exloss
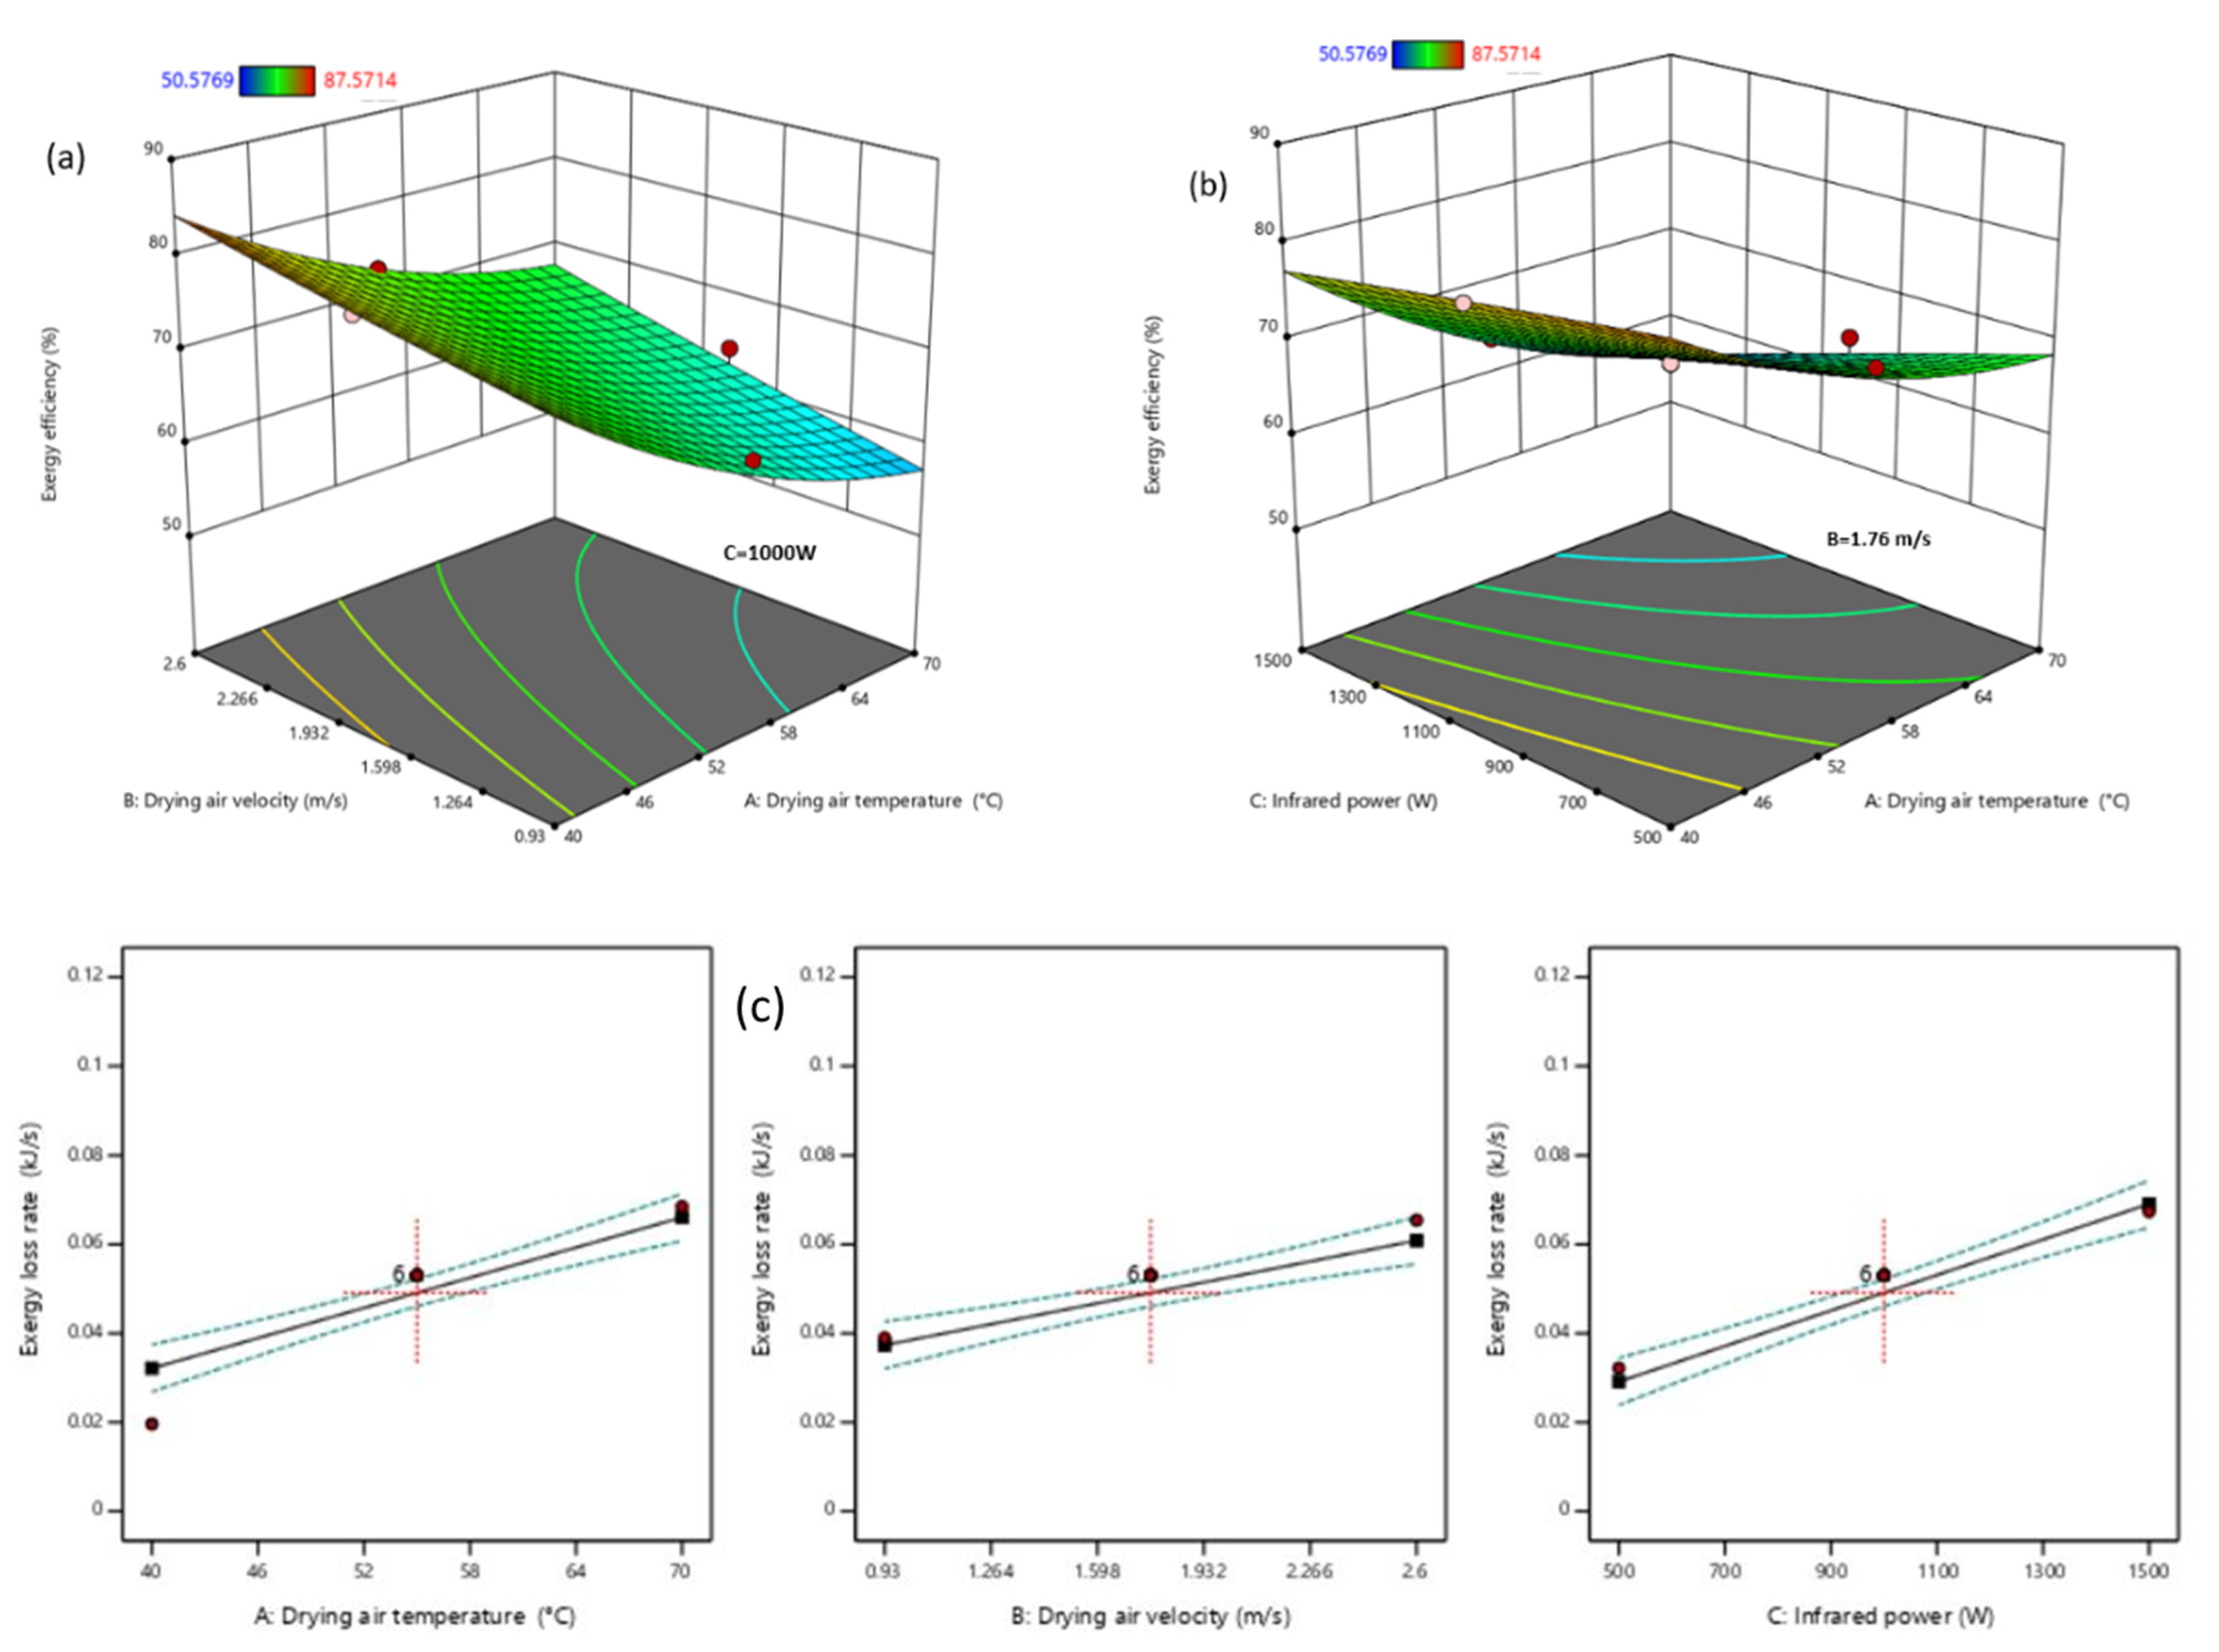
3.3.2. Impact of Drying Conditions on EXeff and Exloss
3.4. Evaluation of and SI
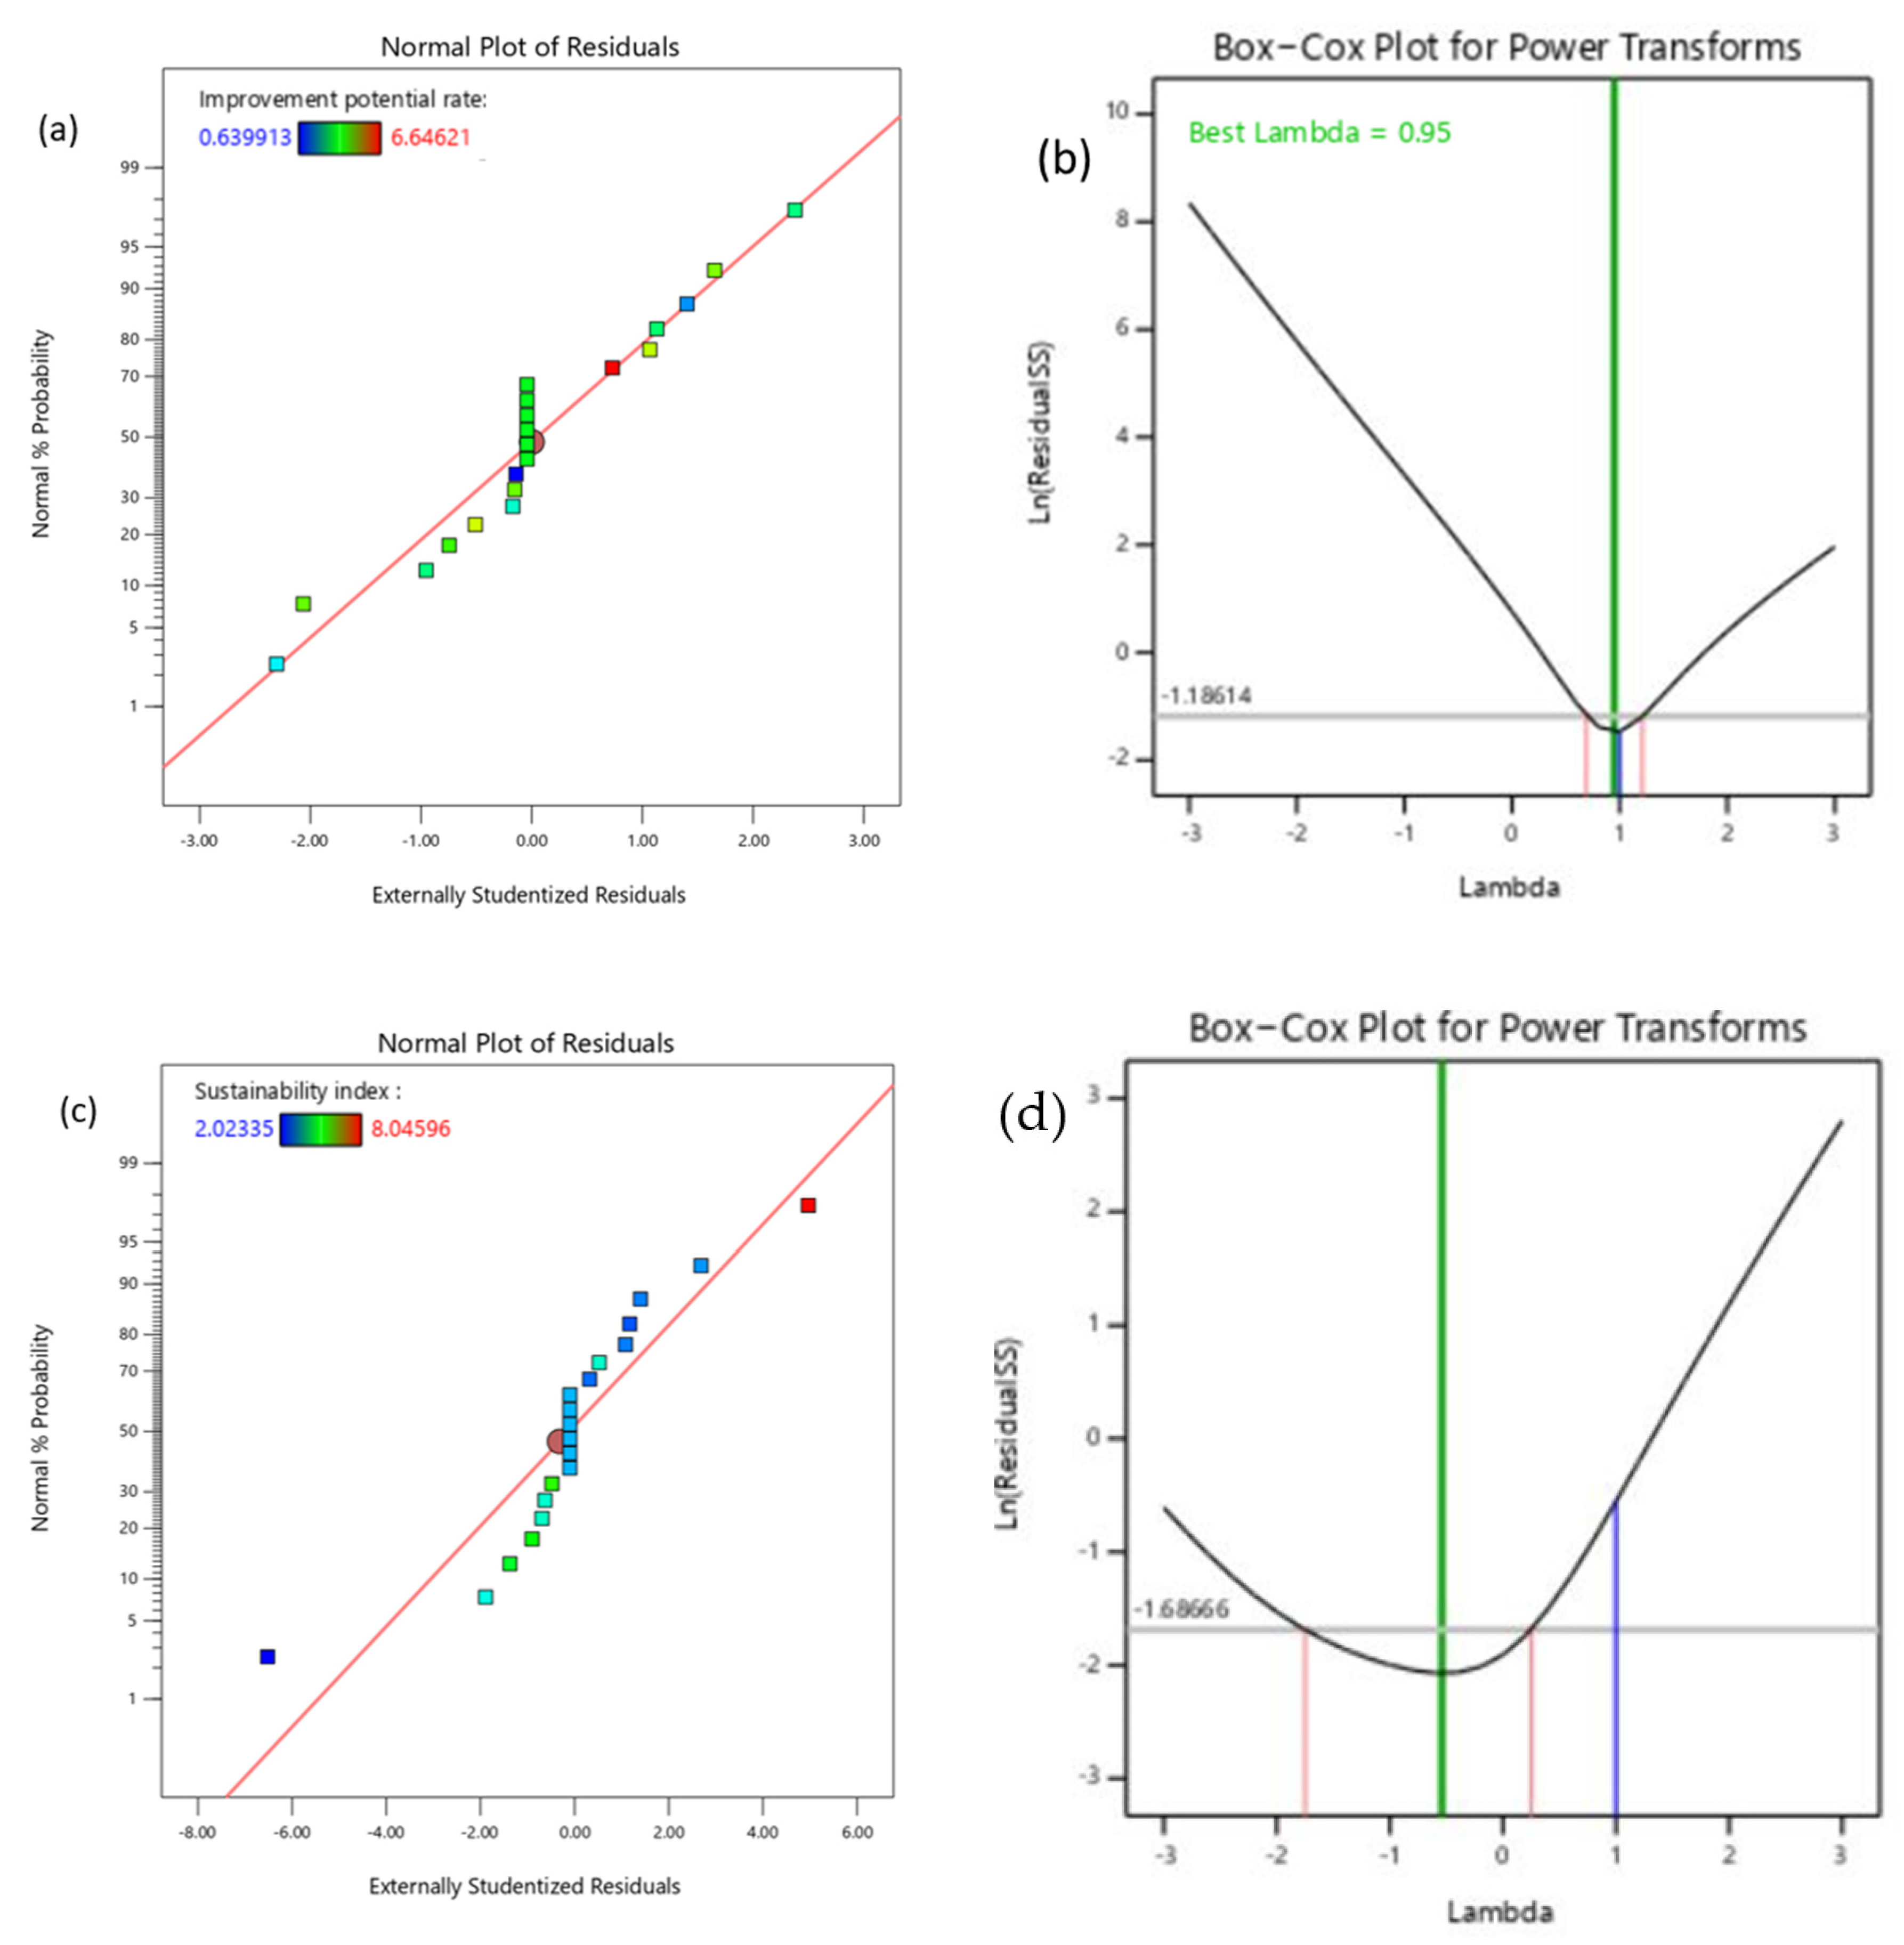
3.4.1. The Model Analysis and Assessment for and SI
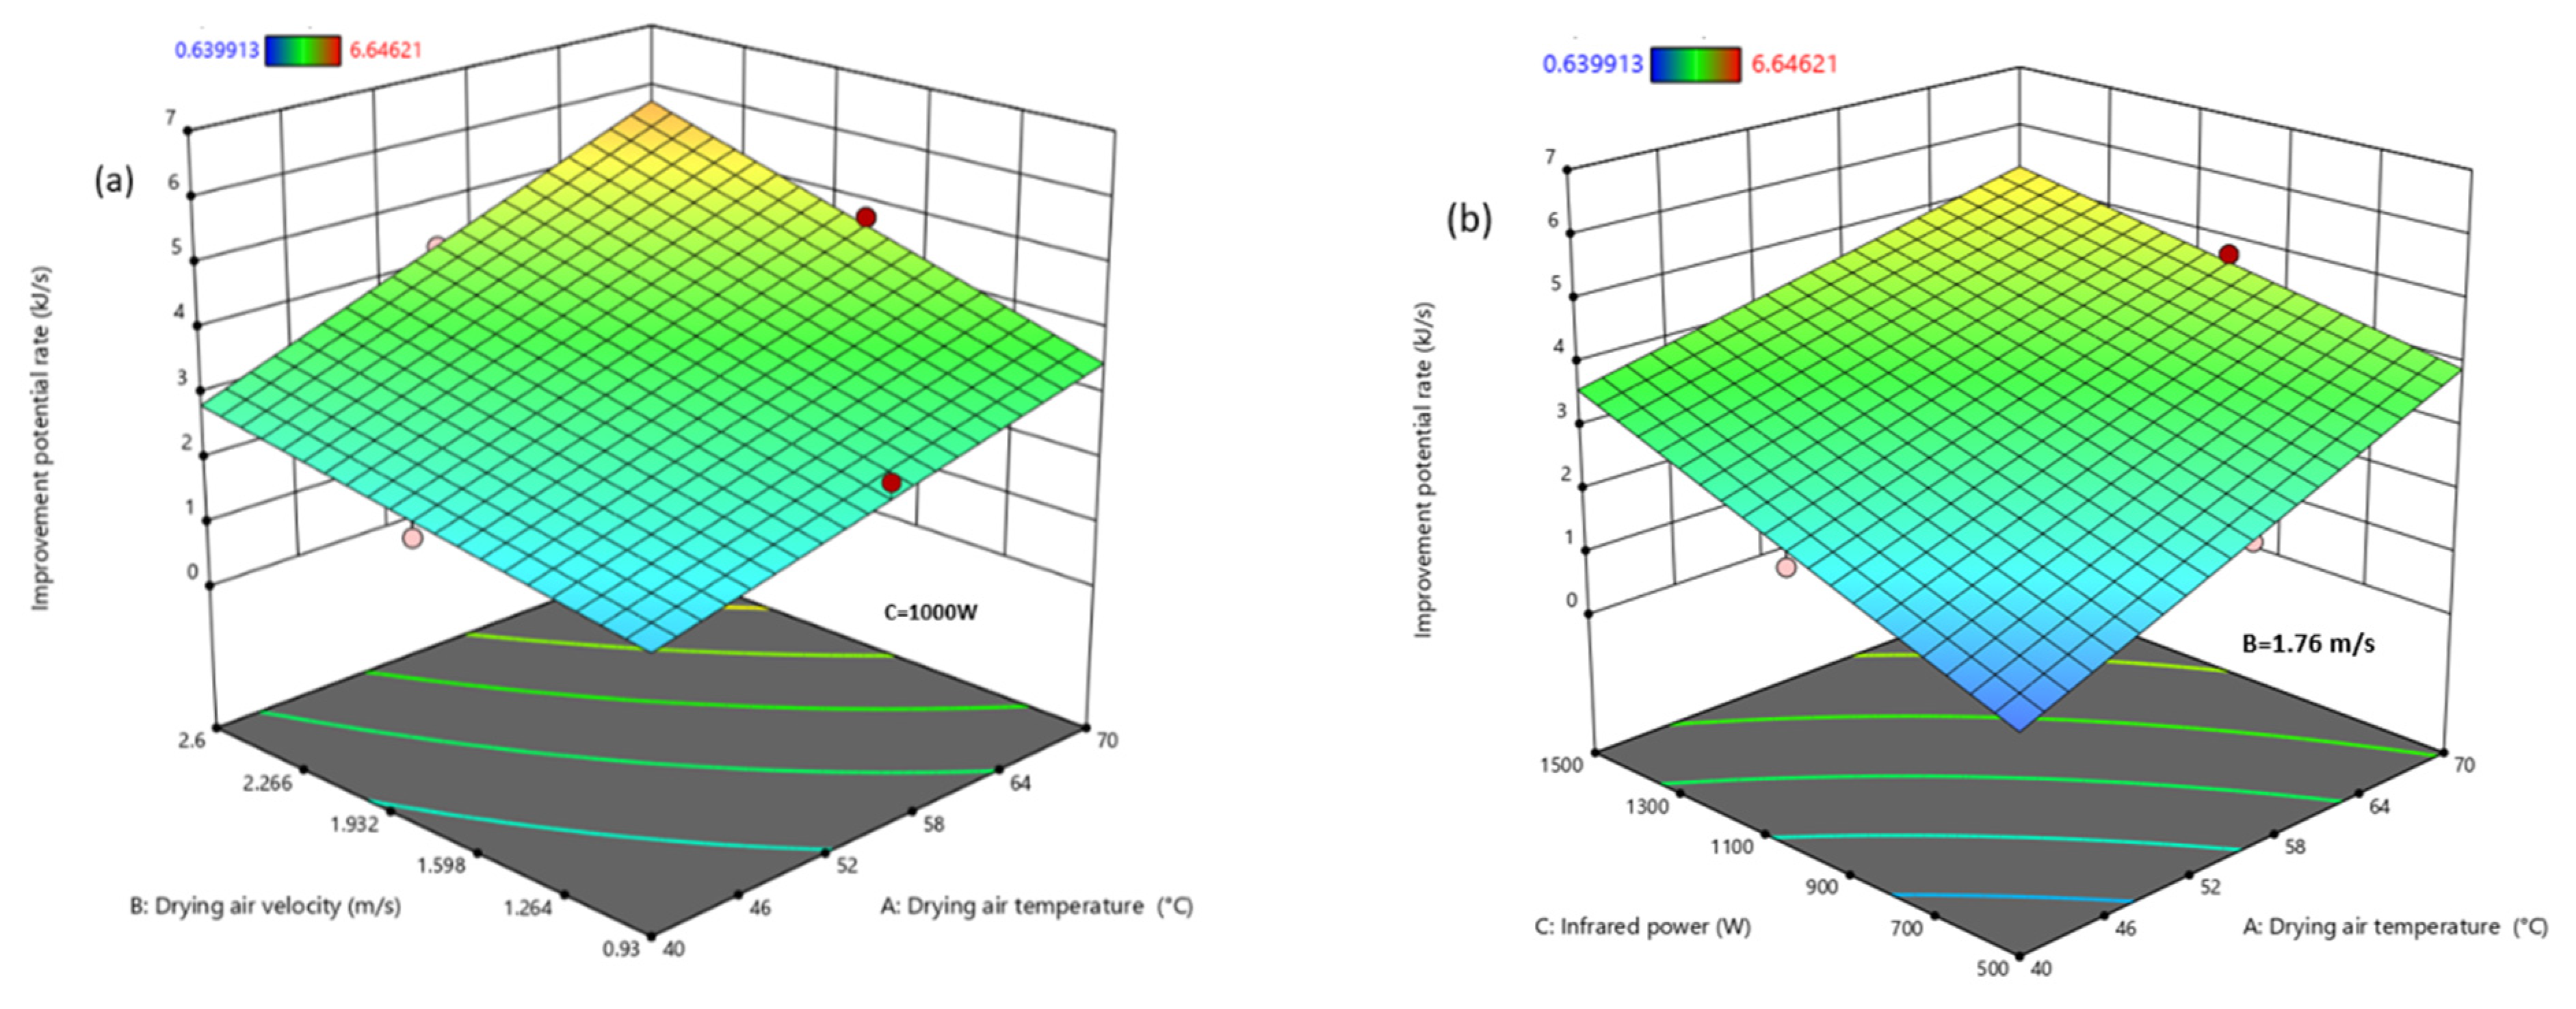
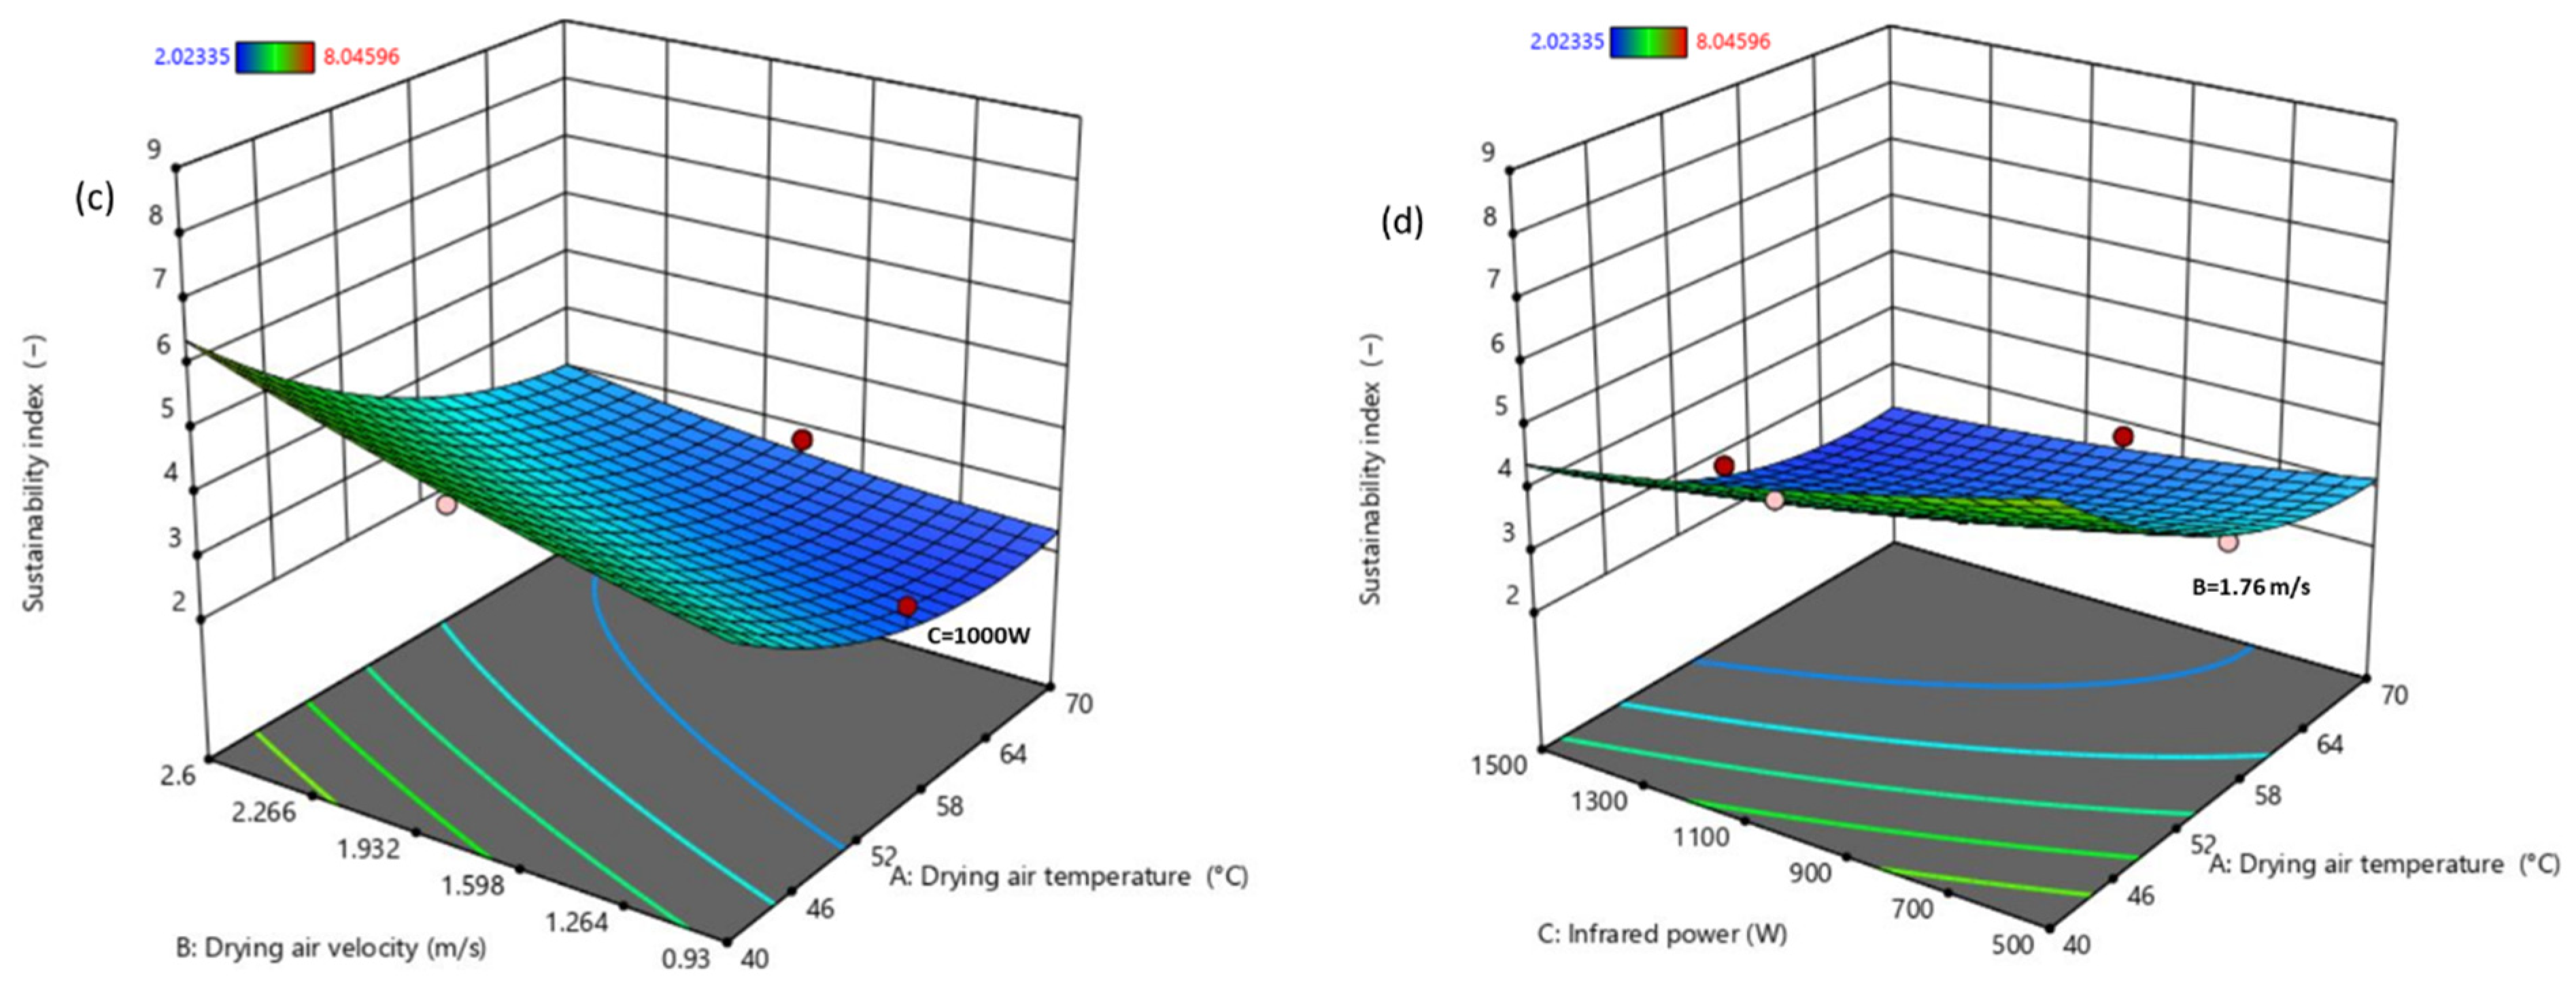
3.4.2. Impact of Drying Conditions on and SI
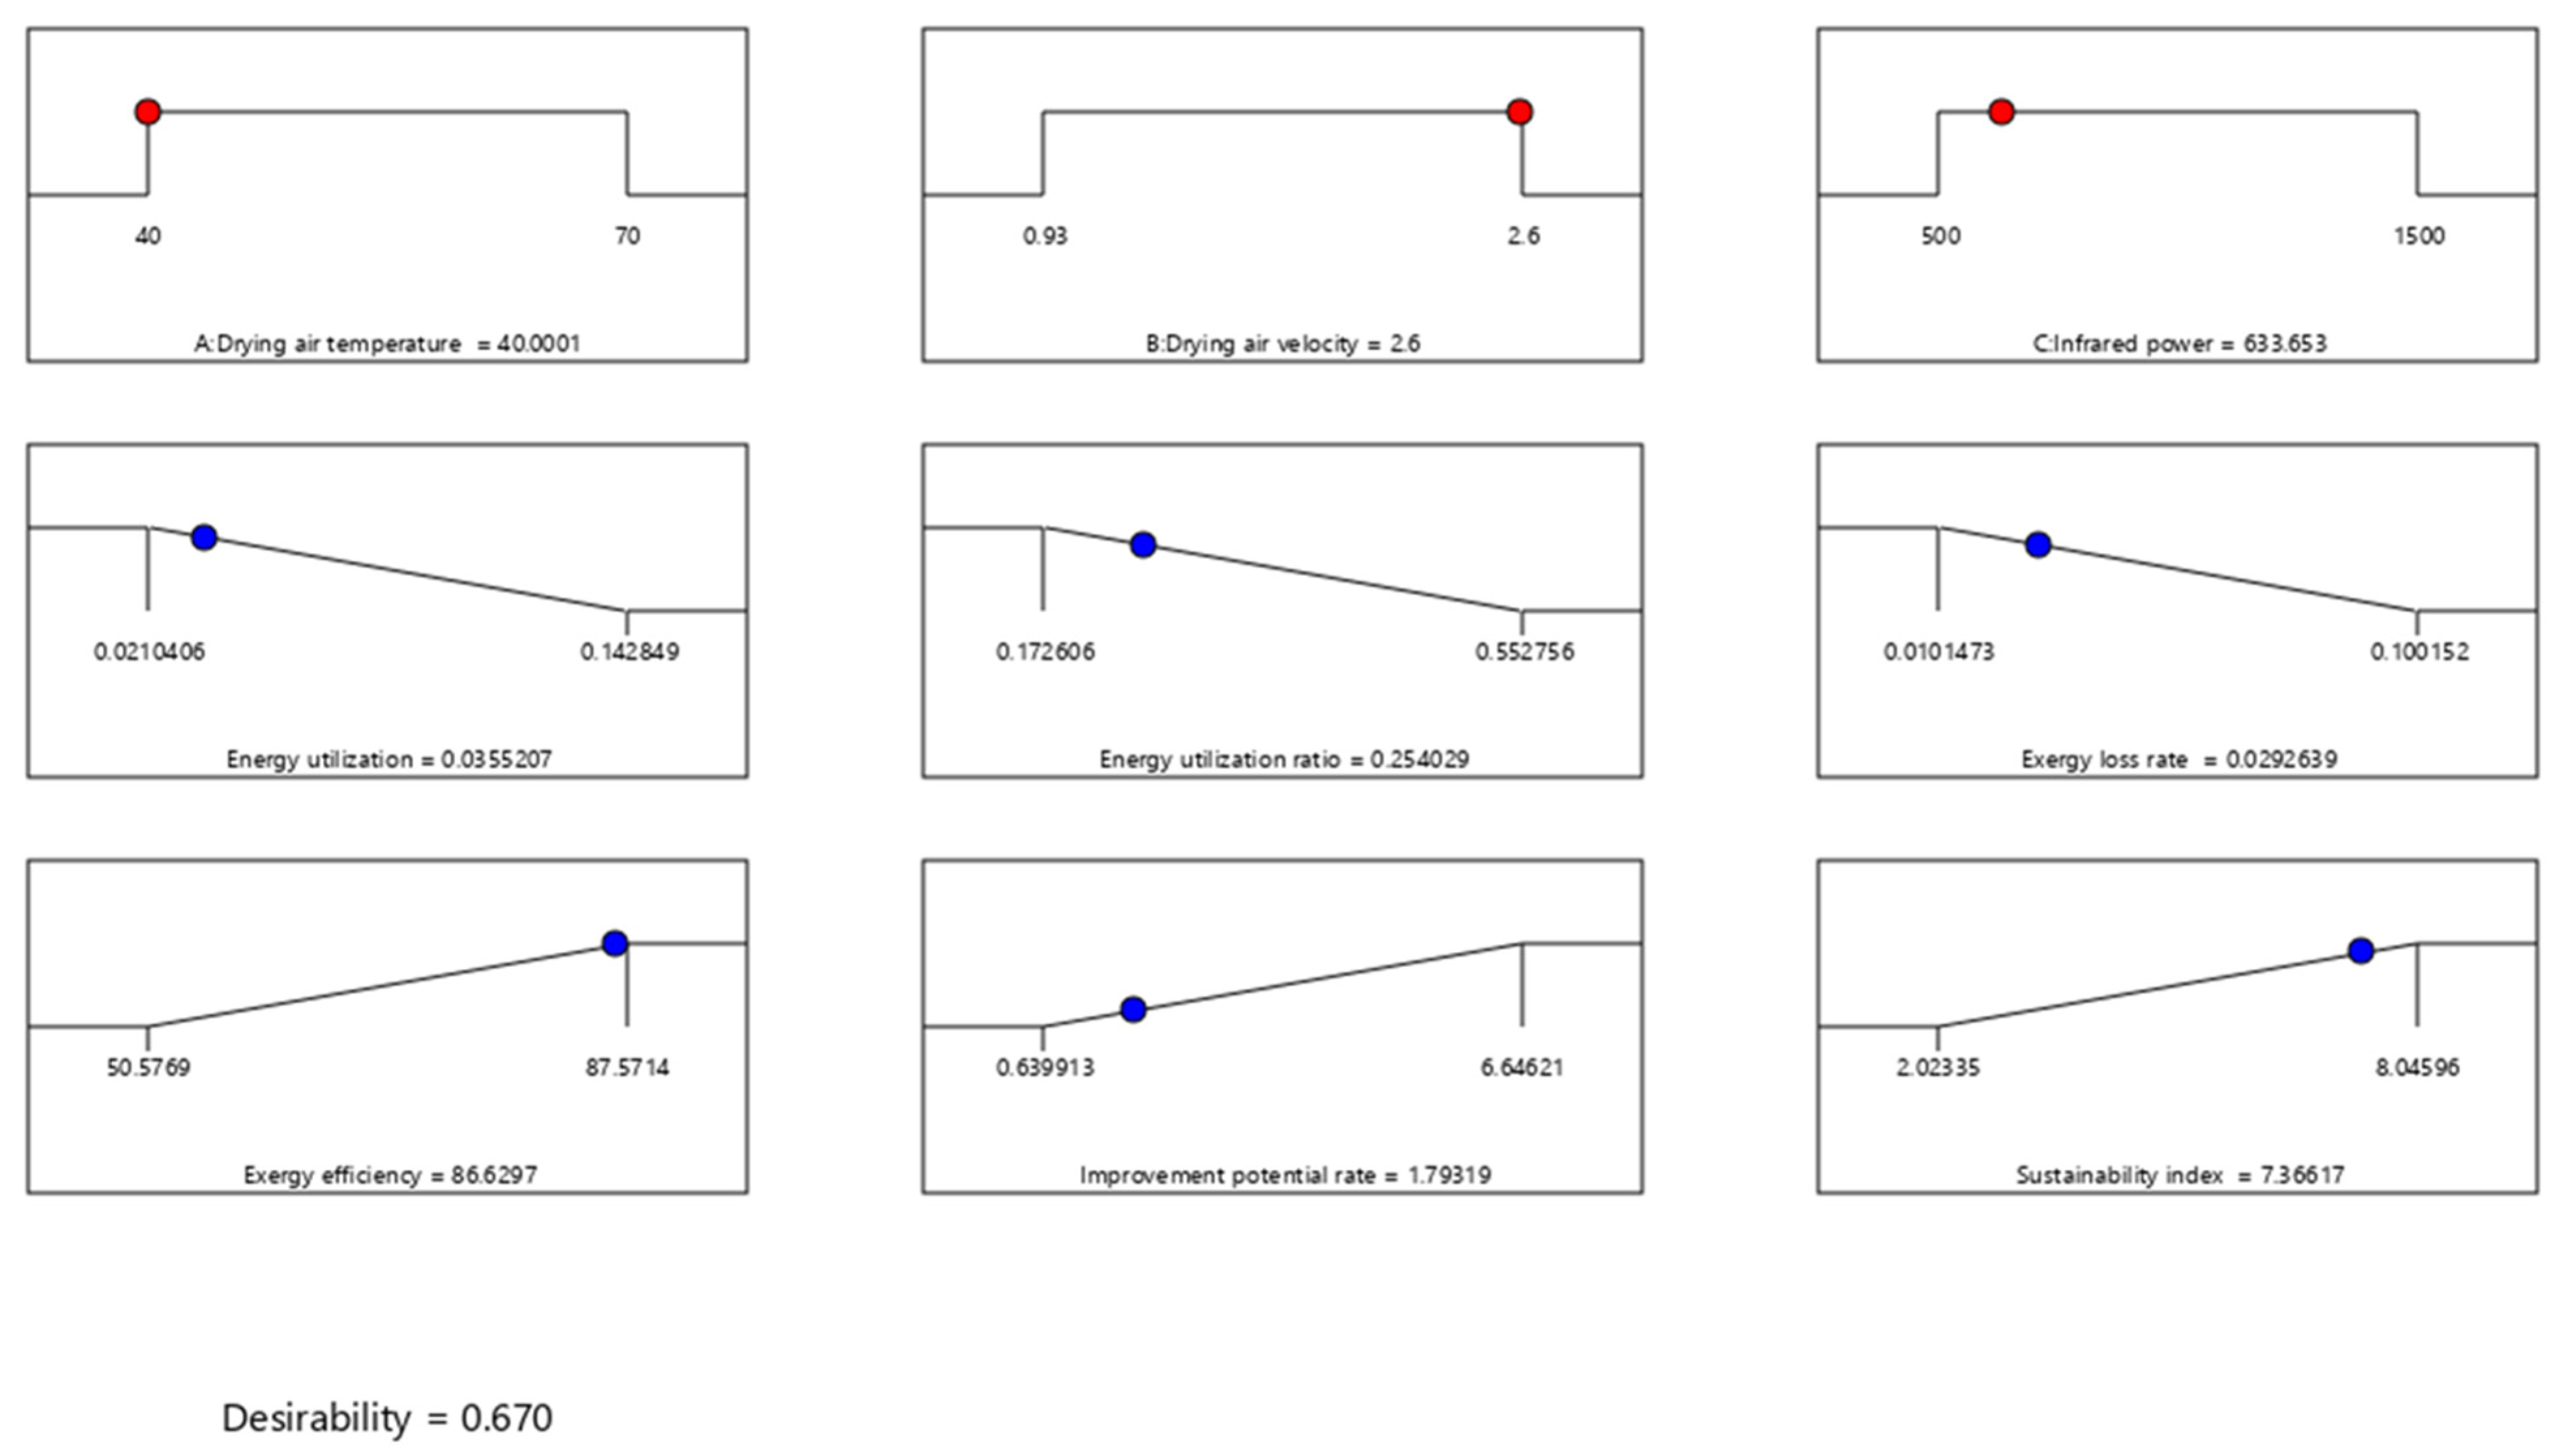
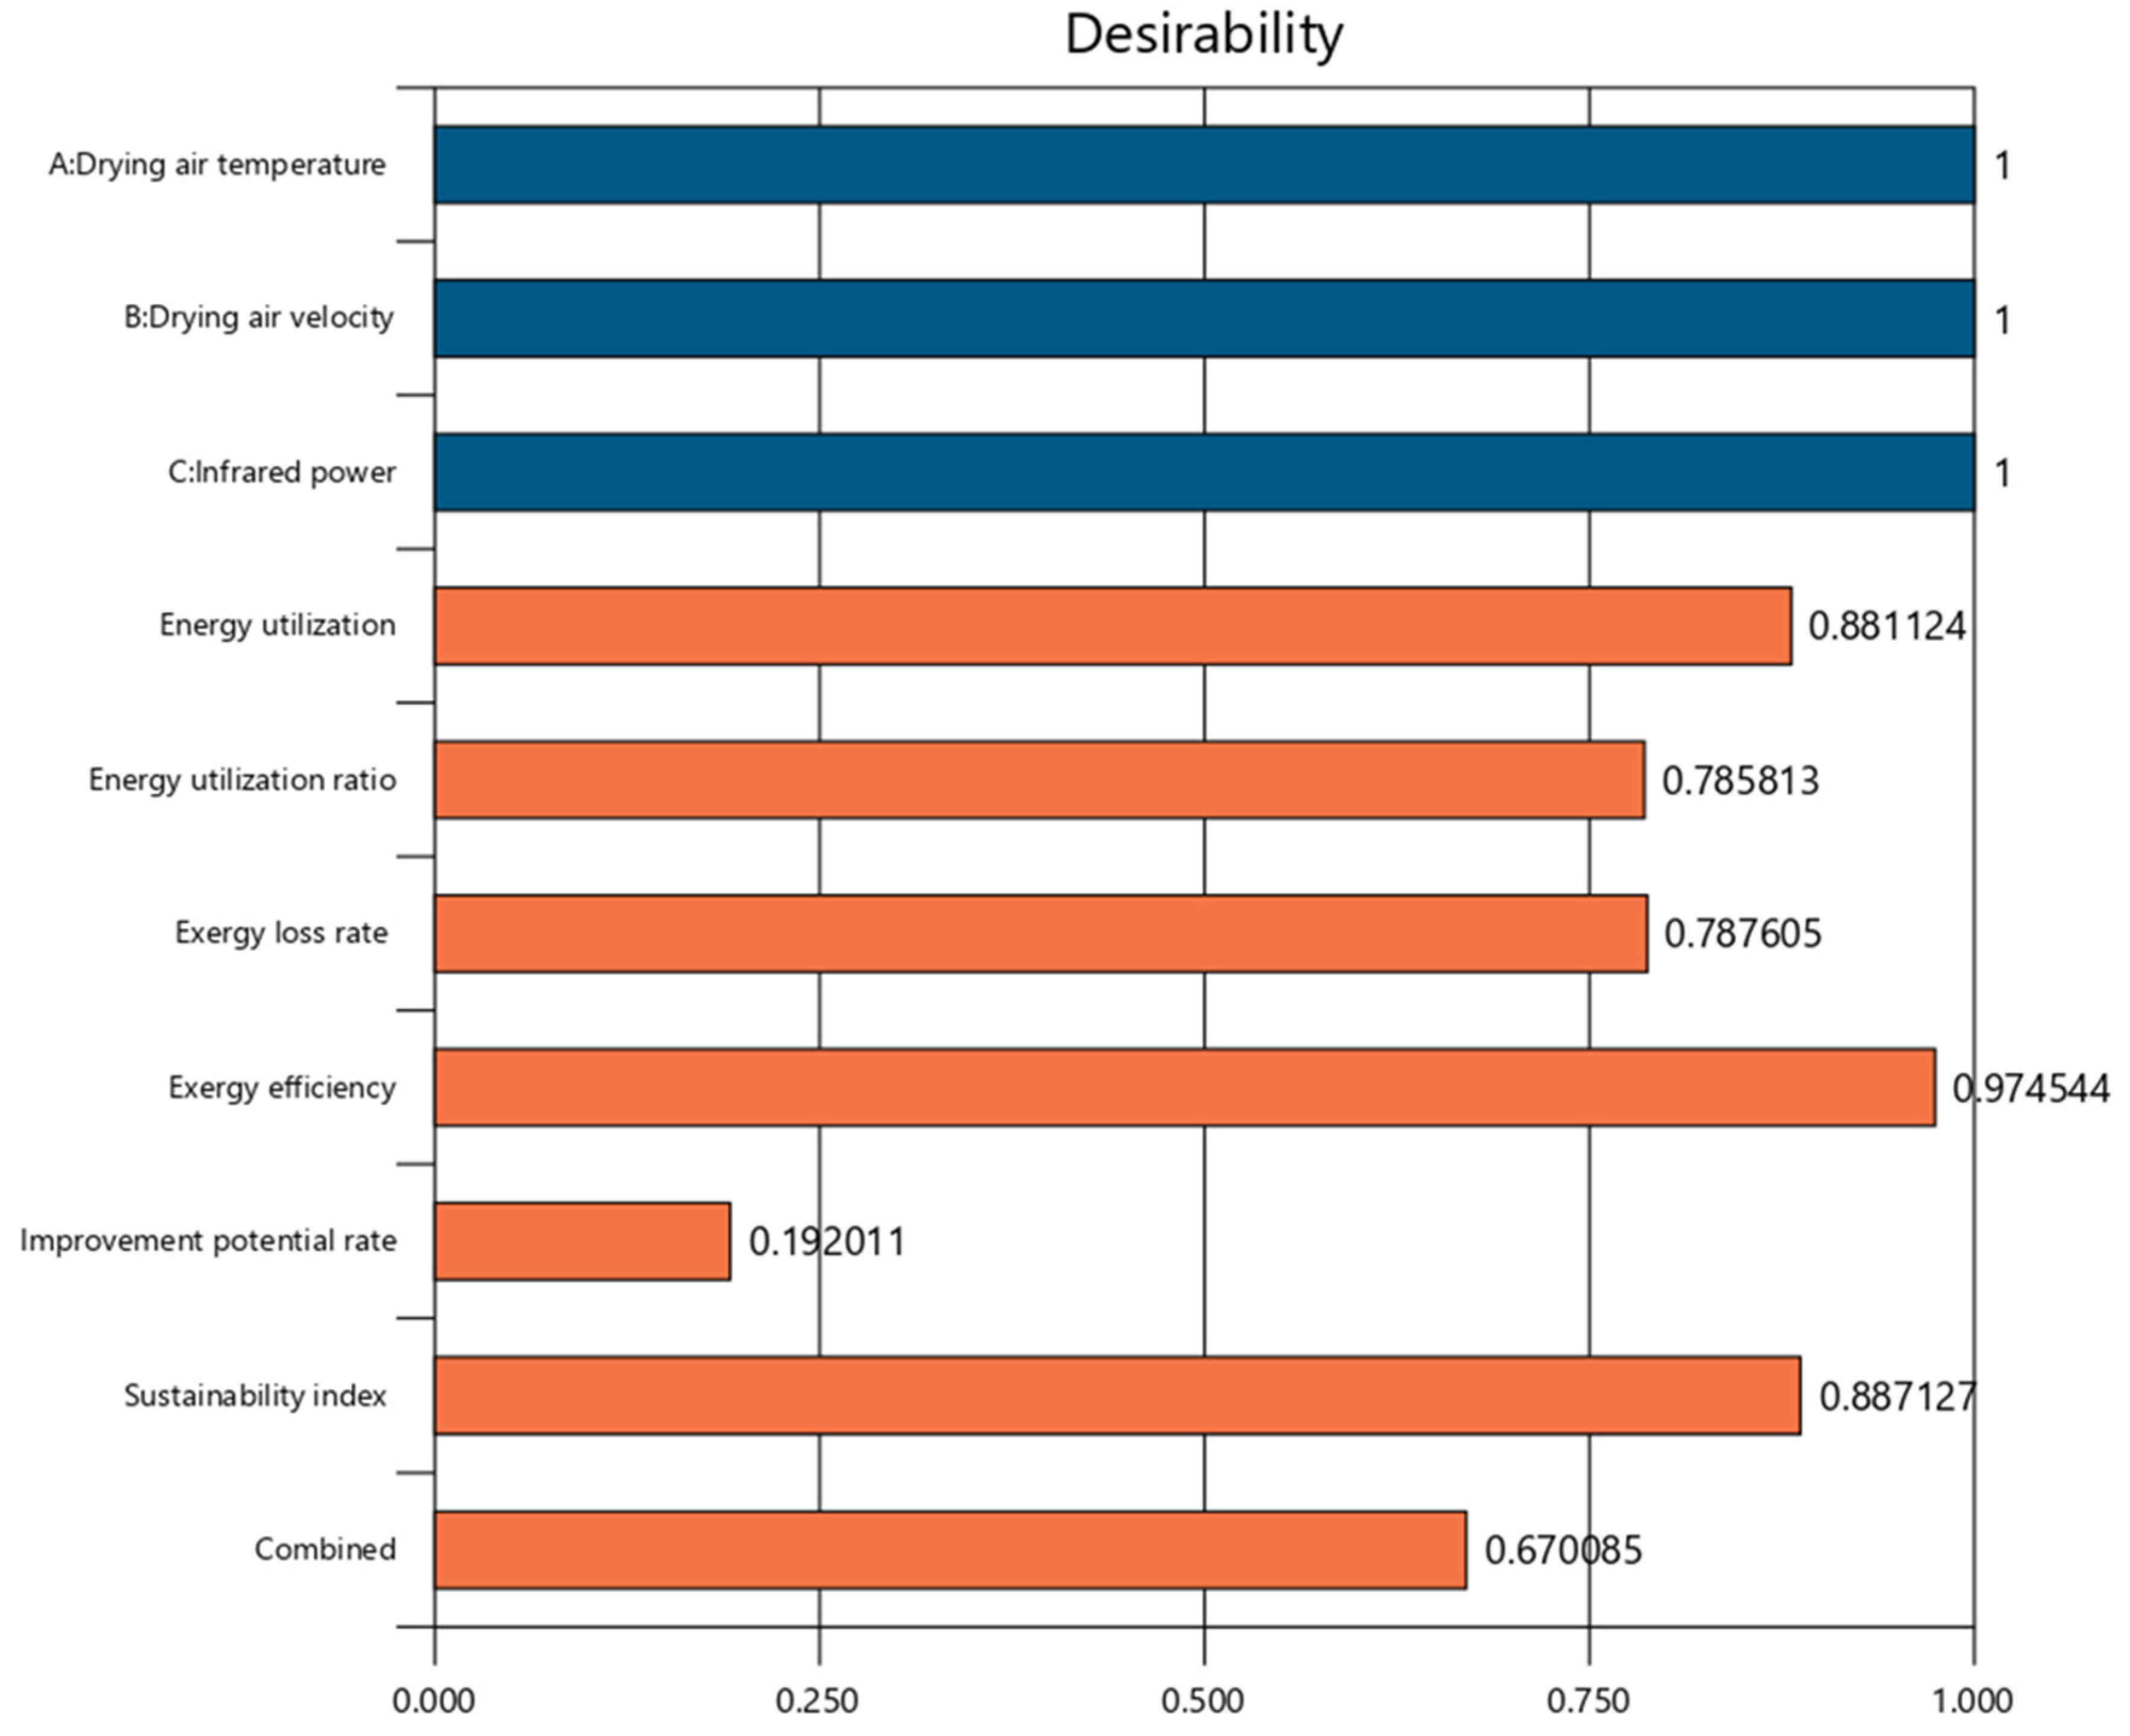
3.5. Multi-Objective Optimisation Process
4. Conclusions
Author Contributions
Funding
Institutional Review Board Statement
Informed Consent Statement
Data Availability Statement
Conflicts of Interest
Nomenclature
| Notations | |
| MC | moisture content (% dry weight) |
| T | temperature (°C) |
| P | atmospheric pressure (kPa) |
| V | air velocity (m/s) |
| A | area (m2) |
| m | mass flow rate (kg/s) |
| c | specific heat (kJ/kg°C) |
| gas constant (8.3143 kJ/mol) | |
| h | enthalpy (kJ/kg) |
| EU | energy utilisation (kJ/s) |
| EUR | energy utilisation ratio (kJ/s) |
| Q | heat transfer (kJ/s) |
| energy rate (kJ/s) | |
| EX | exergy rate (kJ/s) |
| specific exergy (kJ/kg) | |
| improvement potential rate (kJ/s) | |
| SI | sustainability index |
| RSM | response surface method |
| D | total desirability function |
| Y | desirability function of each response in RSM |
| x | coded variable of model in RSM |
| n | number of responses |
| y | experimental value |
| predicted value | |
| HCI | hybrid convective infrared |
| PRESS | predicted sum of squares |
| d.b. | dry basis |
| SS | sum squares |
| CCD | central composite design |
| z | independent variables |
| U | total uncertainty |
| F | function of the independent variables |
| ADJ | adjusted |
| PRED | predicted |
| X | components of product (%) |
| Greek letters | |
| density (kg/m3) | |
| random error | |
| emissivity factor | |
| exergy efficiency (%) | |
| relative humidity of air (%) | |
| humidity ratio (kg water/kg dry air) | |
| Stefan–Boltzmann constant (W/m2·K4) | |
| regression coefficient term of RSM’s model | |
| constant volume | |
| Subscripts | |
| 0 | ambient |
| air | |
| IR | irradiation |
| fg | latent heat of vaporisation |
| vs | saturated vapour |
| loss | heat loss |
| numerator | |
| inlet | |
| out | outlet |
| pred | predicted |
| te | terebinth |
| ex | exergy |
| dc | drying chamber |
| da | drying air |
| evp | evaporation |
| p | pressure |
| m | moisture |
| c | carbohydrate |
| pr | protein |
| f | fat |
| a | ash |
References
- Rababah, T.M.; Banat, F.; Rababah, A.; Ereifej, K.; Yang, W. Optimisation of extraction conditions of total phenolics, antioxidant activities, and anthocyanin of oregano, thyme, terebinth, and pomegranate. J. Food Sci. 2010, 75, 626–632. [Google Scholar]
- Kaveh, M.; Abbaspour-Gilandeh, Y.; Taghinezhad, E.; Witrowa-Rajchert, D.; Nowacka, M. The Quality of Infrared Rotary Dried Terebinth (Pistacia atlantica L.)-optimisation and prediction approach using response surface methodology. Molecules 2021, 26, 1999. [Google Scholar]
- Abbaspour-Gilandeh, Y.; Jahanbakhshi, A.; Kaveh, M. Prediction kinetic, energy and exergy of quince under hot air dryer using ANNs and ANFIS. Food Sci. Nutr. 2020, 8, 594–611. [Google Scholar]
- Taheri-Garavand, A.; Karimi, F.; Karimi, M.; Lotfi, V.; Khoobbakht, G. Hybrid response surface methodology–artificial neural network optimisation of drying process of banana slices in a forced convective dryer. Food Sci. Technol. Int. 2018, 24, 277–291. [Google Scholar]
- Golpour, I.; Amiri Chayjan, R.; Amiri Parian, J.; Khazaei, J. Prediction of paddy moisture content during thin layer drying using machine vision and artificial neural networks. J. Agric. Sci. Technol. 2015, 17, 287–298. [Google Scholar]
- Golpour, I.; Nejad, M.Z.; Chayjan, R.A.; Nikbakht, A.M.; Guiné, R.P.F.; Dowlati, M. Investigating shrinkage and moisture diffusivity of melon seed in a microwave assisted thin layer fluidised bed dryer. Food Meas. 2017, 11, 1–11. [Google Scholar]
- De Oliveira, R.M.; Andrade, K.S.; Prado, M.M.; Marques, L.G. Study on hybrid drying with infrared radiation of watermelon seeds (Citrullus lanatus). In Defect and Diffusion Forum; Trans Tech Publications Ltd.: Stafa-Zurich, Switzerland, 2020; Volume 399, pp. 173–182. [Google Scholar]
- Majdi, H.; Esfahani, J.A.; Mohebbi, M. Optimisation of convective drying by response surface methodology. Comput. Electron. Agric. 2019, 156, 574–584. [Google Scholar]
- Okunola, A.; Adekanye, T.; Idahosa, E. Energy and exergy analyses of okra drying process in a forced convection cabinet dryer. Res. Agric. Eng. 2021, 67, 8–16. [Google Scholar]
- EL-Mesery, H.S.; Abomohra, A.E.F.; Kang, C.U.; Cheon, J.K.; Basak, B.; Jeon, B.H. Evaluation of infrared radiation combined with hot air convection for energy-efficient drying of biomass. Energies 2019, 12, 2818. [Google Scholar]
- Özdemir, M.B.; Aktaş, M.; Şevik, S.; Khanlari, A. Modeling of a convective-infrared kiwifruit drying process. Int. J. Hydrogen Energy 2017, 42, 18005–18013. [Google Scholar]
- Golpour, I.; Guiné, R.P.; Poncet, S.; Golpour, H.; Amiri Chayjan, R.; Amiri Parian, J. Evaluating the heat and mass transfer effective coefficients during the convective drying process of paddy (Oryza sativa L.). J. Food Process. Eng. 2021, 44, e13771. [Google Scholar]
- Honarvar, B.; Mowla, D.; Safekordi, A.A. Experimental and theoretical investigation of drying of green peas in a fluidised bed dryer of inert particles assisted by infrared heat source. Iran. J. Chem. Chem. Eng. 2013, 32, 83–94. [Google Scholar]
- Abbaspour-Gilandeh, Y.; Kaveh, M.; Fatemi, H.; Hernández-Hernández, J.L.; Fuentes-Penna, A.; Hernández-Hernández, M. Evaluation of the changes in thermal, qualitative, and antioxidant properties of terebinth (Pistacia atlantica) fruit under different drying methods. Agronomy 2020, 10, 1378. [Google Scholar]
- Rashid, M.T.; Ma, H.; Jatoi, M.A.; Wali, A.; El-Mesery, H.S.; Ali, Z.; Sarpong, F. Effect of infrared drying with multifrequency ultrasound pretreatments on the stability of phytochemical properties, antioxidant potential, and textural quality of dried sweet potatoes. J. Food Biochem. 2019, 43, e12809. [Google Scholar]
- Ghasemi, A.; Chayjan, R.A. Optimisation of pelleting and infrared-convection drying processes of food and agricultural waste using response surface methodology (RSM). Waste Biomass Valoris. 2019, 10, 1711–1729. [Google Scholar]
- Taghinezhad, E.; Kaveh, M.; Szumny, A. Optimisation and prediction of the drying and quality of turnip slices by convective-infrared dryer under various pretreatments by RSM and ANFIS methods. Foods 2021, 10, 284. [Google Scholar]
- Kocabiyik, H.; Yilmaz, N.; Tuncel, N.B.; Sumer, S.K.; Buyukcan, M.B. Drying, Energy, and Some Physical and Nutritional Quality Properties of Tomatoes Dried with Short-Infrared Radiation. Food Bioprocess Technol. 2015, 8, 516–525. [Google Scholar]
- Aghbashlo, M. Exergetic simulation of a combined infrared-convective drying process. Heat Mass Transf. 2016, 52, 829–844. [Google Scholar]
- Mugi, V.R.; Chandramohan, V.P. Energy and exergy analysis of forced and natural convection indirect solar dryers: Estimation of exergy inflow, outflow, losses, exergy efficiencies and sustainability indicators from drying experiments. J. Clean. Prod. 2021, 282, 124421. [Google Scholar]
- Darvishi, H.; Zarein, M.; Farhudi, Z. Energetic and exergetic performance analysis and modeling of drying kinetics of kiwi slices. J. Food Sci. Technol. 2016, 53, 2317–2333. [Google Scholar]
- Golpour, I.; Kaveh, M.; Chayjan, R.A.; Guiné, R.P.F. Energetic and exergetic analysis of a convective drier: A case study of potato drying process. Open Agric. 2020, 5, 563–572. [Google Scholar]
- Li, C.; Li, B.; Huang, J.; Li, C. Energy and exergy analyses of a combined infrared radiation-counterflow circulation (ircc) corn dryer. Appl. Sci. 2020, 10, 6289. [Google Scholar]
- Prommas, R.; Rattanadecho, P.; Cholaseuk, D. Energy and exergy analyses in drying process of porous media using hot air. Int. Commun. Heat Mass Transf. 2010, 37, 372–378. [Google Scholar]
- Azadbakht, M.; Torshizi, M.V.; Ziaratban, A.; Aghili, H. Energy and exergy analyses during eggplant drying in a fluidised bed dryer. Agric. Eng. Int. CIGR J. 2017, 19, 177–182. [Google Scholar]
- Darvishi, H.; Zarein, M.; Minaei, S.; Khafajeh, H. Exergy and energy analysis, drying kinetics and mathematical modeling of white mulberry drying process. Int. J. Food Eng. 2014, 10, 269–280. [Google Scholar]
- Kaveh, M.; Chayjan, R.A.; Golpour, I.; Poncet, S.; Seirafi, F.; Khezri, B. Evaluation of exergy performance and onion drying properties in a multi-stage semi-industrial continuous dryer: Artificial neural networks (ANNs) and ANFIS models. Food Bioprod. Process. 2021, 127, 58–76. [Google Scholar]
- Dolgun, G.K.; Aktaş, M.; Dolgun, E.C. Infrared convective drying of walnut with energy-exergy perspective. J. Food Eng. 2021, 306, 110638. [Google Scholar]
- Afzali, F.; Darvishi, H.; Behroozi-Khazaei, N. Optimising exergetic performance of a continuous conveyor infrared-hot air dryer with air recycling system. Appl. Therm. Eng. 2019, 154, 358–367. [Google Scholar]
- Sadeghi, E.; Haghighi Asl, A.; Movagharnejad, K. Optimisation and quality evaluation of infrared-dried kiwifruit slices. Food Sci. Nutr. 2020, 8, 720–734. [Google Scholar]
- Benhamza, A.; Boubekri, A.; Atia, A.; El Ferouali, H.; Hadibi, T.; Arıcı, M.; Abdenouri, N. Multi-objective design optimisation of solar air heater for food drying based on energy, exergy and improvement potential. Renew. Energy 2021, 169, 1190–1209. [Google Scholar]
- Icier, F.; Ozmen, D.; Cevik, M.; Cokgezme, O.F. Drying of licorice root by novel radiative methods. J. Food Process. Preserv. 2021, 45, e15214. [Google Scholar]
- Icier, F.; Colak, N.; Erbay, Z.; Kuzgunkaya, E.H.; Hepbasli, A. A comparative study on exergetic performance assessment for drying of broccoli florets in three different drying systems. Dry. Technol. 2010, 28, 193–204. [Google Scholar]
- Aghbashlo, M.; Kianmehr, M.H.; Arabhosseini, A. Performance analysis of drying of carrot slices in a semi-industrial continuous band dryer. J. Food Eng. 2009, 91, 99–108. [Google Scholar]
- Akpinar, E.K.; Midilli, A.; Bicer, Y. Energy and exergy of potato drying process via cyclone type dryer. Energy Convers. Manag. 2005, 46, 2530–2552. [Google Scholar]
- Choi, Y.; Okos, M.R. Effects of temperature and composition on the thermal properties of foods. In Transport Phenomena; Elsevier Applied Science Publishers: Basel, Switzerland, 1986. [Google Scholar]
- Wepfer, W.J.; Gaggioli, R.A.; Obert, E.F. Proper evaluation of available energy for HVAC. Ashrae Trans. 1979, 85, 214–230. [Google Scholar]
- Parhizi, Z.; Karami, H.; Golpour, I.; Kaveh, H.; Szymanek, M.; Blanco-Marigorta, A.M.; Marcos, J.D.; Khalife, E.; Skowron, S.; Othman, N.A.; et al. Modeling and optimisation of energy and exergy parameters of a hybrid-solar dryer for basil leaf drying using RSM. Sustainability 2022, 14, 8839. [Google Scholar]
- Aghbashlo, M. A proposed mathematical model for exergy analysis of an infrared (IR) drying process. Int. J. Exergy 2015, 18, 480–500. [Google Scholar]
- Beigi, M.; Tohidi, M.; Torki-Harchegani, M. Exergetic analysis of deep-bed drying of rough rice in a convective dryer. Energy 2017, 140, 374–382. [Google Scholar]
- Brooker, D.B. Mathematical model of the psychrometric chart. Trans. ASAE 1967, 10, 558–560. [Google Scholar]
- Islam, M.A.; Mondal, M.H.T.; Akhtaruzzaman, M.; Sheikh, M.A.M.; Islam, M.M.; Haque, M.A.; Sarker, M.S.H. Energy, exergy, and milling performance of parboiled paddy: An industrial LSU dryer. Dry. Technol. 2021, 40, 2058–2072. [Google Scholar] [CrossRef]
- Hammond, G.P.; Stapleton, A.J. Exergy analysis of the United Kingdom energy system. Proc. Inst. Mech. Eng. Part A J. Power Energy 2001, 215, 141–162. [Google Scholar]
- Holman, J.P. Experimental Methods for Engineers, 8th ed.; McGraw-Hill: New York, NY, USA, 2012. [Google Scholar]
- Soltani, A.; Azzouz, S.; Romdhana, H.; Goujot, D. Multi-response optimisation of drying process parameters for Laurus Nobilis. J. Appl. Res. Medic. Arom. Plant 2021, 22, 100302. [Google Scholar]
- Aghilinategh, N.; Rafiee, S.; Hosseinpour, S.; Omid, M.; Mohtasebi, S.S. Optimisation of intermittent microwave–convective drying using response surface methodology. Food Sci. Nutr. 2015, 3, 331–341. [Google Scholar]
- Aneke, N.A.G.; Mbah, G.O.; Edeani, N.J. Response surface methodology for optimisation of hot air drying of water yam slices. Int. J. Sci. Res. Public 2018, 8, 248–259. [Google Scholar]
- Gorji, T.B.; Ranjbar, A.A. Thermal and exergy optimisation of a nanofluid-based direct absorption solar collector. Renew Energy 2017, 106, 274–287. [Google Scholar]
- Yogendrasasidhar, D.; Setty, P.Y. Drying kinetics, exergy and energy analyses of kodo millet grains and fenugreek seeds using wall heated fluidised bed dryer. Energy 2018, 151, 799–811. [Google Scholar]
- Motevali, A.; Minaei, S. Effects of microwave pretreatment on the energy and exergy utilisation in thin-layer drying of sour pomegranate arils. Chem. Ind. Chem. Eng. Q. 2012, 18, 63–72. [Google Scholar]
- Beigi, M. Moisture removal behavior and thermodynamic analysis of kiwifruit slices in convective tray dryer. Lat. Am. Appl. Res. 2022, 52, 119–126. [Google Scholar]
- Corzo, O.; Bracho, N.; Vásquez, A.; Pereira, A. Energy and exergy analyses of thin layer drying of coroba slices. J. Food Eng. 2008, 86, 151–161. [Google Scholar]
- Das, S.; Kashyap, D.; Bora, B.J.; Kalita, P.; Kulkarni, V. Thermo-economic optimisation of a biogas-diesel dual fuel engine as remote power generating unit using response surface methodology. Therm. Sci. Eng. Progress. 2021, 24, 100935. [Google Scholar]
- Gupta, G.K.; Mondal, M.K. Bio-energy generation from sagwan sawdust via pyrolysis: Product distributions, characterisations and optimisation using response surface methodology. Energy 2019, 170, 423–437. [Google Scholar]
- Nizamuddin, S.; Mubarak, N.M.; Tiripathi, M.; Jayakumar, N.S.; Sahu, J.N.; Ganesan, P. Chemical, dielectric and structural characterisation of optimised hydrochar produced from hydrothermal carbonisation of palm shell. Fuel 2016, 163, 88–97. [Google Scholar]
- Obajemihi, O.I.; Olaoye, J.O.; Cheng, J.H.; Ojediran, J.O.; Sun, D.W. Optimisation of process conditions for moisture ratio and effective moisture diffusivity of tomato during convective hot-air drying using response surface methodology. J. Food Process. Preserv. 2021, 45, e15287. [Google Scholar]
- Uzoma, S.; Nwakuba, N.; Anyaoha, K. Response surface optimisation of convective air drying process in a hybrid PV/T solar dryer. Turk. J. Agric. Eng. Res. 2020, 1, 111–130. [Google Scholar]
- Alhanif, M.; Kumoro, A.C.; Wardhani, D.H. Mass transfer, energy utilisation, physical and nutritional properties evaluations during drying of papaya (Carica papaya L.) seeds at low to moderate temperatures. Arab. J. Sci. Eng. 2021, 47, 6245–6267. [Google Scholar] [CrossRef]
- Mehran, M.; Masoum, S.; Memarzadeh, M. Microencapsulation of Mentha spicata essential oil by spray drying: Optimisation, characterisation, release kinetics of essential oil from microcapsules in food models. June Ind. Crops Prod. 2020, 154, 112694. [Google Scholar]
- Myers, R.H.; Montgomery, D.C.; Anderson-Cook, C.M. Response Surface Methodology: Process and Product Optimisation, Using Designed Experiments; John Wiley & Sons: Hoboken, NJ, USA, 2016. [Google Scholar]
- Stat-Ease, I. Design Expert Software; Educational Version 7.0.3; Wiley Publishing: New York, NY, USA, 2020. [Google Scholar]
- Chakraborty, R.; Mukhopadhyay, P.; Bera, M.; Suman, S. Infrared-assisted freeze drying of tiger prawn: Parameter optimisation and quality assessment. Dry. Technol. 2011, 29, 508–519. [Google Scholar]
- Aghbashlo, M.; Mobli, H.; Madadlou, A.; Rafiee, S. Influence of spray dryer parameters on exergetic performance of microencapsulation process. Int. J. Exergy 2012, 10, 267–289. [Google Scholar]
- Rahmawati, L.; Saputra, D.; Sahim, K.; Priyanto, G. Optimisation of infrared drying condition for whole duku fruit using response surface methodology. Potravin. Slovak J. Food Sci. 2019, 13, 462–469. [Google Scholar]


| Parameter | Equation | Equation No. |
|---|---|---|
| Mass balance | (1) | |
| Energy balance | (2) | |
| Exergy balance | (3) |
| Symbol | Range and Levels | |||||||
|---|---|---|---|---|---|---|---|---|
| Parameters | Units | Uncoded | Coded | Targets | Coded | Actual | Importance | |
| Input parameters | −1 | 500 | ||||||
| Infrared power | W | P | A | In range | 0 | 1000 | 3 | |
| 1 | 1500 | |||||||
| −1 | 40 | |||||||
| Air temperature | °C | T | B | In range | 0 | 55 | 3 | |
| 1 | 70 | |||||||
| −1 | 0.93 | |||||||
| Air velocity | m/s | V | C | In range | 0 | 1.76 | 3 | |
| 1 | 2.60 | |||||||
| Responses | Energy utilisation | kJ/s | EU | Minimum | 0.021–0.143 | 3 | ||
| Energy utilisation ratio | - | EUR | Minimum | 0.173–0.553 | 3 | |||
| Exergy loss rate | kJ/s | Exloss | Minimum | 0.010–0.100 | 3 | |||
| Exergy efficiency | % | Exeff | Maximum | 50.58–87.57 | 3 | |||
| Exergetic improvement potential rate | kJ/s | Maximum | 0.64–6.65 | 3 | ||||
| Sustainability index | - | SI | Maximum | 2.02–8.05 | 3 |
| Input Variables | Output Responses | ||||||||
|---|---|---|---|---|---|---|---|---|---|
| Run | T °C | V m/s | P W | EU kJ/s | EUR - | Exloss kJ/s | Exeff % | kJ/s | SI - |
| 1 | 40 | 0.93 | 1500 | 0.059 | 0.259 | 0.031 | 74.00 | 3.01 | 3.85 |
| 2 | 55 | 1.765 | 1500 | 0.109 | 0.432 | 0.067 | 63.91 | 4.24 | 2.77 |
| 3 | 70 | 2.6 | 1500 | 0.143 | 0.553 | 0.100 | 60.39 | 6.65 | 2.52 |
| 4 | 55 | 1.765 | 500 | 0.063 | 0.324 | 0.032 | 73.82 | 2.46 | 3.82 |
| 5 | 55 | 1.765 | 1000 | 0.093 | 0.420 | 0.053 | 67.71 | 3.47 | 3.10 |
| 6 | 55 | 2.6 | 1000 | 0.100 | 0.450 | 0.065 | 72.96 | 4.28 | 3.70 |
| 7 | 40 | 2.6 | 1500 | 0.093 | 0.361 | 0.065 | 81.12 | 4.41 | 5.30 |
| 8 | 55 | 1.765 | 1000 | 0.093 | 0.420 | 0.053 | 67.71 | 3.47 | 3.10 |
| 9 | 70 | 2.6 | 500 | 0.085 | 0.421 | 0.047 | 74.23 | 4.87 | 3.88 |
| 10 | 55 | 1.765 | 1000 | 0.093 | 0.420 | 0.053 | 67.71 | 3.47 | 3.10 |
| 11 | 70 | 0.93 | 1500 | 0.120 | 0.454 | 0.072 | 50.58 | 3.98 | 2.02 |
| 12 | 40 | 2.6 | 500 | 0.026 | 0.234 | 0.019 | 87.57 | 1.50 | 8.05 |
| 13 | 55 | 1.765 | 1000 | 0.093 | 0.420 | 0.053 | 67.71 | 3.47 | 3.10 |
| 14 | 55 | 0.93 | 1000 | 0.083 | 0.376 | 0.039 | 65.52 | 2.90 | 2.90 |
| 15 | 55 | 1.765 | 1000 | 0.093 | 0.420 | 0.053 | 67.71 | 3.47 | 3.10 |
| 16 | 40 | 1.765 | 1000 | 0.033 | 0.240 | 0.020 | 80.06 | 2.08 | 5.02 |
| 17 | 70 | 0.93 | 500 | 0.068 | 0.380 | 0.027 | 62.43 | 2.90 | 2.66 |
| 18 | 40 | 0.93 | 500 | 0.021 | 0.173 | 0.010 | 79.05 | 0.64 | 4.77 |
| 19 | 55 | 1.765 | 1000 | 0.093 | 0.420 | 0.053 | 67.71 | 3.47 | 3.10 |
| 20 | 70 | 1.765 | 1000 | 0.110 | 0.446 | 0.068 | 64.02 | 4.76 | 2.78 |
| Parameter | Unit | Uncertainty (%) |
|---|---|---|
| Experimental measurements | ||
| Inlet–outlet air temperature in fluidised bed-infrared dryer | °C | ±0.22 |
| Ambient air temperature | °C | ±0.22 |
| Drying cabinet inlet temperature | °C | ±0.22 |
| Drying cabinet outlet temperature | °C | ±0.22 |
| Weight loss of dried product | g | ±0.401 |
| Relative humidity of drying air | RH | ±0.80 |
| Drying air velocity | m/s | ±0.05 |
| Calculated parameters | ||
| Uncertainty in energy utilisation ratio (EUR) | − | ±0.0005 |
| Uncertainty in energy utilisation | kJ/s | ±0.004 |
| Uncertainty in exergy loss rate | kJ/s | ±0.0004 |
| Uncertainty in exergy efficiency | % | ±1.23 |
| Uncertainty in exergetic potential improvement rate | kJ/s | 0.20 |
| Uncertainty in sustainability index | − | 0.05 |
| EU | EUR | |||||||
|---|---|---|---|---|---|---|---|---|
| Source | SS | MS | F-Value | p-Value | SS | MS | F-Value | p-Value |
| Model | 0.0177 | 0.0020 | 48.31 | <0.0001 ** | 0.1588 | 0.0176 | 106.93 | <0.0001 * |
| A | 0.0087 | 0.0087 | 212.23 | <0.0001 ** | 0.0974 | 0.0974 | 590.31 | <0.0001 * |
| B | 0.0009 | 0.0009 | 22.01 | 0.0009 ** | 0.0143 | 0.0143 | 86.41 | <0.0001 * |
| C | 0.0068 | 0.0068 | 166.22 | <0.0001 ** | 0.0277 | 0.0277 | 168.11 | <0.0001 * |
| AB | 5.029 × 10⁻⁸ | 5.029 × 10⁻⁸ | 0.0012 | 0.9727 ns | 0.0001 | 0.0001 | 0.4495 | 0.5178 ns |
| AC | 4.155 × 10⁻⁶ | 4.155 × 10⁻⁶ | 0.1019 | 0.7562 ns | 5.665 × 10⁻⁶ | 5.665 × 10⁻⁶ | 0.0343 | 0.8567 ns |
| BC | 0.0002 | 0.0002 | 3.72 | 0.0828 ns | 0.0012 | 0.0012 | 7.34 | 0.0219 * |
| A2 | 0.0007 | 0.0007 | 18.33 | 0.0016 * | 0.0083 | 0.0083 | 50.53 | <0.0001 ** |
| B2 | 0.0000 | 0.0000 | 0.9071 | 0.3633 ns | 0.0006 | 0.0006 | 3.61 | 0.0865 ns |
| C2 | 0.0000 | 0.0000 | 0.2896 | 0.6023 ns | 0.0011 | 0.0011 | 6.49 | 0.0290 * |
| Residual | 0.0004 | 0.0000 | 0.0016 | 0.0002 | ||||
| Lack of Fit | 0.0004 | 0.0001 | 3.70 | 0.0885 ns | 0.0016 | 0.0003 | 1.65 | 0.2980 ns |
| Pure Error | 0.0000 | 0.0000 | 0.0000 | 0.0000 | ||||
| Cor Total | 0.0181 | 0.1604 | ||||||
| C.V. % | 7.64 | 3.37 |
| Source | Std. Dev. | R2 | Adj. R2 | Pred. R2 | PRESS | Adeq Precision | |
|---|---|---|---|---|---|---|---|
| EU | 28.75 | ||||||
| Linear | 0.0106 | 0.9003 | 0.8816 | 0.8364 | 0.0030 | ||
| 2FI | 0.0113 | 0.9089 | 0.8669 | 0.5754 | 0.0077 | ||
| Quadratic | 0.0064 | 0.9775 | 0.9573 | 0.7878 | 0.0038 | Suggested | |
| Cubic | 0.0039 | 0.9950 | 0.9843 | −5.1028 | 0.1107 | Aliased | |
| EUR | 41.64 | ||||||
| Linear | 0.0363 | 0.8689 | 0.8443 | 0.7907 | 0.0336 | ||
| 2FI | 0.0390 | 0.8769 | 0.8201 | 0.4186 | 0.0933 | ||
| Quadratic | 0.0128 | 0.9897 | 0.9805 | 0.9515 | 0.0078 | Suggested | |
| Cubic | 0.0161 | 0.9903 | 0.9692 | −10.9502 | 1.92 | Aliased |
| EXeff | EXloss | |||||||
|---|---|---|---|---|---|---|---|---|
| Source | SS | MS | F-Value | p-Value | SS | MS | F-Value | p-Value |
| Model | 1313.73 | 145.97 | 152.74 | <0.0001 ** | 0.0083 | 0.0028 | 66.17 | <0.0001 ** |
| A | 812.94 | 812.94 | 850.63 | <0.0001 ** | 0.0029 | 0.0029 | 69.27 | <0.0001 ** |
| B | 199.78 | 199.78 | 209.05 | <0.0001 ** | 0.0014 | 0.0014 | 33.26 | <0.0001 ** |
| C | 221.79 | 221.79 | 232.08 | <0.0001 ** | 0.0040 | 0.0040 | 95.99 | <0.0001 ** |
| AB | 4.46 | 4.46 | 4.66 | 0.0562 ns | ||||
| AC | 25.18 | 25.18 | 26.35 | 0.0004 ** | ||||
| BC | 1.43 | 1.43 | 1.50 | 0.2487 ns | ||||
| A2 | 25.37 | 25.37 | 26.54 | 0.0004 ** | ||||
| B2 | 0.1576 | 0.1576 | 0.1649 | 0.6933 ns | ||||
| C2 | 0.0529 | 0.0529 | 0.0553 | 0.8188 ns | ||||
| Residual | 9.56 | 0.9557 | 0.0007 | 0.0000 | ||||
| Lack of Fit | 9.56 | 1.91 | 1.59 | 0.3110 ns | 0.0007 | 0.0001 | 3.54 | 0.871 ns |
| Pure Error | 0.0000 | 0.0000 | 0.0000 | 0.0000 | ||||
| Cor Total | 1323.29 | 0.0089 | ||||||
| C.V. % | 1.40 | 13.13 |
| Source | Std. Dev. | R2 | Adj. R2 | Pred. R2 | PRESS | Adeq Precision | |
|---|---|---|---|---|---|---|---|
| Exeff | 52.64 | ||||||
| Linear | 2.36 | 0.9329 | 0.9203 | 0.8777 | 161.90 | ||
| 2FI | 2.11 | 0.9564 | 0.9363 | 0.8022 | 261.80 | ||
| Quadratic | 0.9776 | 0.9928 | 0.9863 | 0.9584 | 55.09 | Suggested | |
| Cubic | 0.9575 | 0.9958 | 0.9868 | −4.1073 | 6758.38 | Aliased | |
| Exloss | 33.78 | ||||||
| Linear | 0.0064 | 0.9254 | 0.9114 | 0.8581 | 0.0013 | Suggested | |
| 2FI | 0.0056 | 0.9543 | 0.9332 | 0.7816 | 0.0019 | ||
| Quadratic | 0.0046 | 0.9763 | 0.9549 | 0.7637 | 0.0021 | ||
| Cubic | 0.0018 | 0.9979 | 0.9934 | −1.5465 | 0.0227 | Aliased |
| SI | ||||||||
|---|---|---|---|---|---|---|---|---|
| Source | SS | MS | F-Value | p-Value | SS | MS | F-Value | p-Value |
| Model | 31.60 | 5.27 | 297.95 | <0.0001 ** | 33.52 | 3.72 | 64.67 | <0.0001 ** |
| A | 13.29 | 13.29 | 751.91 | <0.0001 ** | 17.18 | 17.18 | 298.39 | <0.0001 ** |
| B | 6.87 | 6.87 | 388.62 | <0.0001 ** | 5.24 | 5.24 | 91.06 | <0.0001 ** |
| C | 9.81 | 9.81 | 555.25 | <0.0001 ** | 4.51 | 4.51 | 78.36 | <0.0001 ** |
| AB | 0.7059 | 0.7059 | 39.94 | <0.0001 ** | 1.13 | 1.13 | 19.58 | 0.0013 ** |
| AC | 0.7306 | 0.7306 | 41.34 | <0.0001 ** | 0.3534 | 0.3534 | 6.14 | 0.0327 * |
| BC | 0.1886 | 0.1886 | 10.67 | 0.0061 ** | 0.8064 | 0.8064 | 14.00 | 0.0038 ** |
| A2 | - | - | 1.51 | 1.51 | 0.0005 ** | |||
| B2 | - | - | 0.0554 | 0.0554 | 0.3499 ns | |||
| C2 | - | - | 0.0521 | 0.0521 | 0.3640 ns | |||
| Residual | 0.2298 | 0.0177 | 0.5759 | 0.0576 | ||||
| Lack of Fit | 0.2298 | 0.0287 | 2.56 | 0.1582 ns | 0.5759 | 0.1152 | 2.84 | 0.1380 ns |
| Pure Error | 0.0000 | 0.0000 | 0.0000 | 0.0000 | ||||
| Cor Total | 31.82 | 34.10 | ||||||
| C.V. % | 3.83 | 6.61 |
| Source | Std. Dev. | R2 | Adj. R2 | Pred. R2 | PRESS | Adeq Precision | |
|---|---|---|---|---|---|---|---|
| 75.57 | |||||||
| Linear | 0.3405 | 0.9417 | 0.9308 | 0.8680 | 4.20 | ||
| 2FI | 0.1329 | 0.9928 | 0.9894 | 0.9758 | 0.7689 | Suggested | |
| Quadratic | 0.1283 | 0.9948 | 0.9902 | 0.9588 | 1.31 | ||
| Cubic | 0.0204 | 0.9999 | 0.9998 | 0.9039 | 3.06 | Aliased | |
| SI | 31.90 | ||||||
| Linear | 0.6687 | 0.7902 | 0.7508 | 0.5929 | 13.88 | ||
| 2FI | 0.6118 | 0.8573 | 0.7914 | 0.0384 | 32.78 | ||
| Quadratic | 0.2400 | 0.9831 | 0.9679 | 0.8001 | 6.82 | Suggested | |
| Cubic | 0.0449 | 0.9996 | 0.9989 | 0.5650 | 14.83 | Aliased |
Publisher’s Note: MDPI stays neutral with regard to jurisdictional claims in published maps and institutional affiliations. |
© 2022 by the authors. Licensee MDPI, Basel, Switzerland. This article is an open access article distributed under the terms and conditions of the Creative Commons Attribution (CC BY) license (https://creativecommons.org/licenses/by/4.0/).
Share and Cite
Golpour, I.; Kaveh, M.; Blanco-Marigorta, A.M.; Marcos, J.D.; Guiné, R.P.F.; Chayjan, R.A.; Khalife, E.; Karami, H. Multi-Response Design Optimisation of a Combined Fluidised Bed-Infrared Dryer for Terebinth (Pistacia atlantica L.) Fruit Drying Process Based on Energy and Exergy Assessments by Applying RSM-CCD Modelling. Sustainability 2022, 14, 15220. https://doi.org/10.3390/su142215220
Golpour I, Kaveh M, Blanco-Marigorta AM, Marcos JD, Guiné RPF, Chayjan RA, Khalife E, Karami H. Multi-Response Design Optimisation of a Combined Fluidised Bed-Infrared Dryer for Terebinth (Pistacia atlantica L.) Fruit Drying Process Based on Energy and Exergy Assessments by Applying RSM-CCD Modelling. Sustainability. 2022; 14(22):15220. https://doi.org/10.3390/su142215220
Chicago/Turabian StyleGolpour, Iman, Mohammad Kaveh, Ana M. Blanco-Marigorta, José Daniel Marcos, Raquel P. F. Guiné, Reza Amiri Chayjan, Esmail Khalife, and Hamed Karami. 2022. "Multi-Response Design Optimisation of a Combined Fluidised Bed-Infrared Dryer for Terebinth (Pistacia atlantica L.) Fruit Drying Process Based on Energy and Exergy Assessments by Applying RSM-CCD Modelling" Sustainability 14, no. 22: 15220. https://doi.org/10.3390/su142215220