Article

Productive and Nutritional Characteristics of Native Grasses from the Floodplain Banks Ecosystem in the Colombian Orinoquia

by
Arcesio Salamanca-Carreño
1,*,
Mauricio Vélez-Terranova
2,
Oscar M. Vargas-Corzo
3,
Pere M. Parés-Casanova
4 and
Jannet Bentez-Molano
1
1
Facultad de Medicina Veterinaria y Zootecnia, Universidad Cooperativa de Colombia, Villavicencio 500001, Colombia
2
Facultad de Ciencias Agropecuarias, Universidad Nacional de Colombia, Palmira 763531, Colombia
3
Fedegan-Fondo Nacional del Ganado, Arauca 810001, Colombia
4
Escola Agrària del Pirineu, Finca de les Colomines, 25712 Bellestar, Spain
*
Author to whom correspondence should be addressed.
Sustainability 2022, 14(22), 15151; https://doi.org/10.3390/su142215151
Submission received: 13 September 2022 / Revised: 9 November 2022 / Accepted: 10 November 2022 / Published: 15 November 2022

Abstract

:
Productive and nutritional evaluations of native grasses are usually scarce, limiting their use in the feeding of herbivorous species. This study aims to determine the forage yield and nutritional value of native grasses from the floodplain “banks” ecosystem in the Colombian Orinoquia. Four native grasses (Paspalum plicatulum, Axonopus compresus, Axonopus purpussi, and Paspalum spp.) and a “control” grass (introduced Brachiaria hybrid cv. Mulato) were sown and sampled at 30, 40, and 50 days of age. On each sampling date, biomass production in a 1 m2 frame was estimated, and the chemical composition was analyzed using near-infrared spectroscopy. Data analysis included repeated measures analysis, correlations, and multiple linear regression. The grasses’ nutritional characteristics varied as follows: dry matter (DM, 0.9–2.5 ton/ha), crude protein (CP, 4.3–10.2%), neutral detergent fiber (NDF, 61–73.9%) ash (3.2–8.7%), and dry matter digestibility (DMD, 50.8–56.3%). P. plicatulum achieved comparable forage production to that of the “control” grass. A. purpussi, Paspalum sp., and P. plicatulum presented similar CP and ash contents, and a higher Ca:P ratio. Regression analysis indicated that DMD was affected by the CP and acid detergent fiber (ADF) levels. These native grasses constitute promising nutritional alternatives that must be considered in the region’s livestock-production systems; however, detailed studies to evaluate animal performance and consumption are still required.

1. Introduction

Grasslands comprise 26% of global land and are constituted mainly of grasses, with a lesser presence of shrubs and trees (<10%) [1,2]. Most grasslands are in developing countries under tropical conditions and constitute an important resource for the livelihoods of close to 200 million people in semiarid and arid zones; similarly, these ecosystems provide the main feed alternative for raising livestock in grazing conditions. The flora biodiversity of natural grasslands constitutes a valuable alternative to improve livestock production and to promote the exploitation of different ecosystem services to guarantee environmental conservation [1,2].
Floodplain savannahs are located within the departments of Arauca and Casanare in the Colombian Orinoquia region and form part of the tropical savannahs [3,4,5]. This ecosystem covers more than 5 million hectares, and extensive livestock production has developed as one of the main economic activities in the region [6]. A rainfall regime from April to November occurs in the area, during which the savannahs are flooded by rain and water from the overflow of the main rivers. The dry season extends from December to March, with a water deficit that severely limits forage availability and agricultural production [6,7]. The soils are moderately fertile and exhibit drainage limitations [8]. This ecosystem retains special characteristics, given the climatic seasonality and water and nutrient dynamics [4,5]. The floodplain ecosystem is composed of different strata known as physiographic positions, which are defined by relief, water dynamics, and drainage. The highest areas include the “banks” where diverse native grasses grow and support livestock activity during the rainy season, when the lowest parts of the zone are flooded [6,7,9] In the “banks” physiographic position, common native grasses include Paspalum plicatulum Michx (black grass), Axonopus purpusii (Mez) Chase (Guaratara grass), Axonopus compressus (Sw.) P. Beauv (Gegei grass), and Paspalum sp.(L.) L., as well as introduced grasses, mainly of the Brachiaria genus. The native forage availability varies according to the physiographic position and climatic season, with some disappearing during the rainy season and others during the dry period. A high diversity of native plant species is generally observed in the “banks” that are mainly used for grazing ruminants and soil cover [10].
Despite the vast grasses diversity in the “bank” ecosystem, few studies have been conducted to evaluate the forage potential and nutritional composition of many of these native savannah floodplain species [3,6,7], possibly because it is a difficult task due to the vegetation’s high spatial and temporal heterogeneity [11]. Some authors affirmed that native grasses, such as Axonopus purpusii or Leersia hexandra, present protein contents between 5 and 10.3%, which are higher than those of some Brachiarias species grown in the zone [6,12]. These reports are promising; however, detailed studies on the productive behavior and nutritional value of the great diversity of plants present in this ecosystem are still required. In this way, it is possible to identify promising species that can be used in the nutrition of ruminant animals in the region.
Due to the lack of knowledge of the properties of native grasses, many of them are currently being replaced by introduced grasses (e.g., Brachiaria sp.), with the belief that they are more productive and present higher nutritional value [13]. In general, introduced grasses are expected to be more productive and have higher nutritional quality than native species [13]; however, this hypothesis has yet to be rigorously validated through direct experimental studies within the floodplain ecosystem, as biomass production and quality vary with edaphoclimatic conditions [14,15].
The forage yield and nutritional evaluation of native plants of flooded savannahs are important to determine their biomass production and the chemical composition variability. Forage nutritional quality analysis is based on several metrics, and the most frequently reported include dry matter (plant tissue remaining after drying), crude proteins, and fibers (cellulose, hemicellulose, and lignin), and their digestibility (potential plant tissue that can be digested by herbivores). Similarly, the contents of energy, ash, and some specific mineral components are also considered [16,17]. These metrics are used in conjunction to evaluate the nutritional potential of forage and to estimate animal performance in terms of milk, meat, reproduction, etc. [18,19]. In this way, knowledge of forage’s nutritive value is a required prerequisite to establishing adequate and sustainable use of pastures [16,17]. Usually, wet chemical methods are used to evaluate forage’s nutritional composition; however, these procedures are expensive and time-consuming. An alternative method known as near-infrared spectroscopy (NIRS) has emerged to provide a faster, cheaper, and more accurate technique to determine the chemical composition of forage. The NIRS reliability depends on the calibration equations developed to estimate nutrient concentrations. Once the equations are established, the NIRS allows the estimation of several nutrient concentrations simultaneously in a fast and easy-to-handle operation [19,20].
Knowledge of the nutritional composition of native grasses to flooded savannahs will contribute to the valuation and conservation of the native germplasm [21]. This information will encourage local producers to use and spread these native genetic resources, given their adaptive traits to the existing climatic conditions [22]. The implementation of alternative feed resources for grazing animals by local producers will contribute to farm profitability, as native pastures are the most-abundant and lowest-cost feed sources [23]. Native grasses not only are important as feed sources for grazing animals, but also for environmental services and habitat provision for wildlife [10,24]. These genetic resources could present a forage potential that can be exploited to improve animal performance without affecting the natural ecosystem and increasing the resilience of productive systems against climate change scenarios [10,25,26]. We hypothesize that, under conventional floodplain banks ecosystem management, some native plants will perform better than some introduced species in terms of forage yield and quality. The aim of this study was to determine the forage yield and nutritional value of native grasses adapted to the physiographic position of “banks” in the floodplain savannahs of the Colombian Orinoquia.

2. Materials and Method

2.1. Study Site

This study was conducted at the Clarinetero Territorial Division Center, Villa Cristina farm, municipality of Arauca, eastern Colombia (Figure 1). The region is characterized by flat and floodable savannah topography with the presence of the “banks” physiographic position (latitude: 7°08′17″ N, longitude: 70°59′59″ W, and altitude: 125 m) which constitute the highest areas of the flooded savannah ecosystem, and a diversity of pastures that serve as food for livestock, especially during the rainy season, when the lower areas remain flooded. The soils have a sandy loam texture, and according to Holdridge’s classification, the region corresponds to a subhumid tropical forest zone [27].
During the research period (June–November 2021, rainy season), climate data were collected with a portable weather station located approximately 600 m from the experimental site. The highest average temperature was 33.4 °C (October), and the lowest was 22.1 °C (November). The total precipitation during the grass growth cycle was 825.4 mm, and the average relative humidity was 90.7%.
Nineteen soil samples of 0.8–1 kg at a depth of 30 cm were collected using a shovel. The samples were stored in sealed plastic bags; later, they were pre-dried under natural environmental conditions until they reached a moisture content between 15% and 24%. The samples were pooled and sent to the laboratory to determine their characteristics following the procedures established in the Colombian Technical Standards (CTS) of the Colombian Institute of Technical Standards and Certification (ICONTEC). The soil pH was estimated using a potentiometer [28]. The total nitrogen was determined by the Kjendahl digestion method [29], while organic carbon was determined by the Walkley–Black method [30]. Soil-exchangeable bases (Na, Ca, Mg, and K) were determined by extraction with 1 N ammonium acetate at pH 7 [31], and microelements (Cu, Fe, Zn, and Mn) were estimated by atomic absorption spectrophotometry [32]. The soil available phosphorus was determined by extraction with Bray II solution [33] and boron was determined by ultraviolet–visible spectrophotometry [34]. The cation exchange capacity was estimated using the ammonium acetate saturation method [35], and exchangeable acidity determination (Al and H) was conducted by potassium chloride (KCl) extraction [36]. The soil texture was determined by the Bouyoucos method and the textural triangle [37]. The soil samples were analyzed in the Soil, Water, and Foliar Laboratory of the Universidad Nacional de Colombia, Orinoquia [38], and their physicochemical properties are shown in Table 1.

2.2. Evaluated Species

Native grasses included in the study were selected in a participatory manner with the livestock producers in the region. Previous meetings were held with livestock farmers associated with the livestock committee of the region to define the candidate grasses to evaluate according to their knowledge and observations of which were the most consumed by cattle. Similarly, the selection of other criteria was based on aspects related to the representativeness of the species in the “bank” physiographic position and forage biomass production. Brachiaria hybrid Mulato was included in the experiment as a “control” grass, as it is an introduced species commonly used in livestock systems in the region for grazing animals. The names and characteristics of the evaluated grasses (Table 2) were taken from Plants of the World Online.

2.3. Experimental Design

Each species was established in 9 m2 plots (3 m × 3 m; 1 m distance between plots) in triplicate under a completely randomized experimental design (Figure 2). A total of 15 experimental units were established in the “savannah bank” physiographic position during the region’s rainy season (June–November 2021).
The agronomic management for the establishment of each experimental plot included manual soil preparation, sowing, irrigation, and weed eradication. According to Table 1, an acidic soil with low P, K, Ca, Cu, and CEC levels and high Mn, Fe, B, and Zn was found. To complement essential nutrients for grass growth and guarantee optimal establishment of the plants, approximately 500 g of diammonium phosphate (16% N and 40% P2O5) was added to each plot at planting to ensure adequate N and P availability for the plants [39]. Sowing was performed with viable vegetative material (stolons, rhizomes, bunch, and stems) in morphological and sanitary terms. The plant density in the plots was as follows: P. plicatulum (232 plants/m2), A. purpussi (436 plants/m2), Paspalum sp. (619 plants/m2), B. hybrid Mulato (216 plants/m2), and A. compresus (362 plants/m2). The vegetative material was obtained from farms near the experimental area. Ninety-three days after the plots were established, a leveling cut was made 10 cm from the ground using a sickle, and the 50-day experimental period then began.
Height measurements were taken from the ground level to the longest leaf of an average of 15 plants in each experimental plot at 30, 40, and 50 days of age using a metric ruler. Then, grass samples were collected at each cutting time using a 1 m2 PVC frame by cutting the available material within the frame at 10 cm from the ground. On each sampling date, a grass sample was collected from each experimental plot. A Ranger precision balance was used to weigh the fresh sample obtained from each frame. Then, the samples were dried for 72 h at 60 °C in a Caloric brand electric oven. Based on the collected data, the fresh and dry matter yields per hectare were estimated. Each sample was stored in kraft paper bags and transported to the Analytical Chemistry Laboratory of the Agricultural Research Corporation (AGROSAVIA). The forage samples’ nutritional values were analyzed using near-infrared reflectance spectroscopy (NIRS). The dry forage samples were homogenized to ensure a similar particle size; subsequently, they were placed in a 50 mm-diameter ring cup and spectra were obtained using FOSS NIR Systems DS6500 model equipment by scanning in the range of 400–2498 nm. The reference and the new spectra data were handled with WinISI 4.7.0.0 (Foss, Hilleroed, Denmark) [19]. The used calibration equations were constructed with spectra from 2020 forage resources of three families (Grass forage, n = 1418; legume forage, n = 320; and other forage plants, n = 282) sampled since 2014–2016 from different livestock regions of Colombia [19]. The estimated variables were the dry matter (DM), crude protein (CP), neutral detergent fiber (NDF), acid detergent fiber (ADF), lignin, dry matter digestibility (DMD), ash (inorganic mineral fraction), calcium (Ca), and phosphorus (P).

2.4. Statistical Analysis

As the evaluated agronomic and nutritional quality variables presented a longitudinal structure, data were analyzed using a mixed model for repeated measures [40] through the following linear model:
Yijk = μ + Gi + Tj + (GT)ij + rk + εijk
where Yijk represents the nutritional quality variable observed in the “it” grass type and “jt” cutting age; μ represents the general average of the observed variable; Gi represents the fixed effect of “it” grass type (A. compresus, A. purpussi, B. Mulato (control), Paspalum sp., and P. plicatulum); Tj represents the fixed effect of “jt” cutting age (30, 40, or 50 days); (GT)ij represents the interaction effect between grass type and cutting age; rk represents the random effect corresponding to the kth repetition of each GT interaction; and εijk represents the random error term. It was assumed that rk and εijk were independent and distributed ∼ N (0, s2). When it was required, the evaluated models were corrected for heteroskedasticity using functions that related residual variances to the mean. Three covariance structures were analyzed to consider the relationships between repeated measures (independent errors, compound symmetry, and first-order autoregressive). The best model was selected using the Akaike and Bayesian information criteria. The analysis was performed using the “mixed and general linear models” option of the statistical software Infostat [41]. The least significant difference (LSD) was used for mean differentiation (p < 0.05).
Furthermore, to evaluate the relationship between the nutritional quality parameters of the studied plants, the mean values of the variables were unified, and Spearman’s correlations were calculated (p < 0.05). Finally, a multiple linear regression analysis was conducted to predict DMD, as this fraction constitutes the proportion of forage material potentially digestible by ruminants animals and is an important parameter to evaluate feed quality [42]. The nutritional composition variables (DM, CP, NDF, ADF, lignin, ashes, Ca, P, and plant height) were used as regressors. Due to the presence of correlated regressors, the “Backward” variable elimination method was used to identify those that were significant (p < 0.05). All the analyses were performed using the statistical package Infostat (Universidad de Córdoba, Córdoba, Argentina) [41].

3. Results

All of the evaluated productive and chemical composition variables showed statistical differences throughout the studied experimental period (p < 0.05), except for the green forage yield (GF). Thus, the results and discussion will focus on the evaluated grass type X cutting age interaction.

3.1. Forage Yield

The forage yield variables during the growth of the evaluated grasses under the “bank” physiographic position are shown in Table 3. Green forage production (tons/ha) did not undergo significant changes during the experimental period (p > 0.05). However, when the species and cutting day effects were evaluated independently, differences were observed (p < 0.05). The “control” grass and P. plicatulum had the highest yields, with values of 7.41 and 7.36 tons GF/ha, respectively. A. purpussi, Paspalum sp., and A. compresus plants presented GF production below that of the control grass by 28.3%, 36.2%, and 38.4%, respectively. A. purpussi yielded GF similarly to Paspalum sp. (5.31 and 4.73 tons GF/ha, respectively), while A. compresus yielded the least GF (3.82 tons GF/ha). In terms of cutting days, the highest green forage production occurred at 40 and 50 days, with 6.27 and 6.37 tons GF/ha, respectively.
DM production per hectare showed statistical differences during the experimental period (p < 0.05). On day 30, it was higher in the “control” grass than in the other evaluated plants (p < 0.05), with an estimated average yield of 1.6 tons DM/ha. On day 40, A. purpussi, Paspalum sp., and P. plicatulum grasses presented yields comparable to those of the control (1.5 to 1.9 tons DM/ha). On day 50, the highest DM production was found in the “control” grass and P. plicatulum, with values of 2.5 and 2.4 tons DM/ha, respectively.
The plants’ heights varied across all the studied grasses. In the three evaluated periods, the tallest plant in statistical terms was the “control” grass (100 cm to 107.4 cm), followed by P. plicatulum (76.6 cm to 93.6 cm), while the shortest plant was Paspalum sp. (14 cm to 31.6 cm). The heights of A. compresus and A. purpussi varied according to the evaluation period. A. compresus was taller than A. purpussi at 30 days (32 cm vs. 18.9 cm). However, an inverse situation was observed at 40 (32 cm vs. 37.8 cm) and 50 (33.6 cm vs. 44.2 cm) days.
The DM concentration in the “control” grass ranged from 21.6% to 31.3%. Paspalum sp. and A. compresus outperformed the “control” at 30 and 40 days (28.1% to 34%); however, this difference was not observed at 50 days. A. purpussi and P. plicatulum had values similar to those found in the “control” grass on days 30 and 40 (20% to 25.5%), but lower values on day 50 (Table 3).

3.2. Chemical Composition

The grasses’ nutritional compositions during the evaluated growth period are shown in Table 4. The CP content of the plants ranged from 4.3% to 10.2%. The CP concentration varied among the studied grasses. In the case of A. purpussi, Paspalum sp., and the “control” grass, the CP levels were reduced until day 40 and later stabilized between 4.4% and 7.4% until day 50. In A. compresus, the CP content presented a growing pattern during the experimental period, while in P. plicatulum the highest CP value was observed at 40 days, and then decreased until day 50. Despite the variability in the CP levels, those of native grasses were found to be similar to or higher than those of the “control” grass. At 30 days, grasses such as A. purpussi, Paspalum sp., and P. plicatulum presented 43.1%, 40.8%, and 29.2% higher CP values than those of the control (p < 0.05), with values ranging between 8.2% and 10%. At 40 days, P. plicatulum and A. purpussi maintained their superiority, along with the A. compresus plant (6% to 9.3%). At 50 days of age, A. compresus had the best performance (9.9%), while A. purpussi, the “control” grass, and Paspalum sp. presented similar values (6% to 7.4%), and P. plicatulum had the lowest yield (4.3%).
The ash content of the studied grasses varied between 3.2% and 8.7% (Table 4). In A. compresus and the “control” grass, the ash contents were reduced during the experimental period. In Paspalum sp., P. plicatulum, and A. purpussi, the ash concentration increased for up to 40 days before stabilizing. Throughout the experimental period, it was observed that, at 30 days, P. plicatulum showed the highest ash percentage (8%), while the other pastures had similar values between 5.7% and 6.8%. At 40 days, Paspalum sp. and P. plicatulum presented the highest ash levels (8.5% and 8.7% respectively), followed by A. purpussi (7.3%), while the lowest values were found in A. compresus and the “control” grass (5.6% and 6.1%, respectively). At 50 days, Paspalum sp. continued to exhibit the highest values (8.3%), followed by P. plicatulum and A. purpussi grass (5.7% and 6.5%, respectively), while A. compresus and the “control” grass presented the lowest percentages (3.2% and 3.8% respectively).
P. plicatulum grass showed the highest Ca values (0.25% to 0.66%) during the experimental period (p < 0.05), while those of the other native grasses ranged from 0.32% to 0.44%. The “control” plant had the lowest Ca value at 50 days (0.14%). On the other hand, the P concentrations were similar in all grasses (p < 0.05) at 30 and 50 days, with values between 0.22% and 0.27%. Statistical differences occurred at 40 days, where P. plicatulum and Paspalum sp. grasses presented the lowest values among the studied plants (0.2% on average).

3.3. Fiber Composition and Digestibility

The fiber fractions and DMD of the studied plants are presented in Table 5. The estimated NDF among pastures ranged between 61% and 73.9%. The NDF levels in P. plicatulum, Paspalum sp., the “control” grass, and A. purpussi increased over time (63.1% to 73.9%). The native A. compresus grass showed less variable NDF values during the experimental period (61% to 70%). No statistical differences were found in the NDF levels between the native grasses and the “control” grass (p > 0.05), except for A. compresus at 50 days, which had a lower value (61.0% vs. 71.1%).
The ADF content increased over time in most of the evaluated pastures, especially after 40 days of age. Among the studied plants, the ADF values ranged between 30.7% and 42.6%. In general, it was observed that the “control” grass had the lowest ADF percentages at 30 and 40 days (p < 0.05), with average values of 30.7% and 36.6%, respectively. At 50 days, no differences were found between A. purpussi, Paspalum sp., and the “control” grass (38.7–42.6%), while A. compresus and P. plicatulum exhibited the lowest values (35.4% and 38.6% respectively).
The lignin content varied between 7.8% and 10.9% in the studied grasses, with increasing values in Paspalum sp., P. plicatulum, and the “control grass” throughout the experimental period. Most of the native grasses presented lignin levels comparable to those of the “control” plant, except for A. compresus, which differed at 30 days with higher values (9.3% vs. 7.8%) and at 50 days with lower values (8.4% vs. 10.4%).
In this study, DMD decreased as the plants’ ages increased. In the case of A. compresus, initially, DMD remained stable before increasing in the final sampling phase. At 30 days, the A. purpussi and A. compresus grasses presented the highest and lowest DMD values (56% and 52.5%, respectively), while those of the other grasses were similar (54.4% to 55.1%). The P. plicatulum species outperformed the other grasses over the course of 40 days, with average values of 55.6%. Finally, on day 50, A. purpussi and A. compresus showed the highest digestibility (53.2% and 56.3% respectively), while those of the other grasses were similar (50.8% to 51.7%).

3.4. Association between Nutritional Composition Variables

The Spearman’s correlation coefficients between the nutritional composition variables are shown in Table 6. Positive associations among DM–ADF (r = 0.60), NDF–lignin (r = 0.82), ash–Ca (r = 0.79), and DMD–CP (r = 0.83) were found, while negative correlations among height–DM (r = −0.71), height–ADF (r = −0.71), DMD–NDF (r = −0.78), and DMD–lignin (r = −0.74) were estimated.
Multiple linear regression analysis showed that DMD was influenced by CP (p < 0.0001) and ADF (p < 0.0001) levels. The estimated equation presented the following form: DMD = 59.3 + 0.80 (CP) − 0.31 (ADF) + ε (R2 = 0.99; MSE = 0.002). The observed and predicted values obtained with the estimated model are presented in Figure 3. A clear linear tendency can be observed, indicating agreement among the analytical DMD values and those estimated by the regression model.

4. Discussion

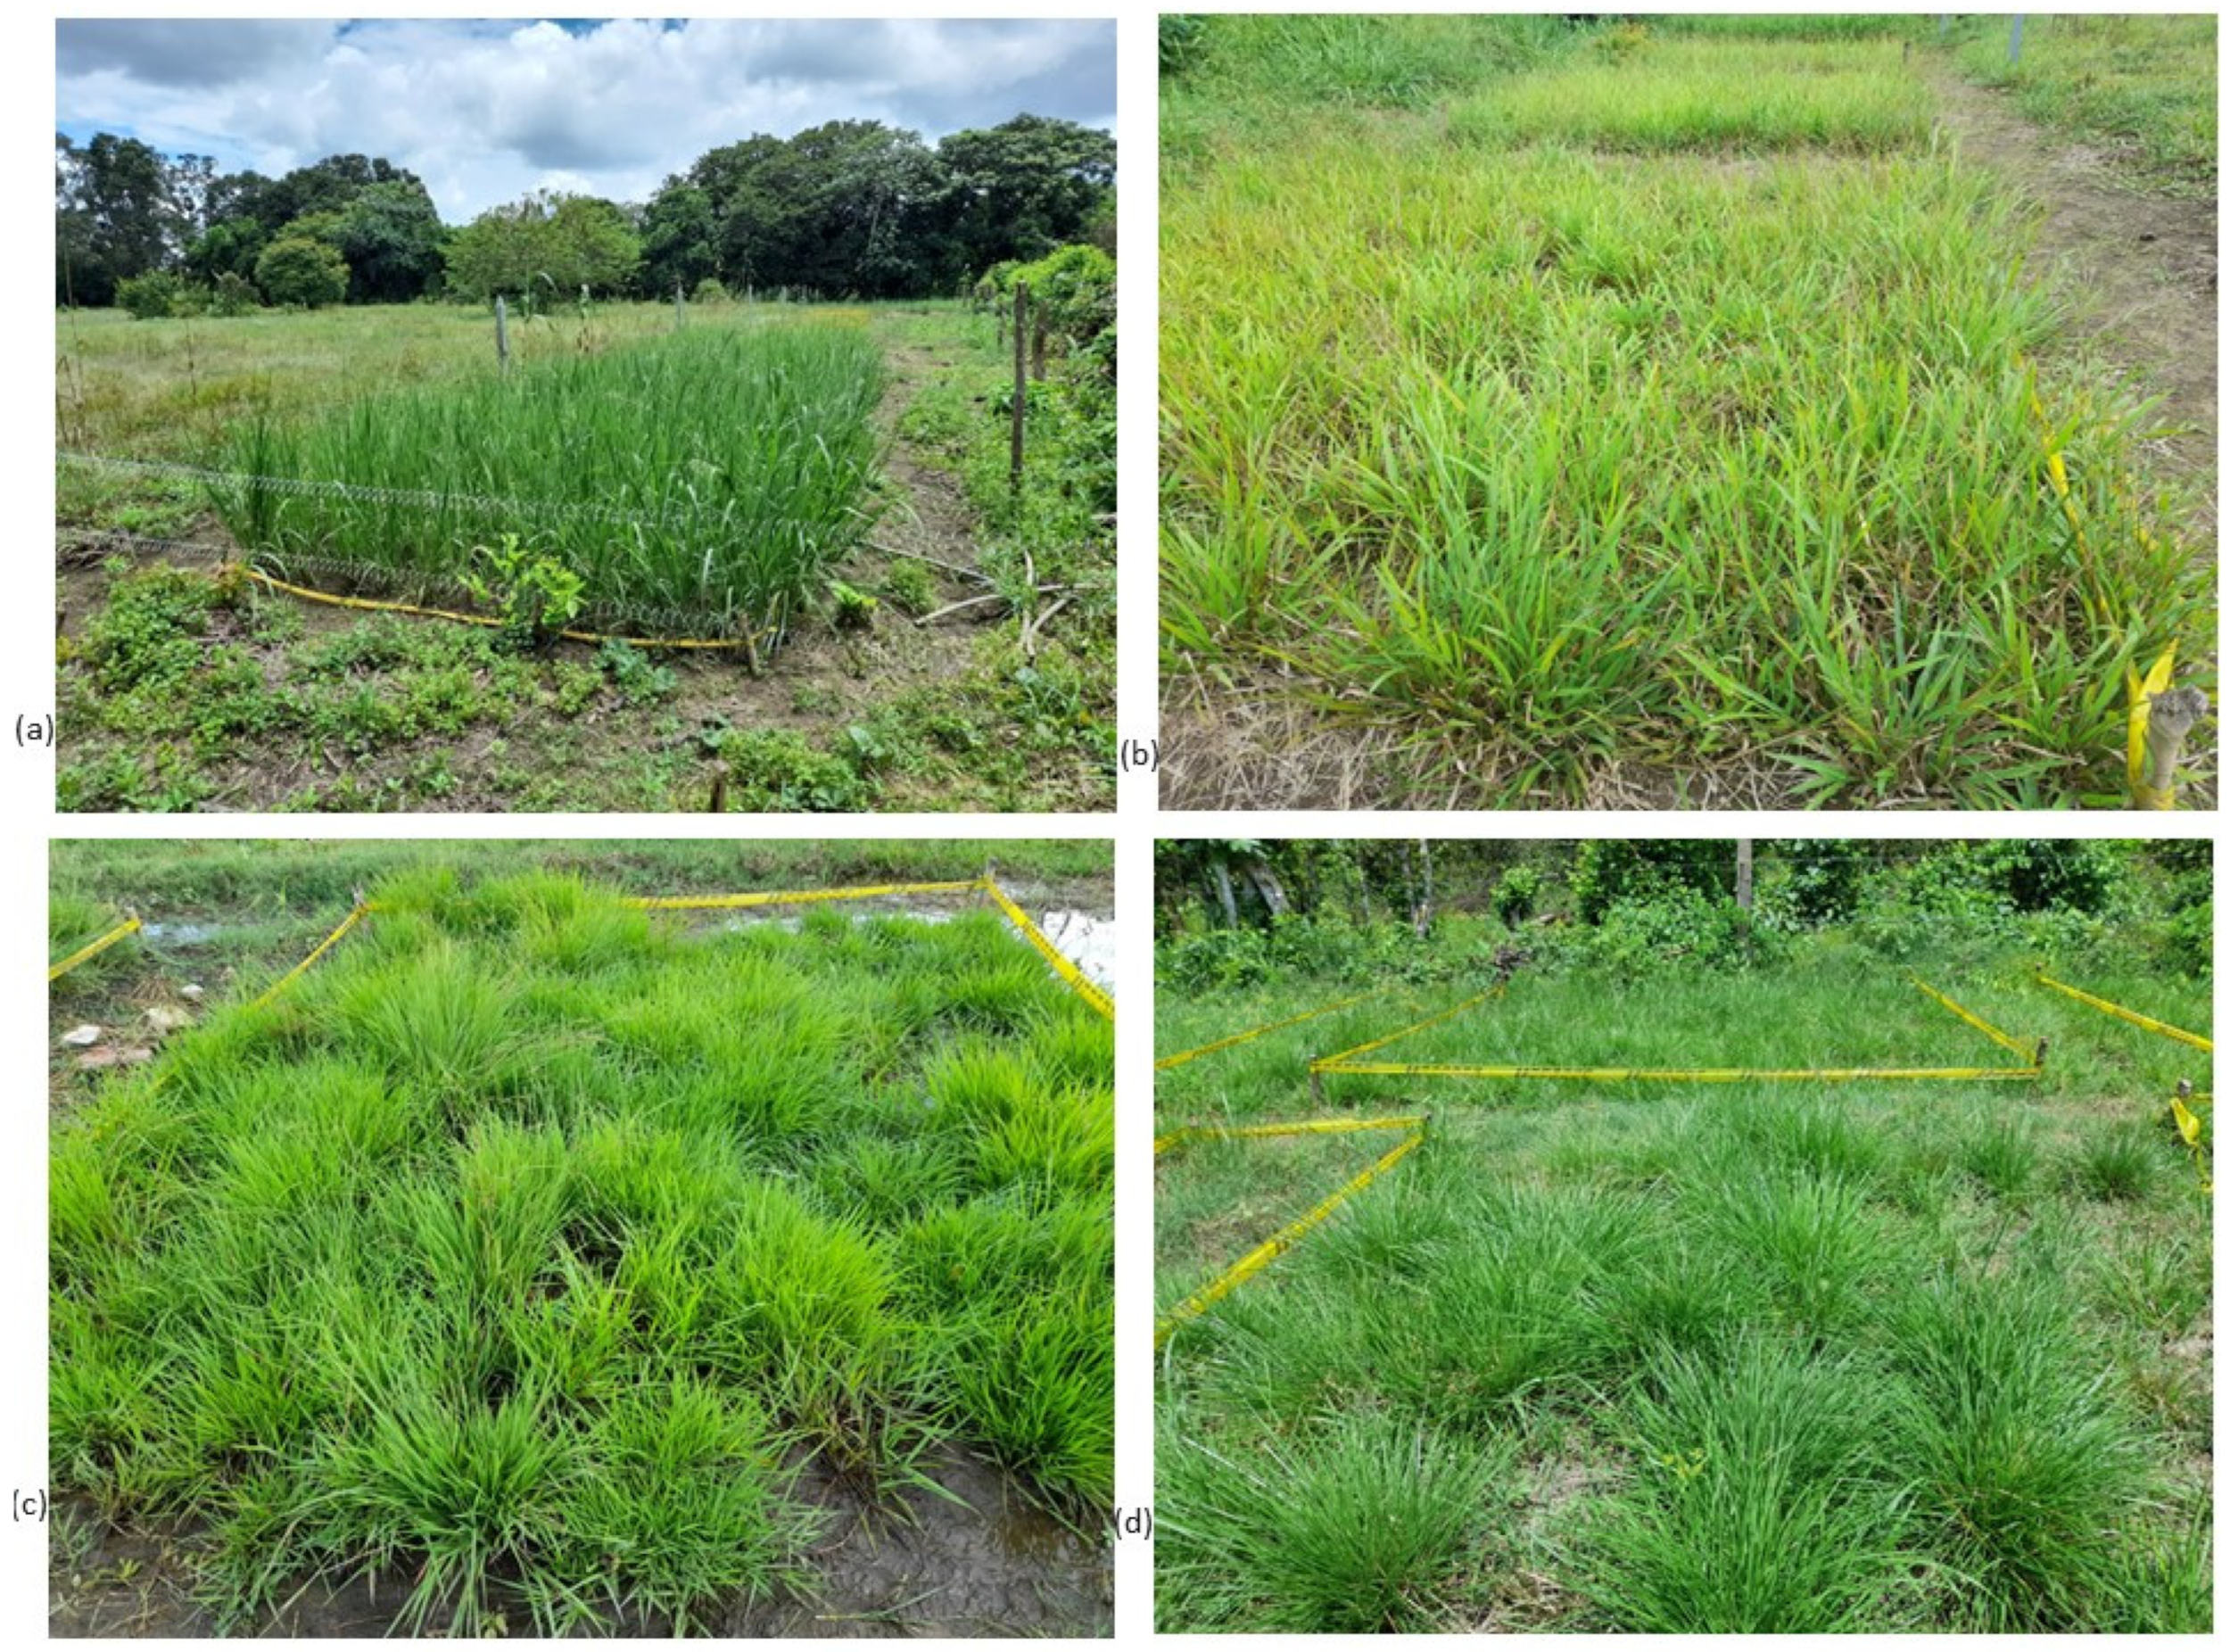
4.1. Forage Yield and Composition

The DM production in the “control” grass was similar to the averages of 2.1 to 2.5 tons/ha obtained at 28 and 33 days of growth during the dry season of tropical regions in Mexico and Colombia [43,44]. The forage yield analysis indicated that, in the “bank” physiographic position under floodplain savannah conditions, the biomass production of the native species P. plicatulum (on a fresh and dry matter basis) was comparable to that of the “control” grass until 50 days of age. This behavior was largely attributed to the similar morphological characteristics between both plants and their bunch growth habit, which provided them with similar growth traits and propagation mechanisms [17].
The height measured in the “control” grass was greater than the 61.93 cm and 64.92 cm values reported in other studies at 56 and 60 days of age [17,45]. However, it was similar to the 100 cm to 110 cm range observed at 51 and 54 days of growth [46]. Different height measurements can be due to differences in the soil’s physicochemical properties and climatic variables, such as rainfall and temperature [45]. The control and P. plicatulum species were the tallest plants among the studied grasses, which can also be attributed to the bunch growth habit of these species, which easily outperformed the other grasses with stoloniferous, rhizomatous, or decumbent growths patterns [17].
With respect to the DM concentrations, in the “control” grass, the values observed were similar to those found in the Colombian Caribbean and in different Brachiaria accessions [47,48]. In this study, the DM increased over time in all of the evaluated plants, which was expected, as this variable tended to increase as the plant reached maturity [49,50]. Grasses such as A. purpussi and P. plicatulum were similar to the “control” grass during the first 40 days (20% to 25.5%), while Paspalum sp. and A. compresus presented higher values during the same period (28.1% to 34%). The high DM content observed during the early to medium growth phase of these plants suggests a major proportion in the cell content and a lower fiber fraction. This suggests that potentially digestible fractions are conserved for a longer time, which is useful in livestock systems with long grazing periods [51].
The CP content of the evaluated grasses ranged between 4.3% and 10.2% during the experimental period, being comparable to the reports for other grasses grown under tropical environments in Latin American regions [14,52,53]. The CP concentration in the “control” grass was similar to the 7.7% average [43] and the 5.8% to 7.5% range obtained in 24 accessions of Brachiaria spp. [47]. In general, native grasses were found to be similar to or higher than the “control” plant in terms of CP concentration. These results suggest that, in the evaluated ecosystem, native plants presented physiological mechanisms of soil nitrogen extraction and utilization similar or superior to those of the control grass. In this way, native plants could also be considered as an alternative protein source under flooded savannah conditions. These results are interesting, as protein serves as an indicator of the nutritional potential of pastures [16] and is considered a limiting nutrient, especially in highly fibrous diets, such as those commonly found in tropical environments [54].
A. purpussi, Paspalum sp., and the “control” grass exhibited a drastic reduction in the CP content until 40 days, when it then stabilized. The reduction in the CP concentration over time is an expected behavior, as the metabolic activity of plants is reduced as they reach maturity [17,51,52]. Similarly, the stability achieved after 40 days suggests that the CP contents in these grasses were preserved for up to 50 days, and higher losses could be expected after this age. In A. compresus, the CP content presented a growing pattern during the experimental period, while in P. plicatulum, the highest CP value was found at 40 days, which then decreased until day 50. This suggests that A. compresus and P. plicatulum have slower maturation rates than other grasses, allowing them to use nitrogen efficiently for longer periods during the early growth phases [45]. This effect could be attributed to their adaptability to the floodable savannah agroecosystem.
The estimated ash levels (3.2% to 8.7%) were within the range found in other improved pastures commonly used in animal nutrition [47,52,55]. P. plicatulum, Paspalum sp., and A. purpussi exhibited higher ash concentrations than the control plant during the experimental period. These results confirm the differential abilities of native plants to extract minerals, even in acidic soil, with low exchangeable base and high microelement concentrations (Mn, Zn, B, and Fe), similar to those found in the evaluated soil. These results suggest the necessity to evaluate the individual mineral profile of the ash fraction in the studied native plants, because, under these conditions, plants can absorb these elements in excess, producing toxicity in the same plant and in the animals when they are consumed [56].
The ash reduction observed in A. compresus and the “control” grass during the experimental period could be related to changes in mineral requirements according to the phenological state [51]. Similarly, the soil type and other climatic variables, such as precipitation and temperature, can influence the availability of elements in the soil solution to be assimilated by a plant’s roots [55]. Otherwise, the ascending ash concentration until 40 days and the subsequent stabilization presented in Paspalum sp., P. plicatulum, and A. purpussi grasses is similar to the pattern observed in another report, where the ash content exhibited a quadratic behavior, reaching its maximum value at 40 days of age [55].
The Ca and P levels presented between the studied grasses were similar to those found in tropical forage grown in humid conditions [57]. Only P. plicatulum showed superiority in terms of the Ca levels compared with the control grass; however, in terms of the P concentrations, they were similar in all plants. Ca and P are important elements required in high concentrations as they are involved in different processes as enzyme activators (Ca) or constituents of organic compounds (P) [58]. The Ca:P ratio is a parameter widely used in animal nutrition to assess the availability, absorption, and utilization of these elements [15]. The expected range for the maintenance of optimal ruminal performance is between 1 and 7, resulting in increased possibility of metabolic disorders with higher values [59]. Among the studied grasses, Ca:P ratios between 0.61 and 2.54 were found, with the lowest value being associated with the “control” grass at 50 days. The native species had a minimum value of 1.14, suggesting adequate availability of these elements for animal nutrition.
The observed NDF values (61% to 73.9%) were consistent with those reported in Brachiaria and Panicum genera [44,45,60], as well as other grass species used for grazing herbivorous animals [52,55,57]. All grasses presented similar NDF concentrations during the experimental period. In P. plicatulum, Paspalum sp., and the “control” plant, the NDF levels increased over time because of cell wall component accumulation (cellulose, hemicellulose, and lignin) that usually occurs with advancing plant age and is commonly reported in forage grasses [17,55]. The native A. compresus plant showed relatively stable NDF values. Similar results have been reported for this species during the growth period between 21 and 63 days of age under tropical Mexican dry conditions [61]. The results suggest that, in A. compresus, significant growth of the cell wall components could occur after 50 days of age.
The ADF concentrations among the studied plants (30.7% and 42.6%) were in correspondence with the observed values in B. brizantha, B. humidicola, B. hybrid Mulato, and P. notatum under tropical conditions [44,57]. In this study, the control grass showed the lowest ADF values at 30 and 40 days; however, no difference was observed at 50 days with respect to that of the native plants. Under warm conditions typical of tropical areas, plants’ metabolic processes are accelerated, encouraging photosynthetic products to be used mainly in the continuous formation of cell wall components [53,62]. In native plants, this adaptive mechanism possibly develops in the early stages to guarantee their subsistence and longevity. This may be the reason for the higher cell wall lignification observed in native plants. On the other hand, in the A. compresus grass, the ADF increase rate was slower than that in the other grasses. This is similar to the observation of the NDF values and suggests that A. compresus grass presents a slower maturation rate within the “savannah bank” ecosystem.
Regarding the lignin content, the range found among grasses (7.8% to 10.9%) was also similar to that in the results reported in other species [44,57]. The lignin concentrations were comparable among the evaluated plants. However, it should be emphasized that the values in the “control” plant were higher than those reported for the same species in the Colombian Caribbean [43], different cultivars of B. brizantha, B. humidicola, and other grasses [55,62,63]. This can be attributed to the environmental effects, such as the high temperatures in the study area (>30 °C), which accelerate plant maturation, resulting in an increase in the cell wall content, including the lignin level [42,62].
In general terms, fiber variables (NDF, ADF, and lignin) presented similar behavior among the evaluated species. Fiber is important because it constitutes the partially digestible fraction in the gastrointestinal tract of herbivorous animals and is composed of complex polysaccharides, such as cellulose, hemicellulose, and pectin, as well as lignin, which is rich in phenolic compounds [64]. The fiber content increases as plants mature [51,52,65], and this effect is more intense in tropical species, with increases ranging from 11% to 18% when compared with temperate climate species [53]. This is consistent with the findings obtained in the present study, where increases in the fiber levels, especially in the lignin concentrations, were found. Adverse environmental conditions (high temperatures, solar radiation, and low precipitation) induce phenological and physiological changes in plants as an adaptation mechanism to prevent water loss, including the preference of energy expenditure for the formation of support and defense structures over leaf formation for rapid growth. In warm conditions, plants express traits that ensure their longevity, rather than those that promote rapid growth [53].
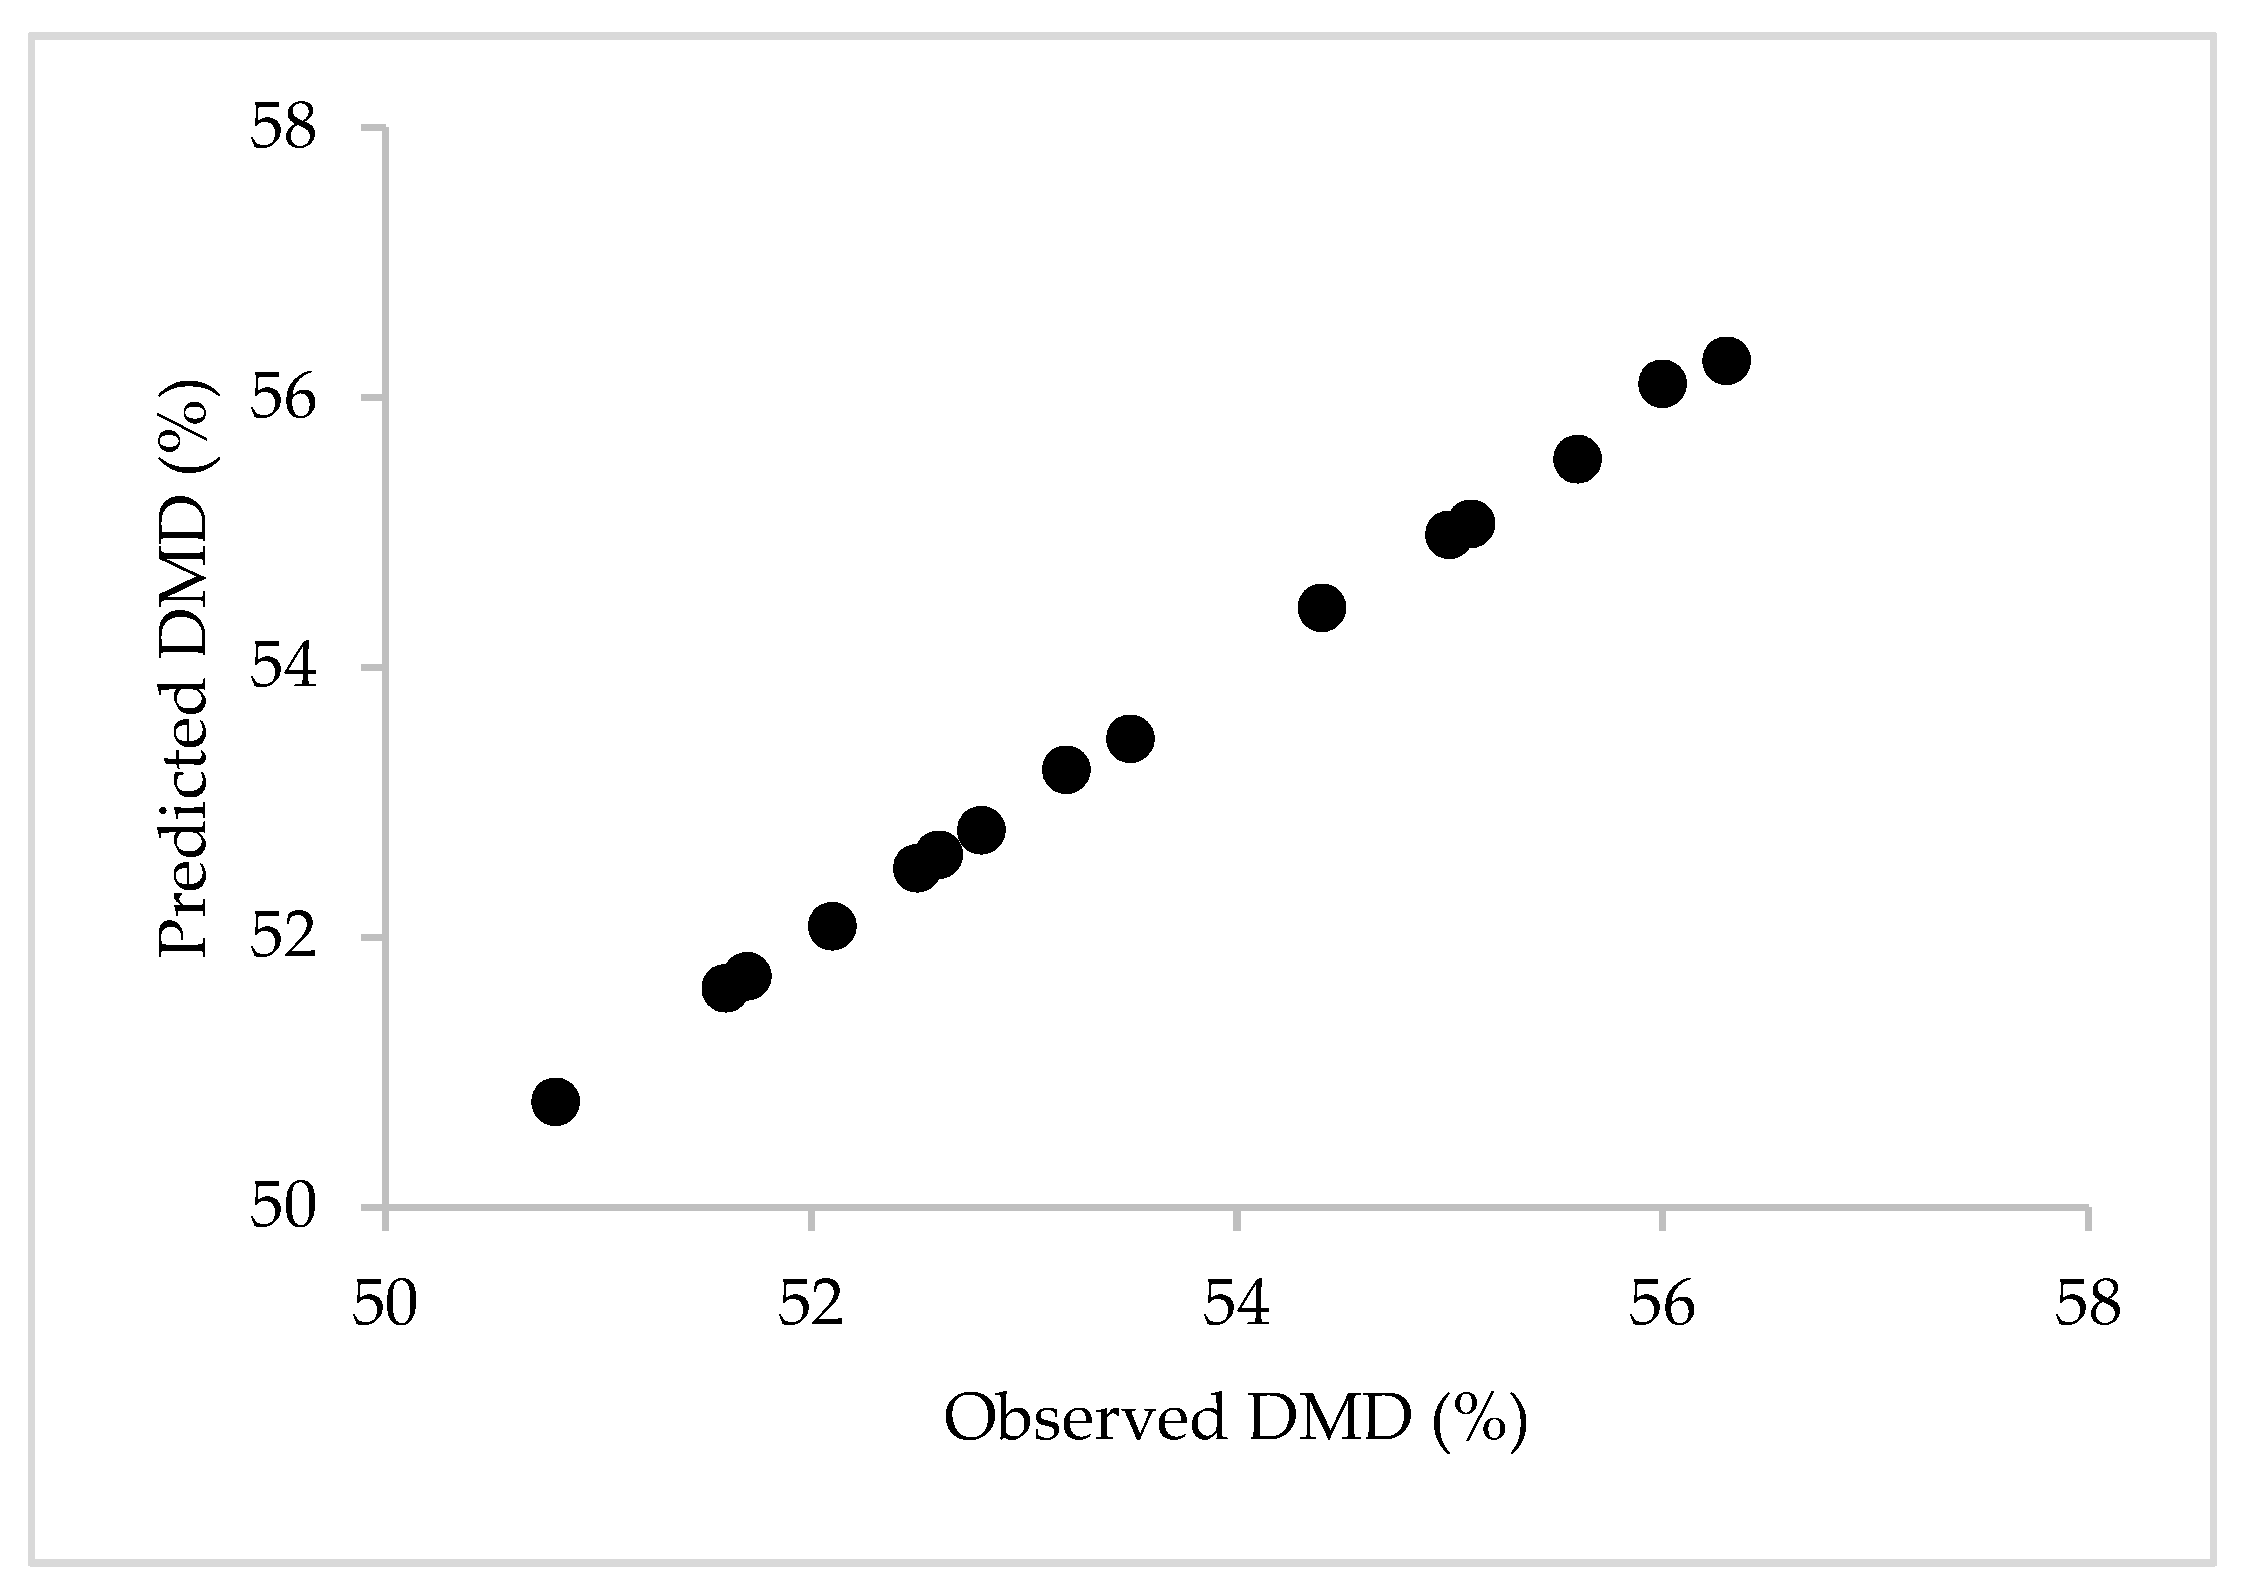
The estimated DMD values (50.8% to 56.3%) were comparable to those in other reports described in tropical pastures [14,53]. DMD is one of the main criteria for evaluating the nutritional potential of forage as a base diet in animal nutrition, as it represents the proportion of plant material that can be digested by herbivores [14,42]. Native grasses were comparable to the control plant in terms of DMD, although some of them, such as A. purpussi, P. plicatulum, and A. compresus, presented higher values during some of the evaluated periods. This occurred because, although these plants had fiber levels, similar to the control, their protein concentrations were higher, and under this condition, digestibility may be improved [66]. Generally, it was observed that DMD was reduced over time in all of the evaluated plants, which can be attributed to the negative association between DMD and the fiber content. Increases in the cellulose, hemicellulose, and lignin levels reduce forage digestibility and intake potential [42]. In the case of A. compresus, DMD remained stable at first before increasing in the final sampling phase. The lower fiber levels and constant DMD obtained in A. compresus allowed us to ensure that, under the evaluated conditions, this grass presented a lower maturation rate than the other species under study. However, this implied lower DM production per hectare, which was an undesirable characteristic as it would reduce the feed availability for animals.

4.2. Correlations and Regression Analysis

The DM levels were positively associated with ADF, which can be attributed to the fact that DM increases as the grass grows, causing cell wall thickening and thus an increase in fibrous components, including the ADF fraction [51]. These results are consistent with the positive correlation observed between the NDF and lignin contents, both of which are also part of the fibrous fraction and increase over time [51,52,65]. The ash and Ca levels also showed a direct correlation, which was expected because Ca was one of the elements present in the ash fraction.
In this study, the grasses’ heights showed negative correlations with the DM and ADF contents. As mentioned previously, as grasses reached maturity a parallel increase in the DM and fiber (ADF) content would also be expected [51,59]. However, the inverse relationship observed between these variables could be attributed to differences in growth habits among the evaluated plants. The bunch growth of the “control” grass and P. plicatulum implied a taller height than that of the other native species, which presented stoloniferous or rhizomatous growth. This behavior was reflected in data dispersion with an inverse relationship between the variables, which was declared statistically significant.
DMD presented a positive association with CP and a negative association with different fiber fractions, such as NDF and lignin. Reports in the literature indicate that digestibility is largely determined by the chemical composition of the plant, with higher values in plants with high CP contents and lower in those with high fiber values [14,52,53].
The result of multiple linear regression analysis showed that the CP and ADF levels significantly influenced the DMD. These results agree with those of other studies, which indicate that CP and ADF are two of the most important factors in determining the DMD of pastures [62]. The parameter’s magnitude suggests that, for a unit increase in the CP percentage and keeping the ADF constant, the DMD increased by 0.80%, while it decreased by 0.31% for a unit increase in the ADF level. Protein favors DMD because it can be easily degraded by ruminal microorganisms [66]. Grasses with a low protein content due to advanced maturity are less digestible [52]. Similarly, ADF is a nearly indigestible fraction composed of cellulose, lignin, cutting, and lignified proteins that limit the cell wall carbohydrate degradation at the ruminal level. Therefore, ADF is used to estimate the digestibility, energy content, and consumption potential of forage species [65,67].
Plants expressing adaptability traits, high forage biomass production, and nutritional quality are the best choices for grazing animals [64]. Understanding the productive and quality characteristics of forage species with nutritional potential is crucial for optimizing pasture management and establishing forage mixtures with desirable nutritional characteristics to ensure adequate animal consumption and productive performance [16]. The results obtained showed that, in the evaluated agroecosystem, native grasses performed similarly to the “control” grass in terms of the forage biomass production (P. plicatulum) and protein and fiber contents (P. plicatulum, A. purpussi, and Paspalum sp.), and exhibited higher mineral levels, including Ca and P. These observations are promising, especially because the observed performance was obtained without the use of agronomic management techniques, such as fertilization and irrigation. This suggests that an integrated management program can improve the productivity of native pastures [23].
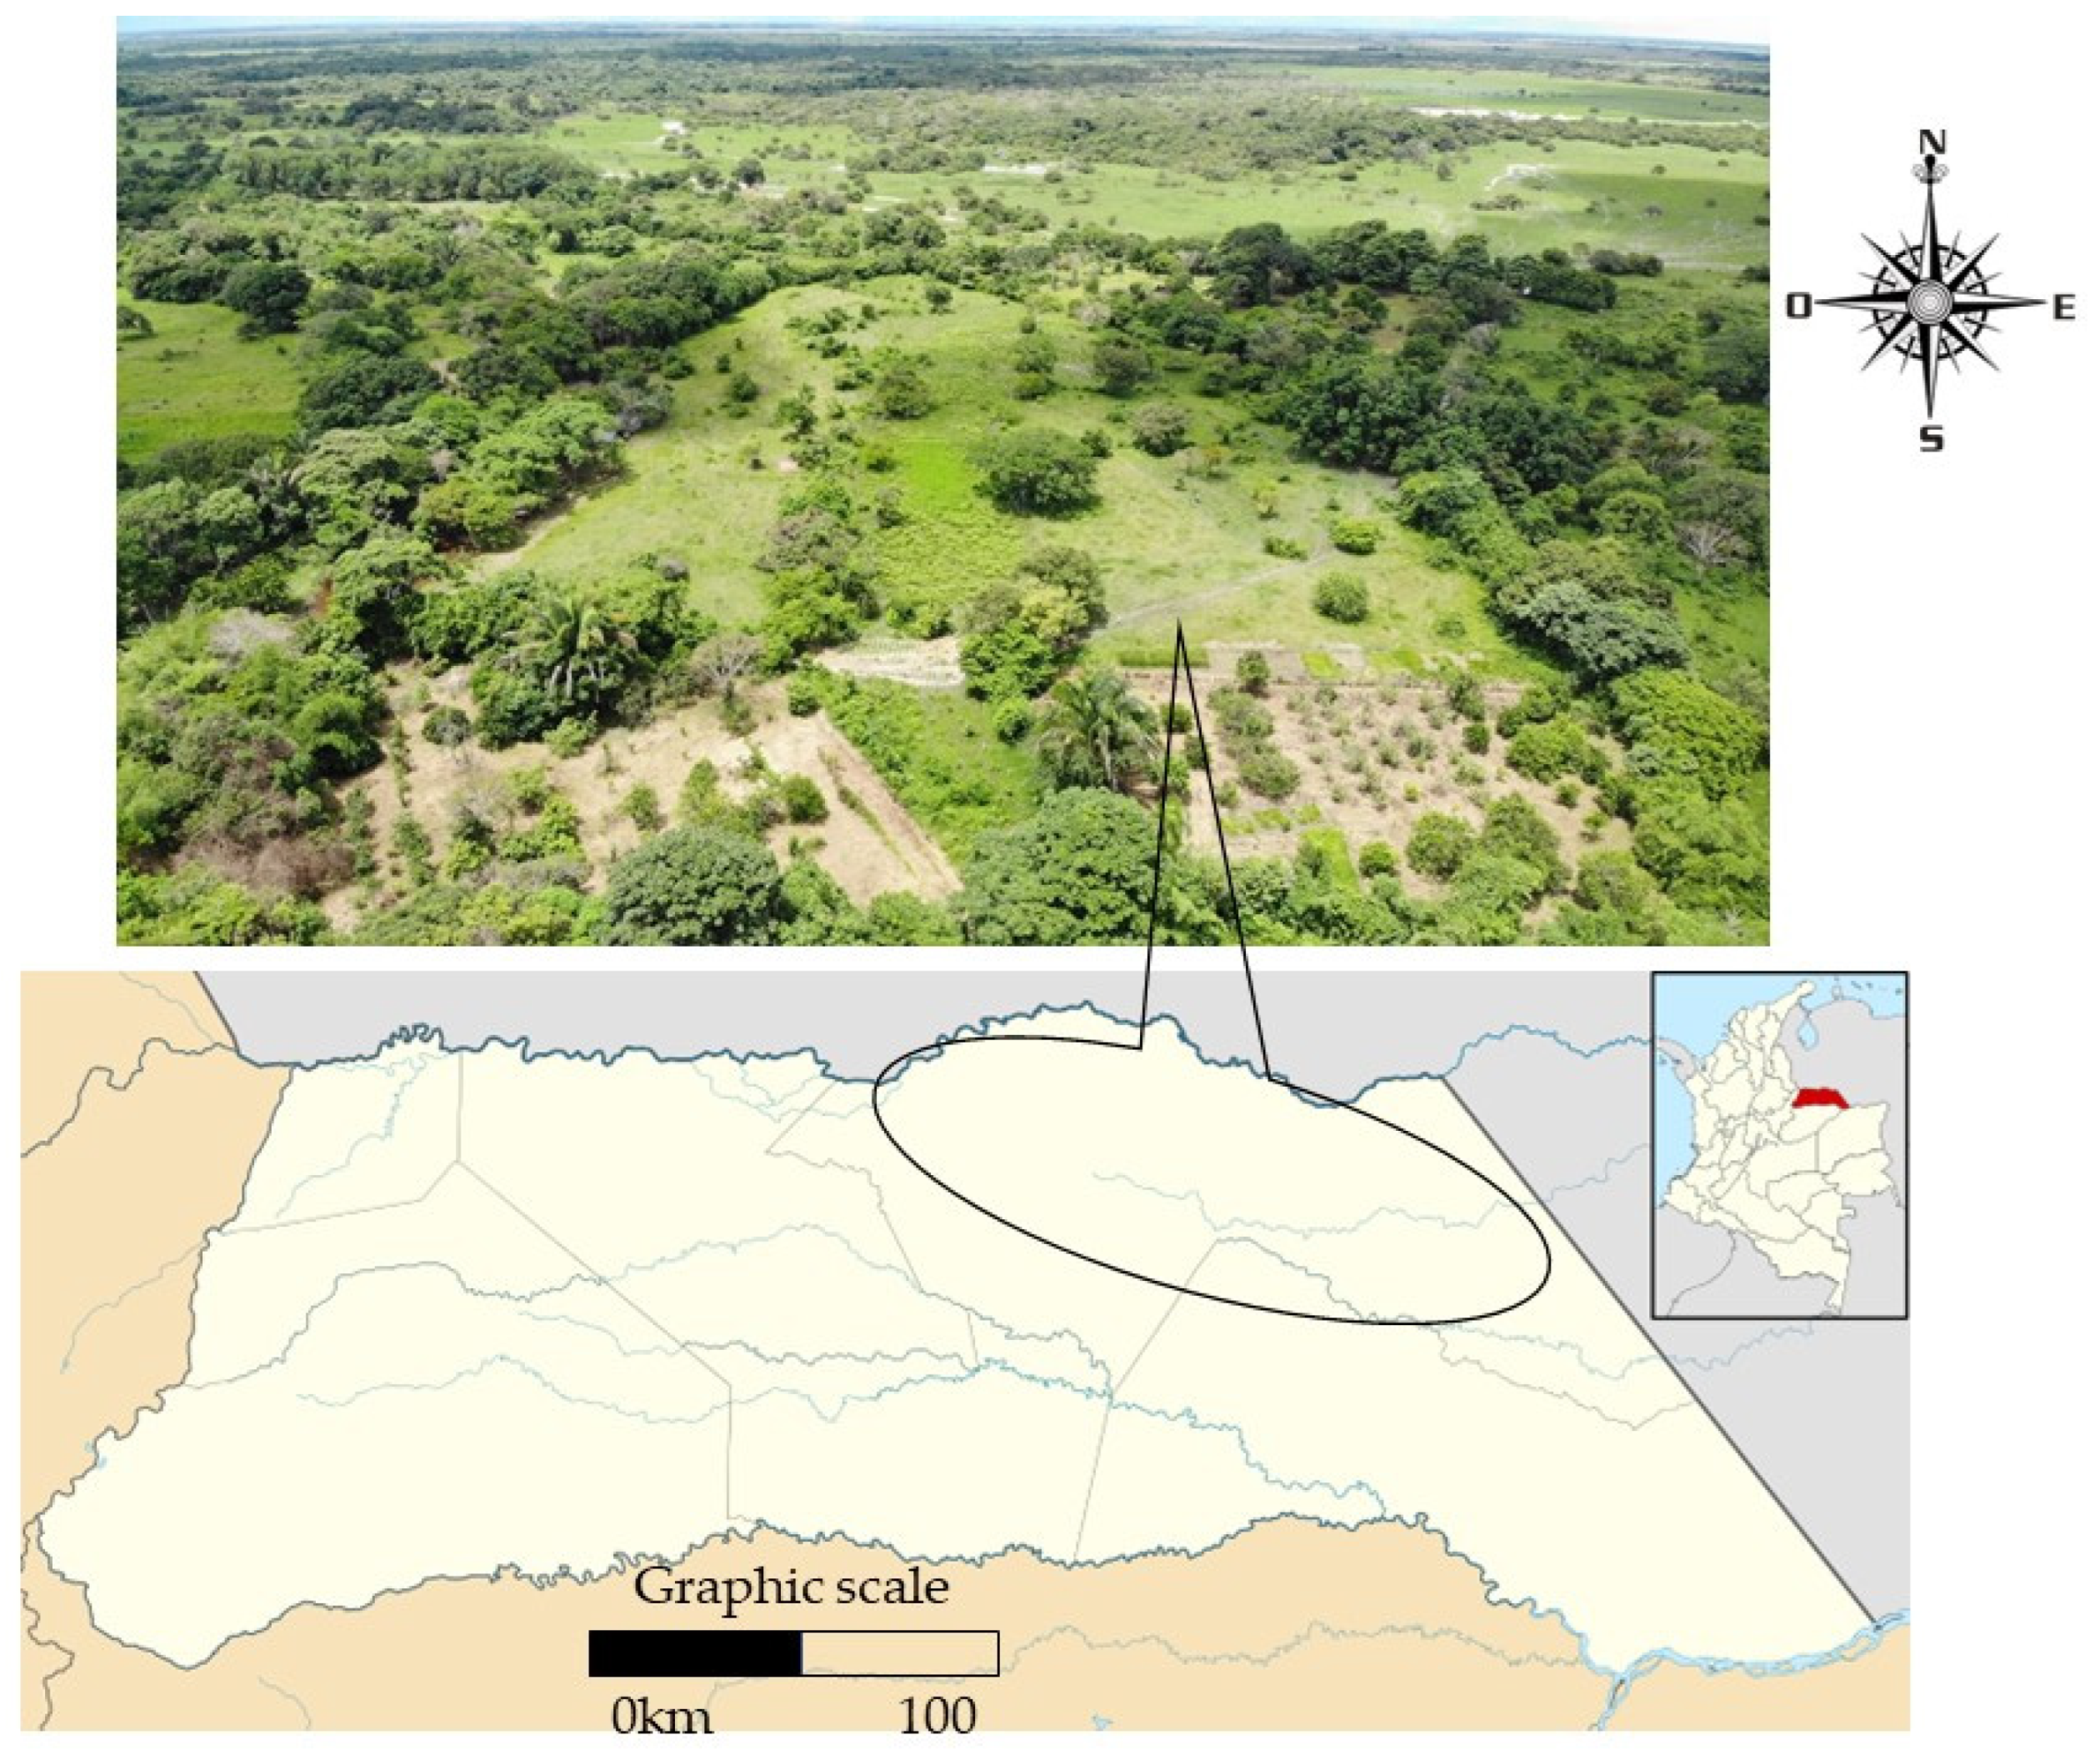
Under tropical conditions and in different agroecological scenarios, such as floodplain savannahs, livestock activity with herbivorous animals relies on pastures because they are the most abundant source of nutrients in the area [23,68]. The native grasses’ species diversity present in the “bank” physiographic position constitutes a valuable resource to find nutritional alternatives that ensure feed for animals facing the current climate change scenarios [15]. In livestock production systems on floodplain savannahs, it is common to establish improved pastures as the first alternative for animal feeding. However, it is not considered that many of these species present adaptive difficulties that affect their yield and nutritional value [64,69], and overcoming these difficulties requires intensive management that is not common in most of the production systems in such regions. The results indicate that, under the typical “savannah banks” unit dynamics, some introduced species, such as B. hybrid Mulato (“control”), present similar or even lower biomass production and chemical compositions than some of the native grasses included in the present study.
These results encourage research efforts to characterize the productive potential of native plants in different ecosystems, with the aim of incorporating them into livestock farms, offering to producers a greater diversity of feed alternatives with more flexible management. It is expected that, through their adaptive characteristics, these forage species can contribute to strengthening soil–plant–animal interactions and promote the generation of environmental services, such as the protection and improvement of soils’ physical–chemical properties, nutrient recycling, and greenhouse gas fixation [15,64].
To evaluate the forage potential of a plant species, in addition to its nutritional composition and forage production, it is also necessary to know the animal response in terms of consumption and productive performance [64]. Although most of the native grasses evaluated in this study are recognized as the main food source in the area, especially during the rainy season [6], experimental trials are still required to precisely evaluate animal consumption and the transformation efficiency of the supplied nutrients in animal products [65].

5. Conclusions

In the physiographic “bank” position under floodplain savannah conditions, the evaluated plants presented forage yields and qualities within the ranges reported in tropical grasses. The native grass P. plicatulum achieved similar biomass forage production to B. hybrid Mulato grass under the same conditions. In terms of crude protein and minerals, A. purpussi, Paspalum sp., and P. plicatulum presented similar or even higher concentrations than B. hybrid Mulato. The Ca:P ratios among native grasses were within the optimal ranges to guarantee adequate ruminal function. The grass DMD under the physiographic “bank” position was highly dependent on the CP and FDA contents.
Native grasses, such as A. purpussi, Paspalum sp., and P. plicatulum, constitute sustainable forage alternatives for livestock production in the region. However, to determine their real forage potential, the evaluation of their response under technical management (fertilization and irrigation) is still required, as well as animal consumption and performance tests.

Author Contributions

Conceptualization, writing—original draft, and writing—revision and edition, M.V.-T., A.S.-C., O.M.V.-C. and P.M.P.-C.; Formal analysis, methodology, and research, M.V.-T. and A.S.-C.; Writing—revision, and conceptualization, P.M.P.-C. and J.B.-M. All authors have read and agreed to the published version of the manuscript.

Funding

This research was funded by the Research Committee—CONADI (INV2957 and INV3156)—of the Universidad Cooperativa de Colombia.

Institutional Review Board Statement

Not applicable, the study did not involve humans or animals.

Informed Consent Statement

Not applicable, the study did not involve humans.

Data Availability Statement

The data are available upon reasonable request to the second author.

Acknowledgments

The authors thank the auxiliary students who helped collect the field data, as well as the owner of the Villa Cristina farm. All individuals included in this section have consented to the acknowledgments.

Conflicts of Interest

The authors declare that there are no competing interest regarding the publication of this paper.

References

  1. Boval, M.; Dixon, R.M. The importance of grasslands for animal production and other functions: A review on management and methodological progress in the tropics. Animal 2012, 6, 748–762. [Google Scholar] [CrossRef] [PubMed] [Green Version]
  2. Jaurena, M.; Durante, M.; Devincenzi, T.; Savian, J.V.; Bendersky, D.; Moojen, F.G.; Pereira, M.; Soca, P.; Quadros, F.L.F.; Pizzio, R.; et al. Native Grasslands at the Core: A New Paradigm of Intensification for the Campos of Southern South America to Increase Economic and Environmental Sustainability. Front. Sustain. Food Syst. 2021, 5, 547834. [Google Scholar] [CrossRef]
  3. Mora-Fernández, C.; Peñuela-Recio, L.; Castro-Lima, F. Estado del conocimiento de los ecosistemas de las sabanas inundables en la Orinoquia Colombiana. Orinoquia 2015, 19, 253–271. [Google Scholar] [CrossRef] [Green Version]
  4. Ruiz-Guerra, C.; Eusse-González, D.; Arango, C. Distribución, abundancia y reproducción de las aves acuáticas de las sabanas inundables de Meta y Casanare (Colombia) y sitios prioritarios para la conservación. Biota Colomb. 2014, 15, 137–160. [Google Scholar]
  5. Mercado, O.A.; Batista, M.M.F.; Mora, C.P.; García, L.A.P.; Miranda, C.L.M.; Avilan, A.R.C.; Vallejo, S.E.V.; Garzón, C.N.B.; Luna, M.V.; Trjillo, F.; et al. Las sabanas inundables de la Orinoquia. In XIII Aplicación de Criterios Bioecológicos Para la Identidicación, Caracterización y Establecimiento de Límites Funcionales en Humedales de las Sabanas Inundables de la Orinoquía; Osorio-Peláez, C., Lasso, C.A., Trujillo, F., Eds.; Instituto de Investigación de Recursos Biológicos Alexander von Humboldt: Bogotá, Colombia, 2015; pp. 1–432. [Google Scholar]
  6. Peñuela, L.; Fernández, A.P.; Castro, F.; Ocampo, A. Uso y Manejo de Forrajes Nativos en la Sabana Inundable de la Orinoquia; Convenio de Cooperación Interinstitucional; The Nature Conservancy, Fundación Horizonte Verde, Fundación Biodiversidad de España, Corporación Autónoma Regional de la Orinoquia; Universidad de los Llanos: Villavicencio, Colombia, 2011. [Google Scholar]
  7. Pérez, B.R.A.; Vargas, C.O.M. Características de la Sabana Nativa y su Potencial de Producción Bovina en la Llanura Inundable de Arauca, Boleín Técnico N° 25; Programa Regional de Investigación Pecuaria, Corpoica: Arauca, Colombia, 2001. [Google Scholar]
  8. Chicco, C.F.; Godoy de León, S. Deficiencias de minerales y condiciones asociadas en la ganadería de carne de las sabanas de Venezuela. In Proceedings of the Primer Curso Internacional Sobre Avances en la Nutrición de los Rumiantes, Lara, Venezuela, 26–30 September 2005. [Google Scholar]
  9. Peñuela, L.; Fernández, A. La ganadería ligada a procesos de conservación en la sabana inundable de la Orinoquia. Orinoquia 2010, 14, 5–17. [Google Scholar]
  10. Domínguez, T.G.; Ramírez, R.G.; Estrada, A.E.; Scott, L.M.; González, R.H.; Alvarado, M.d.S. Importancia nutrimental en plantas forrajeras del matorral espinoso tamaulipeco. Cienc. UANL 2012, 15, 77–93. [Google Scholar]
  11. Blanco, L.J.; Durante, M.; Ferrante, D.; Quiroga, R.E.; Demaria, M.R.; Di Bella, C.M. Red nacional de monitoreo de pastizales naturales de Argentina: Productividad forrajera de la vegetación extrapampeana. Rev. Investig. Agropec. 2019, 45, 89–108. [Google Scholar]
  12. Contreras, U. Elementos para una Ganadería Sostenible a Partir de las Normas de la Red de Agricultura Sostenible (RAS); Serie No 3; Grupo Colombiano Interinstitucional de Herramientas de Conservación Privada, Asociación Red Colombiana de Reservas Naturales de la Sociedad Civil, Fundación Natura, World Wildlife Fund, The Nature Conservancy, Parques Nacionales de Colombia: Bogotá, Colombia, 2014. [Google Scholar]
  13. Enriquez, J.F.; Esqueda, V.A.; Martínez, M.D. Rehabilitación de praderas degradadas en el trópico de México. Rev. Mex. Cienc. Pecu. 2021, 12, 243–260. [Google Scholar] [CrossRef]
  14. Evitayani, W.L.; Fariani, A.; Ichinohe, T.; Fujihara, T. Study on Nutritive Value of Tropical Forages in North Sumatra, Indonesia. Asian-Aust. J. Anim. Sci. 2004, 17, 1518–1523. [Google Scholar]
  15. Reiné, R.; Ascaso, J.; Barrantes, O. Nutritional quality of plant species in pyrenean hay Meadows of high diversity. Agronomy 2020, 10, 883. [Google Scholar] [CrossRef]
  16. Amiri, F.; Mohamed-Sharif, A.R. Comparison of nutritive values of grasses and legume species using forage quality index. Songklanakarin J. Sci. Technol. 2012, 34, 577–586. [Google Scholar]
  17. Avellaneda, C.J.; Cabezas, G.F.; Quintana, Z.Q.; Luna, M.R.; Montañez, V.O.; Espinoza, G.I.; Zambrano, M.S.; Romero, G.D.; Vanegas, R.J.; Pinargote, M.E. Comportamiento agronómico y composición química de tres variedades de Brachiaria en diferentes edades de cosecha. Cienc. Tecnol. 2008, 1, 87–94. [Google Scholar] [CrossRef]
  18. Reihardt, M.S.; Foote, A.P.; Lambert, B.D.; Muir, J.P. Effects of protein or energy supplementation on in situ disappearance of low- and high-quality Coastal Bermudagrass hay in goats. Texas J. Agric. Nat. Res. 2011, 24, 97–105. [Google Scholar]
  19. Ariza-Nieto, C.M.O.L.; Mojica, B.; Parra, D.; Afanador-Tellez, G. Use of LOCAL algorithm with near infrared spectroscopy in forage resources for grazing systems in Colombia. J. Near Infrared. Spectr. 2018, 26, 44–52. [Google Scholar] [CrossRef]
  20. Workman, J.; Weyer, L. Practical Guide to Interpretive near Infrared Spectroscopy; CRC Press: Boca Raton, FL, USA, 2008. [Google Scholar]
  21. Scheffer-Basso, S.M.; Gallo, M.M. Aspectos morfofisiológicos e bromatológicos de Paspalum plicatulum. Rev. Bras. Zootec. 2008, 37, 1758–1762. [Google Scholar] [CrossRef] [Green Version]
  22. Sánchez, T.; Orskov, E.; Lamela, L.; Pedraza, R.; López, O. Valor nutritivo de los componentes forrajeros de una asociación d gramíneas mejoradas y Leucaena leucocephala. Pastos Forrajes 2008, 31, 271–281. [Google Scholar]
  23. Uzcátegui-Varela, J.P.; Chompre, K.; Castillo, D.; Rangel, S.; Briceño-Rangel, A.; Piña, A. Nutritional assessment of tropical pastures as a sustainability strategy in dual-purpose cattle ranching in the South of Lake Maracaibo, Venezuela. J. Saudi Soc. Agric. Sci. 2021, 21, 432–439. [Google Scholar] [CrossRef]
  24. Silveira, P.L.d.; Maire, V.; Schellberg, J.; Louault, F. Grass strategies and grassland community responses to environmental drivers: A review. Agron. Sustain. Dev. 2015, 35, 1297–1318. [Google Scholar] [CrossRef]
  25. Ramirez, R.G. Forrajes nativos. Una alternativa sustentable en la alimentación de rumiantes. Cienc. UANL 2009, 12, 4–5. [Google Scholar]
  26. Vélez, O.M. Estrategias tecnológicas para la intensificación de la productividad ganadera en condiciones de sabanas inundables en la Orinoquía colombiana. Trop. Subtrop. Agroecos. 2019, 22, 257–266. [Google Scholar]
  27. Holdridge, L.R. Ecología Basada en Zonas de Vida; IICA: San Jose, CA, USA, 1987; p. 216. [Google Scholar]
  28. NTC-5264; Norma Técnica Colombiana. Calidad del Suelo. Determinación del pH. Editada por el Instituto Colombiano de Normas Técnicas y Certificación (ICONTEC): Bogotá, Colombia, 26 March 2008.
  29. NTC-5889; Norma Técnica Colombiana. Análisis de Suelos. Determinación del Nitrógeno Total. Editada por el Instituto Colombiano de Normas Técnicas y Certificación (ICONTEC): Bogotá, Colombia, 30 November 2011.
  30. NTC-5403; Norma Técnica Colombiana. Calidad de Suelo. Determinación del Carbono Orgánico. Editada por el Instituto Colombiano de Normas Técnicas y Certificación (ICONTEC): Bogotá, Colombia, 17 July 2013.
  31. NTC-5349; Norma Técnica Colombiana. Calidad de Suelo. Determinación de las Bases Cambiables: Método del Acetato Amonio 1M, PH 7.0. Editada por el Instituto Colombiano de Normas Técnicas y Certificación (ICONTEC): Bogotá, Colombia, 29 September 2016.
  32. NTC-5526; Norma Técnica Colombiana. Calidad de Suelo. Determinación de Micronutrientes Disponibles: Cobre, Zinc, Hierro y Manganeso. Editada por el Instituto Colombiano de Normas Técnicas y Certificación (ICONTEC): Bogotá, Colombia, 26 September 2007.
  33. NTC-5350; Norma Técnica Colombiana. Calidad del Suelo. Determinación de Fósforo Disponible. Editada por el Instituto Colombiano de Normas Técnicas y Certificación (ICONTEC): Bogotá, Colombia, 15 June 2016.
  34. NTC-5404; Norma Técnica Colombiana. Calidad del Suelo. Determinación de Boro. Editada por el Instituto Colombiano de Normas Técnicas y Certificación (ICONTEC): Bogotá, Colombia, 13 July 2011.
  35. NTC-5268; Norma Técnica Colombiana. Calidad de Suelo. Determinación de la Capacidad de Intercambio Catiónico. Editada por el Instituto Colombiano de Normas Técnicas y Certificación (ICONTEC): Bogotá, Colombia, 29 January 2014.
  36. NTC-5263; Norma Técnica Colombiana. Calidad del Suelo. Determinación de la Acidez, Aluminio e Hidrogeno Intercambiables. Editada por el Instituto Colombiano de Normas Técnicas y Certificación (ICONTEC): Bogotá, Colombia, 21 June 2017.
  37. Instituto Geográfico Agustín Codazzi. Métodos Analíticos del Laboratorio de Suelos, 6th ed.; Instituto Geográfico Agustín Codazzi: Bogotá, Colombia, 2006; p. 648. [Google Scholar]
  38. Universidad Nacional de Colombia, Orinoquia. Guía para el Usuario de los Servicios del Laboratorio de Suelos, Aguas y Foliares. Arauca, Colombia. 2021. Available online: https://bit.ly/2XaFvYJ (accessed on 14 September 2021).
  39. Cerdas, R. Programa de fertilización de forrajes. Desarrollo de un módulo práctico para técnicos y estudiantes de ganadería de Guanacaste, Costa Rica. InterSedes 2011, 12, 109–128. [Google Scholar]
  40. Littell, R.; Milliken, G.; Stroup, W.; Wolfinger, R.; Schabenberger, O. SAS for Mixed Models, 2nd ed.; SAS Institute Inc.: Cary, NC, USA, 2007. [Google Scholar]
  41. InfoStat. InfoStat; versión 2020; Manual del Usuario; Universidad Nacional de Córdoba: Córdoba, Argentina, 2020. [Google Scholar]
  42. Leng, R.A. Evaluation of Tropical Feed Resources for Ruminant Livestock; Tropical Feeds and Feeding Systems; FAO: Rome, Italy, 1995; Available online: https://www.fao.org/ag/aga/agap/frg/econf95/pdf/evalu.pdf (accessed on 2 December 2021).
  43. Cuadrado, H.; Torregroza, L.; Garcés, J. Producción de Carne con Machos de Ceba en Pastoreo de Pasto Híbrido Mulato y Brachiaria decumbens en el Valle del Sinú. MVZ-Córdoba 2005, 10, 573–580. [Google Scholar]
  44. Cruz-Hernández, A.; Hernández-Garay, A.; Aranda-Ibañez, E.; Chay-Canul, A.; Márquez-Quiroz, C.; Rojas-Garcia, A.L.; Gómez-Vázquez, A. Nutritive value of Mulato grass under dierent grazing strategies. Esosist. Recur. Agropec. 2017, 4, 65–72. [Google Scholar] [CrossRef] [Green Version]
  45. Ortega-Aguirre, C.A.; Lemus-Flores, C.; Bugarín-Prado, J.O.; Alejo-Santiago, G.; Ramos-Quirarte, A.; Grageola-Núñez, O.; Bonilla-Cárdenas, J.A. Características agronómicas, composición bromatológica, digestibilidad y consumo animal en cuatro especies de pastos de los generos Brachiaria y Panicum. Trop. Subtrop. Agroecos. 2015, 18, 291–301. [Google Scholar]
  46. Argel, P.J.; Miles, J.W.; Guiot, J.D.; Lascano, C.E. Cultivar Mulato (Brachiaria Híbrido CIAT 36061): Gramínea de Alta Producción y Calidad Forrajera Para los Trópicos; Centro Internacional de Agricultura Tropical: Cali, Colombia, 2005. [Google Scholar]
  47. Canchila, E.R.; Soca, M.; Ojeda, F.; Machado, R. Evaluación de la composición bromatológica de 24 accesiones de Brachiaria spp. Pastos Forrajes 2009, 32, 1–9. [Google Scholar]
  48. Mutimura, M.; Ebong, C.; Rao, I.; Nsahlai, I. Effects of supplementation of Brachiaria brizantha cv. Piatá and Napier grass with Desmodium distortum on feed intake, digesta kinetics and milk production in crossbred dairy cows. Anim. Nutr. 2018, 4, 222–227. [Google Scholar] [CrossRef]
  49. Velasco, Z.M.E.; Hernández, G.A.; González, H.V.A.; Pérez, P.J.; Vaquera, H.H.; Galvis, S.A. Curva de crecimiento y acumulación estacional del pasto Ovillo (Dactylis glomerata L.). Técn. Pec. Méx. 2001, 39, 1–14. [Google Scholar]
  50. Lounglawan, P.; Lounglawan, W.; Suksombat, W. Effect of cutting interval and cutting height on yield and chemical composition of King Napier Grass (Pennisetum Purpureum × Pennnisetum Americanum). APCBEE Procedia 2014, 8, 27–31. [Google Scholar] [CrossRef] [Green Version]
  51. Reyes-Pérez, J.J.; Méndez-Martínez, Y.; Verdecia, D.M.; Luna-Murillo, R.A.; Hernández Montiel, L.G.; Herrera, R.S. Components of the yield and bromatological composition of three Brachiaria varieties in El Empalme area, Ecuador. Cuba J. Agric. Sci. 2018, 52, 35–445. [Google Scholar]
  52. Mlay, P.S.; Pereka, A.; Phiri, E.; Balthazary, S.; Igusti, J.; Hvelplund, T.; Weisbjerg, M.R.; Madsen, J. Feed value of selected tropical grasses, legumes and concentrates. Vet. Arh. 2006, 76, 53–63. [Google Scholar]
  53. Lee, M.A. A global comparison of the nutritive values of forage plants grown in contrasting environments. J. Plant Res. 2018, 131, 641–654. [Google Scholar] [CrossRef] [PubMed]
  54. Salah, N.; Sauvant, D.; Archimède, H. Nutritional requirements of sheep, goats and cattle in warm climates: A meta-analysis. Animal 2014, 8, 1439–1447. [Google Scholar] [CrossRef] [PubMed]
  55. Fonseca, P.G.; Emerenciano, N.J.V.; Dos Santos, D.G.; Cortes, A.C.; De Oliveira, L.P.; Da Silva Santos, R. Production and quality of tropical grasses at different regrowth intervals in the Brazilian semiarid. Acta Sci. Anim. Sci. 2021, 43, e52842. [Google Scholar]
  56. Gupta, A.R.; Bandyopadhyay, S.; Sultana, F.; Swarup, D. Heavy metal poisoning and its impact on livestock health and production system. Indian J. Anim. Health 2021, 60, 1–23. [Google Scholar] [CrossRef]
  57. Muñoz-González, J.C.; Huerta-Bravo, M.; Lara, B.A.; Rangel, S.R.; De la Rosa, A.J.L. Production and nutritional quality of forages in conditions Humid Tropics of Mexico. Rev. Mex. Cienc. Agríc. Public Esp. 2016, 16, 3315–3327. [Google Scholar]
  58. White, P.J.; Brown, P.H. Plant nutrition for sustainable development and global health. Ann. Bot. 2010, 105, 1073–1080. [Google Scholar] [CrossRef] [Green Version]
  59. National Research Council (NRC). Nutrient Requirements of Beef Cattle, 7th ed.; National Academic Science: Washington, DC, USA, 2000. [Google Scholar]
  60. González-Ronquillo, M.; Aparicio, R.; Torres, R.; Domínguez, V.I.A. Producción de biomasa, composición química y producción de gas in vitro de la vegetación de una sabana estacional modulada. Zootec. Trop. 2009, 27, 407–417. [Google Scholar]
  61. Vazquez-Mendoza, P.; Castelán-Ortega, O.A.; Estrada-Flores, J.G.; García-Martínez, A.; Avilés-Nova, F. Nutritional blocks employed as supplement for sheep in the dry tropics of the highlands of central Mexico. Trop. Subtrop. Agroecos. 2012, 15, 87–96. [Google Scholar]
  62. Melo, C.D.; Maduro, D.C.S.A.M.; Wallon, S.; Borba, A.E.S.; Madruga, J.; Borges, P.A.V.; Ferreira, M.T.; Elias, R.B. Influence of climate variability and soil fertility on the forage quality and productivity in Azorean pastures. Agriculture 2022, 12, 358. [Google Scholar] [CrossRef]
  63. De Pinho, C.K.A.; Da Costa, S.E.; André, u.; Soares, E.P.; Guerra Da Silva, A.; Fonseca, C.R.R.; Barbosa, S.C.; Rodrigues, C.R. Nutritional characteristics of Brachiaria brizantha cultivars subjected to different intensities cutting. Am. J. Plant Sci. 2014, 5, 1961–1972. [Google Scholar]
  64. Ramos, L.; Apráez, J.; Cortes, K.; Apráez, J. Nutritional, antinutritional and phenological characterization of promising forage species for animal feeding in a cold tropical zone. Rev. Cienc. Agríc. 2021, 38, 86–96. [Google Scholar] [CrossRef]
  65. Linn, J.G.; Martin, N.P. Forage Quality Tests and Interpretation—AG-F0-2637. Minnesota Extension Service; University of Minnesota Agriculture: St. Paul, MN, USA, 1989; pp. 1–5. [Google Scholar]
  66. Indah, A.S.; Permana, I.G.; Despal, D. Determination dry matter digestibility of tropical forage using nutrient compisition. IOP Conf. Ser. Earth Environ. Sci. 2020, 484, 012113. [Google Scholar] [CrossRef]
  67. Cortiana, T.A.A.; Regiani, S.M.; Cardoso, J.G.; Carvalho, F.J.L.; Henz, É.L.; Pedro, J.P. Production and chemical composition of grasses and legumes cultivated in pure form, mixed or in consortium. Acta Sci. Anim. Sci. 2017, 235–241. [Google Scholar]
  68. Rao, I.; Peters, M.; Castro, A.; Schultze-Kraft, R.; White, D.; Fisher, M.; Miles, J.; Lascano, C.; Blummel, M.; Bungenstab, D.; et al. LivestockPlus-The sustainable intensification of forage-based agricultural systems to improve livelihoods and ecosystem services in the tropics. Trop. Grassl. 2015, 3, 59–82. [Google Scholar] [CrossRef]
  69. Silva, P.A.; Garay, R.S.; Gómez, I.A.S. Impact of Alnus acuminata Kunth on N2O fluxes and quality of Pennisetum clandestinum Hochst grass. Ex Chiov. Colomb. For. 2018, 21, 47–57. [Google Scholar] [CrossRef]
Figure 1. Circle: Floodplain savannah region, department of Arauca. Red color: Location of the department of Arauca. eastern Colombian (latitude: 7°08′17″ N, longitude: 70°59′59″ W).
Sustainability 14 15151 g001
Figure 2. Native grass of the “bank” physiographic position of floodplain savannah (Villa Cristina farm, Arauca, Colombia): (a) Paspalum plicatulum, (b) Axonopus compresus, (c) Paspalum sp., and (d) Axonopus purpussi.
Sustainability 14 15151 g002
Figure 3. Observed and predicted native grasses’ DMD using the estimated model.
Sustainability 14 15151 g003
Table 1. Physicochemical properties of the soils from the “banks” physiographic position.
g/kgmeq/100 gmg/kg%
pHOCTNCaMgKAl + HCECNaPCuFeZnMnBLimeSandClay
5.03 ± 0.467.68 ± 2.00.66 ± 0.171.47 ± 0.560.95 ± 0.350.12 ± 0.060.78 ± 0.438.59 ± 2.40<0.133.86 ± 2.421.48 ± 0.44217.3 ± 51.313.85 ± 1.1226.28 ± 5.461.02 ± 0.3532.97 ± 5.4052.18 ± 9.6314.61 ± 3.64
OC: Organic carbon; TN: total nitrogen; CEC: cation exchange capacity.
Table 2. Experimental grasses included in the study.
Species (Scientific Name)Common NameGrowth HabitCharacteristic
Paspalum plicatulum (Michx.) Kuntze (1898)Black grassBunchNative
Axonopus compresus (Sw.) P. Beauv (1912)Gegei grassStoloniferousNative
Axonopus purpussi (Mez) Chase (1927)GuarataraStoloniferousNative
Paspalum sp. (L.) L. (1762)Native grassRhizomatousNative
Brachiaria hybrid cv Mulato I (control)Mulato grassBunchIntroduced
Table 3. Forage yield during the growth of grasses adapted to the “banks” physiographic position from the Orinoquia flooded savannahs.
SpeciesCutting Age (Days)Height (cm)GF (tons/ha)DM (tons/ha)DM (%)
MeanSEMMeanSEMMeanSEMMeanSEM
A. compresus3032.0 f2.22.90.560.9 f150.730.0 bc0.8
A. purpussi18.9 h1.84.00.561.0 ef150.725.5 ef0.8
Mulato (control)100.0 ab4.66.80.561.6 bc150.723.2 fg0.8
Paspalum sp.14.0 i1.53.30.561.0 ef150.730.9 abc0.8
P. plicatulum76.6 c2.35.70.561.1 def150.720.0 h0.8
A. compresus4032.0 f2.14.20.561.3 cde150.732.0 ab0.8
A. purpussi37.8 e1.86.20.561.5 bcd150.724.5 f0.8
Mulato (control)104.4 a4.67.50.561.6 bc150.721.6 gh0.8
Paspalum sp.26.0 g1.55.50.561.6 bcd150.728.1 cd0.8
P. plicatulum80.4 c2.37.90.561.9 b150.723.6 fg0.8
A. compresus5033.6 ef2.24.40.561.5 bcd150.734.0 a0.8
A. purpussi44.2 d1.85.70.561.5 bcd150.727.1 de0.8
Mulato (control)107.4 a4.67.90.562.5 a150.731.3 ab0.8
Paspalum sp.31.6 f1.55.40.561.6 bc150.729.8 bc0.8
P. plicatulum93.6 b2.38.50.562.4 a150.728.2 cd0.8
Interaction (p-value)<0.0001NS0.0126<0.0001
GF: Green forage; DM: dry matter; SEM: standard error of the mean. Different letters in the same column differed statistically (p < 0.05).
Table 4. Protein and mineral contents during the growth of grasses adapted to the “banks” physiographic position from the Orinoquia flooded savannahs.
SpeciesCutting Age (Days)CP (%)Ash (%)Ca (%)P (%)
MeanSEMMeanSEMMeanSEMMeanSEM
A. compresus305.1 fgh0.56.2 cd0.50.34 cde0.040.28 ab0.02
A. purpussi10.2 a0.55.7 d0.50.40 bcd0.040.25 bcd0.02
Mulato (control)5.8 efgh0.56.8 bcd0.50.40 bcd0.040.25 abcd0.02
Paspalum sp.9.8 ab0.56.6 bcd0.50.37 bcde0.040.22 bcde0.02
P. plicatulum8.2 bc0.58.0 ab0.50.66 a0.040.26 abc0.02
A. compresus406.0 edf0.55.6 d0.50.33 cde0.040.29 a0.02
A. purpussi6.6 def0.57.3 bc0.50.40 bcd0.040.25 abcd0.02
Mulato (control)4.4 gh0.56.1 cd0.50.32 de0.040.26 ab0.02
Paspalum sp.5.8 efg0.58.7 a0.50.44 bc0.040.21 de0.02
P. plicatulum9.3 ab0.58.5 ab0.50.47 b0.040.20 e0.02
A. compresus509.9 a0.53.2 e0.50.35 cde0.040.21 cde0.02
A. purpussi7.4 cd0.56.5 cd0.50.38 bcd0.040.27 ab0.02
Mulato (control)6.0 def0.53.8 e0.50.14 f0.040.23 bcde0.02
Paspalum sp.7.0 cde0.58.3 ab0.50.38 bcd0.040.26 abc0.02
P. plicatulum4.3 h0.55.7 d0.50.25 ef0.040.22 bcde0.02
Interaction (p-value)<0.00010.0046<0.00010.0045
CP: Crude protein; Ca: calcium; P: phosphorous; SEM: standard error of the mean. Different letters in the same column differed statistically (p < 0.05).
Table 5. Fiber composition and digestibility variables during the growth of grasses adapted to the “banks” physiographic position from the Orinoquia flooded savannahs.
SpeciesCutting Age (Days)NDF (%)ADF (%)Lignin (%)DMD (%)
MeanSEMMeanSEMMeanSEMMeanSEM
A. compresus3065.8 def1.235.1 cd1.29.3 cdef0.452.5 defg0.5
A. purpussi63.1 fg1.236.7 c1.28.3 fg0.456.0 a0.5
Mulato (control)64.9 ef1.230.7 e1.27.8 g0.454.4 bc0.5
Paspalum sp.68.5 bcde1.239.3 abc1.28.9 cdefg0.455.0 abc0.5
P. plicatulum63.2 fg1.234.9 cd1.28.0 g0.455.1 ab0.5
A. compresus4070.0 bc1.238.8 bc1.29.7 abcd0.452.1 efgh0.5
A. purpussi69.1 bcd1.235.9 c1.29.5 cdef0.453.5 cd0.5
Mulato (control)67.9 cde1.232.4 de1.28.6 defg0.452.8 def0.5
Paspalum sp.69.4 bcd1.236.6 c1.29.7 bcde0.452.6 defg0.5
P. plicatulum64.4 efg1.236.2 c1.28.5 efg0.455.6 ab0.5
A. compresus5061.0 gg1.235.4 cd1.28.4 fg0.456.3 a0.5
A. purpussi71.1 abc1.238.7 bc1.29.3 cdef0.453.2 cde0.5
Mulato (control)71.1 abc1.240.3 ab1.210.4 abc0.451.6 gh0.5
Paspalum sp.72.3 ab1.242.6 a1.210.9 a0.451.7 fgh0.5
P. plicatulum73.9 a1.238.6 bc1.210.8 ab0.450.8 h0.5
Interaction (p-value)0.00010.00390.0027<0.0001
NDF: neutral detergent fiber; ADF: acid detergent fiber; DMD: dry matter digestibility; SEM: standard error of the mean. Different letters in the same column differ statistically (p < 0.05).
Table 6. Spearman’s correlation analysis between nutritional composition variables in native species from the “bank” physiographic position under flooded savannahs (coefficients and their significance are below and above the diagonal, respectively).
AgeDMCPNDFADFLigninDMDAshCaPHeight
Age 0.35900.95350.30880.56460.19310.84280.58090.50620.69200.5000
DM0.29 0.46280.50120.04610.10200.62620.09960.11520.95650.0100
CP0.020.23 0.12050.13350.24020.00090.64820.28160.13730.2200
NDF0.320.20−0.47 0.12020.00120.00940.59370.42660.20730.7000
ADF0.190.600.460.47 0.07640.79860.71060.82780.91320.0100
Lignin0.400.49−0.370.820.53 0.00590.88810.31950.46060.2000
DMD−0.06−0.150.83−0.78−0.08−0.74 0.9630.14850.02840.9100
Ash−0.18−0.50−0.150.16−0.110.05−0.01 0.00230.18990.5600
Ca−0.21−0.480.34−0.25−0.07−0.310.440.79 0.10210.7900
P−0.13−0.02−0.450.39−0.040.24−0.63−0.41−0.49 0.8000
Height0.22−0.71−0.38−0.12−0.71−0.400.040.190.090.08
The correlations were significant (p < 0.05).
Publisher’s Note: MDPI stays neutral with regard to jurisdictional claims in published maps and institutional affiliations.

