Article

Non-Destructive Measurement of Quality Parameters of Apple Fruit by Using Visible/Near-Infrared Spectroscopy and Multivariate Regression Analysis

by
Behzad Hasanzadeh
1,
Yousef Abbaspour-Gilandeh
1,*,
Araz Soltani-Nazarloo
1,
Eduardo De La Cruz-Gámez
2,
José Luis Hernández-Hernández
3 and
Miriam Martínez-Arroyo
2,*
1
Department of Biosystems Engineering, Faculty of Agriculture and Natural Resources, University of Mohaghegh Ardabili, Ardabil 56199-11367, Iran
2
National Technology of Mexico/Acapulco Institute of Technology, Acapulco 39905, Guerrero, Mexico
3
National Technological of Mexico/Chilpancingo Institute of Technology, Chilpancingo 39070, Guerrero, Mexico
*
Authors to whom correspondence should be addressed.
Sustainability 2022, 14(22), 14918; https://doi.org/10.3390/su142214918
Submission received: 5 October 2022 / Revised: 7 November 2022 / Accepted: 7 November 2022 / Published: 11 November 2022

Abstract

:
The quality assessment and grading of agricultural products is one of the post-harvest activities that has received considerable attention due to the growing demand for healthy and better-quality products. Recently, various non-destructive methods have been used to evaluate the quality of agricultural products, which are very desirable and faster and more economical than destructive methods. Optical methods are one of the most important non-destructive methods that use the high speed of light detection and computer data processing and are able to evaluate the quality and classification of products with high accuracy. Among the optical methods, visible–near-infrared (Vis/NIR) spectroscopy is considered one of the most accurate methods. In this research, Vis/NIR spectroscopy technology was used in the spectral range of 350–1150 nm for non-destructive detection of some quality parameters including pH, TA, SSC, and TP of two varieties of Red Delicious and Golden Delicious apples. Various pre-processing models were developed to predict the parameters, which brought the desired results with high accuracy so that pH prediction results were for yellow apples (RMSEC = 0.009, rc = 0.991, SDR = 2.51) and for red apples (RMSEC = 0.005, rc = 0.998, SDR = 2.56). The results for TA were also (RMSEC = 0.003, rc = 0.996, SDR = 2.51) for red apples and (RMSEC = 0.001, rc = 0.998, SDR = 2.81) for yellow apples. The results regarding SSC were for red apples (RMSEC = 0.209, rc = 0.990 and SDR = 2.82) and for yellow apples (RMSEC = 0.054, SDR = 2.67 and rc = 0.999). In addition, regarding TP, the results were for red apples (RMSEC = 0.2, rc = 0.989, SDR = 2.05) and for yellow apples (RMSEC = 1.457, rc = 0.998, SDR = 1.61). The obtained results indicate the detection of the mentioned parameters with high accuracy by visible/infrared spectroscopic technology.

1. Introduction

Today, with the growth of the population and the increase in demand and the disappearance of commercial borders for food products, the necessity of mechanized and modern agriculture has already become apparent, and we have witnessed a high volume of food products exchanges in the world. On the other hand, many developed countries such as Japan and the European Union have defined high-level standards related to the quality and health of imported food products in order to meet people’s demand; therefore, in order to conquer global markets and compete with other countries in exporting products, we must take steps towards the further development of post-harvest technology.
Manual sorting and grading are expensive and unreliable because human decisions in determining quality characteristics such as flavor, taste, and appearance are different from each other, and it is a time-consuming task, which in any case is related to the mental and internal characteristics of humans. The quality is influenced by various factors such as cultivation methods, weather, soil conditions, etc.
Various definitions have been provided for quality. According to the American Society for Quality Control, quality is a subjective concept for which each person has their own definition. In technical applications, quality has two meanings: (1) Quality refers to the characteristics of a product or a service because these characteristics must be able to satisfy customers. (2) Quality refers to a product or service free from any defect or deficiency [1]. From the point of view of the horticultural product producer, quality means that the product has a high performance and also has a suitable appearance with few defects. This product should also be resistant to pests and diseases and have high firmness, ease of harvesting, and high quality of transportation. The important parameter for the seller and distributor regarding product quality is good appearance along with firmness and shelf life. Quality management of agricultural products is, on the one hand, an option to respond to the expectations and demands of consumers of agricultural products, and on the other hand, it is an option for success in the competitive market of agricultural products. The discussion of quality management of agricultural products has a prominent position in today’s modern world because today, with the improvement of the living standards of citizens and a large number of producers, a product with low quality or disadvantage in competition with other producers cannot have a special position [2].
Due to the change in the nature of the demand of the consumers of agricultural products to buy products that have high quality and health, the development of accurate and fast quality-control systems is very important. At present, visual inspection is still widely used as one of the common methods of quality control, which is, however, dependent on personal thinking and is time-consuming, laborious, and tiring [3]. In cases where ultraviolet light is used by trained operators to identify fruits whose tissues are diseased or rotten, in addition to the disadvantages mentioned in this type of visual inspection, human skin is also at risk [4]. Commonly used instrumental methods are mainly analytical chemistry methods such as mass spectrometry, which have disadvantages such as being destructive, time-consuming, producing a small number of examined samples, and sometimes needing long sample preparation. Therefore, it is very important and necessary to use accurate, reliable, efficient, and non-invasive alternatives to evaluate the quality of agricultural products. Recently, optical measurement technology as a potential tool for non-destructive analysis and evaluation of food quality and health has reached a stage of development that is available and usable. Especially, integrating both spectrometry and imaging in one system can obtain point information of the product and lead to many successful applications in the field of agricultural product quality evaluation [5].
Non-destructive methods are those that do not have photochemical, photophysical, chemical, mechanical, and thermal destructive effects on the product. These methods make it possible to inspect and determine their characteristics without damaging or destroying the products. In recent years, much research has been recorded in this field. These methods have been created based on the detection of different physical properties that have a good relationship with the quality of products, but only some of these methods have been able to be justified from a technical point of view [6].
In non-destructive methods, there may be more than one factor affecting the obtained data, which causes measurement errors, and for this reason, these systems require accurate calibration [6]. Using these methods has become easier with the advancement of technology and the use of modern equipment. The diversity and abundance of quality parameters of agricultural products has been the most important reason for the development of non-destructive methods.
Recently, with the development of computer science and chemistry and the increase in the ability to use spectroscopic techniques, the use of this method in various fields, especially in the field of food, has attracted the attention of many researchers. For non-destructive measurement of quality factors, there are fast methods such as ultrasound, microwave absorption, nuclear magnetic resonance (NMR), and near infrared spectroscopy (NIR). Among these methods, infrared spectroscopy is of interest and has been widely used in various sectors of the food industry [7]. The use of visible–near infrared (Vis-NIR) spectroscopy (Vis-NIRS) to analyze fresh produce in postharvest applications is a relatively mature topic [8]. NIR can assess several constituents at the same time; therefore, it is also efficient for mass screening [9]. This method has advantages such as its high speed and less time-consuming nature [10,11]. Compared to destructive methods, NIR spectroscopy is less expensive because other materials such as reagents or chemical reagents are not needed to perform the test except for electricity consumption, and a large number of samples can be analyzed by developing a calibration model, and the samples do not need any preparation before performing the test [12].
In a study, Huang et al. (2017) examined the days before decay (DBD) of peach fruit. Using NIR and electronic nose, they reached favorable results with a rate of 82.26% [13].
Soltani et al. investigated the possibility of using visible/near infrared spectroscopy (Vis-NIR) for the detection of poison residues (profenofos) in tomatoes. Their experiments were performed on tomato samples with different percentages of profenofos poison compared to the control sample (without poison). Vis/NIR spectral data of poison solution and tomato samples without poison and impregnated with different concentrations of poison were recorded in the range of 400–1050 nm by a spectroradiometer. To classify tomatoes with poison content at lower and higher levels than MRL as healthy and unhealthy samples, respectively, discriminant partial least squares analysis models based on different spectral preprocessing methods were used. Using the smoothing-Gaussian filter preprocessing method with the lowest standard error in cross-validation (SECV = 4.2884) was chosen as the best model for this study. Moreover, in the calibration and prediction sets, the total percentage of correctly classified samples was 91 and 92.4%, respectively [14].
The results of Munawar et al. (2022) for measuring the quality characteristics of intact mangoes using near infrared spectroscopy along with three different regressions, namely partial least squares regression (PLSR), support vector machine regression (SVMR), and artificial neural network (ANN), with the coefficient of determination of calibration (R2cal) = 0.97 and prediction (R2pred) = 0.8, the root mean square error of calibration (RMSEC) = 25.29 and prediction (RMSEP) = 28.42, and the ratio of prediction to deviation of 4.02 showed that NIRS technology combined with suitable regression approaches has promising results for non-destructive determination of TA of intact mangoes [15].
Vis-NIR spectral signal detection of pomelo fruit during storage in the study of Xu et al. (2020) showed that combining modeling methods and extracting optimal information with Vis-NIR is a suitable solution for determining the content of pomelo juice after harvesting and providing references for non-destructive internal quality detection of large fruits [16].
By combining a portable NIR spectrometer and chemometric techniques, Amuah et al. (2019) simultaneously identified organically produced pineapple fruits from conventionally produced fruits and predicted TSS. In their method, organic fruit was accurately identified from conventionally produced fruits with a 100% identification rate. For TSS quantification, the MSC-PLSR model provided Rp = 0.851 and RMSEC = 0.950 °Brix and Rc = 0.854 and RMSEP = 0.842 °Brix, respectively [17].
In the study by Castrignanò et al. (2019) entitled “Assessing the feasibility of using a miniature near-infrared (NIR) spectrometer to determine the quality characteristics of tomato fruits”, simultaneously, several quality characteristics were determined using reference methods: fresh weight, pH, dry matter, color values, electrical conductivity, titratable acidity, and soluble solid content. By combining the spectra with chemical features, they found that the best way to obtain NIR data on tomato fruits is to scan the entire equatorial region due to the heterogeneous internal structure of the fruit. Furthermore, after a suitable pre-processing of the data, accurate predictive models were obtained using partial least squares (PLS) regression to estimate the physical and chemical properties of tomatoes in a fast and non-destructive way [18].
Shao et al.’s (2019) study used visible and near-infrared reflectance spectroscopy (Vis-NIR) to identify the degree of cherry bruising at a wavelength of 2500–350 nm. Spectral sampling data were extracted from normal, mild, and severe bruising samples. Principal component analysis (PCA) was performed to determine the first principal components (PCs) for cluster analysis among samples. Their results showed that Vis-NIR reflectance spectroscopy integrated with multivariate analysis can be used as a fast and safe method to determine the degree of cherry bruising, creating a basis for cherry grading and post-harvest quality control [19].
In the research of Pourdarbani et al. (2020), the soluble solid content, pH, total acidity, and ascorbic acid of apple fruit were also successfully estimated using NIR technology [20].
Bian et al. (2021) studied the classification of apple juice based on variety and geographical origin. They used PLS regression and fluorescent spectroscopy to analyze fluorescent spectra with two types of apple fruit. The results showed that fluorescent spectroscopy combined with PLS method was successful in controlling the quality of fruit juice [21].
Based on the mentioned cases, the present research used NIR spectroscopy and PLS regression to non-destructively detect the quality parameters of apple fruit. This method is of great importance due to its lack of need for sample preparation, no need for special skills, field usability, fast measurement, and no waste generation and its accurate, reliable, efficient, and non-invasive nature.

2. Materials and Methods

2.1. Sample Preparation

In this study, 120 apple samples, including 60 Red Delicious and 60 Golden Delicious apples, were randomly selected from among the fruits of an orchard in Ardabil. The samples were of the same size and appearance, without any damage and disease. The samples were spectrophotometered without any preparation, which is one of the advantages of visible/near-infrared spectroscopy.

2.2. Used Spectroscopic Equipment

2.2.1. Spectroradiometer

Vis/NIR spectroscopic tests were performed using a spectroradiometer model PS-100 (Apogee Instruments, INC., Logan, Utah, USA) with a CCD detector, 2048 pixels, and with a resolution of 1 nm and a probe in the wavelength range of 350–1100 nm (Figure 1).

2.2.2. Preparation of Vis/NIR Spectra of Samples

Vis/NIR measurements were performed in the spectral range of 350–1150 nm. Before spectrometry, dark and white (reference) spectra were first defined and stored. In this way, first by turning off the light source, the dark spectrum was taken. Then, in the bright light source mode, a standard disc (Figure 1) that had a high reflectance of 97% was used to store the reference spectrum. Vis/NIR spectroscopy was performed for all apple samples in four areas with an angle of 45 degrees using a prop, and the spectra were saved in each area (Figure 2). The average spectrum obtained from each sample was considered as its representative spectrum.

2.3. Reference Measurements (Destructive)

(1).
pH measurement was based on the method of Hasanzadeh et al. (2022) [22] with digital pH meter model inolab 7110;
(2).
Measurement of TA was based on the method of Jalili Marandi et al., 2004, with the following formula [23]:
T A = m l ( N a O H ) × N ( N a O H ) × a c i d m e q . f a c t o r m l j u i c e × 100  
(3).
Measurement of SSC was based on the method of Hasanzadeh et al. (2022) [22] with an optical refractometer model PAL-1 manufactured by ATAGO, Japan, with an accuracy of 0.1 °Brix;
(4).
Measurement of total phenol (TP) was based on the method of Du et al., 2009 [24] with spectrophotometer model (Termo One C-Termo Scientific-Waltham, CA, USA).

2.4. Model Development

By removing the noises and reducing the spectral data to the range of 450–1250 nm, spectral data preprocessing was done using Unscrambler X 10.4 software (CAMO Software AS, Oslo, Norway), and the best preprocessing was selected among them. In order to validate the ability of the developed models, the data were randomly divided into two categories: calibration and prediction, with a ratio of 70% to 30%. For this purpose, validation of compiled models and selection of the best model was done by calculating Rc, RMSEC, Rcv, RMSECV, and SDR based on the study of Hassanzadeh et al. (2022) [22].
Figure 3 shows the block diagram of the test steps.

3. Results

3.1. Multivariate Regression Modeling

According to the results of RMSEC (lowest value), Rc, and SDR (highest value), the best pre-processing was selected among the available pre-processing for each parameter.

3.2. pH Detection

The presented results related to Vis/NIR spectroscopy in Table 1 show that in both red and yellow apples, all the pre-processing performed as well as the spectra without pre-processing in ability to predict pH. The best-developed model for red apple pH prediction was obtained in 2stDerivatives preprocessing with RMSEC = 0.009, rc = 0.991, SDR = 2.51. In yellow apples, the best pH prediction with acceptable accuracy was related to MSC preprocessing (RMSEC = 0.005, rc = 0.998, SDR = 2.56).
The graph of model error changes vs. number of the main component in Vis/NIR spectroscopy in Figure 4 shows that for red and yellow apples, at the beginning, the model error is high in the number of LVS less than the optimal LVS due to poor fit, until the model error decreased with increasing LVS and RMSECV = 0.014 in LVS = 9 for red apple and RMSECV = 0.010 in yellow apple in LVS = 11. Figure 5 shows the predicted pH values by the best prediction model based on Vis/NIR spectra versus the measured values by the pH meter.
Moons et al. (1998) reported a correlation coefficient equal to 0.78 and a standard error of prediction of 0.10 for apple pH prediction, which is consistent with our results. Of course, since the equipment and working range of spectrometers and the mode used, the type of pre-processing and chemometric methods, as well as the variety and quality characteristics of fruits and many other things are different, it is suggested that the results of spectrometry are not compared with each other [25].

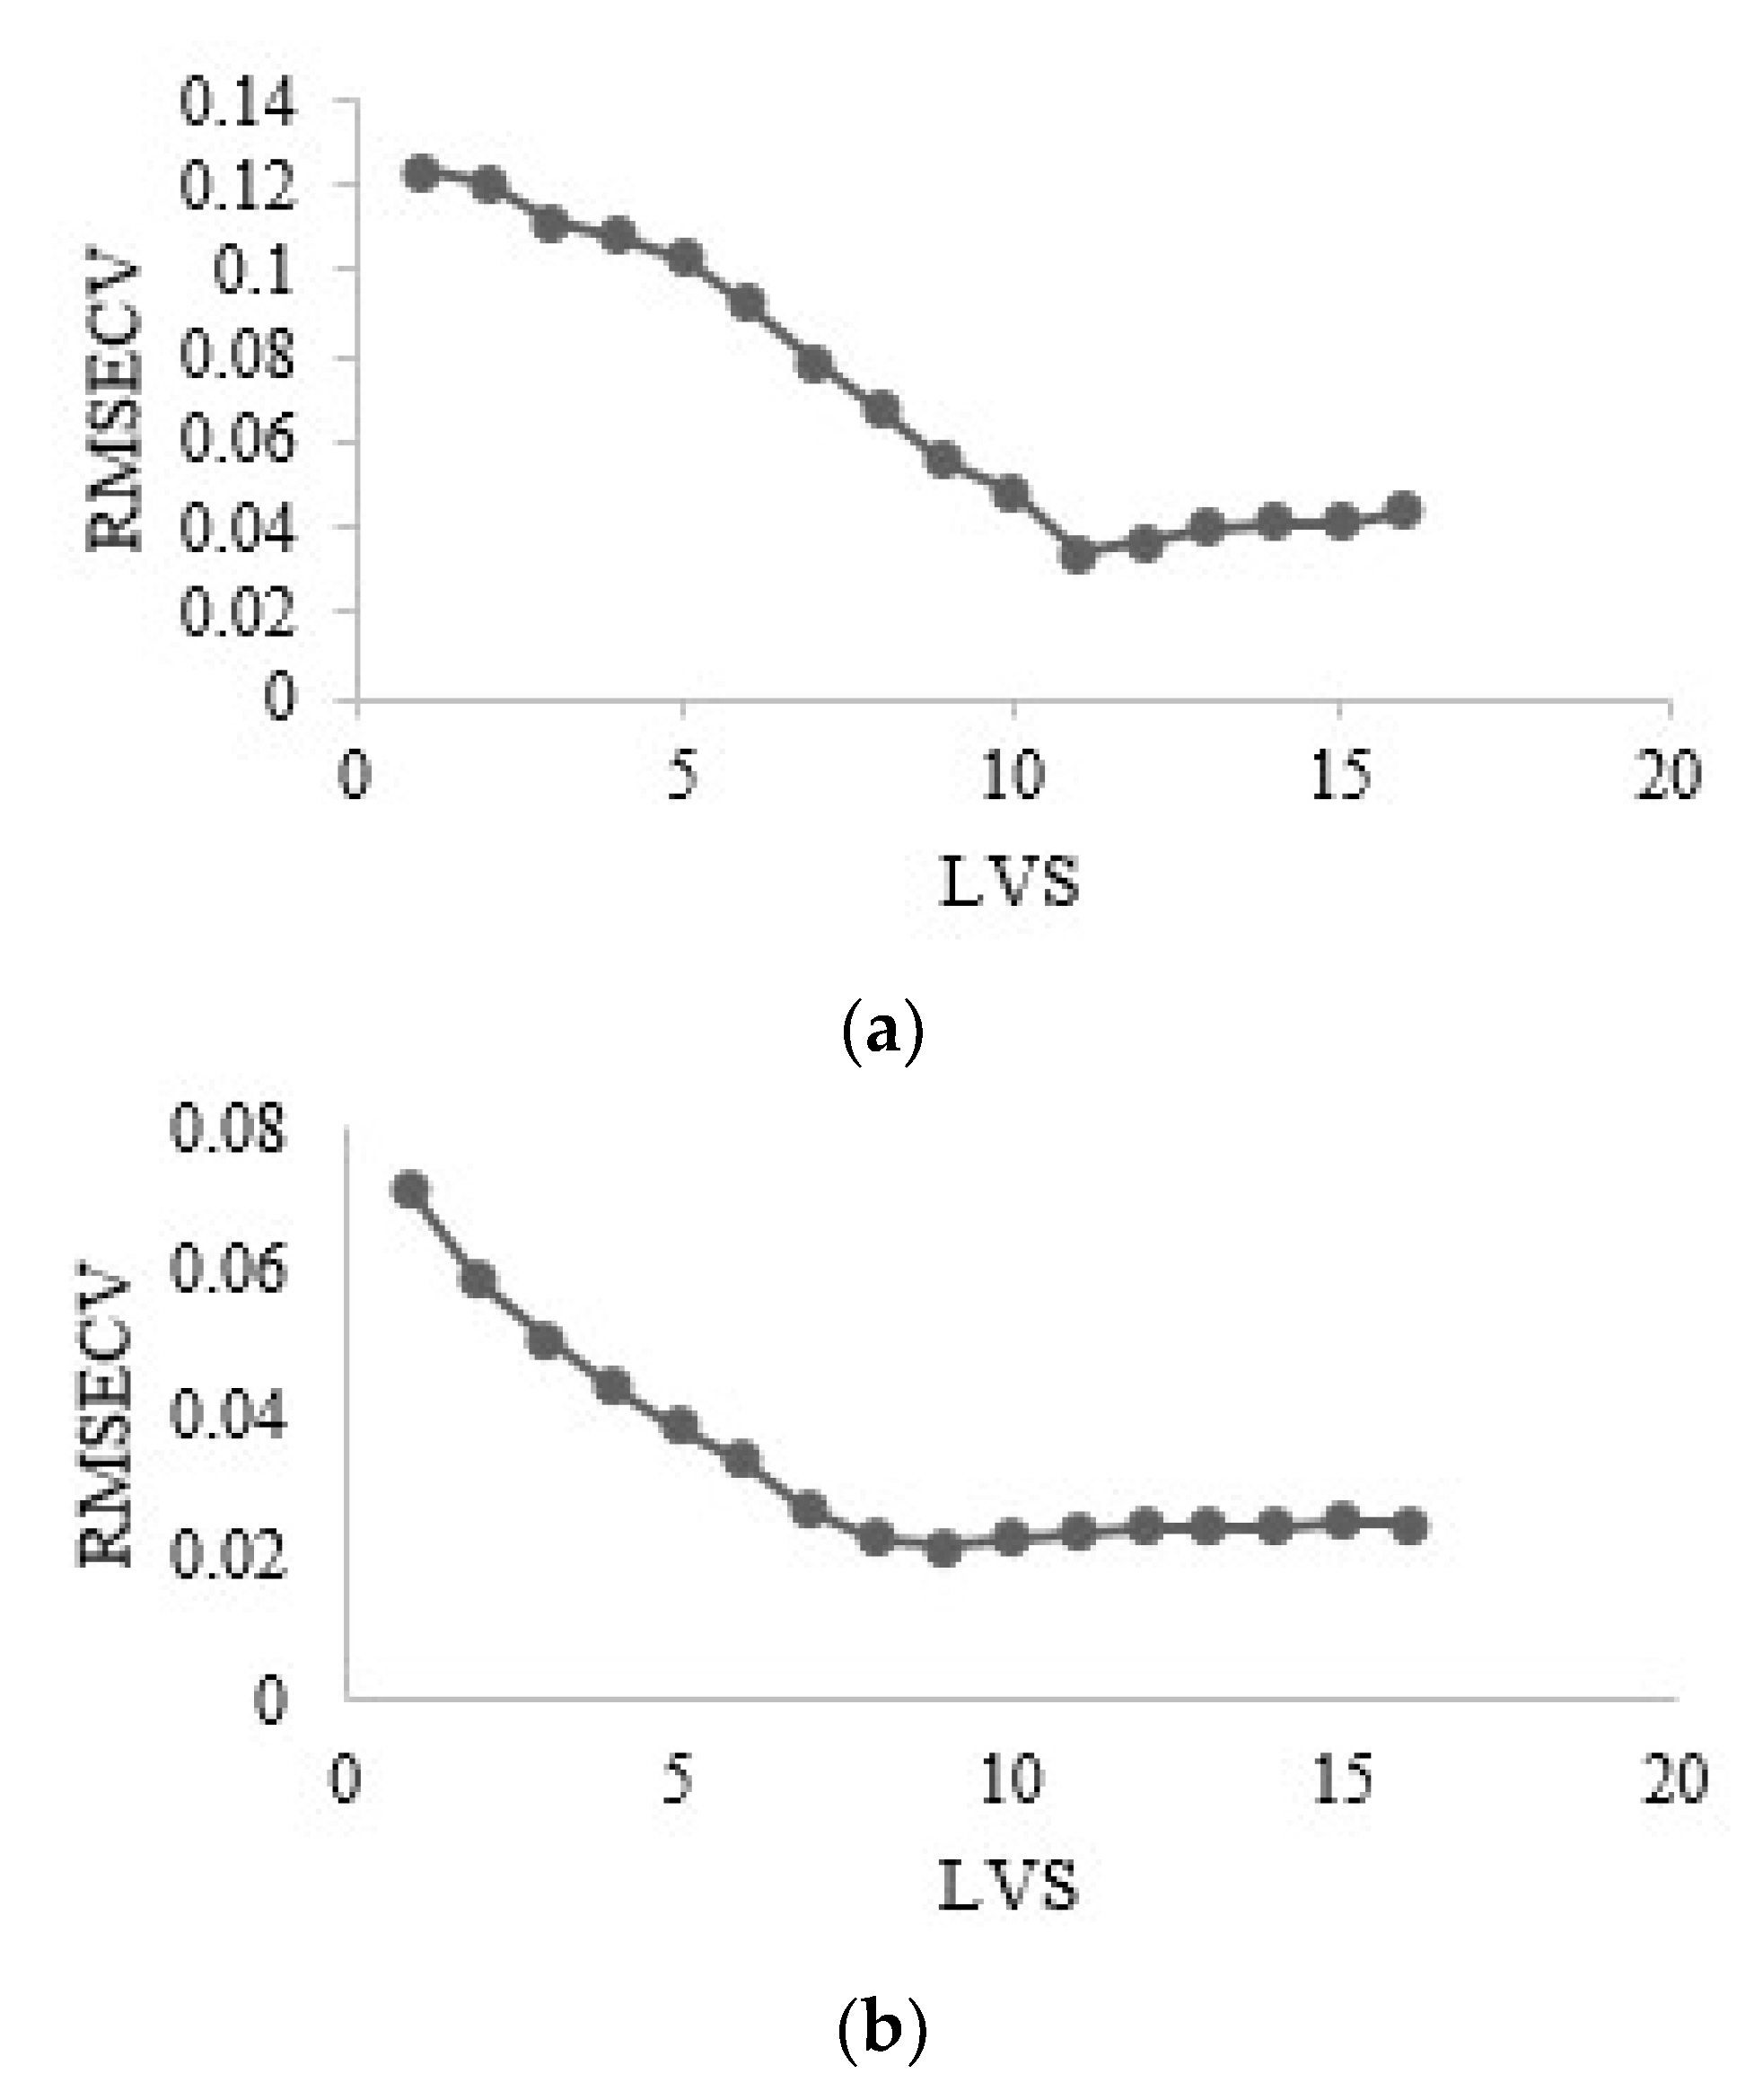
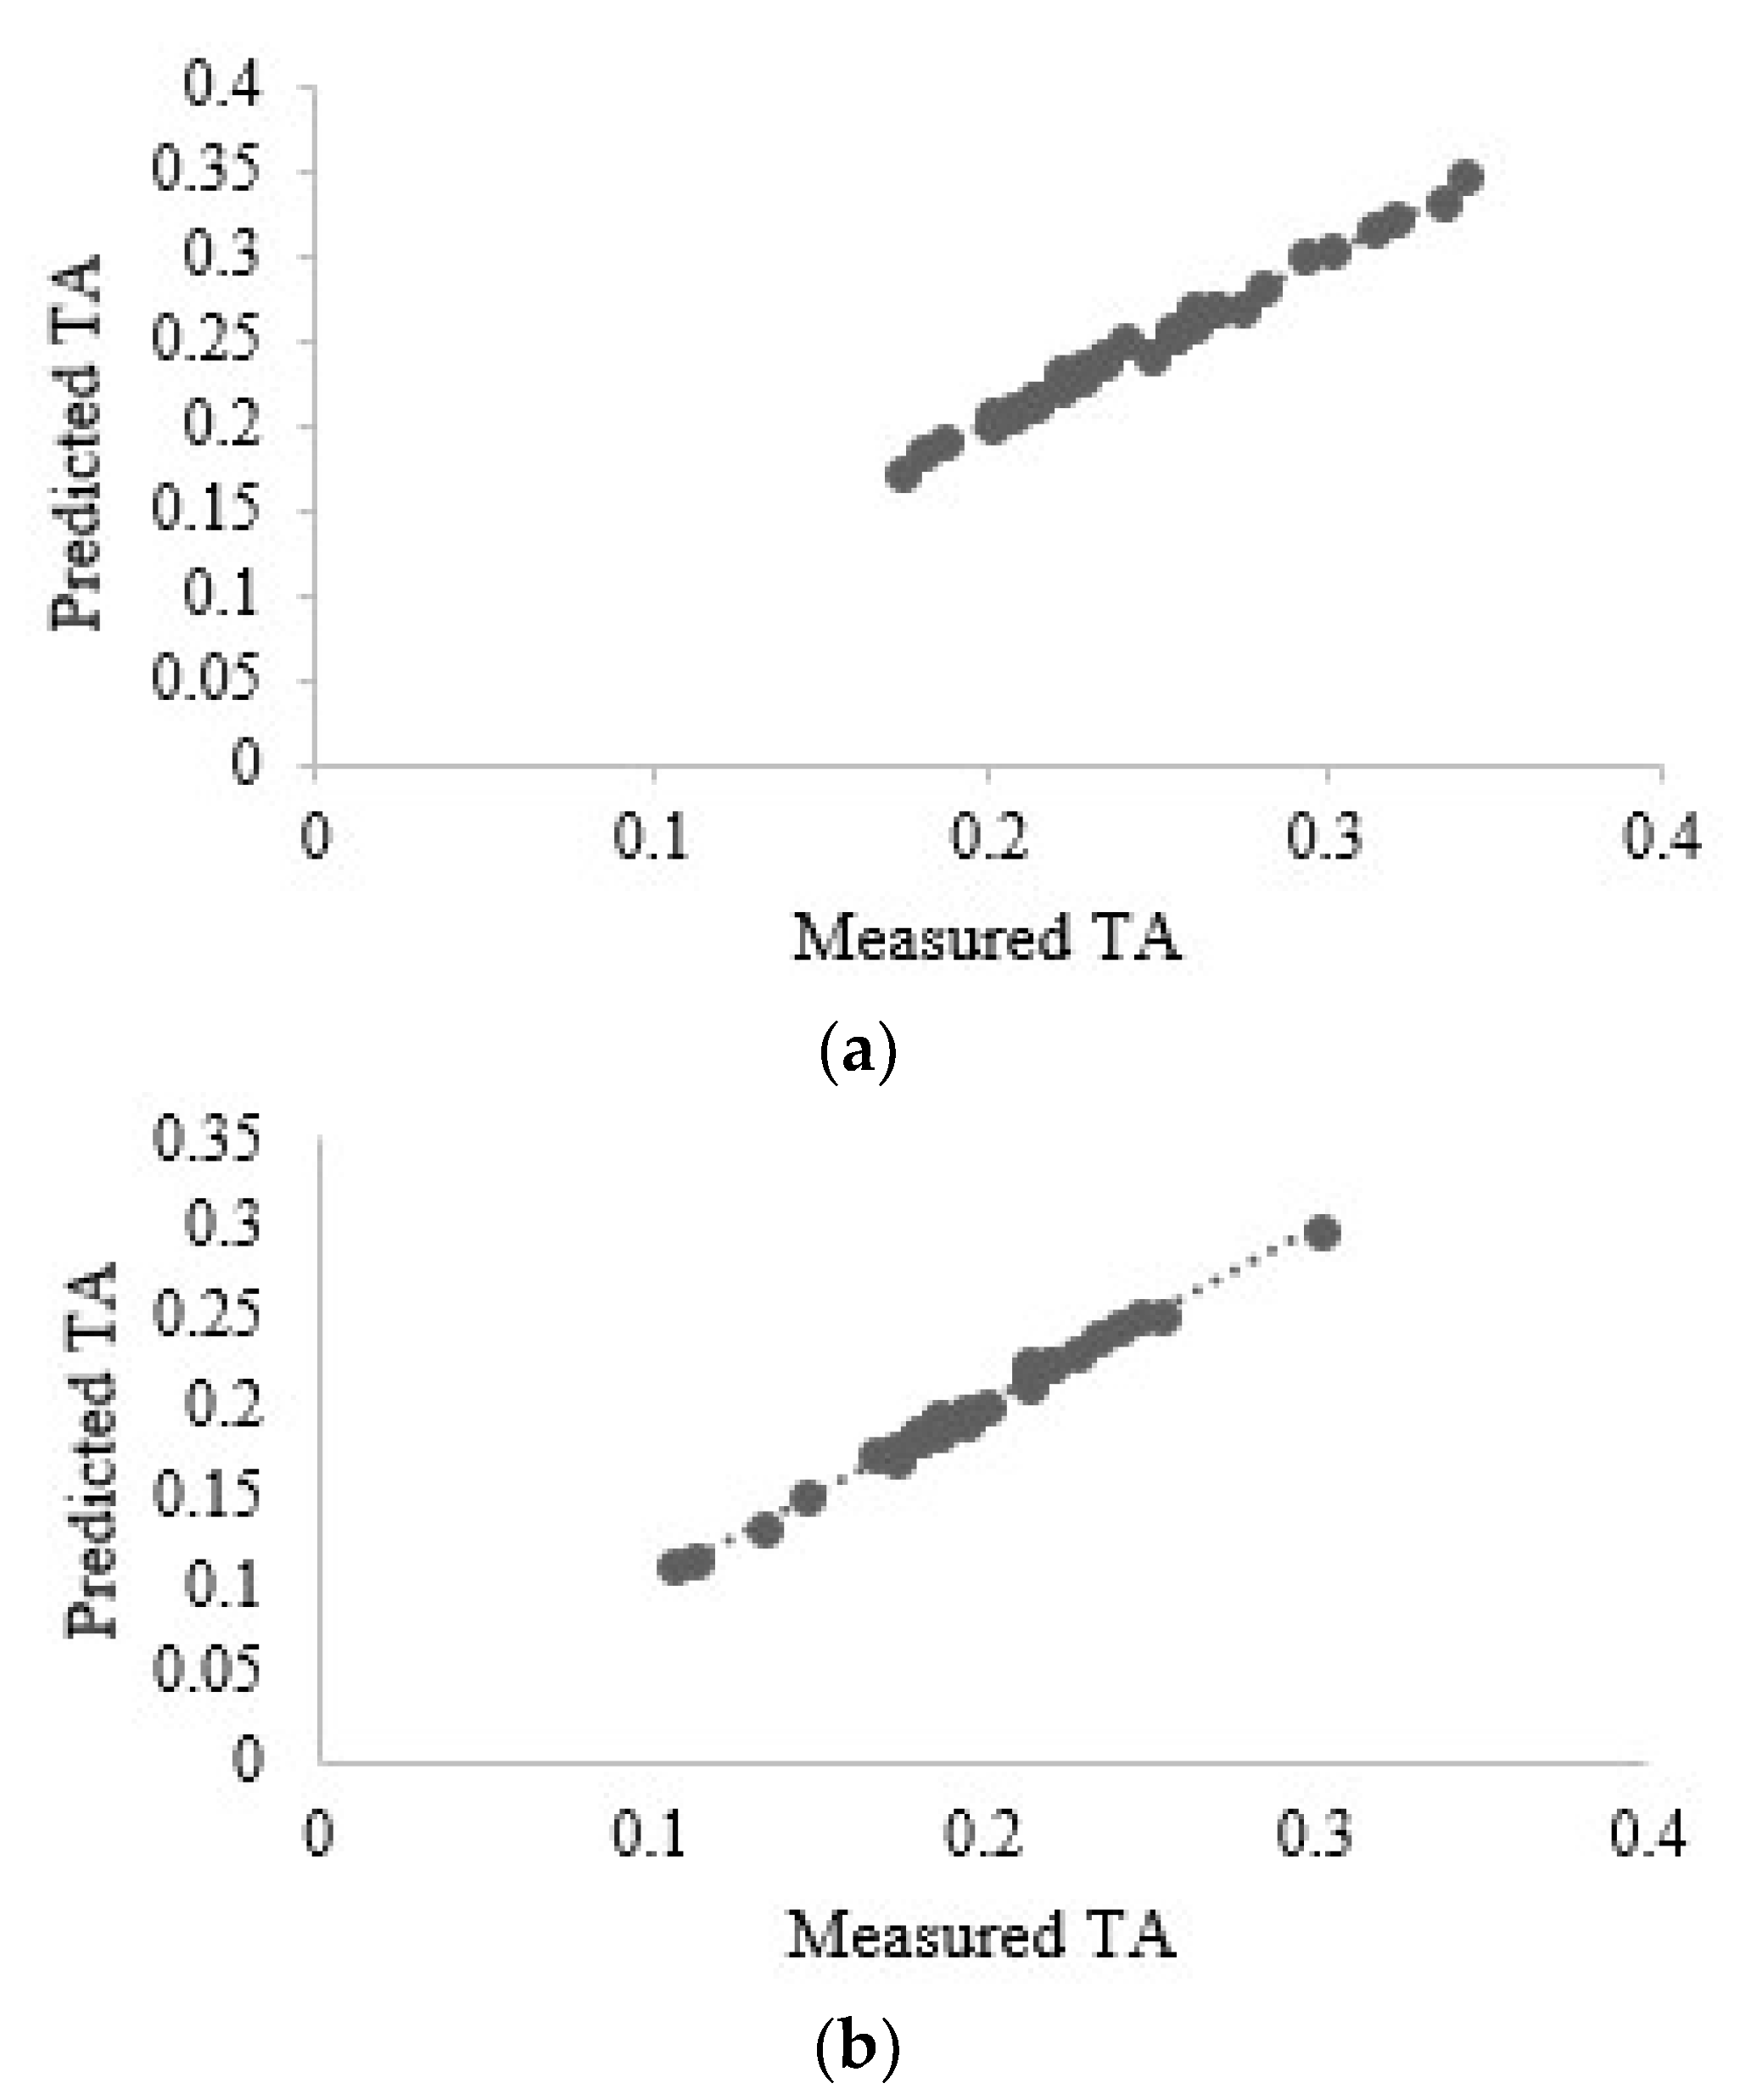
3.3. Detection of Titratable Acidity (TA)

Table 2 shows the results of calibration and prediction of titratable acid (TA) for red and yellow apples, respectively, with the PLS model developed based on the combination of different pre-processing and Vis/NIR spectra. Based on the results presented in Table 2, red apple TA in the preprocessing of 1stDerivatives resulted in the best prediction results. The accuracy of the results obtained in this preprocessing (1stDerivatives) indicates that use of the Vis/NIR spectroscopy method was able to detect titratable acid with moderate accuracy (RMSEC = 0.003, rc = 0.996, SDR = 2.51) for red apples. In yellow apples, SNV and MSC + SNV preprocessing also predicted the TA value with moderate accuracy, and because the results of both methods were similar, they were chosen as the best prediction results.
Figure 6 shows the RMSECV diagrams in each LV for the best prediction model in red and yellow apples based on Vis/NIR spectroscopy. According to the figure, the mentioned multivariate regression models had the lowest RMSECV at LVS = 10 for both red and yellow apples, which provided the best results for predicting the TA index of the samples. The results of predicting titratable acid based on Vis/NIR spectra for red and yellow apples with the best regression models developed for each are shown in Figure 7.
In the research conducted by Nturambirwe et al. (2019) [26] in the field of predicting the titratable acid of apples using spectroscopy, the prediction accuracy of this attribute had a correlation coefficient of 0.7, and the root mean square error of prediction was 0.1 in the limited wavelength regions of 7498.1–9403.5 cm−1.

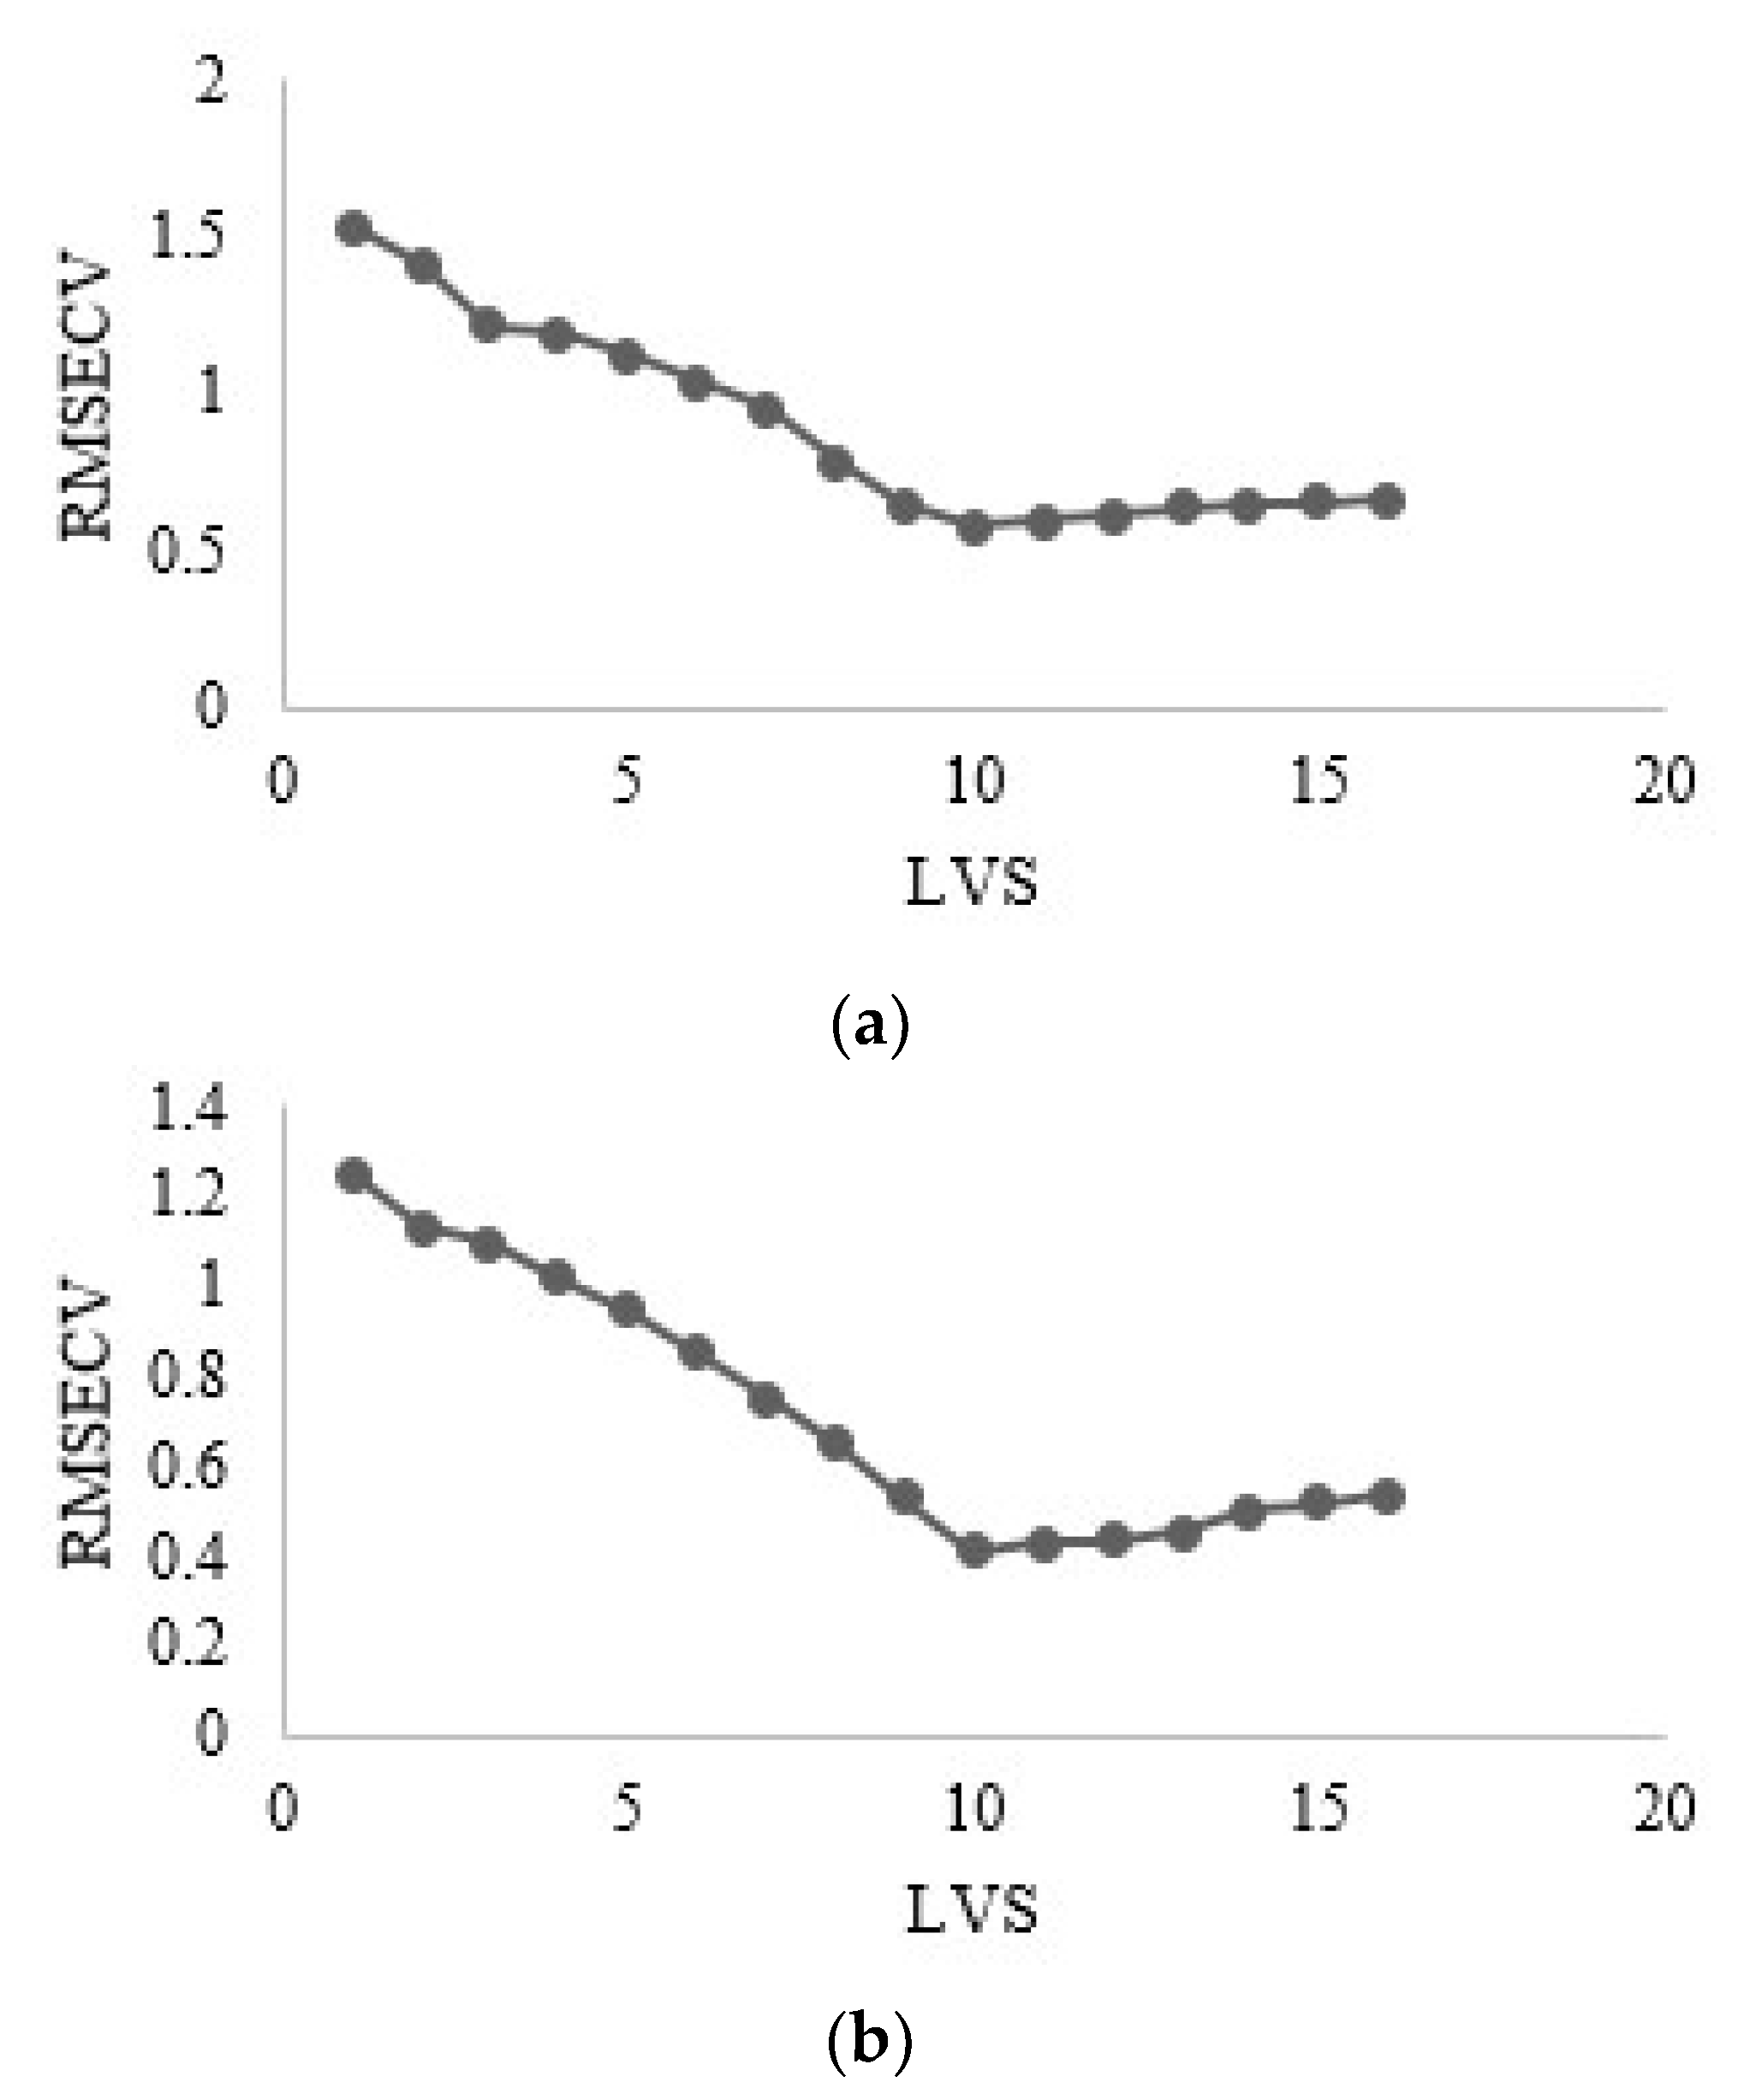
3.4. Detection of Soluble Solids Content (SSC)

Table 3 shows the results of calibration and validation of PLS models based on different pre-processing of Vis/NIR spectra for measuring soluble solids content (SSC) of red and yellow apple samples.
Based on the validation of models in red apple (Table 3), the best multivariate regression model in Vis/NIR spectroscopy was determined for predicting soluble solids content by preprocessing 2stDerivatives in this variety. This model was implemented in LVS = 10, where RMSEC = 0.209, rc = 0.990, and SDR = 2.82 were obtained, indicating the good accuracy of the developed model. The SSC of yellow apple was best predicted by Vis/NIR spectroscopy in MSC pre-processing with LVs = 10, RMSEC = 0.054, SDR = 2.67, and rc = 0.999. These results are depicted in Figure 8.
Figure 9 shows the predicted values of TA by the best prediction model based on Vis/NIR spectra vs. the measured values.
The results of the research findings of most researchers show that the soluble solids content of different apple cultivars can be predicted with good accuracy using the near infrared spectroscopy method. In the research conducted by Xiaobo et al. (2007) [27] to predict SSC, the value of correlation coefficient was 0.83 and the root mean square error of prediction was 1.1. In another research, McGlone and Kawano (1998) [28] were able to predict the amount of soluble solids content in apples with R2 = 0.93. In addition, Fan et al. (2020) concluded that the developed device had considerable potential to detect the SSC of apple in practical situations [29]. Tian et al. (2020) confirmed the accuracy of Vis/NIR for rapid and real-time detection of internal quality of thick-skinned fruits [30].

3.5. Detection of Total Phenol (TP)

The validation results of PLS calibration models based on the combination of different pre-processing of Vis/NIR spectra to predict the total phenol (TP) of red and yellow apples are given in Table 4. Table 4 shows that in Vis/NIR spectroscopy, the 2stDerivatives with RMSEC = 2.752, rc = 0.989, and SDR = 2.05 was selected as the best prediction model for red apple total phenol. In yellow apples, MSC + SNV and SNV pre-processing were selected as the best models with the results of RMSEC = 1.457, rc = 0.998, and SDR = 1.61.
The error changes of the models based on the change in the number of the main component for TP in Figure 10 show that in Vis/NIR spectroscopy, both red and yellow apples had the least error in the best pre-processing at LVS = 11.
The predicted values of TP by the best model vs. its measured values are shown in Figure 11 based on Vis/NIR spectroscopy.
Pissard et al. (2013) [31] developed an LS-SVM model to predict total phenol content in apples using spectra recorded in the 400–2500 nm region. In his research, it was proved that the S-G derivative is the best pre-processing method. This model performed well with rp = 0.97 and RMSEP = 140 mg/g. A similar result was obtained by Bureau et al. (2012) [32], who applied mid-infrared spectroscopy in the range of 6378–9900 nm. The PLS model they created performed very well, with rp = 0.98 and RMSEP = 0.09. They also found that phenolic compounds, unlike sugar and organic acid content, can be affected by sample oxidation, abrasion, and storage temperature in descending order. These two pieces of research proved the possibility of predicting the total phenol level in apples using spectroscopic technology.

4. Conclusions

The results obtained from this research showed that non-destructive method of near-infrared spectroscopy by spectroradiometer model PS-100 with a CCD detector of 2048 pixels in the range of 110–350 nm with a transmission mode has a high ability to measure the pH, SSC, TA, and TP parameters of red and yellow apples.
In this research, spectrometry was first performed using a spectroradiometer. Then, reference measurements were performed using chemical properties. The results of the data analysis showed that the SDR of the best prediction accuracy related to pH parameters for red and yellow apples is 2.51 and 2.56, respectively; TA for red and yellow apples is 2.51 and 2.81, respectively; and for SSC in red and yellow apples, it is 2.82 and 2.67, respectively, which indicates excellent accuracy (SDR < 2.5). In addition, SDR of the best prediction accuracy related to TP parameter in the spectroscopy method for red apples was 2.05 with good accuracy (SDR < 2) and for yellow apples was 1.61 with moderate accuracy (SDR < 1.5).
The parameters studied in this research are of particular importance due to the prevention of product wastage by determining its ripening time, shelf life, and export benefits.
According to the results obtained from this research, the following are suggested in future research:
  • The results of this research should be used in order to build a system for the diagnosis and grading of apples based on qualitative characteristics and based on radiometry;
  • The non-destructive method of Vis/NIR spectroscopy should be used to detect other quality characteristics that are difficult to measure by destructive methods, including apple antioxidants, amino acids, vitamins, etc.;
  • Separate calibration models should be developed for quality evaluation of other important apple cultivars.

Author Contributions

Conceptualization, B.H., Y.A.-G. and A.S.-N.; methodology, B.H., Y.A.-G. and A.S.-N.; software, B.H. and A.S.-N.; validation, Y.A.-G., A.S.-N. and J.L.H.-H.; formal analysis, B.H., Y.A.-G. and A.S.-N.; investigation, B.H. and A.S.-N.; resources, B.H., Y.A.-G. and A.S.-N.; data curation, B.H. and A.S.-N.; writing—original draft preparation, B.H. and A.S.-N.; writing—review and editing, Y.A.-G., E.D.L.C.-G., J.L.H.-H. and M.M.-A.; visualization, B.H. and A.S.-N.; supervision, Y.A.-G.; project administration, Y.A.-G.; funding acquisition, Y.A.-G., E.D.L.C.-G., J.L.H.-H. and M.M.-A. All authors have read and agreed to the published version of the manuscript.

Funding

This research was funded by University of Mohaghegh Ardabili.

Institutional Review Board Statement

Not applicable.

Informed Consent Statement

Not applicable.

Data Availability Statement

The data presented in this study are available on request from the corresponding author.

Conflicts of Interest

The authors declare no conflict of interest.

References

  1. Juran, J.; Godferi, B. Juran’s Quality Handbook; Mahdavi, S.; Entesarian, F., Translators; Management and Quality Publications: Tehran, Iran, 2006. (In Farsi) [Google Scholar]
  2. Woodward, R. The Organisation for Economic Co-Operation and Development (OECD); Routledge: Oxfordshire, UK, 2009. [Google Scholar]
  3. Sharabiani, V.R.; Sabzi, S.; Pourdarbani, R.; Szymanek, M.; Michałek, S. Inner Properties Estimation of Gala Apple Using Spectral Data and Two Statistical and Artificial Intelligence Based Methods. Foods 2021, 10, 2967. [Google Scholar] [CrossRef] [PubMed]
  4. Lorente, D.; Blasco, J.; Serrano, A.J.; Soria-Olivas, E.; Aleixos, N.; Gómez-Sanchis, J. Comparison of ROC feature selection method for the detection of decay in citrus fruit using hyperspectral images. Food Bioprocess Technol. 2013, 6, 3613–3619. [Google Scholar] [CrossRef] [Green Version]
  5. Wu, D.; Sun, D.-W. Advanced applications of hyperspectral imaging technology for food quality and safety analysis and assessment: A review—Part I: Fundamentals. Innov. Food Sci. Emerg. Technol. 2013, 19, 1–14. [Google Scholar] [CrossRef]
  6. Khodabakhshian, R.; Emadi, B.; Khojastehpour, M.; Golzarian, M.R.; Sazgarnia, A. Quick quality evaluation of pomegranate arils using NIR spectroscopy. Innov. Food Technol. 2015, 2, 103–114. [Google Scholar]
  7. Bagherpour, H.; Minaei, S.; Noghbi, M.A.; Fardavani, M.E.K. A development of a real time sugar beet yield monitoring system and mapping product quality and quantity. In Proceedings of the 8th National Congress on Agr. Machinery Eng. (Biosystem) & Mechanization, Mashhad, Iran, 29–31 January 2013. (In Farsi). [Google Scholar]
  8. Walsh, K.B.; Blasco, J.; Zude-Sasse, M.; Sun, X. Visible-NIR ‘point’spectroscopy in postharvest fruit and vegetable assessment: The science behind three decades of commercial use. Postharvest Biol. Technol. 2020, 168, 111246. [Google Scholar] [CrossRef]
  9. Masilamani, P.; Venkatesan, S.; Janaki, P.; Eevera, T.; Sundareswaran, S.; Rajkumar, P. Role of near-infrared spectroscopy in seed quality evaluation: A review. Agric. Rev. 2020, 41, 106–115. [Google Scholar] [CrossRef]
  10. Lan, W.; Jaillais, B.; Leca, A.; Renard, C.M.; Bureau, S. A new application of NIR spectroscopy to describe and predict purees quality from the non-destructive apple measurements. Food Chem. 2020, 310, 125944. [Google Scholar] [CrossRef]
  11. Li, X.; Zhang, L.; Zhang, Y.; Wang, D.; Wang, X.; Yu, L.; Zhang, W.; Li, P. Review of NIR spectroscopy methods for nondestructive quality analysis of oilseeds and edible oils. Trends Food Sci. Technol. 2020, 101, 172–181. [Google Scholar] [CrossRef]
  12. Cen, H.; He, Y. Theory and application of near infrared reflectance spectroscopy in determination of food quality. Trends Food Sci. Technol. 2007, 18, 72–83. [Google Scholar] [CrossRef]
  13. Huang, L.; Meng, L.; Zhu, N.; Wu, D. A primary study on forecasting the days before decay of peach fruit using near-infrared spectroscopy and electronic nose techniques. Postharvest Biol. Technol. 2017, 133, 104–112. [Google Scholar] [CrossRef]
  14. Nazarloo, A.; Sharabiani, V.; Gilandeh, Y.; Taghinezhad, E.; Szymanek, M. Evaluation of Different Models for Non-Destructive Detection of Tomato Pesticide Residues Based on Near-Infrared Spectroscopy. Sensors 2021, 21, 3032. [Google Scholar] [CrossRef] [PubMed]
  15. Munawar, A.A.; Meilina, H.; Pawelzik, E. Near infrared spectroscopy as a fast and non-destructive technique for total acidity prediction of intact mango: Comparison among regression approaches. Comput. Electron. Agric. 2022, 193, 106657. [Google Scholar] [CrossRef]
  16. Xu, S.; Lu, H.; Ference, C.; Qiu, G.; Liang, X. Rapid nondestructive detection of water content and granulation in postharvest “shatian” pomelo using visible/near-infrared spectroscopy. Biosensors 2020, 10, 41. [Google Scholar] [CrossRef] [Green Version]
  17. Amuah, C.L.; Teye, E.; Lamptey, F.P.; Nyandey, K.; Opoku-Ansah, J.; Adueming, P.O. Feasibility study of the use of handheld NIR spectrometer for simultaneous authentication and quantification of quality parameters in intact pineapple fruits. J. Spectrosc. 2019, 2019, 5975461. [Google Scholar] [CrossRef] [Green Version]
  18. Castrignanò, A.; Buttafuoco, G.; Malegori, C.; Genorini, E.; Iorio, R.; Stipic, M.; Girone, G.; Venezia, A. Assessing the feasibility of a miniaturized near-infrared spectrometer in determining quality attributes of san marzano tomato. Food Anal. Methods 2019, 12, 1497–1510. [Google Scholar] [CrossRef]
  19. Shao, Y.; Xuan, G.; Hu, Z.; Gao, Z.; Liu, L. Determination of the bruise degree for cherry using Vis-NIR reflection spectroscopy coupled with multivariate analysis. PLoS ONE 2019, 14, e0222633. [Google Scholar] [CrossRef]
  20. Pourdarbani, R.; Sabzi, S.; Kalantari, D.; Karimzadeh, R.; Ilbeygi, E.; Arribas, J.I. Automatic non-destructive video estimation of maturation levels in Fuji apple (Malus Malus pumila) fruit in orchard based on colour (Vis) and spectral (NIR) data. Biosyst. Eng. 2020, 195, 136–151. [Google Scholar] [CrossRef]
  21. Bian, H.; Sheng, L.; Yao, H.; Ji, R.; Yu, Y.; Chen, R.; Wei, D.; Han, Y. Application of fluorescence spectroscopy in classifying apple juice according to the variety. Optik 2021, 231, 166361. [Google Scholar] [CrossRef]
  22. Hasanzadeh, B.; Abbaspour-Gilandeh, Y.; Soltani-Nazarloo, A.; Hernández-Hernández, M.; Gallardo-Bernal, I.; Hernández-Hernández, J.L. Non-Destructive Detection of Fruit Quality Parameters Using Hyperspectral Imaging, Multiple Regression Analysis and Artificial Intelligence. Horticulturae 2022, 8, 598. [Google Scholar] [CrossRef]
  23. Marandi, R.J. Postharvest Physiology (Handling and Storage of Fruits, Vegetables and Ornamental Plants); Publishers Jihad Urmia University: Urmia, Iran, 2004; p. 276. [Google Scholar]
  24. Du, G.; Li, M.; Ma, F.; Liang, D. Antioxidant capacity and the relationship with polyphenol and vitamin C in Actinidia fruits. Food Chem. 2009, 113, 557–562. [Google Scholar] [CrossRef]
  25. Moons, E.; Sinnaeve, G.; Dardenne, P. Non destructive visible and NIR spectroscopy measurement for the determination of apple internal quality. In Proceedings of the XXV International Horticultural Congress, Part 7: Quality of Horticultural Products, Brussels, Belgium, 2–7 August 1998. [Google Scholar]
  26. Nturambirwe, J.F.I.; Nieuwoudt, H.H.; Perold, W.J.; Opara, U.L. Non-destructive measurement of internal quality of apple fruit by a contactless NIR spectrometer with genetic algorithm model optimization. Sci. Afr. 2019, 3, e00051. [Google Scholar] [CrossRef]
  27. Xiaobo, Z.; Jiewen, Z.; Xingyi, H.; Yanxiao, L. Use of FT-NIR spectrometry in non-invasive measurements of soluble solid contents (SSC) of ‘Fuji’apple based on different PLS models. Chemom. Intell. Lab. Syst. 2007, 87, 43–51. [Google Scholar] [CrossRef]
  28. McGlone, V.A.; Kawano, S. Firmness, dry-matter and soluble-solids assessment of postharvest kiwifruit by NIR spectroscopy. Postharvest Biol. Technol. 1998, 13, 131–141. [Google Scholar] [CrossRef]
  29. Fan, S.; Wang, Q.; Tian, X.; Yang, G.; Xia, Y.; Li, J.; Huang, W. Non-destructive evaluation of soluble solids content of apples using a developed portable Vis/NIR device. Biosyst. Eng. 2020, 193, 138–148. [Google Scholar] [CrossRef]
  30. Tian, X.; Li, J.; Yi, S.; Jin, G.; Qiu, X.; Li, Y. Nondestructive determining the soluble solids content of citrus using near infrared transmittance technology combined with the variable selection algorithm. Artif. Intell. Agric. 2020, 4, 48–57. [Google Scholar] [CrossRef]
  31. Pissard, A.; Pierna, J.A.F.; Baeten, V.; Sinnaeve, G.; Lognay, G.; Mouteau, A.; Dupont, P.; Rondia, A.; Lateur, M. Non-destructive measurement of vitamin C, total polyphenol and sugar content in apples using near-infrared spectroscopy. J. Sci. Food Agric. 2013, 93, 238–244. [Google Scholar] [CrossRef] [PubMed]
  32. Bureau, S.; Ścibisz, I.; Le Bourvellec, C.; Renard, C.M. Effect of sample preparation on the measurement of sugars, organic acids, and polyphenols in apple fruit by mid-infrared spectroscopy. J. Agric. Food Chem. 2012, 60, 3551–3563. [Google Scholar] [CrossRef] [PubMed]
Figure 1. Spectrometer.
Sustainability 14 14918 g001
Figure 2. Measurement of Vis/NIR spectra of apple samples.
Sustainability 14 14918 g002
Figure 3. Block diagram of test method.
Sustainability 14 14918 g003
Figure 4. Changes of RMSECV vs. LVS to predict pH for the best preprocessing (2stDerivatives) for red (a) and (MSC) for yellow apples (b) in spectroscopy.
Sustainability 14 14918 g004
Figure 5. Predicted values of pH with the best developed models vs. its measured values (a) for red apple (b) yellow apple in Vis/NIR spectroscopy.
Sustainability 14 14918 g005
Figure 6. Changes of RMSECV vs. LVS to predict TA for the best preprocessing (1stDerivatives) (a) for red and (SNV, MSC + SNV)) for yellow apples (b) in Vis/NIR spectroscopy.
Sustainability 14 14918 g006
Figure 7. Predicted values of titratable acidity (TA) with the best developed models vs. its measured values for red apples (a) and yellow apples (b) in Vis/NIR spectroscopy.
Sustainability 14 14918 g007
Figure 8. Changes of RMSECV vs. LVS to predict SSC for the best preprocessing (2stDerivatives) (a) for red apples and MSC for yellow apples (b) in Vis/NIR spectroscopy.
Sustainability 14 14918 g008
Figure 9. Predicted values of soluble solids content (SSC) with the best developed models vs. its measured values for red apples (a) and yellow apples (b) in Vis/NIR spectroscopy.
Sustainability 14 14918 g009
Figure 10. Changes of RMSECV vs. LVS to predict TP for the best preprocessing (2stDerivatives) (a) for red apples and MSC + SNV and SNV for yellow apples (b) in Vis/NIR spectroscopy.
Sustainability 14 14918 g010
Figure 11. Predicted values of total phenol (TP) with the best developed models vs. its measured values for red apples (a) and yellow apples (b) in Vis/NIR spectroscopy.
Sustainability 14 14918 g011
Table 1. Validation results of PLS models based on different preprocessing methods of NIR spectra for pH of red and yellow apple cultivars.
CultivarsPreprocessingOptimal LVsRcRMSECRcvRMSECVSDR
Red DeliciousNo preprocessing110.9360.0190.9000.0312.49
Gaussian filter110.9620.0190.8910.0332.34
Smoothing S.G110.9360.0240.8380.0401.93
1stDerivatives100.9900.0090.9690.0172.54
2stDerivatives90.9910.0090.9790.0142.51
Normalize110.9770.0150.9290.0262.97
SNV110.9760.0150.9120.0302.57
MSC110.9830.0130.9480.0223.35
MSC + SNV90.9770.0050.9730.0053.45
Golden DeliciousNo preprocessing110.9970.0080.9930.0142.69
Gaussian filter110.9960.0100.9880.0182.53
Smoothing S.G110.9770.0250.9330.0443.08
1stDerivatives110.9980.0060.9970.0093.07
2stDerivatives70.9970.0070.9960.0103.65
Normalize110.9980.0070.9950.0122.30
SNV100.9970.0090.9920.0152.04
MSC110.9980.0050.9960.0102.56
MSC + SNV100.9970.0090.9920.0152.04
The best prediction models are in bold.
Table 2. Validation results of PLS models based on different preprocessing methods of NIR spectra for TA of red apple and yellow apple cultivars.
CultivarsPreprocessingOptimal LVsRcRMSECRcvRMSECVSDR
Red DeliciousNo preprocessing110.9850.0060.9530.0123.54
Gaussian filter110.9580.4370.8720.7871.75
Smoothing S.G110.9640.0100.8840.0192.24
1stDerivatives100.9960.0030.9890.0052.51
2stDerivatives110.9930.0040.9800.0083.32
Normalize110.9910.0050.9730.0092.79
SNV110.9900.0050.9700.0092.72
MSC110.9930.0040.9790.0083.32
MSC + SNV110.9900.0050.9700.0092.72
Golden DeliciousNo preprocessing110.9970.0020.9910.0042.90
Gaussian filter110.9930.0040.9790.0072.66
Smoothing S.G110.9530.0100.8610.0182.2
1stDerivatives110.9980.0020.9960.0032.3
2stDerivatives60.9960.0030.9930.0043.90
Normalize100.9970.0020.9920.0043.90
SNV100.9980.0010.9960.0022.81
MSC90.9970.0020.9940.0032.81
MSC + SNV100.9980.0010.9960.0022.81
The best prediction models are in bold.
Table 3. Validation results of PLS models based on different preprocessing methods of NIR spectra for SSC of red apple and yellow apple cultivars.
CultivarsPreprocessingOptimal LVsRcRMSECRcvRMSECVSDR
Red DeliciousNo preprocessing110.9670.3890.9000.6842.53
Gaussian filter110.9580.4370.8720.7872.20
Smoothing S.G110.8920.6910.6380.2851.35
1stDerivatives100.9880.2280.9700.3702.69
2stDerivatives100.9900.2090.9720.3602.82
Normalize110.9860.2480.9560.4532.83
SNV110.9840.2670.9500.4812.60
MSC110.9850.2550.9610.4242.09
MSC + SNV110.9840.2670.9500.4812.60
Golden DeliciousNo preprocessing110.9980.0650.9950.1172.86
Gaussian filter110.9970.0890.9900.1683.56
Smoothing S.G110.9860.2060.9540.3773.37
1stDerivatives70.9970.0930.9940.1322.63
2stDerivatives70.9980.0750.9960.1072.88
Normalize100.9970.0880.9930.1452.77
SNV90.9960.1030.9910.1612.89
MSC100.9990.0540.9970.0932.67
MSC + SNV90.9960.1030.9910.1612.89
The best prediction models are in bold.
Table 4. Validation results of PLS models based on different preprocessing methods of NIR spectra for phenol red and yellow apple cultivars.
CultivarsPreprocessingOptimal LVsRcRMSECRcvRMSECVSDR
Red DeliciousNo preprocessing110.9764.1610.9257.3122.73
Gaussian filter110.9714.5380.9118.0272.49
Smoothing S.G110.9476.1190.84110.7381.86
1stDerivatives110.9882.8650.9654.9702.02
2stDerivatives110.9892.7520.9664.9312.05
Normalize100.9655.0150.9048.3422.39
SNV110.9803.7970.9267.5252.65
MSC110.9853.2820.9496.2253.21
MSC + SNV110.9803.7970.9267.5252.65
Golden DeliciousNo preprocessing110.9972.0670.9933.5483.03
Gaussian filter110.9952.8890.9874.9432.09
Smoothing S.G110.9815.9680.93811.0272.76
1stDerivatives70.9952.8120.9923.9412.93
2stDerivatives70.9981.7670.9962.4623.30
Normalize110.9981.7390.9943.2512.94
SNV110.9981.4570.9972.3601.61
MSC100.9981.9410.9943.1981.32
MSC + SNV110.9981.4570.9972.3601.61
The best prediction models are in bold.
Publisher’s Note: MDPI stays neutral with regard to jurisdictional claims in published maps and institutional affiliations.

