Article

Catalytic Pyrolysis Process to Produce Styrene from Waste Expanded Polystyrene Using a Semi-Batch Rotary Reactor

by
Gerardo Pérez-Bravo
1,
José Luis Contreras-Larios
1,*,
Jorge Francisco Rodríguez
2,
Beatriz Zeifert-Soares
3,
Deyanira Angeles-Beltrán
4,
Ricardo López-Medina
1,
Tamara Vázquez-Rodríguez
3 and
José Salmones-Blasquez
5
1
Department of Energy, División de Ciencias Básicas e Ingeniería—CBI, Universidad Autónoma Metropolitana—Azcapotzalco, Av. San Pablo 180, Col. Reynosa, Mexico City 02200, Mexico
2
Biomex Solutions, Mexicali 12, Col. Hipódromo, Alc. Cuauhtémoc, Mexico City 06100, Mexico
3
Department of Engineering in Metallurgy and Materials, Escuela de Ingeniería Química e Industrias Extractivas—ESIQIE, Instituto Politécnico Nacional, Av. IPN Col. Lindavista, Mexico City 07738, Mexico
4
Department of Basic Sciences, División de Ciencias Básicas e Ingeniería—CBI, Universidad Autónoma Metropolitana—Azcapotzalco, Av. San Pablo 180, Col. Reynosa, Mexico City 02200, Mexico
5
Sección de Estudios de Posgrado, Instituto Politécnico Nacional, Escuela Superior de Ingeniería Química e Industrias Extractivas-ESIQIE, Av IPN Col. Lindavista, Mexico City 07738, Mexico
*
Author to whom correspondence should be addressed.
Sustainability 2022, 14(22), 14914; https://doi.org/10.3390/su142214914
Submission received: 7 October 2022 / Revised: 27 October 2022 / Accepted: 31 October 2022 / Published: 11 November 2022
(This article belongs to the Special Issue Recycling and Utilization of Waste Polymer)

Abstract

:
Thermal and catalytic pyrolysis of waste expanded polystyrene (WEPS) was studied to obtain mainly styrene monomer, which can be recycled in the polystyrene industry. Initially, preliminary experiments were carried out in a static semi-batch glass reactor with basic catalysts and without catalysts, using toluene as solvent at 250 °C, determining their styrene yields to select the best catalyst. MgO turned out to be the best catalyst due to its stability and cost. This catalyst was characterized by XRD, BET area, SEM-EDS, Raman spectroscopy, UV–VIS, and TGA. The kinetic equation for WEPS pyrolysis in the glass reactor was determined as a first-order reaction. The heat of reaction, the Gibbs free energy change, and the entropy change were calculated. Finally, WEPS pyrolysis experiments were carried out using a rotating semi-batch steel reactor, at higher temperatures and without using solvents, evaluating the styrene yield and its performance for its possible industrial application. In this reaction, the activity remained almost constant after four catalyst regenerations. The best styrene yield was 94 wt%, which could be one of the highest reported in the literature. This result may be associated with the back-mixing obtained in the rotary reactor, in contrast to the performance observed in the static glass reactor.

1. Introduction

Waste expanded polystyrene (WEPS) is abundant in plastic waste floating in the oceans. Like most synthetic polymers, WEPS degrades very slowly by the UV radiation effect from the sun, producing smaller and smaller particles, up to micro- or nano-sized polymer fragments, which can be easily ingested by marine fauna, such as mussels, oysters, fish, seabirds, and whales. Ingestion of plastic microparticles can harm animals or microorganisms [1,2,3,4,5,6]. Microscopic plastic particles in fish and wildlife are massive and well documented.
Lebreton et al. [7] conducted a study of the so-called “plastic island” or “great Pacific garbage patch” (GPGP), located between California and Hawaii in the North Pacific Ocean. In this investigation, the authors estimated that the patch area comprises 1.6 million km2 with a concentration of plastics between 10 and 100 kg/km2, as well as predicting that it contains a total of 1.8 × 10¹² plastic parts weighing 78,909 tons, composed of fractions categorized into four size classes: microplastics (0.05–0.5 cm), mesoplastics (0.5–5 cm), macroplastics (5–50 cm), and megaplastics (>50 cm). For microplastics, they estimated 6380 tons (8.08 wt%); for mesoplastics, 9971 tons (12.64 wt%); for macroplastics, 20,195 tons (25.6 wt%); and finally, for megaplastics, 42,362 tons (53.68 wt%). In addition, in this study, it was estimated that the plastic material in the form of foam, mainly WEPS, is constituted as follows: a microplastic fraction of 2 tons, a mesoplastic fraction of 8 tons, and a macroplastic fraction of 24.8 tons, making a total of 34.8 tons of total weight. The average mass concentration of plastics measured within the patch limits showed an exponential increase in recent decades, from an average of 0.4 kg/km2 in the 1970s to 1.23 kg/km2 in 2015.
In the Solid Waste Inventory 2020 prepared by the Secretariat of Environment (SEDEMA) of the Government of Mexico City [8], it was reported that during this year, 12,306 tons of municipal solid waste were generated daily. On the other hand, in the Basic Diagnosis for the Integral Management of Solid Waste 2020 published by the Ministry of Environment and Natural Resources (SEMARNAT) of the Mexican Federal Government [9], it is specified that the percentage by weight average of WEPS is 1.55% of the total solid waste generated in Mexico. Therefore, it is estimated that around 190.74 tons of WEPS originated daily in Mexico City in 2020, of which only 0.09 tons/day were recycled, as reported in the 2020 Solid Waste Inventory mentioned above.
Chaukura et al. [10] conducted a review of the WEPS potential uses, and they mention that it can be reprocessed for recycling; it can also be reused to obtain polymer-clay nanocomposites; high-value-added products such as adhesives, paints, superabsorbents, polystyrene nanofibers, flocculants, and ion exchangers; and the styrene monomer generation through a pyrolysis process. The present work proposes this last method to take advantage of WEPS by producing its styrene monomer through a pyrolysis process and thus avoid its final disposal in landfills, open-air dumps, or the oceans.
Several studies have been carried out related to the WEPS pyrolysis, using different catalysts or without a catalyst; in some of these investigations, the pyrolysis was carried out directly inside a furnace, using a few milligrams of polystyrene [11,12,13]; in other studies, different reactors were used, such as a simple flask [14], semi-continuous reactors, or either glass or stainless steel [15,16,17,18,19,20,21,22,23,24,25,26,27], or more complex continuous reactors, such as the autothermal fixed bed reactor [28] or the conical spouted bed reactor [29]. From the review of these studies, it was highlighted that when using acid solids as catalysts, high amounts of benzene, non-condensable gases, and polycyclic aromatic hydrocarbons are obtained; the latter can be carcinogenic [15]. On the contrary, using basic solids as catalysts results in higher styrene yield and fewer non-condensable gases. Therefore, the present study aims to obtain styrene preferably because it has a higher value-added benefit than benzene, since, for styrene production, benzene and ethylene are used as raw materials. For this reason, basic solids were used as catalysts.
Regarding the kinetics of WEPS pyrolysis, several studies have been carried out [30,31,32,33,34].
Preliminary experiments were carried out to select the best catalyst, and with this catalyst, experiments were carried out in a rotary reactor to evaluate the feasibility of its application on an industrial scale, for which the catalyst regeneration was also studied to be reused in the WEPS pyrolysis process. The rotary reactor performance in the WEPS pyrolysis has not been reported previously. In this reactor, it was crucial to avoid leaks, which were controlled with a low rotation speed (1.6 rpm) and with the installation of a mechanical seal and an expansion joint at the outlet of the pyrolysis vapors.

2. Materials and Methods

For this investigation, WEPS was collected from used disposable cups and plates that were washed, as well as from discarded packaging material—this type of WEPS is usually clean, so it was not necessary to wash it. Subsequently, a size reduction of the WEPS collected was carried out to obtain fragments between 0.5 and 2 cm in a commercial crusher (Lasser Mills, manufactured in Mexico City, Mexico). In this way, WEPS was prepared to make it easier to dissolve in the solvent.

2.1. WEPS Solubility Experiments

Due to the WEPS’s low density (0.012 g/mL), it was necessary to reduce its volume, dissolving it in a suitable solvent. Therefore, WEPS was dissolved in toluene, orange essential oil, and a 50% toluene/50% orange oil mixture. For this purpose, previously weighed pieces of WEPS were added to 100 mL of solvent until no more material was dissolved, and by weight difference between what was disbanded and what was not dissolved, the amount of WEPS that was dissolved was determined.
The criteria to select the best solvent were as follows: that WEPS had good solubility in the solvent, that it was not toxic (or carcinogenic), and that it had low cost and availability in the market.
By dissolving WEPS in a solvent while reducing its volume, the trapped air inside WEPS is also eliminated, which is necessary for the pyrolysis process since it must be performed entirely without oxygen.

2.2. Determination of the WEPS Average Molecular Weight

To carry out the WEPS characterization, its average molecular weight was estimated by measuring the viscosity of the WEPS solutions in toluene at different concentrations at 25 °C with the help of a Brookfield viscometer (relative error: ±1%). As is known [35], the viscosity data can be used to calculate the WEPS average molecular weight using the Mark–Houwink equation:
[η] = KMα
where [η] = intrinsic viscosity, M = average molecular weight, and K and α are constants for a particular polymer–solvent system. According to Gowariker et al. [35], the constants K and α for the polystyrene-toluene system have the following values: K = 11 × 10−3 mL/g and α = 0.725. The intrinsic viscosity is given by the equation:
[ƞ] = (ln ƞr/C)C→0
where C is the concentration in g/mL and ηr is the relative viscosity which is given by the equation:
ηr = µ/µ0
where μ is the viscosity of the WEPS solutions in toluene, as determined above, and µ0 is the viscosity of the pure solvent. If ln (ηr)/C is plotted against concentration C (in g/mL), the intrinsic viscosity [η] will be given by the y-intercept of this graph.

2.3. Pyrolysis Experiments in the Glass Reactor without Stirring

Preliminary WEPS pyrolysis experiments were performed without catalysts, and with MgO and calcined dolomite as catalysts; they were named G0, G1, and G2, respectively. These variables were kept constant: the external temperature at 400 °C, the internal temperature at 250 °C [14], WEPS: catalyst ratio 10:1 by weight [20], and N2 flow at 0.1 L/min as carrier gas. In all the experiments, 25 g of WEPS dissolved in 100 mL of toluene at atmospheric pressure was used in the semi-batch experimental equipment, as shown in Figure 1.
Number 1 corresponded to the entry of N2 as the carrier gas; its flow was measured with the rotameter marked with number 2 (Cole Parmer, Vernon Hills, IL, USA, from 0.1 to 0.5 L/min). Number 3 corresponded to the glass reactor with a capacity of 1 L. The reactor was heated with an electrical resistance (number 4). Number 5 corresponded to the reactor lid, which had four mouths. A neoprene and Teflon gasket was placed between the glass reactor and the cover to prevent leaks. A manometer (Metron, Reston, VA, USA) was placed in one of the lid mouths with a scale from 0 to 2 kg/cm2. Another of the mouths of the lid was the carrier gas inlet to the reactor (red). A thermowell was placed in another of the mouths of the lid to indicate the temperature inside the reactor. The last mouth allowed the exit of the pyrolysis vapors.
A thermocouple was connected from the electrical resistance to the temperature controls (number 6) to maintain the heating temperature at the established value, which consisted of a rheostat, a digital electronic pyrometer, and a relay that constituted an automatic system.
The pyrolysis vapors were condensed with three glass refrigerants (numbers 7). The liquid products were recovered in the glass separator–accumulator (separation funnel, number 8), where it was possible to take fractions of liquid products at a given time using the valve at the bottom.
The cooling system (number 9) consisted of a vessel containing a mixture of water and methanol (50%), to which dry ice was added, and, in this way, the temperature of the cooling fluid was reduced to −5 °C. A submersible pump was installed to re-circulate the cooling fluid. The non-condensable gases exited the system along with the carrier gas through a hose towards the atmosphere (number 10, green).
The purpose of carrying out these preliminary experiments was to select the catalyst on the basis of the one that provided the highest styrene yield at the lowest cost.
The liquid product of WEPS pyrolysis, using MgO as a catalyst, was analyzed with an infrared spectrometer (Perkin Elmer, Frontier model, Waltham, MA, USA). The composition of the liquid products in each experiment was determined using a Varian CP-3380 gas chromatograph, with a flame ionization detector and a 30 m × 0.25 mm ID × 0.25 μm capillary column of polyethylene glycol as stationary phase (relative error: ±4.5%). These are the analysis conditions recommended by the standard method ASTM D5135-16.
An experiment was carried out at a temperature of 400 °C with the catalyst that provided the highest styrene yield, called G3.

2.4. WEPS Pyrolysis Kinetics

The kinetics of the WEPS pyrolysis reaction was determined by evaluating the weight of the liquid products as a function of time in the setup of Figure 1. The WEPS weight loss was determined by subtracting the weight of the liquid product obtained in a measured time from the weight of WEPS initially charged to the reactor. WEPS dissolved in toluene was loaded into the reactor (number 3). The pyrolysis reaction started when approximately 200 °C was reached, the temperature at which the solvent had already evaporated (the toluene boiling point is 111 °C). It was observed that at 117 °C, most of the toluene added as solvent was eliminated, and thus this moment was considered as the start of the reaction (t = 0 min) for kinetic determination purposes. All the distilled solvent collected in the container (number 8) was extracted.
After this step, the pyrolysis reaction time (t) began, and vapors from thermal or catalytic pyrolysis began to form and condense in the gas–liquid accumulator–separator (number 8). Then, sampling was performed every 10 min, removing the liquid product accumulated at each time in the separation funnel number 8, which was analyzed by gas chromatography and weighed (m) on an analytical balance (Sartorius Basic).
The WEPS pyrolysis kinetics was determined on a weight basis to express the kinetic equation as reported in the literature. The kinetics equation for a heterogeneous system can be stated as [19]:
−dm/dt = kmn
where m = WEPS mass in a given reaction time (g), t = reaction time (min), k = specific reaction constant, and n = reaction order. In various studies of the WEPS pyrolysis [19,29,30,31,32,33,34], it has already been reported that the WEPS pyrolysis kinetics is of the first order; if n = 1, Equation (4) can be integrated as follows:
m 0 m dm / m = k 0 t dt
Solving this integral, Equation (6) was obtained, which was used to obtain k with the experimental data:
ln (m0/m) = kt

2.5. Thermodynamic Analysis of the WEPS Pyrolysis Reaction

The change in enthalpy of reaction for the WEPS pyrolysis is given by the equation:
Δ H r = { n P   [ H f ° + 298 T Cp   dT ] } P n PS   [ H f ° + 298 T Cp   dT ] PS
where nP = number of moles of product P, nPS = number of moles of WEPS, Hf° = enthalpy of formation, and Cp = heat capacity.
The change in Gibbs free energy of the WEPS pyrolysis reaction is given by the equation [33]:
ΔGr = Ea + RT ln ((KB T)/(h A))
where KB = Boltzmann’s constant (1.38066 × 10⁻²³ J/°K), h = Planck’s constant (6.62608 × 10⁻³⁴ J s), Ea = activation energy (J/mol), and A = pre-exponential factor (s−1).
The change in entropy of the WEPS pyrolysis reaction can be calculated from the Gibbs free energy definition:
ΔSr = (ΔHr − ΔGr)/T
The necessary data to realize the calculation of these parameters were obtained from the bibliography [36,37,38].

2.6. Pyrolysis Experiments in the Semi-Batch Rotary Reactor

To carry out experiments, a pilot plant-type semi-batch rotary reactor was built with a length of 24.5 cm long by 16 cm in internal diameter, with a capacity of 4.9 L; it was made of carbon steel, with a mechanical seal at the outlet of the gaseous products, as shown in Figure 2, and can be seen in the images of Figure A1 and Figure A2. A thermowell with a sliding thermocouple was built to measure the temperature in the center of the reactor axially, which was connected to an electronic temperature indicator. The cylindrical reactor was placed on eight bearings that allowed its free rotation. A 1/4 HP motor and a speed reducer, with a speed of 1.6 rpm, were installed to provide rotation of the reactor through a chain. At the reactor outlet, a stainless-steel condenser was connected to recover the liquid products. Between the mechanical seal and the condenser, a pressure gauge was installed to monitor the system pressure and an expansion joint to prevent leaks due to the thermal expansion of the connections. The most critical aspect of the operation of this reactor was leak control. It was observed that to control leaks, it was better to use a low rotation speed and install a mechanical seal and an expansion joint in the gas outlet pipe.
A liquid–gas separator tank was installed at the condenser outlet to recover the liquid phase. The liquid products accumulated at the bottom, making it possible to collect samples at different times of the pyrolysis reaction by the valve placed at the bottom of the liquid–gas separator tank.
The reactor was heated with direct fire, for which two burners were installed, one for LP gas and the other for the non-condensable gaseous pyrolysis products. A volumetric gas meter was placed to quantify the production of non-condensable gases from pyrolysis; at the outlet of this meter, the gases were sent to one of the two burners. Likewise, another volumetric gas meter was installed to quantify the consumption of LP gas.
A glass fiber insulation with a thickness of 4 cm was placed around the reactor to prevent heat loss. The cooling system consisted of a 1/2 HP pump that sucked the water contained in a vessel and recirculated it to the condenser.
To prevent product leaks, in all experiments, a Teflon gasket was placed on the reactor lid and sealed with red silicone, which is resistant to high temperatures. Unfortunately, a fraction of the Teflon gasket burned and degraded, so changing the Teflon gasket in each experiment was necessary.
All WEPS pyrolysis experiments were performed with a WEPS: catalyst ratio of 10:1 by weight [20]. In each experiment, 460 g of WEPS were loaded into the rotating reactor, previously melted to reduce its volume and eliminate the trapped air. Neither solvent nor carrier gas (N2) was used to make the process more cost-effective and sustainable.
The experimentation started with the first WEPS pyrolysis experiment without a catalyst—it was called R-1 (Table 1). Subsequently, experiments R-2, R-3, and R-4 were carried out using a fresh MgO catalyst. In all experiments, the reaction time, including heating from 25 °C, was 3 h. The samples of liquid products obtained in each experiment, taken every 10 min, were analyzed with the Varian CP-3380 gas chromatograph mentioned above.
Coatings were placed both at the front and rear of the rotating reactor to avoid lateral heat loss, for which insulation made of steel mesh, fiberglass, and cement was used (Figure A2). An 8.5 cm thick ceramic fiber layer was also placed around the reactor, in addition to the 4 cm thick fiberglass insulation. With these improvements, experiment R-5 and the following experiments were carried out.
In order to investigate whether good results were obtained using the same regenerated MgO catalyst, the solid residues from the previous experiments were calcined at 600 °C for 4 h in order to remove the carbon coating from the MgO catalyst that remained at the end of the pyrolysis, and the catalyst thus regenerated was used in experiment R-6.
The spent catalyst from experiment R-6, in turn, was calcined, and the regenerated catalyst was used in experiment R-7. Then, the solid residue from run R-7 was calcined for the third time, and the regenerated catalyst was applied in experiment R-8. Finally, the solid residue from run R-8 was calcined for the fourth time, and the regenerated catalyst was used in experiment R-9. In this last experiment, the non-condensable gases generated in the pyrolysis were stored in a balloon for their corresponding analysis. A Gow Mac gas chromatograph (series 750) with a 1/8″ packed column of dimethylpolysiloxane as a stationary phase was used because light hydrocarbons were obtained as non-condensable gases. A second experiment without a catalyst was carried out (R-10). All these experiments with the rotary reactor are summarized in Table 1.

2.7. Catalyst Characterization

2.7.1. N2 Physisorption (BET Area)

The N2 adsorption–desorption isotherm of the fresh MgO catalyst was determined with NOVA Quantachrome Instruments version 11.0 equipment, (Anton Paar group, Boynton Beach, FL, USA) using the physisorption of N2 at 77 °K (relative error: ± 0.1%). Before adsorption, the sample received a degassing pretreatment at 300 °C for 5 h under a vacuum of 1 × 10⁻⁴ torr. The sample weight was 0.2482 g, and the sample volume was 0.06708 cm3. This analysis determined the BET-specific area, pore volume, and pore diameter distribution by applying the standard BET model [39]. The T-plot method was used to quantify the pore volume (Vp) of the samples [40]. The pore diameter distribution was obtained from the BJH model [41] using isothermal desorption and assuming the geometry of the pores as cylindrical.

2.7.2. X-ray Diffraction

XRD diffractograms of MgO catalyst, before and after the pyrolysis reaction using the glass reactor, were obtained with a BRUKER diffractometer, model D8 Focus, made in Karlsruhe, Germany, equipped with a Cu tube anode (30 kV, 20 mA), using CuKα radiation. The scan was performed in the range of 2 θ~10–100°, with a rate of 2°/min (relative error: ± 4.5%).

2.7.3. Scanning Electron Microscopy (SEM-EDS)

Images of the MgO catalyst microstructure were taken employing scanning electron microscopy (SEM), before and after the pyrolysis reaction using the glass reactor, with field emission and high resolution in a JEOL microscope (model JFM-6701-F, Tokyo, Japan), using secondary electrons (relative error: ±0.5%).

2.7.4. Raman Spectroscopy

Samples of the spent catalyst from the pyrolysis experiments carried out with the rotary reactor, as well as the regenerated catalyst, were analyzed by Raman spectroscopy, using Renishaw In Via Raman equipment, (New Mills, Gloucestershire, UK) a lamp with a wavelength of λ = 532 nm, and a power of 100%; the equipment was calibrated with a Si wafer at 520 cm−1.

2.7.5. UV–VIS Spectroscopy

Samples of the solid residues from the pyrolysis experiments produced with the rotary reactor, as well as their respective regenerated catalysts, were also analyzed by UV–VIS spectroscopy with a Varian Cary 100 spectrometer, manufactured in Mulgrave, Australia; the equipment was calibrated with a polytetrafluoroethylene (PTFE) disc.

2.7.6. Thermogravimetric Analysis (TGA)

Samples of the spent catalyst from the pyrolysis experiments carried out with the rotary reactor were analyzed by TGA using SDT Q600 TA Instruments equipment (Artisan Technology Group, Champaign, IL, USA) with a sample weight of between 5 and 8 mg and an airflow of 10 mL/min (relative error: ±0.5%).

2.7.7. Calcination of Samples

The MgO catalyst samples, before and after the pyrolysis reaction, were calcined to determine the carbon content to evaluate the relevance of the catalyst regeneration. Calcination of the fresh MgO catalyst and the solid residues from experiments was carried out at 600 °C for 4 h; the sample weight was 1 g.

3. Results and Discussion

3.1. WEPS Solubility Experiments

The results of the experiments on the solubility of WEPS in toluene, orange oil, and a mixture of 50% orange oil/50% toluene were 0.6018, 0.4163, and 0.5633 g/mL of solvent, respectively. The result of the solubility of WEPS in toluene was similar to that obtained by García et al. [42]; they reported 0.6 g/mL.
Toluene was found to be the most suitable solvent to dissolve WEPS since it offered the highest solubility among the solvents tested; the safety sheet for toluene mentions that there is no evidence that it is carcinogenic, and that toluene has relatively low cost and good availability in the market.

3.2. Determination of the WEPS Average Molecular Weight

As can be seen in Figure 3, the viscosity increased exponentially with the concentration of WEPS in toluene, which is in agreement with the results reported by Kol et al. [43].
Using the data on the viscosities of the WEPS solutions in toluene at different concentrations, the graph in Figure 4 was obtained, ln (ηr)/C against WEPS concentration in toluene in g/mL. The intrinsic viscosity was the y-intercept, so [η] = 39.285 mL/g.
Applying the Mark–Houwink Equation (1) and using the constants reported by Gowariker et al. [35], K = 11 × 10−3 mL/g and α = 0.725, resulted in a WEPS average molecular weight of M = 79,517.15 g/mol.

3.3. Pyrolysis Experiments in the Glass Reactor without Stirring

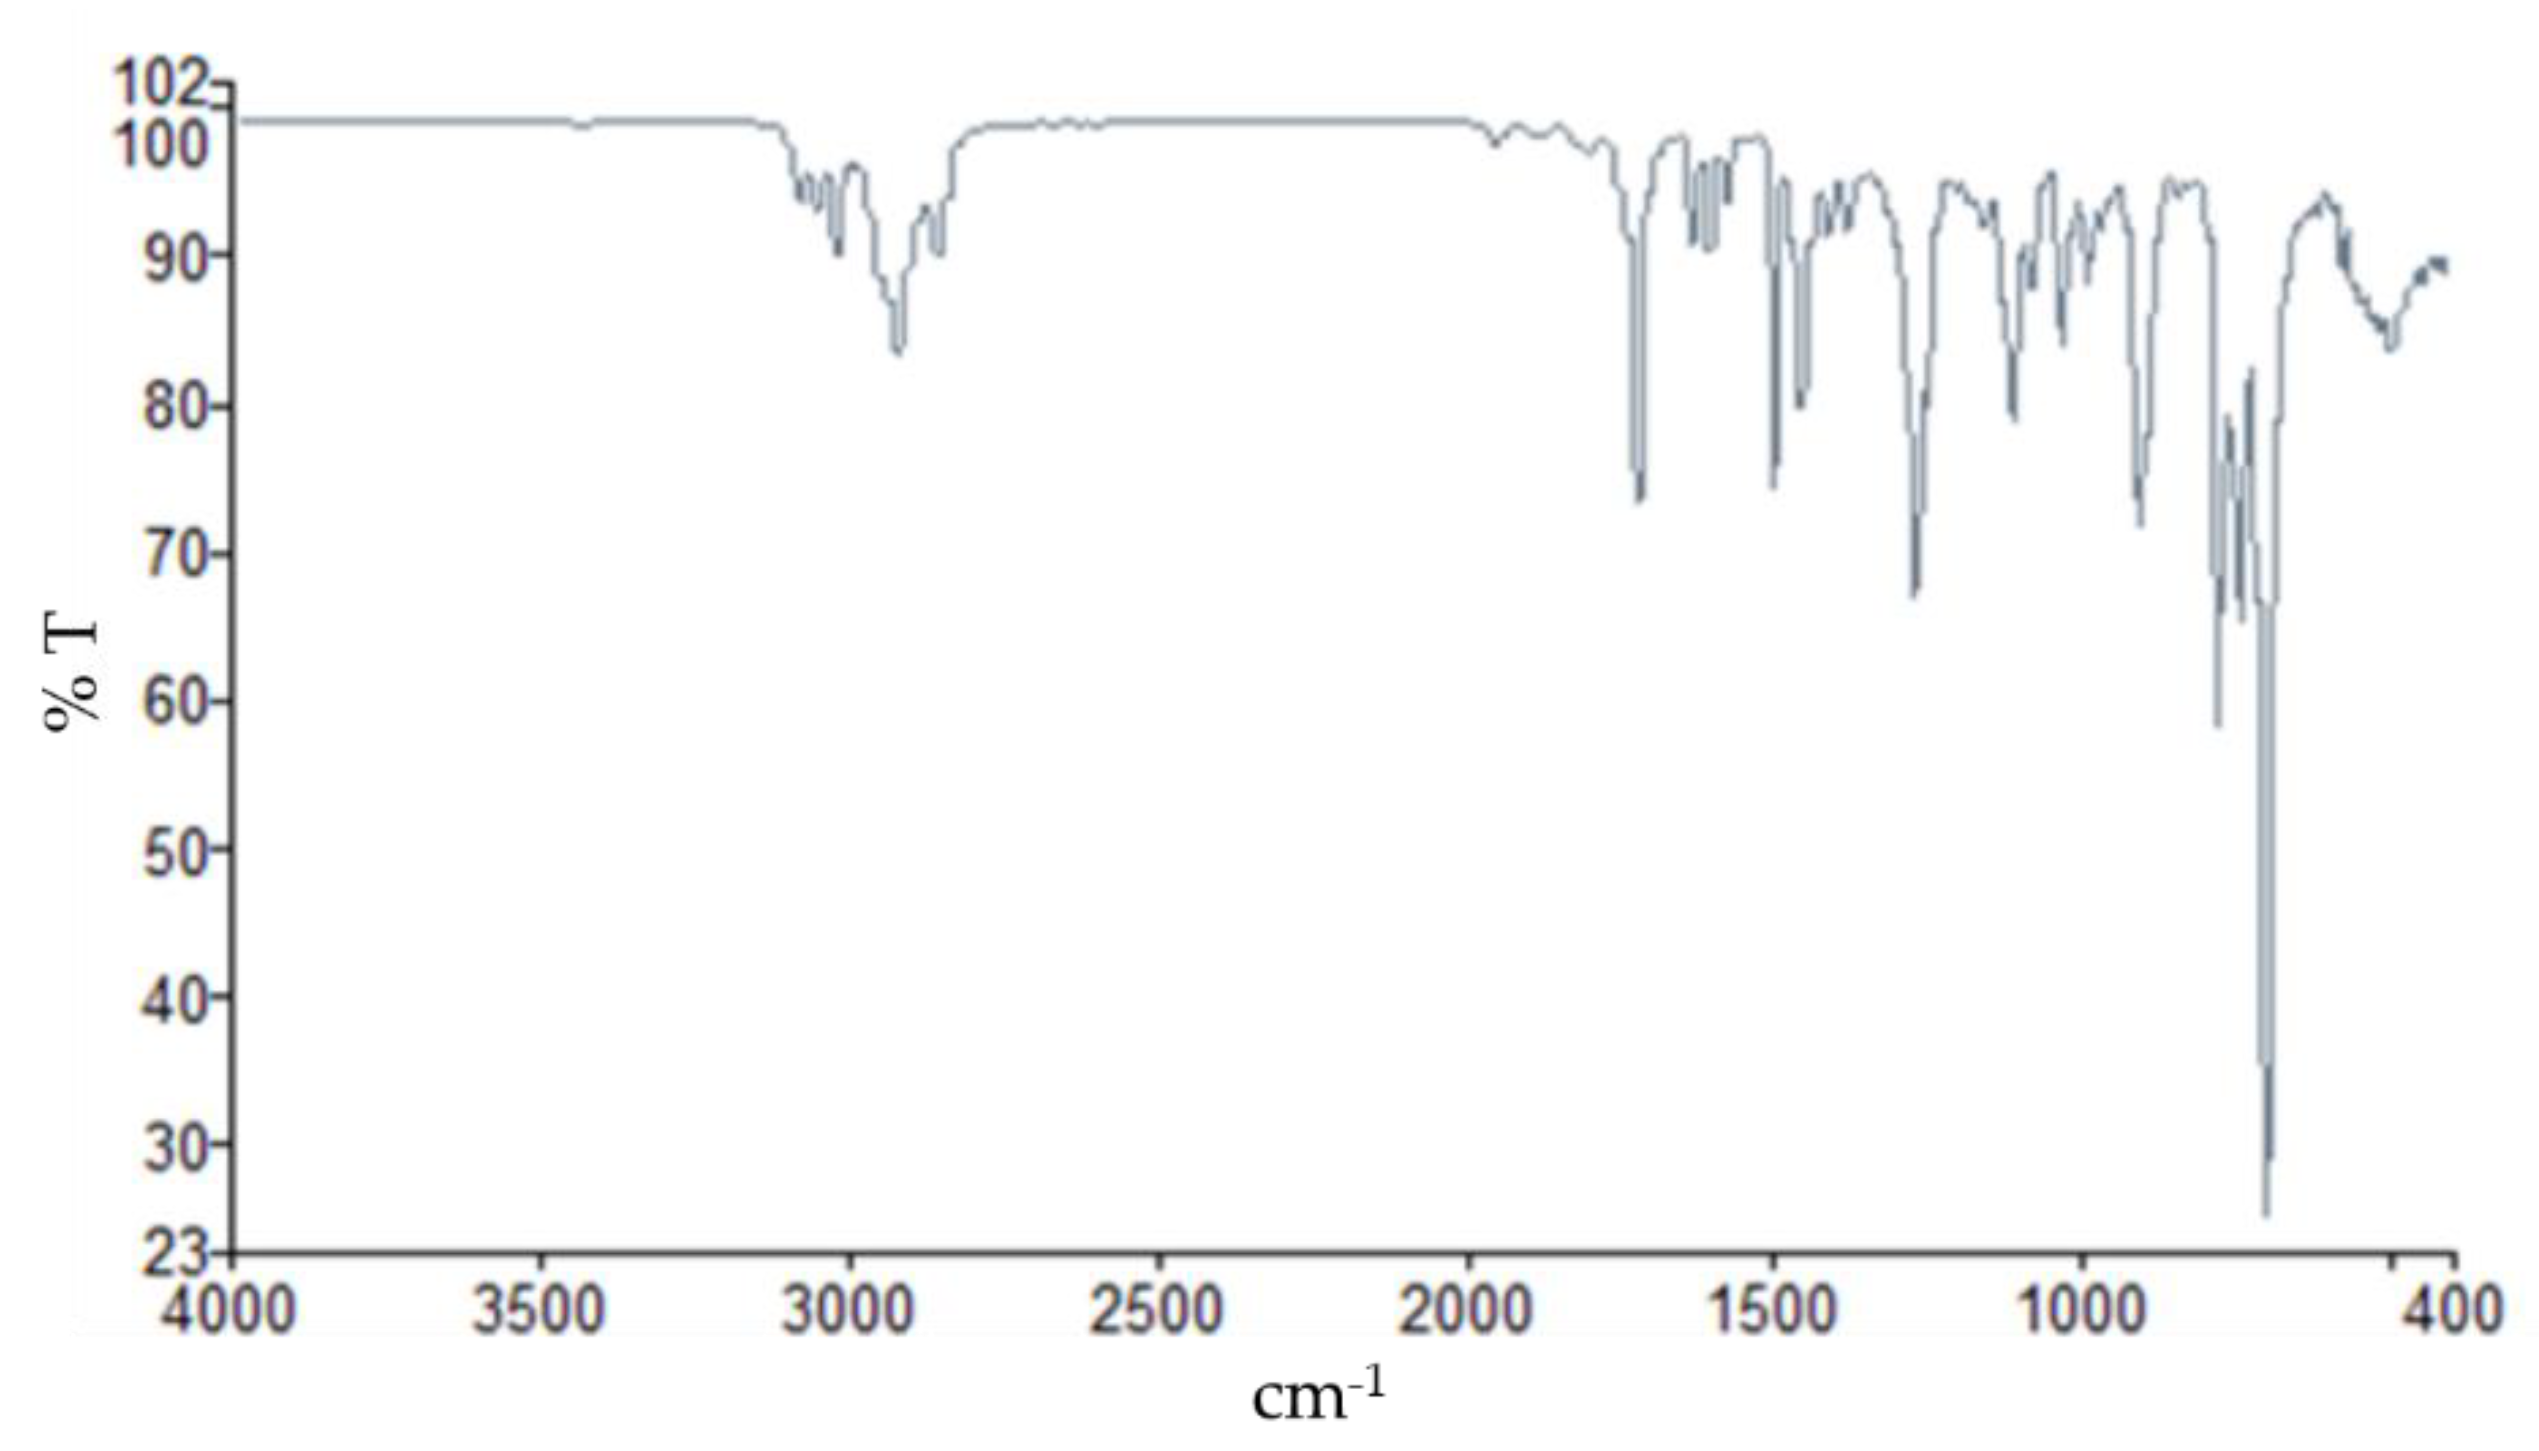
The infrared (IR) spectrum obtained from the WEPS pyrolysis liquid products of experiment G1, carried out in the glass reactor, using MgO as a catalyst, is shown in Figure 5. The functional group characterization of this spectrum was as follows: (I) Bands between 3030–3080 cm−1 and 910–990 cm−1 corresponded to the vinyl group, characteristic of styrene. (II) The band in 1631 cm−1 suggests the presence of the C=C bond. (III) Bands between 730–770 cm−1 and small bands between 1700–1900 cm−1 indicate the presence of monosubstituted benzene. (IV) Bands between 1450 and 1500 cm−1 correspond to the presence of aromatic groups. (V) Bands between 2930 and 2980 cm−1 characterize the C-H groups. (VI) The band in 1580 cm−1 is attributed to substitution on the benzene ring. The presence of the vinyl group and monosubstituted groups in the benzene ring account for the presence of styrene and other aromatics such as toluene and ethylbenzene.
The styrene yield obtained without a catalyst, with MgO and calcined dolomite as catalysts at 250 °C, and the experiment G3 at a temperature of 400 °C with the selected catalyst are detailed in Table 2.
In the preliminary experiments G0 without catalysts and G1 with an MgO catalyst carried out with the glass reactor at 250 °C (Table 2), a higher styrene yield was obtained with the MgO catalyst, of 56.29 wt% against 23.27 wt% without a catalyst. By comparison, Zhang et al. [20] reported a styrene yield of 56.07 wt% without a catalyst and a slightly higher styrene yield of 62.96 wt% with an MgO catalyst at 350 °C. Furthermore, as can be seen in Figure 6, the styrene yield as a function of time was much higher in the preliminary experiment G1, carried out with an MgO catalyst, compared to experiment G0, carried out without a catalyst.
Zhang et al. [20] used BaO as a catalyst, resulting in a higher styrene yield; they obtained 71.35 wt% at 350 °C. However, BaO costs about five times more than MgO (Aldrich). Therefore, it was decided to use MgO as the most appropriate catalyst for WEPS pyrolysis.
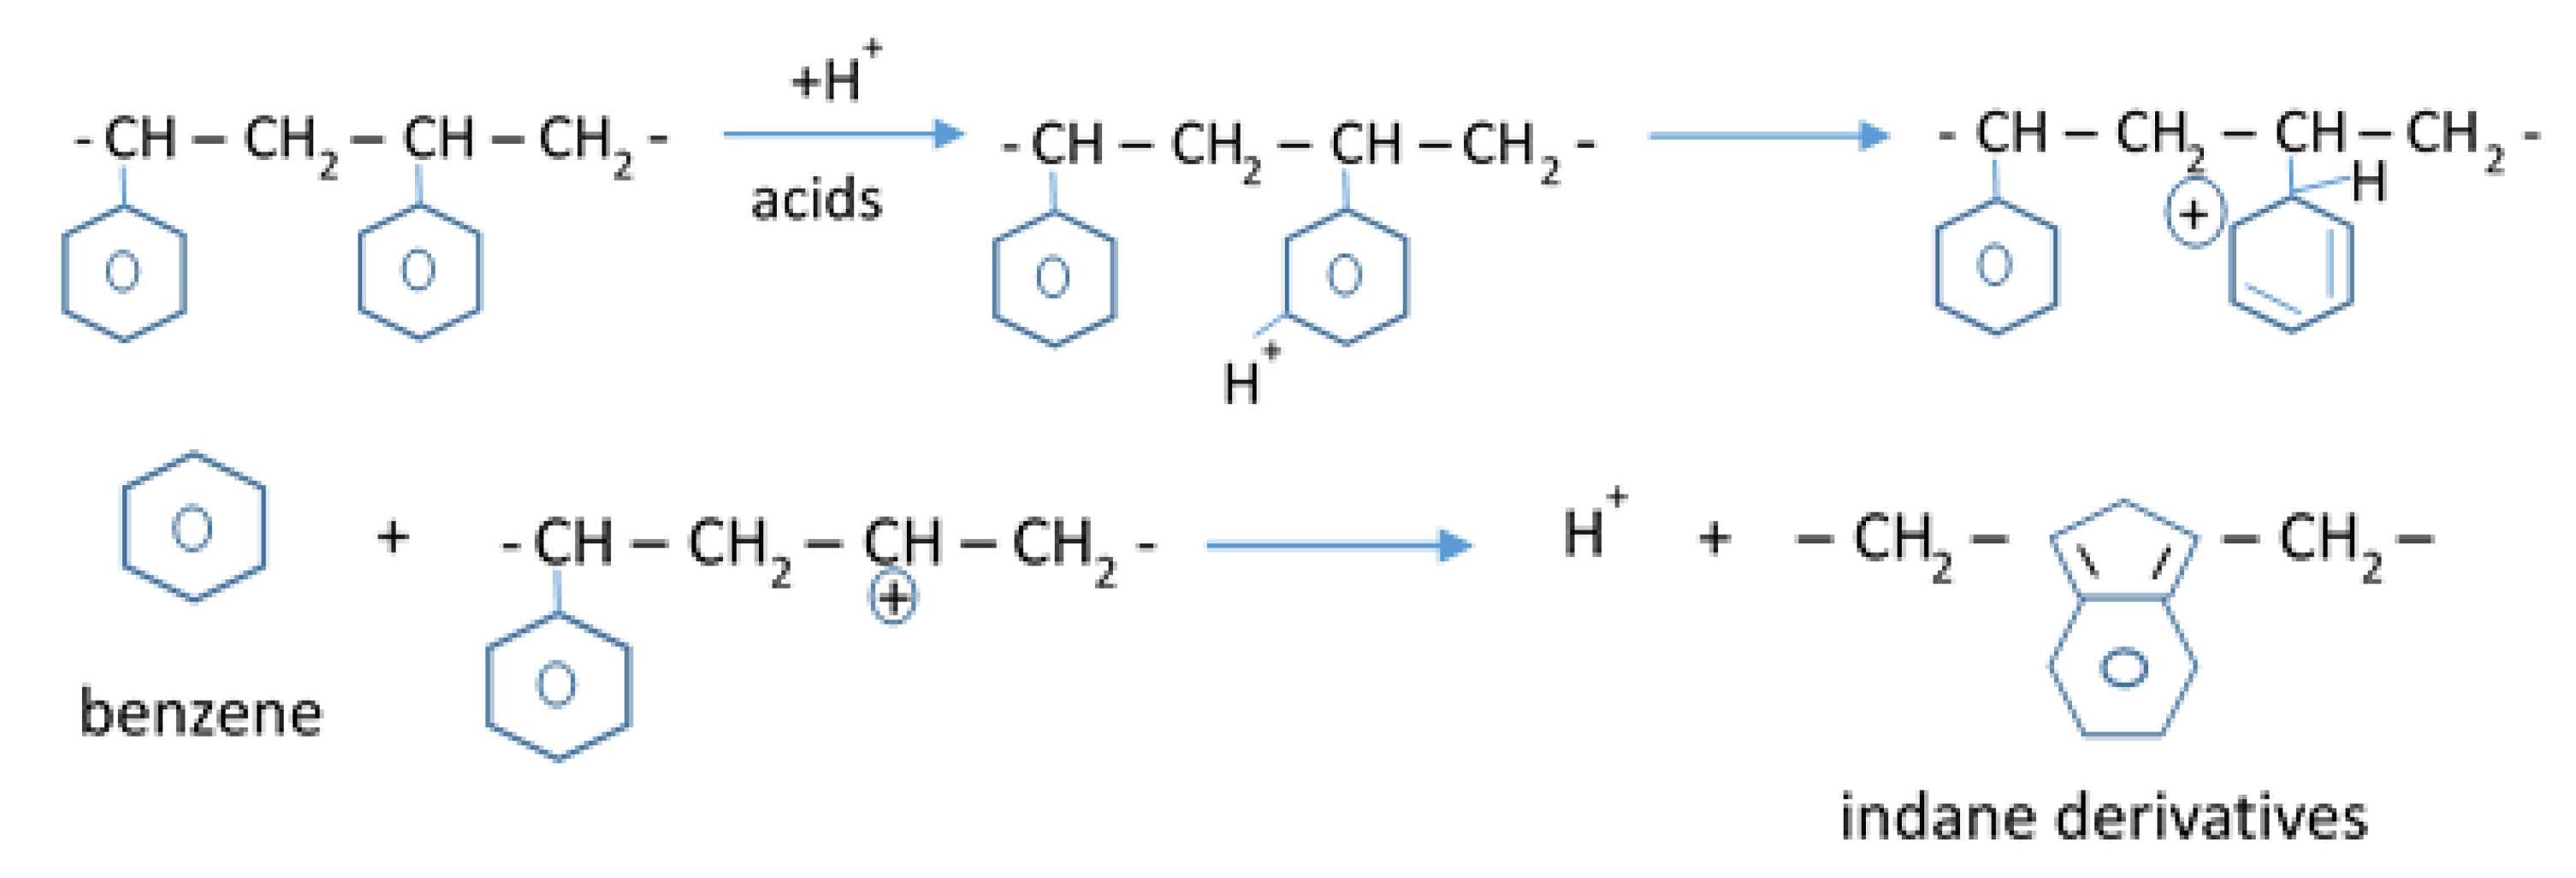
In the catalytic degradation of polystyrene using solid acids, considerable amounts of benzene and ethylbenzene are formed [20]. These products are partially attributed to the subsequent degradation and hydrogenation of the styrene produced, which results in a decrease in the styrene fraction in oils obtained. The production of benzene and indane derivatives is also one of the characteristics of the oils produced by solid acid catalysts, which were not detected in oils obtained with solid base catalysts. In a mechanism model proposed by Zhang et al. [20], the formation of benzene and indane derivatives with solid acid catalysts begins with a proton attack on the branched phenyl group to produce a π-complex cation, which is converted to a σ-bonded complex cation that is released as benzene, as shown in Scheme 1:
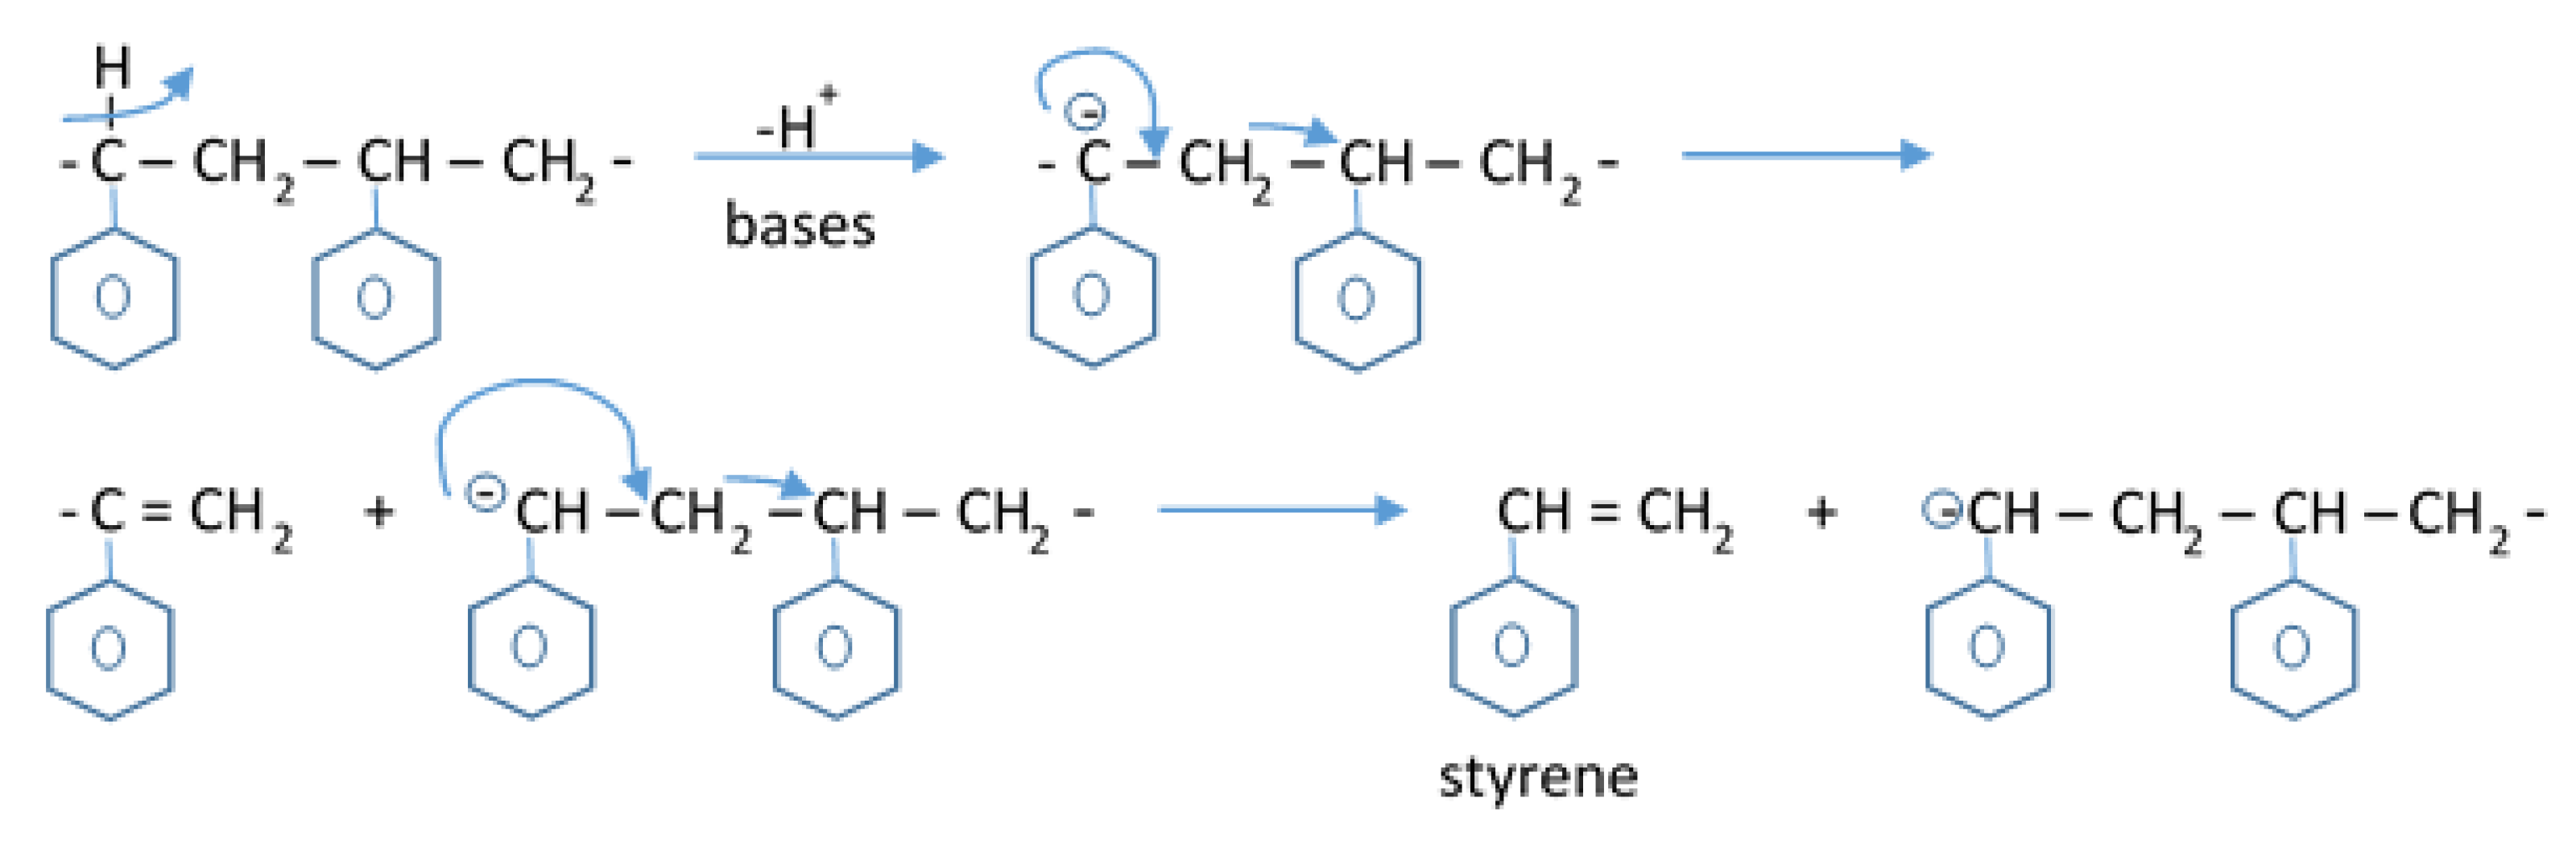
On the other hand, with basic catalysts, the fraction of styrene in the produced oils increased to about 75 wt% and the fraction of styrene containing the monomer and dimer to about 90 wt%. Since benzene and indane derivatives were not detected in oils produced with solid bases nor in those obtained with simple thermal degradation of polystyrene, and since a considerable amount of styrene dimer was observed in these oils, it is considered that the depolymerization of polystyrene using solid bases proceeds in a similar way to simple thermal pyrolysis. Thermal degradation of polystyrene begins with the random formation of polymeric radicals, while catalytic degradation with solid bases can begin with the formation of carbocations by removal of a hydrogen atom from polystyrene adsorbed on basic sites, according to the reaction mechanism model proposed by Zhang et al. [20], which can be seen in Scheme 2:

3.4. WEPS Pyrolysis Kinetics

WEPS weight loss over time in the experiment without a catalyst (G0), performed in the glass reactor at a temperature of 250 °C, is shown in Figure 7a. If it is graphed ln (m0/m) against time t, according to Equation (6), and Figure 7b results, where it can be seen that it is very close to a straight line. Fitting to a straight line using the least squares method resulted in a slope of k = 0.0146 min−1, with a correlation coefficient of R2 = 0.9965.
In the WEPS catalytic pyrolysis experiment G1, in which MgO was used as a catalyst with the glass reactor at a temperature of 250 °C (Figure 8a), a similar decrease as a function of time was observed as in the case of the reaction without a catalyst. By applying Equation (6), the straight line of Figure 8b was obtained; using the least squares method, the slope gave k = 0.0156 min−1, with a correlation coefficient of R2 = 0.9927. Therefore, it was corroborated that the WEPS pyrolysis reaction follows first-order kinetics, using toluene as a solvent.

3.5. Thermodynamic Analysis of WEPS Pyrolysis Reaction

Equations (7)–(9) were used to calculate the enthalpy change (ΔHr), Gibbs free energy change (ΔGr), and the entropy change (ΔSr) of the WEPS pyrolysis reaction at different temperatures that are shown in Table 3.
The change in enthalpy of WEPS pyrolysis ΔHr was positive, confirming that the reaction was endothermic. Furthermore, the increase in the entropy of the reaction ΔSr with temperature suggests that the WEPS pyrolysis was favored with higher temperatures (>673 °K), and a better styrene yield was obtained at a higher temperature (>673 °K). However, the increase in Gibbs free energy ΔGr with increasing temperature indicated that the reaction was unfavorable, moving away from the equilibrium at very high temperatures (>823 °K). This is in agreement with the results obtained by Mo et al. [33], who observed the same behavior of these thermodynamic parameters in the WEPS pyrolysis.

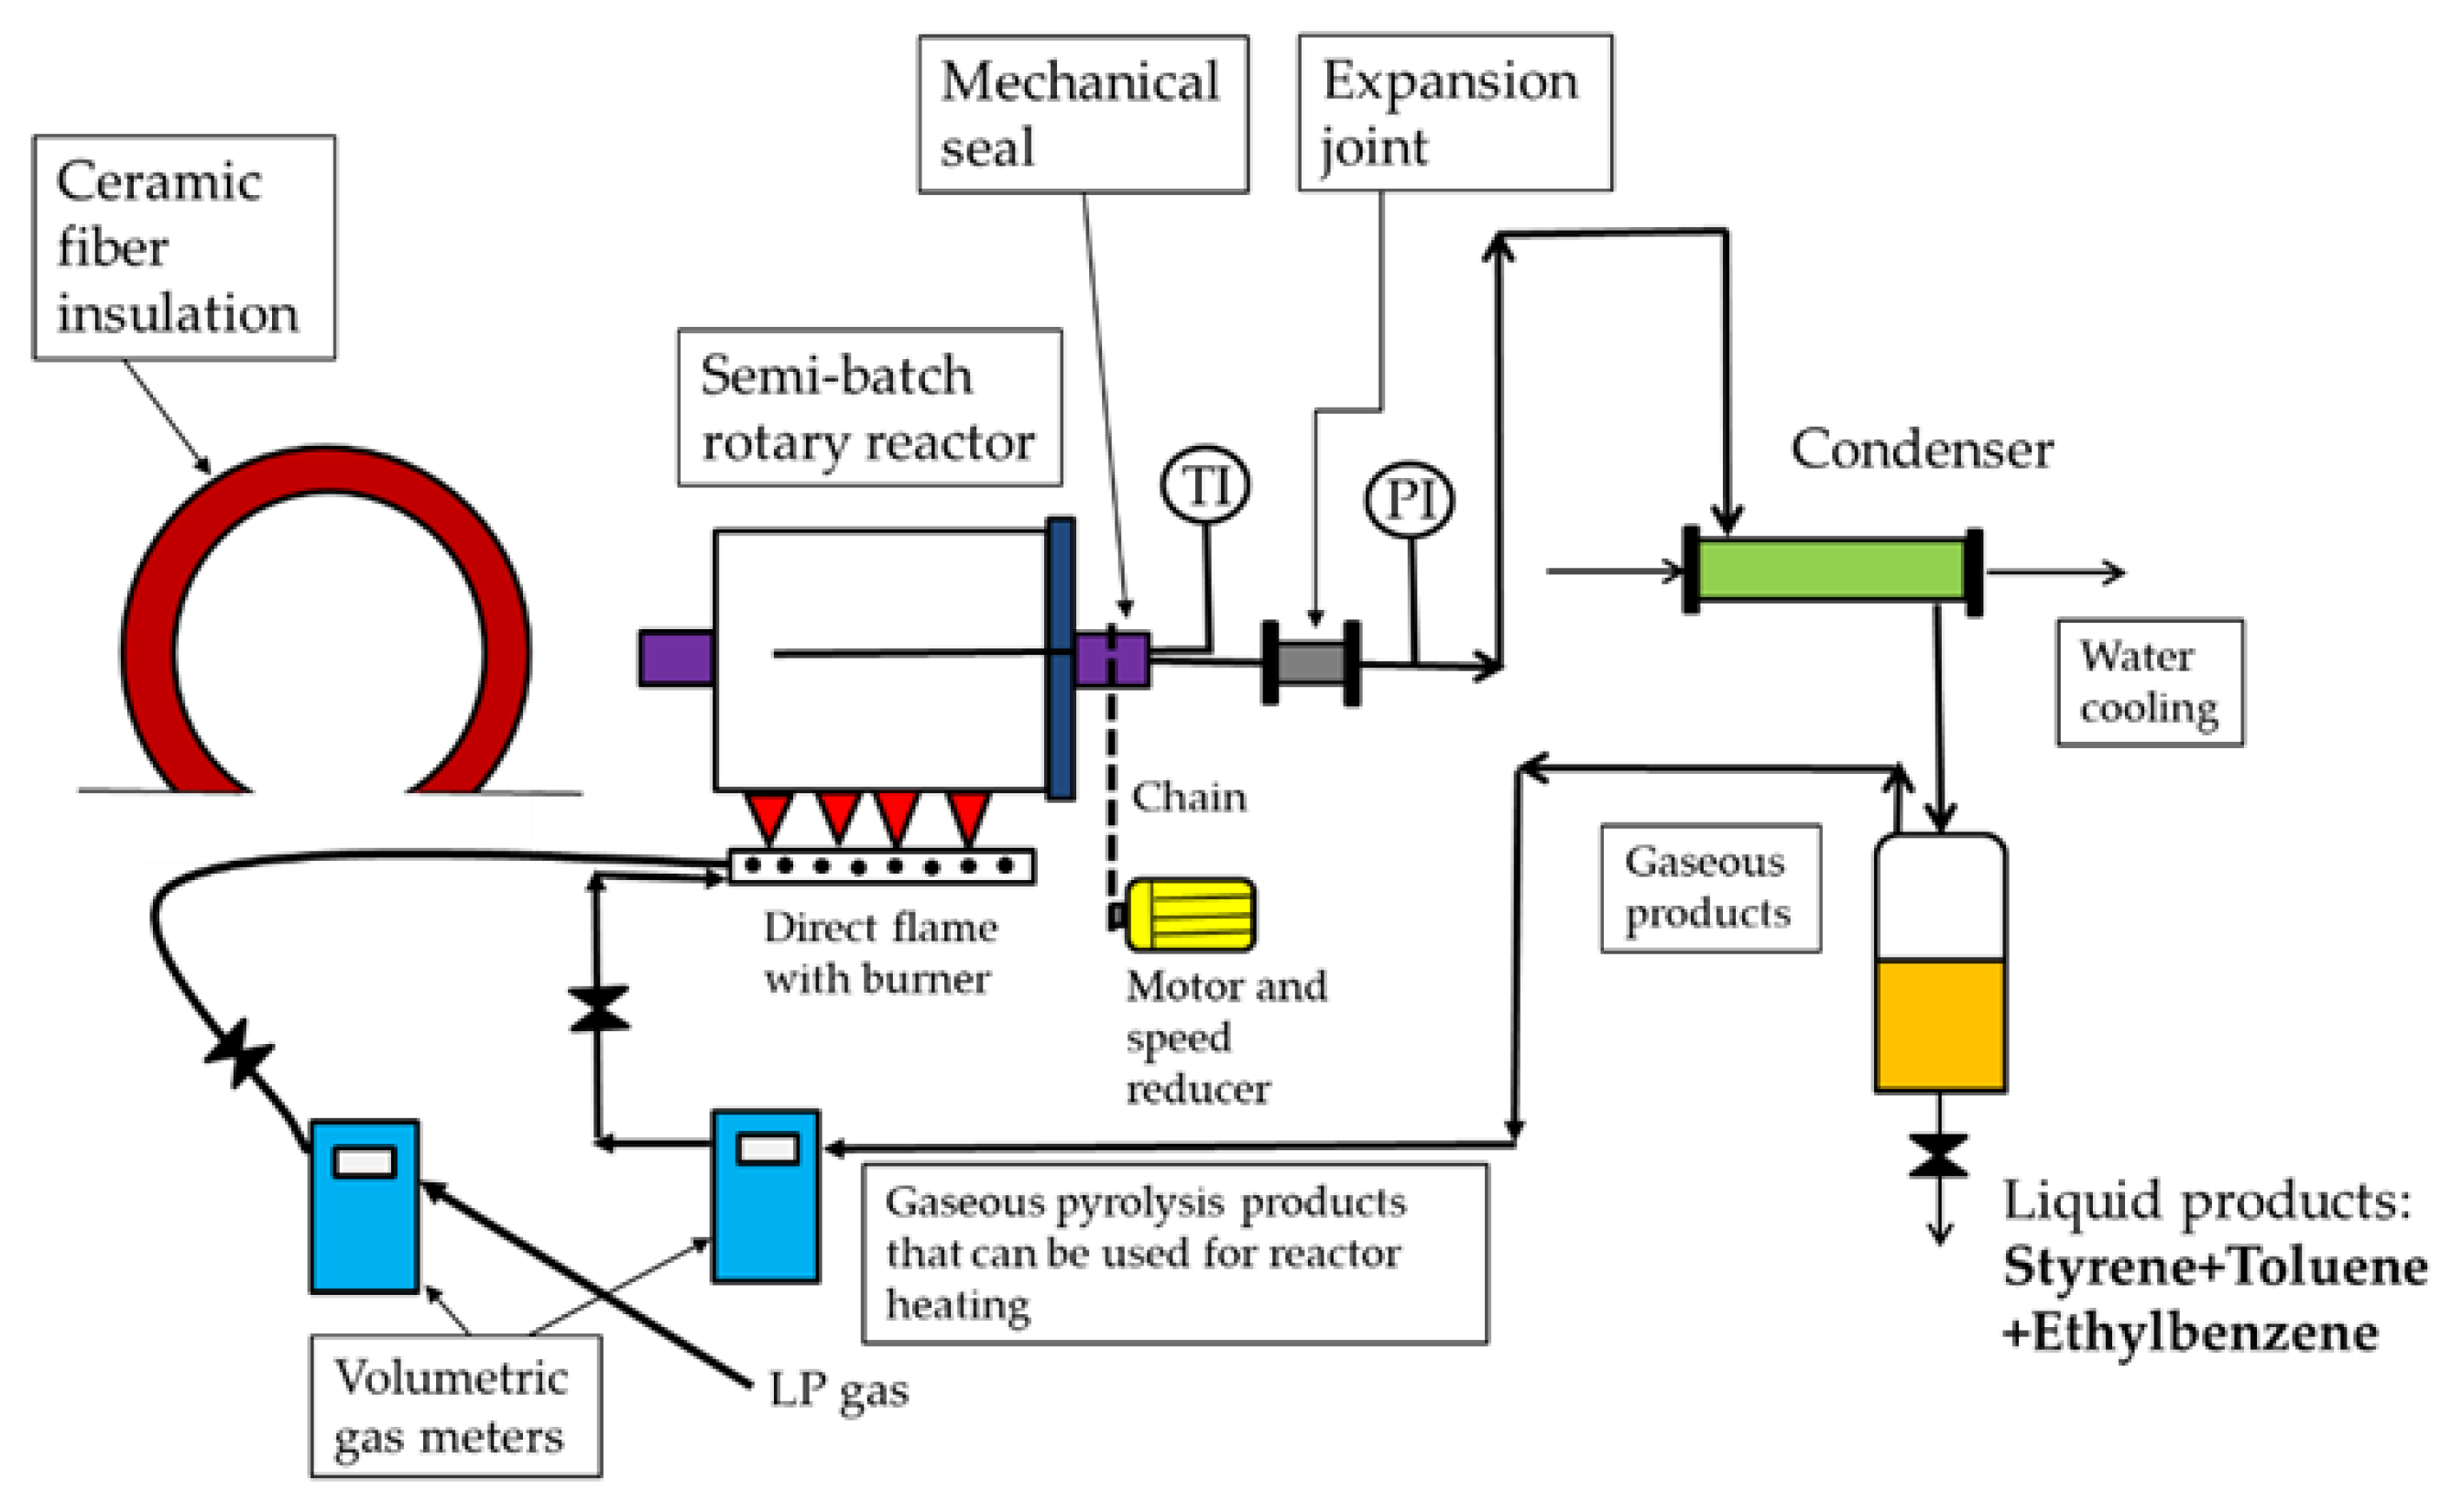
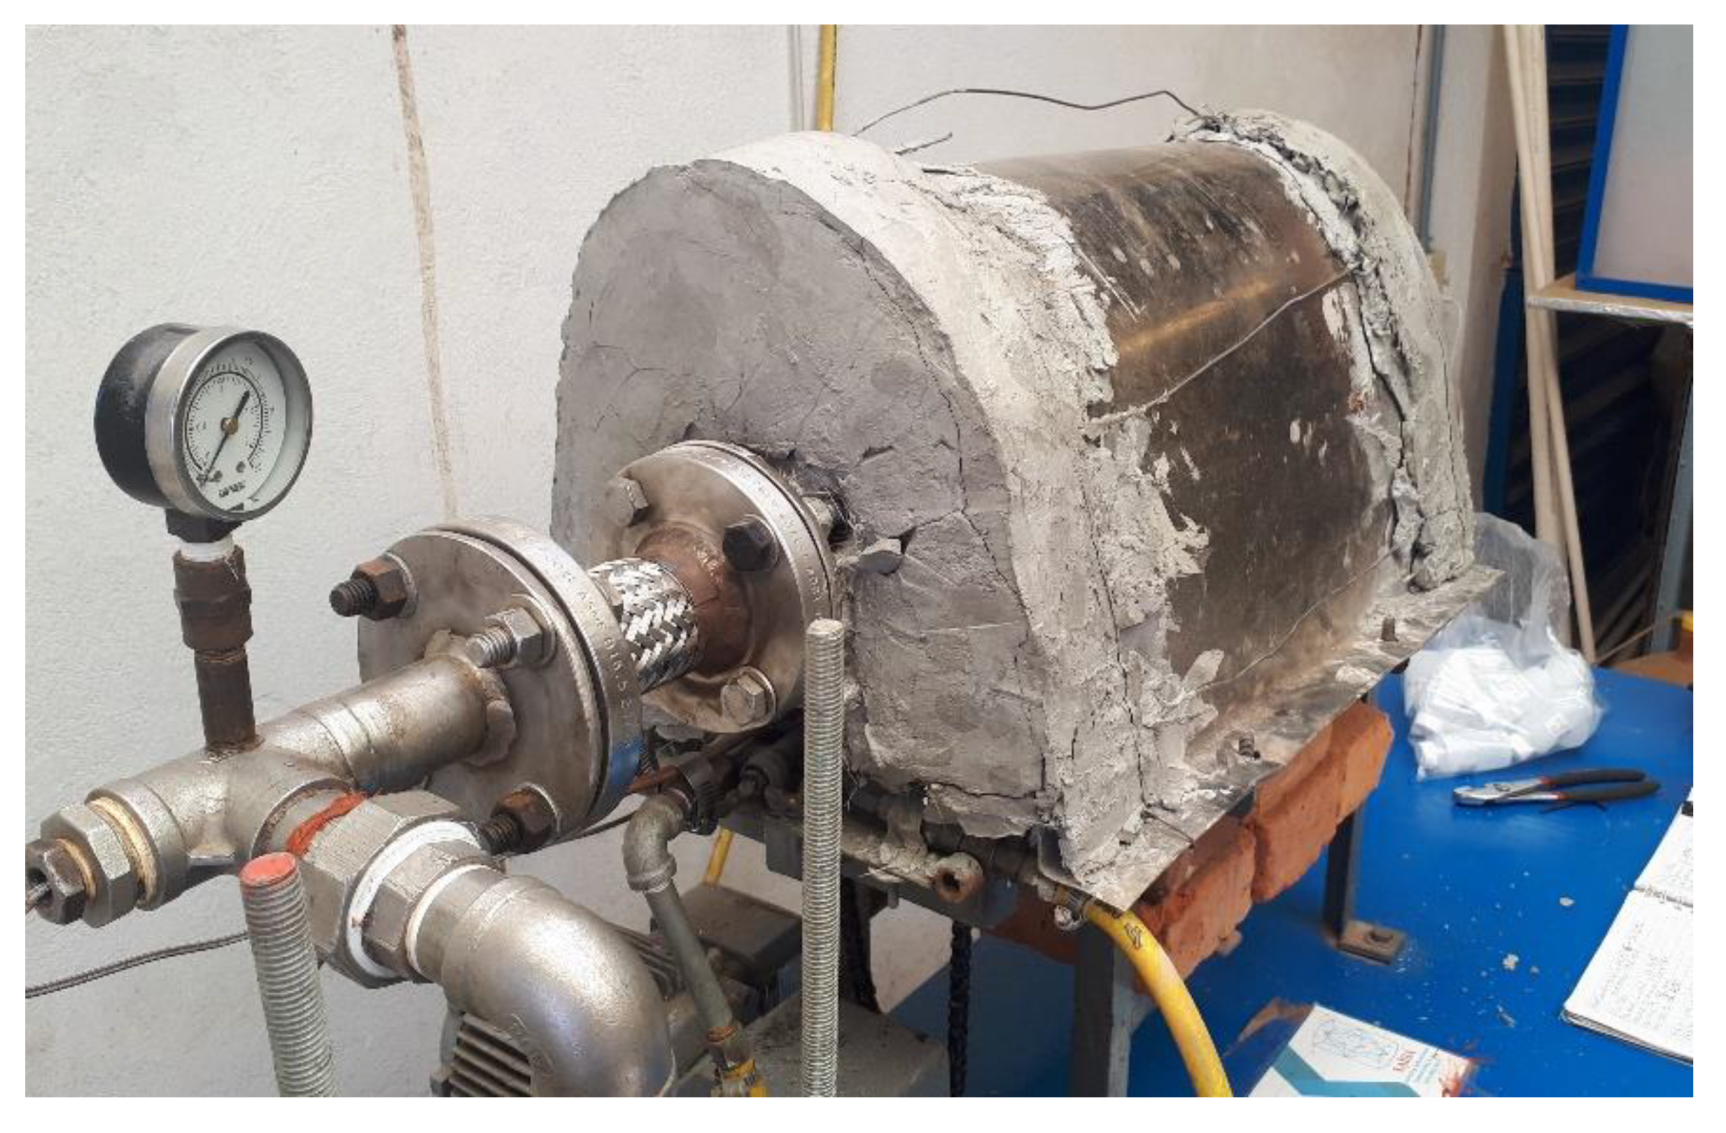
3.6. Pyrolysis Experiments in the Semi-Batch Rotary Reactor

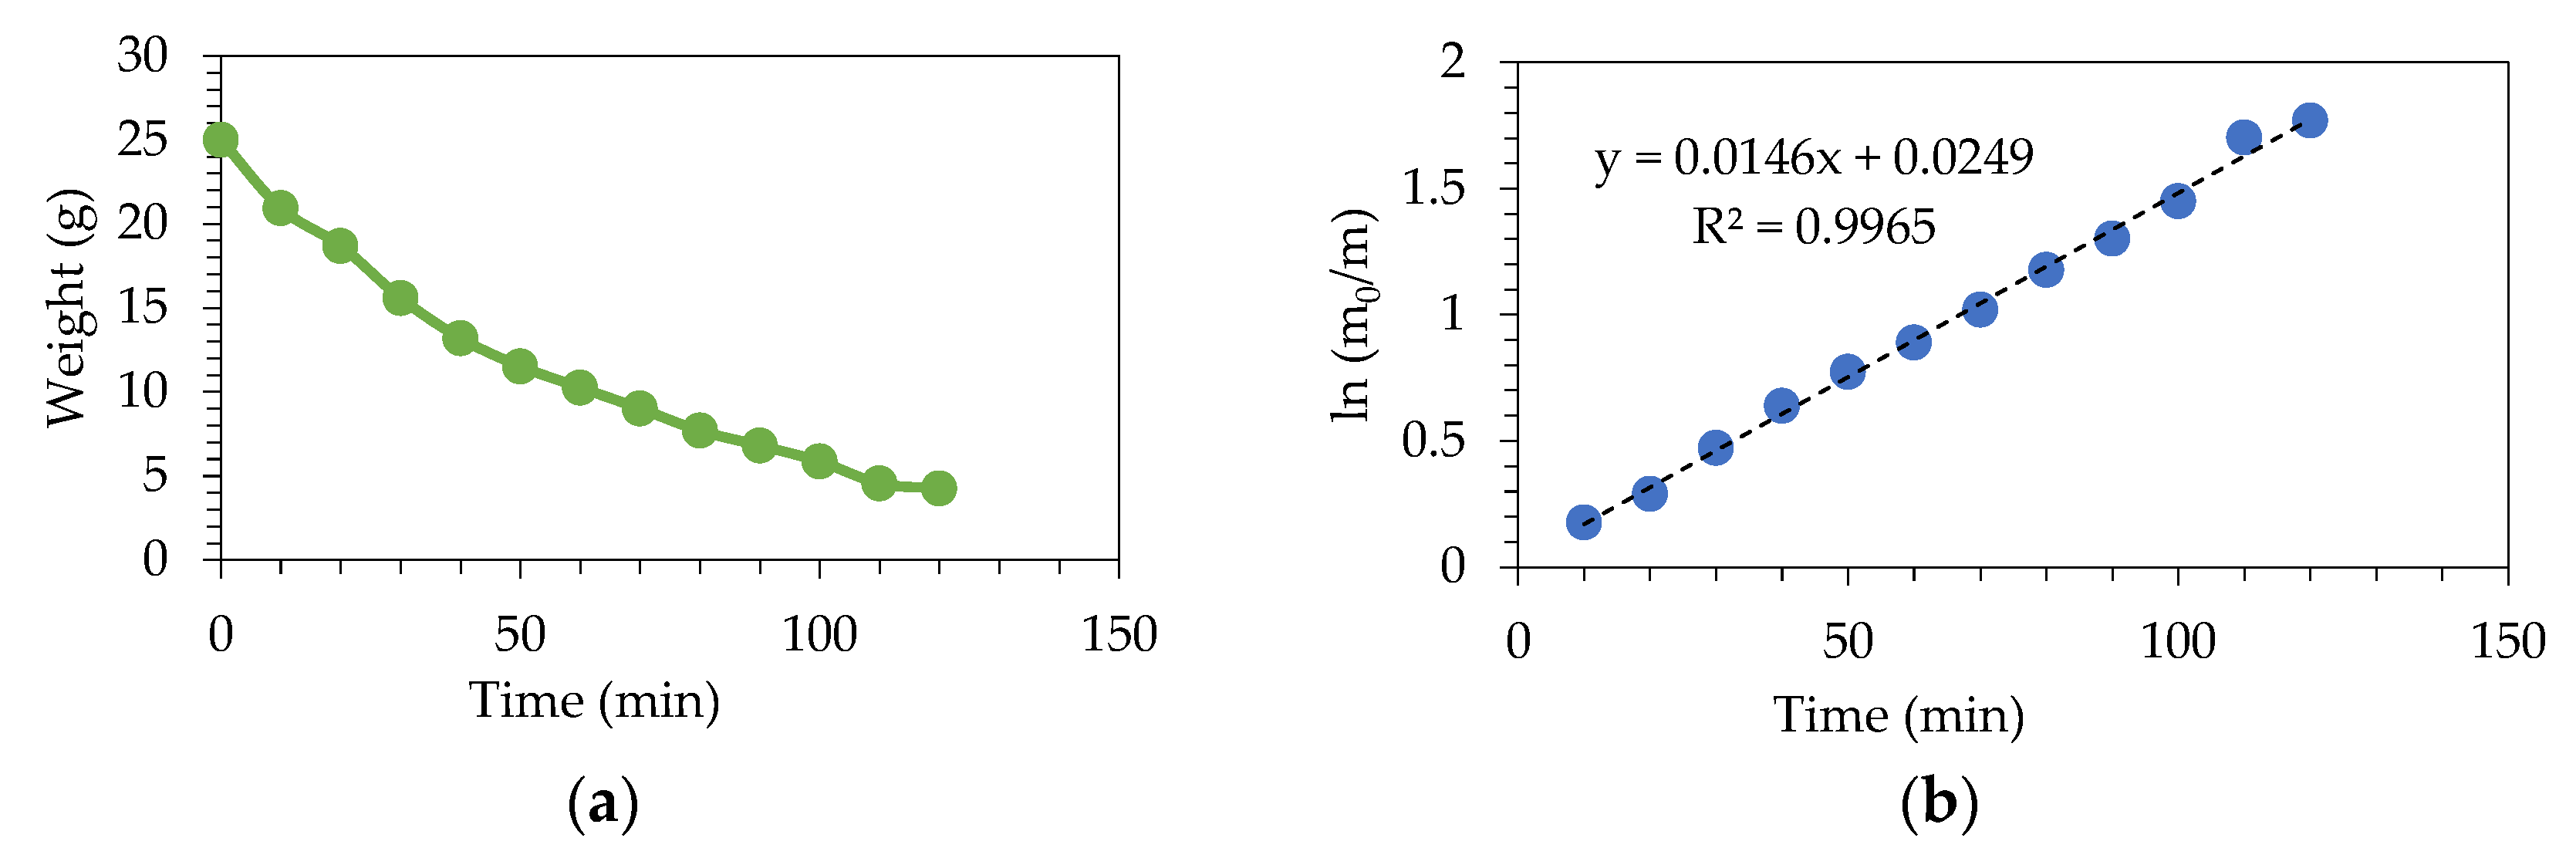
The WEPS weight loss as a function of time and the weight evolution over time of the liquid products obtained in the R-8 pyrolysis experiment carried out with the rotary reactor, with a WEPS/MgO catalyst ratio of 10:1, using no solvent nor carrier gas, is shown in Figure 9. The graphs corresponding to all the pyrolysis experiments that were carried out using the rotary reactor are shown in Figure A3. The same WEPS weight loss as a function of time and the weight evolution over time of the liquid fraction trend was observed in all the experiments, even when the regenerated MgO catalyst was used, or no catalyst was used. At the beginning of the pyrolysis, a large volume of liquid products with a very high styrene concentration was obtained. As the reaction progressed, a decrease in the concentration of styrene was observed, and the concentration of toluene, ethylbenzene, and heavier products (methyl styrene, propenyl benzene, butenyl benzene, and the dimer) increased, but a considerable reduction in the volume of liquid products (oil) was observed.
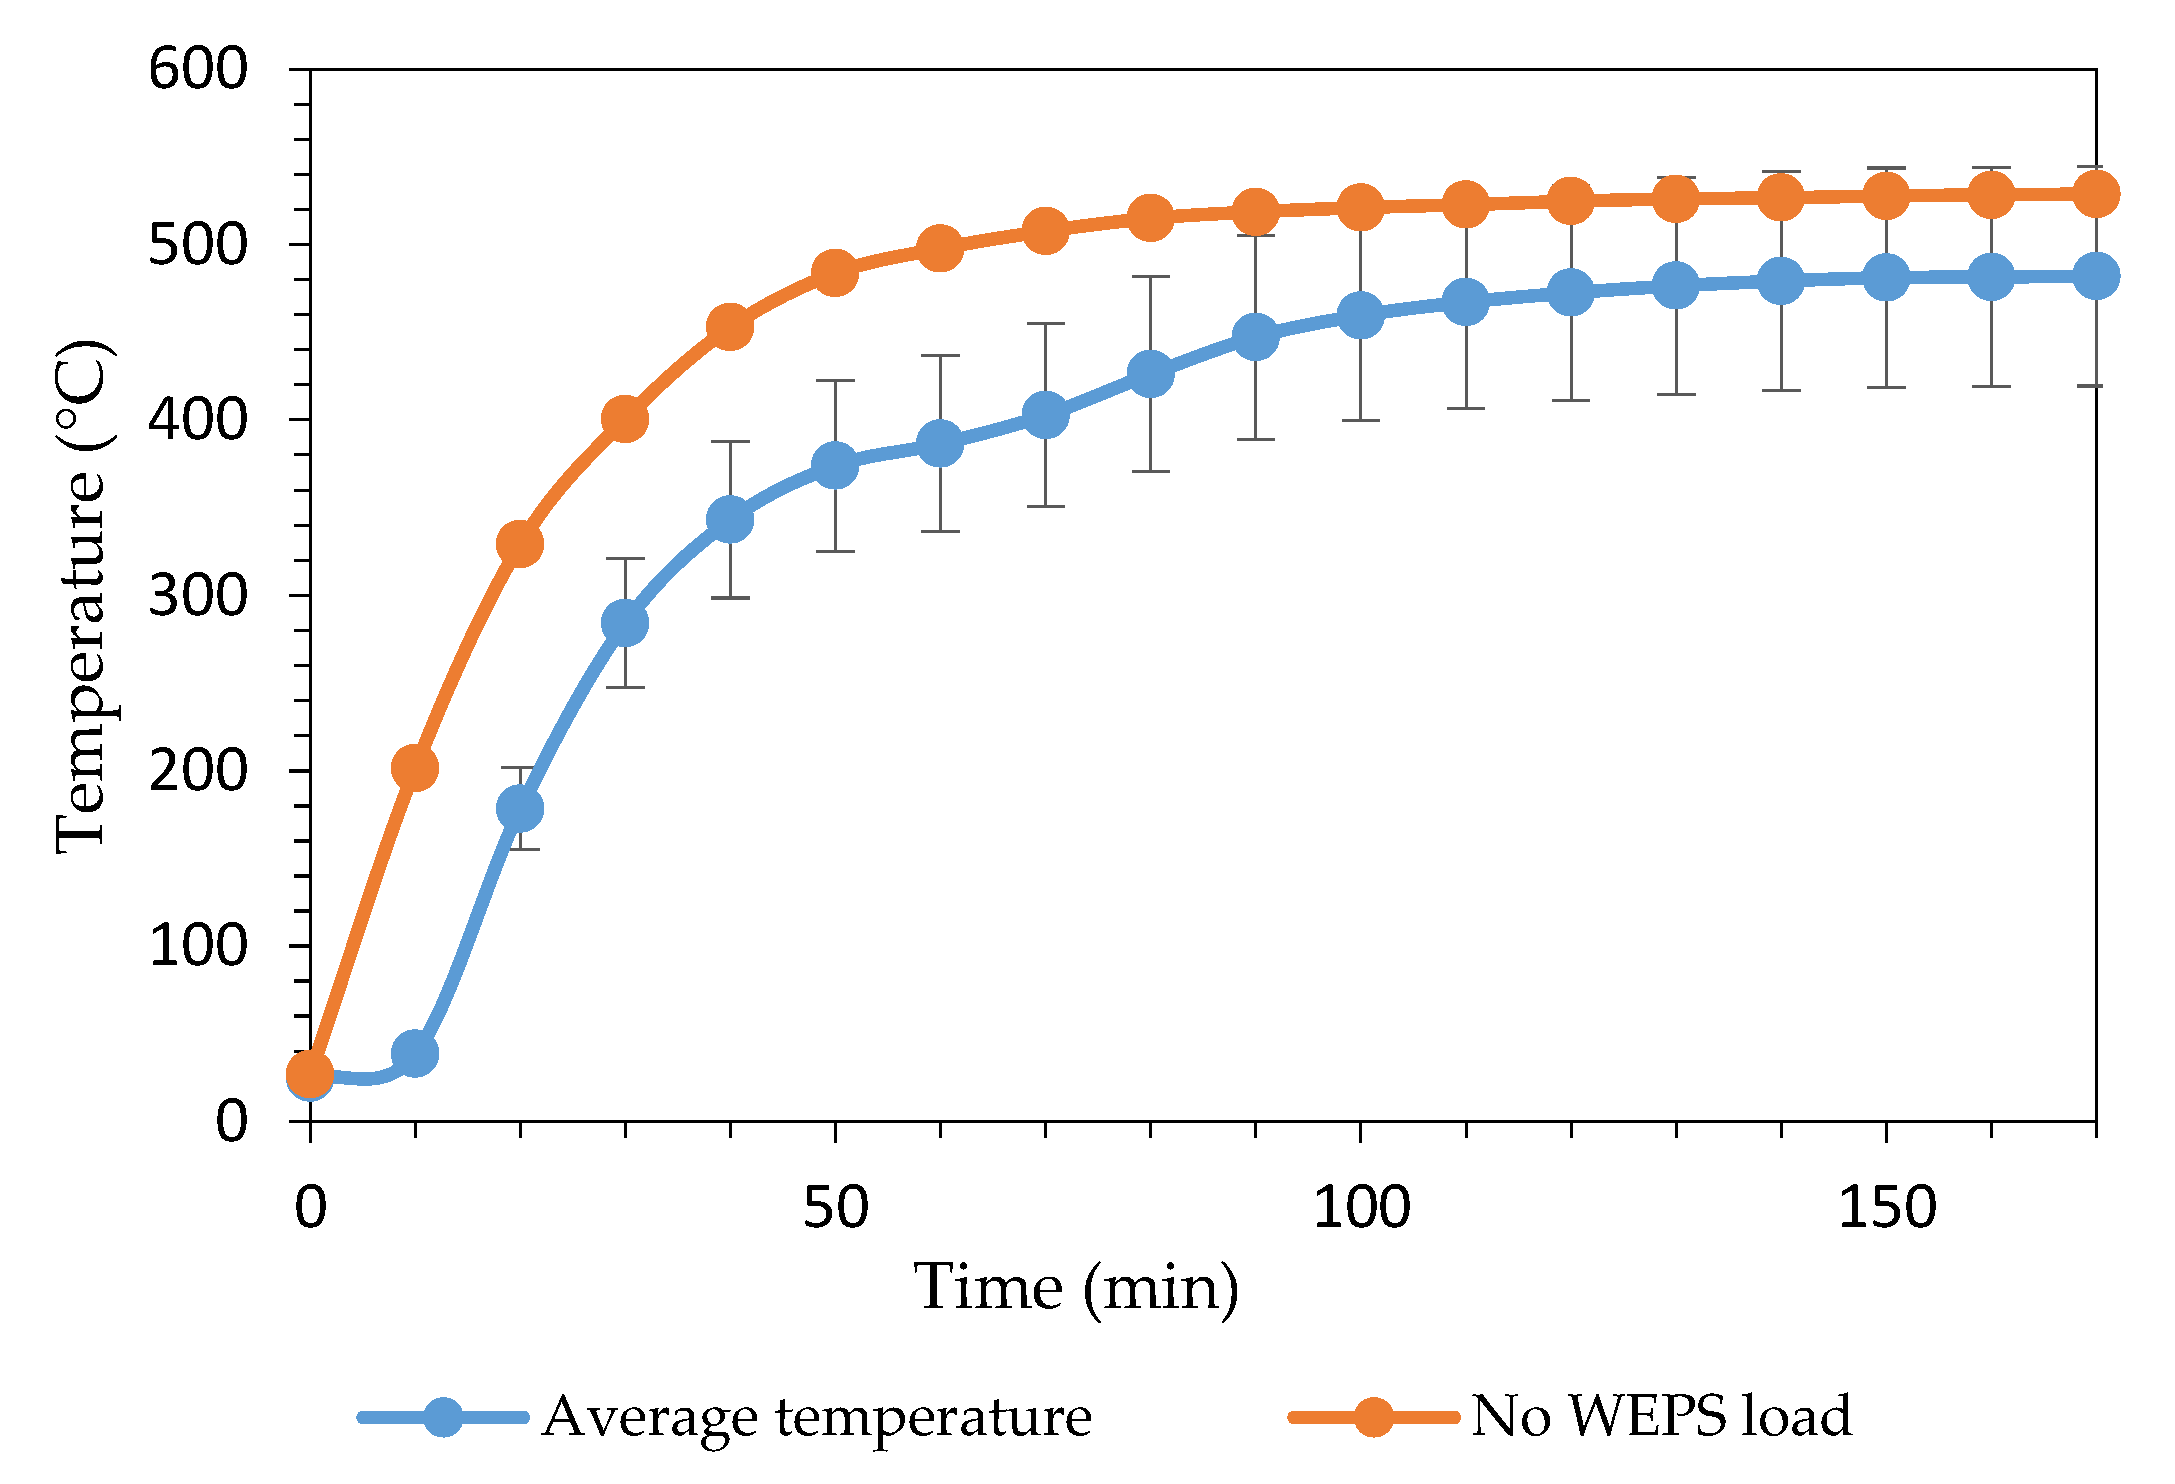
Figure 10 shows the average of the internal temperature as a function of time of all the experiments carried out in the rotating reactor, which is represented by the blue curve, in which two inflection points were observed. In the first case, a slight drop in temperature was perceived between 50 and 80 min, which can be attributed to the fact that at that time, the greatest cracking of WEPS took place, which required a large amount of energy since the WEPS pyrolysis is highly endothermic. However, this depression in temperature was not observed in the temperature test that was conducted without WEPS load, which corresponded to the orange curve in Figure 10. In the second case, no temperature increase was observed in the first 10 min of heating in the blue graph because the WEPS charged to the rotating reactor melted in those first minutes of heating, which was not observed in the WEPS no-load temperature test (orange plot).
The yields of the pyrolysis reaction of the experiments carried out with the rotary reactor of the products in gas, liquid, and solid form are shown in Table 4. It was observed that in the experiments R-1 and R-10, carried out without a catalyst, a lesser amount of solid residue was obtained. Carbon was deposited on a surface, and when MgO was used as a catalyst, it had a large surface area (the MgO BET area was 45.63 m²/g). On the other hand, in the experiments in which no catalyst was used, the carbon was only deposited on the inner wall of the rotating reactor.
The final concentrations in weight % of the liquid products of all the experiments carried out in the rotary reactor are detailed in Table 5. In the case of experiment R-10, a higher final concentration of styrene was obtained because it reached a temperature of 507.9 °C (carried out with the improved insulation). In comparison, in experiment R-1, a lower final concentration of styrene was obtained because the maximum temperature reached was lower, at 438.4 °C; both experiments were performed without a catalyst. It was observed that the by-products toluene, ethylbenzene, and heavier liquid products were obtained in the absence of a catalyst. It is also shown in Table 5 that those final concentrations of toluene double, and in some experiments triple, were obtained in the presence of the MgO catalyst than in its absence (experiments R-1 and R-10). Therefore, the MgO catalyst affected the production of this by-product.
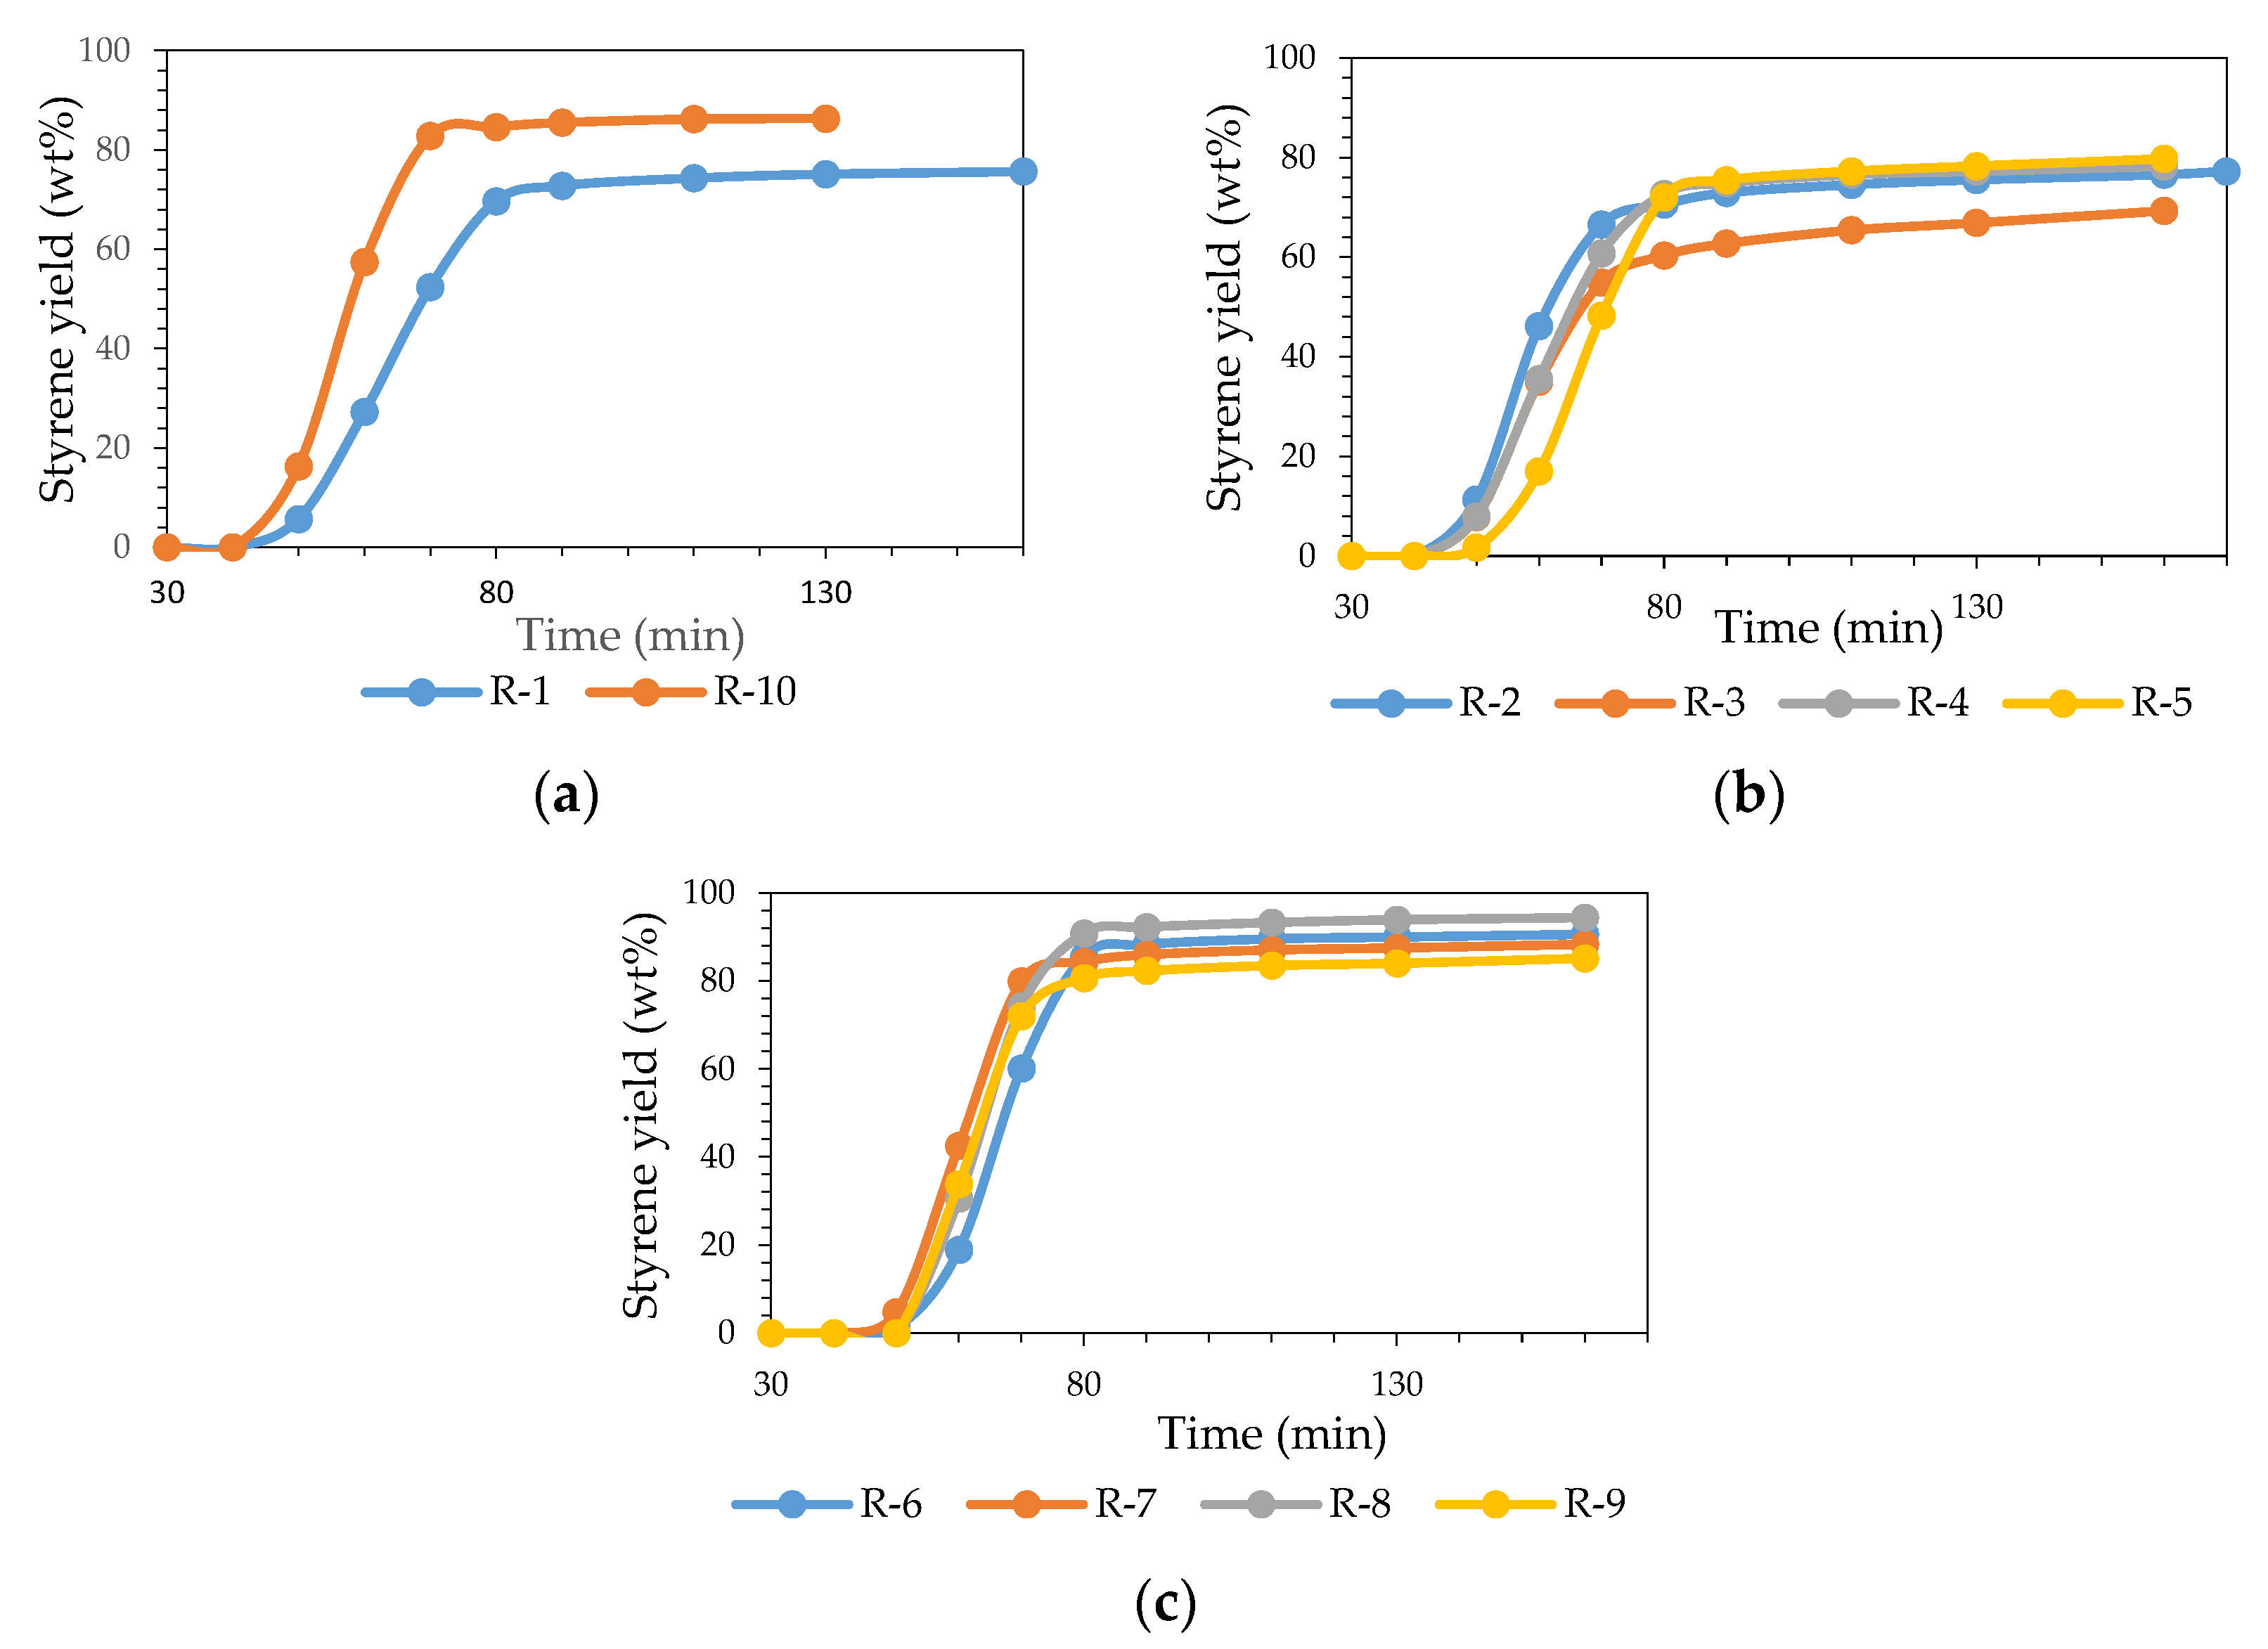
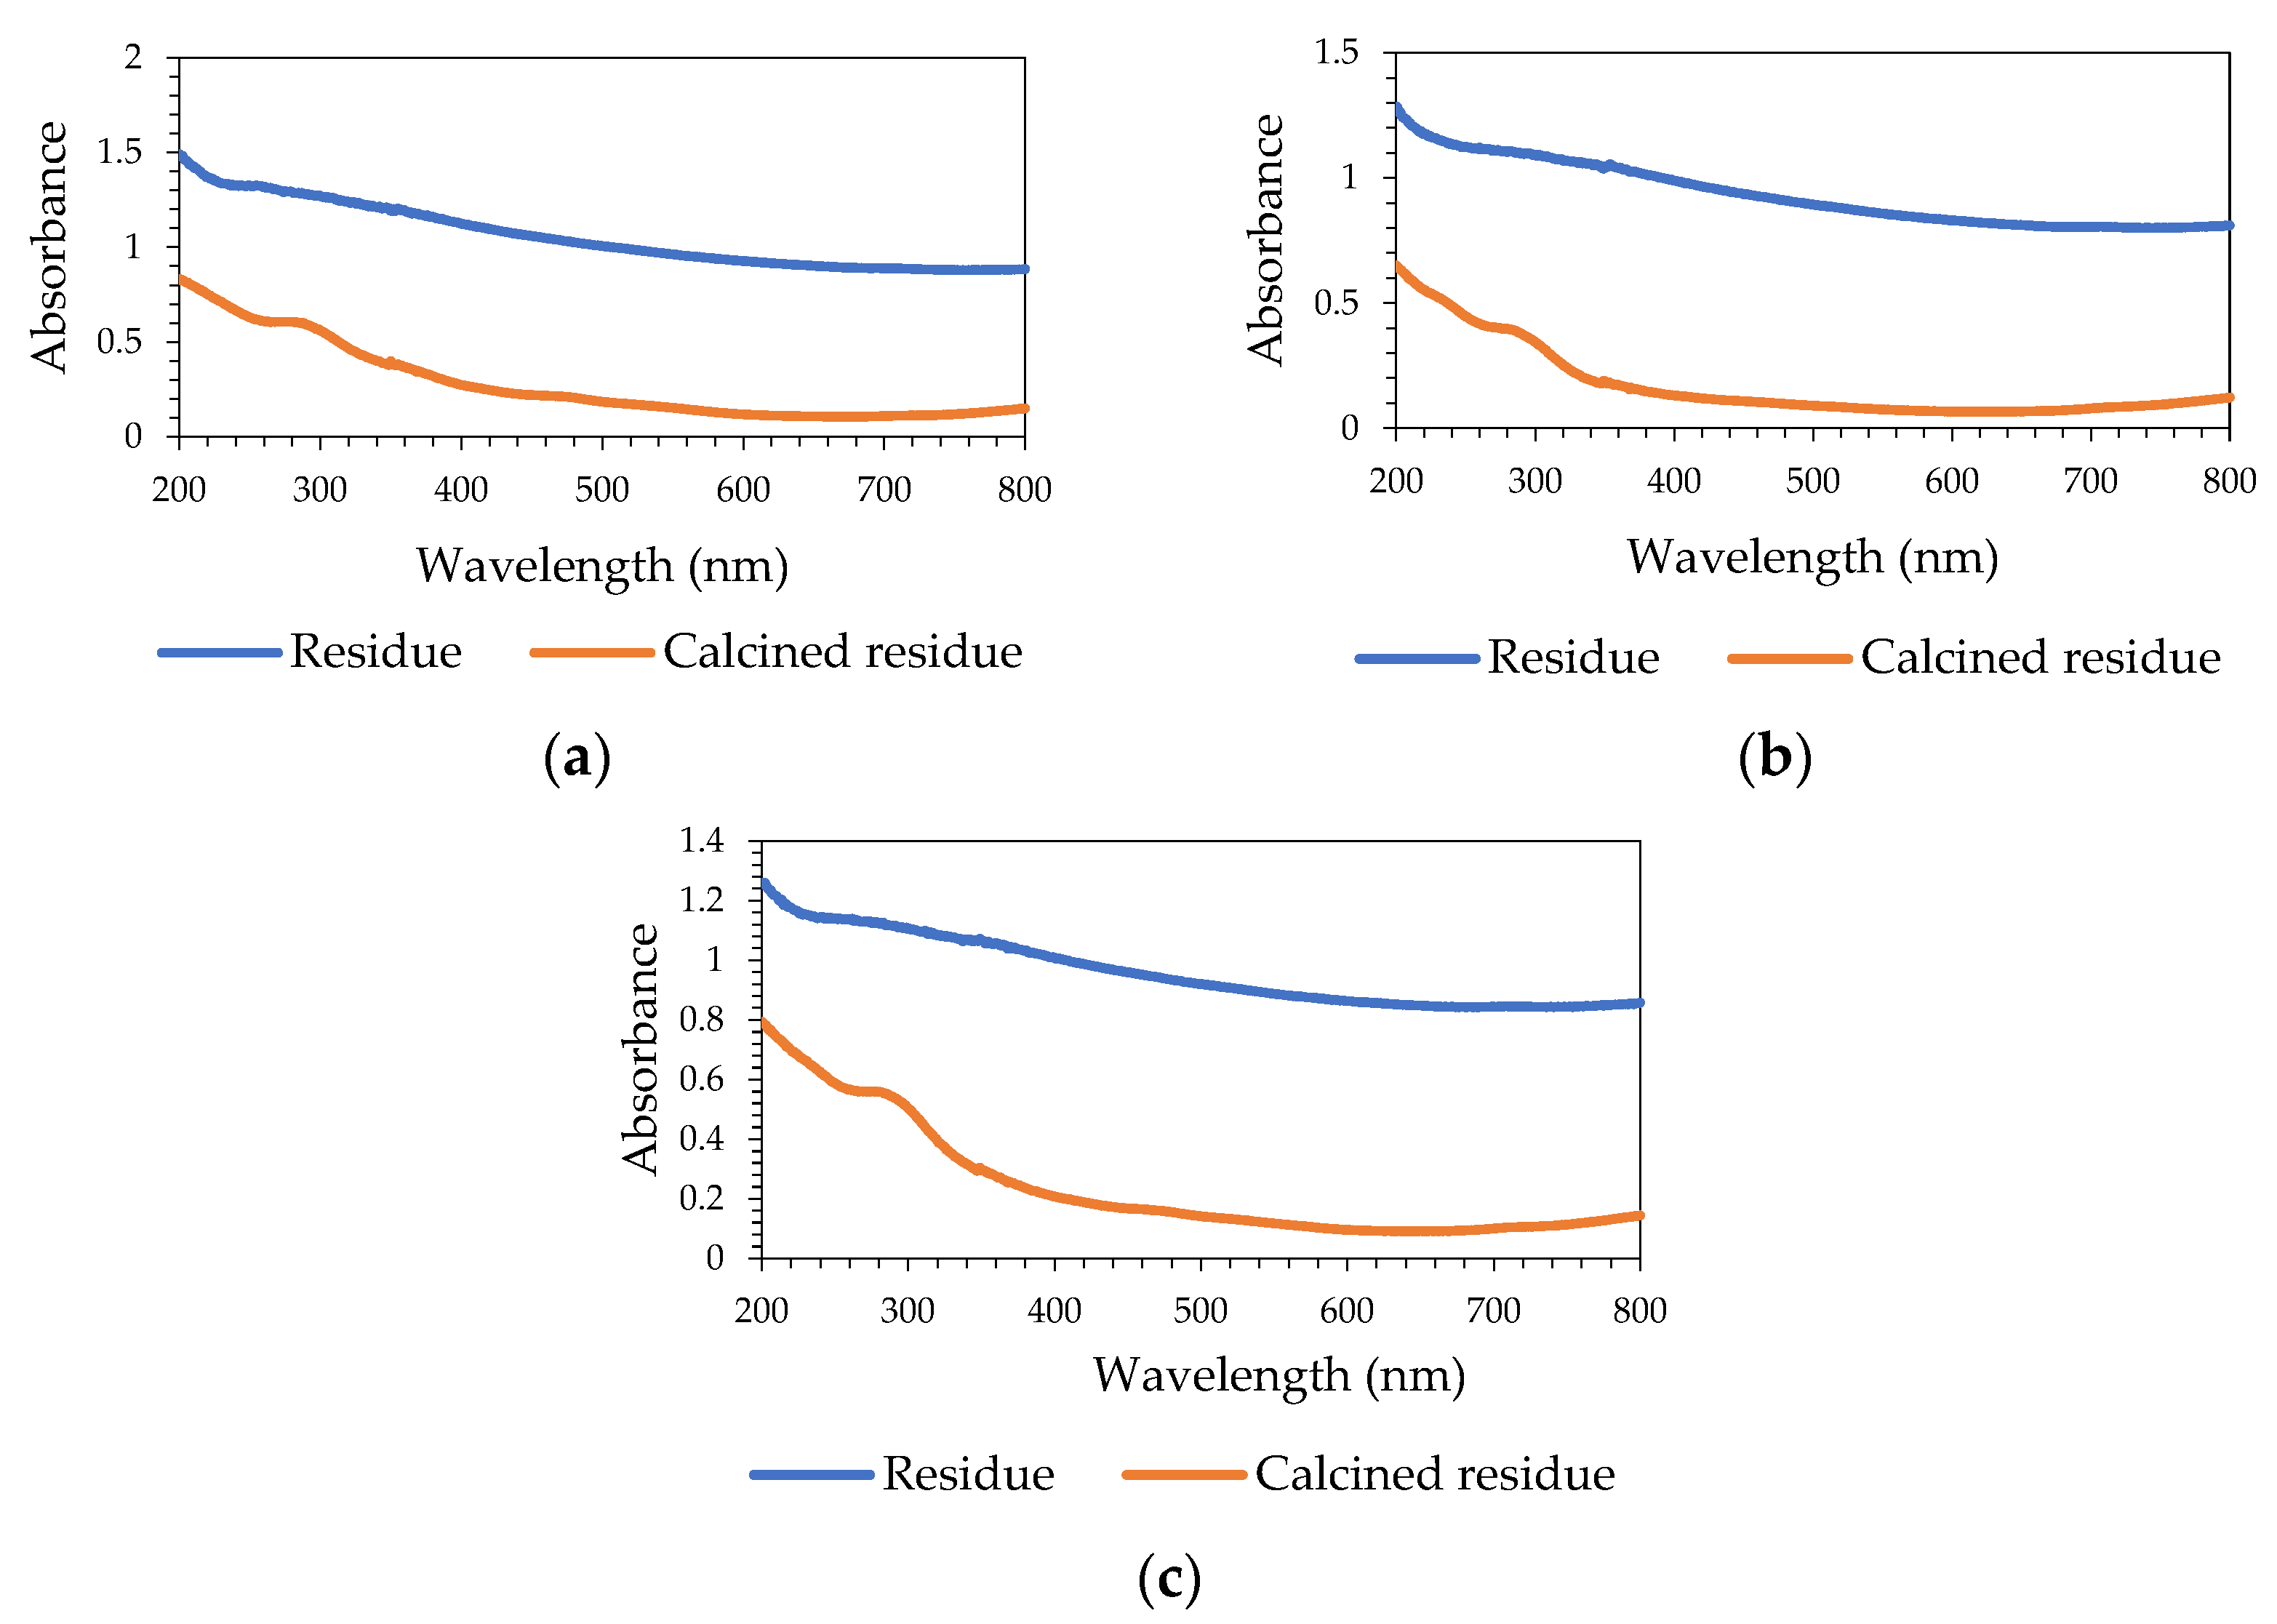
A relevant aspect of the results is knowing the styrene yield evolution as a function of time, as shown in Figure 11a–c. The evolution of the styrene yield over time of the experiments carried out using the rotating reactor without catalysts R-1 and R-10 is shown in Figure 11a. In the case of experiment R-1, where there was only simple insulation (glass fiber with a thickness of 4 cm), the reactor was heated to 438 °C, so a smaller slope of temperature against time was observed. In the case of experiment R-10, composite insulation was built (glass fiber plus ceramic fiber). The reactor was heated to 508 °C, so a greater temperature slope against time was observed.
In the case of the experiments carried out with the rotary reactor using fresh MgO catalyst (Figure 11b), a variation in the styrene yield similar to experiment R-1 was observed. Experiments R-2, R-3, and R-4 were carried out using the 4 cm thick fiberglass covering as insulation. In the case of experiment R-5, where the fiberglass coating plus the ceramic fiber layer was used as insulation, it was observed that the beginning and the end of the yield curve diverged over time concerning the other experiments (R-2 to R-4).
Figure 11c shows the styrene yield as a function of the time of the experiments carried out with the rotary reactor using regenerated MgO catalyst (R-6 to R-9). With the improved isolation, which consisted of the side coatings, the 8.5 cm thick ceramic fiber layer around the reactor, and the 4 cm thick fiberglass insulation, mentioned above, greater homogeneity in the styrene yield as a function of time was perceived. In the case of experiment R-6, the catalyst was regenerated for the first time, and no deactivation process was observed. The same MgO catalyst used and regenerated for the second time was used again in experiment R-7, and no decrease in performance was noted. Likewise, the same catalyst was regenerated for the third time and evaluated in experiment R-8; no deactivation was observed. Finally, in the experiment, R-9 was reused the four-time-regenerated MgO catalyst, and no deactivation was observed.
In all experiments, an evolution of the styrene yield over time similar to the development of temperature over time was observed (Figure 10), suggesting that the styrene yield had a directly proportional dependence on the heat flux or the temperature increase.
The results of the final styrene yield, LP gas consumption, and the maximum average temperature reached in the experiments carried out with the rotary reactor without using a catalyst are shown in Table 6. It was observed that in experiment R-1, the styrene yield was lower than in experiment R-10 because the maximum temperature inside the reactor was lower due to the poor insulation, although the LP gas consumption was similar. Therefore, with the same LP gas consumption, a higher styrene yield can be obtained by improving the insulation; in this way, the thermal efficiency was increased by reducing heat losses.
Table 7 shows the results of the experiments carried out with the rotary reactor using fresh MgO catalyst, without any thermal pretreatment. It was observed that lower styrene yields were obtained in these experiments because the experiments R-2 to R-4 were carried out before improving the insulation, and thus the temperatures reached inside the reactor were lower than in the experiments where the two layers of thermal insulation were placed.
It was observed that the styrene yields in experiments R-2, R-4, and R-5 were similar; the average was 78.5%, while in experiment R-3, it deviated 11% less from the average. Furthermore, it was noted that the higher the reactor temperature, the higher the yield of styrene obtained.
The results of the final styrene yield, LP gas consumption, and the maximum average temperature reached in the experiments carried out with the rotary reactor using the same MgO catalyst regenerated are shown in Table 8. It was observed that the highest styrene yield achieved was 94.35 wt% in experiment R-8, which coincided with the maximum average temperature reached inside the reactor, which was 528 °C, being the largest of all experiments.
Table 6, Table 7 and Table 8 show that when using the rotary reactor, high styrene yields were obtained, higher than those obtained in other studies in the literature [19,29], even with the regenerated MgO catalyst and without a catalyst. Therefore, it is technically feasible to implement it for industrial use by applying the regeneration of MgO catalyst or without a catalyst. Furthermore, the type of reactor used in the present study probably greatly favors the internal mass transfer due to the rotation of the reactive bed, that is, a good back-mixing of WEPS is achieved.
The lower temperatures in experiments R-1 to R-4 were because they were performed before the improvements in insulation were carried out. However, these temperature differences made it possible to determine the divergences in styrene yield with temperature.
Experiment R-10, carried out without a catalyst and with a maximum average temperature reached 507.9 °C, can be compared with experiment R-6, where a maximum average temperature of 504.1 °C was achieved, in which 4% more styrene yield was obtained. In experiments R-9 and R-10, a similar styrene yield was obtained, although an average maximum temperature of 513.2 °C was reached in experiment R-9. When pyrolysis was carried out at these temperatures, the behavior was different from that at low temperatures, remembering that in the experiments at 250 °C, previously carried out with the glass reactor, it was observed that the behavior was exactly the opposite (Figure 6). For the above, this process could also be carried out without a catalyst to obtain good results. By operating this process using the rotary reactor and without a catalyst, only carbon was obtained as solid residue, which could be valuable. When MgO was used as a catalyst, at the end of pyrolysis, the carbon remained attached to the catalyst’s outer surface, and, in this way, the carbon was not valuable.
Performing the analysis of the non-condensable gases of the R-9 experiment, a total distribution of solid, liquid, and gaseous products (by weight) resulted as follows: butane 0.6%, butylene 6.57%, toluene 5.74%, ethylbenzene 0.71%, styrene 85.09%, heavier liquids 0.26%, and carbon 1.03%.
Table 9 shows the highest oil yields, styrene content in oil, and styrene yield obtained in some relevant investigations. When making a comparison with the best result of the present work, it was observed that a higher styrene yield (94.35 wt%) was achieved in this study, derived from the fact that a high yield of oil (99.23 wt%) was also obtained at a high temperature (528 °C). The highest yield of styrene reported in each study in Table 9 was carried out in static semi-batch reactors, in some with a mechanical stirrer, and only one was continuous in a spouted bed regime. The difference between the present study and the others is that the reactor used was rotatory with basic powdered catalyst, which allowed for back-mixing in the reactive bed so that higher styrene yields were achieved in this study.
The liquid products obtained in this pyrolysis process were subjected to vacuum distillation to purify the styrene produced, thus lowering the boiling point in the distillation, preventing spontaneous polymerization of styrene at high temperatures.
An average of the amount of styrene produced per liter of LP gas consumed in the experiments carried out with the rotary reactor was made, which resulted in 1.144 g of styrene/L of LP gas (in the gas phase), which is equivalent to 0.535 kg of styrene/kg of LP gas. These data were used to evaluate the amount of LP gas required for styrene production in this process. Currently in Mexico City, the sale price of 0.535 kg of styrene monomer is USD 2.39, the cost of LP gas is USD 1.03 per kg, the cost of electricity is USD 0.09, and the cost of WEPS is estimated at USD 0.29, which makes an operating cost to produce 0.535 kg of styrene USD 1.41 in this pilot plant. Therefore, it can be said in a preliminary way and from an overall view that this process could be profitable on an industrial scale, although the investment cost of the equipment, as well as the cost of styrene purification, labor, maintenance, and other costs must also be taken into account.

3.7. Catalyst Characterization

3.7.1. N2 Physisorption (BET Area)

Figure 12 shows the N2 adsorption and desorption isotherm of the fresh MgO catalyst at a temperature of 77 °K, wherein it was observed that the isotherm was type IV with a mesoporous pore diameter, according to the IUPAC classification [44].
Using the DH cumulative desorption method, a surface of 45.63 m2/g of fresh MgO catalyst was obtained. Utilizing the BJH cumulative desorption method, a pore volume of 0.1016 cm3/g was obtained. With the BJH method by desorption, an average pore diameter of 3.645 nm was obtained, as seen in the pore diameter distribution in Figure 13.

3.7.2. X-ray Diffraction

The diffractogram of MgO catalyst before pyrolysis (Figure 14) showed a remarkable coincidence with the MgO diffractogram (93.36%), which was called periclase (red color in Figure 14 and Figure 15).
Figure 15 shows the diffractogram of the MgO catalyst after pyrolysis of the experiment carried out with the glass reactor (G1), in which the presence of coke was observed. This analysis shows that the MgO catalyst was not modified after pyrolysis since the periclase reflections remained constant.

3.7.3. Scanning Electron Microscopy (SEM-EDS)

Figure 16a shows the image obtained by scanning electron microscopy of the MgO catalyst before pyrolysis. Figure 16b corresponds to the mapping of Mg by EDS of the catalyst, Figure 16c corresponds to the mapping of Si, Figure 16d corresponds to the Ca mapping, Figure 16e corresponds to the O mapping, and the chemical compositions are detailed in Table 10.
Figure 17 shows the images of the MgO catalyst after pyrolysis of the experiment carried out with the glass reactor (G1) obtained with the scanning electron microscope. Its chemical composition is reported in Table 10. This analysis performed with scanning electron microscopy and EDS shows that, after the pyrolysis reaction, carbon was formed on the MgO catalyst, and the presence of traces of sulfur that did not exist before the WEPS pyrolysis was found.
Table 11 details the chemical compositions obtained by EDS from the solid residues generated with the rotary reactor after the pyrolysis reaction, from experiments R-3 to R-5 carried out with fresh MgO catalyst, R-6 carried out with MgO catalyst regenerated once, and R-7 carried out with MgO catalyst regenerated twice.
The presence of F can be explained by the degradation of the Teflon gasket that was placed between the reactor lid and the reactor body; it was observed that in the experiments R-6 and R-7 that corresponded to the regenerated catalyst, the F not only was not lost over the catalyst, but it increased with each regeneration. The presence of Si and other elements came from the remains of the red silicone sealant. Finally, the presence of Fe can be explained by the tiny fragments of the inner wall of the rotary reactor that were detached when the catalyst was recovered after pyrolysis.

3.7.4. Raman Spectroscopy

Figure 18 shows the Raman spectra obtained from the solid residues of the experiments carried out with the rotary reactor. According to Johnson and Thomas [45], the bands at 1337 and 1595 cm−1 corresponded to a highly disordered carbon. Therefore, most likely, it was not of the graphitic type. For this reason, the total elimination of this carbon can be easily carried out at a temperature of 600 °C, at which the catalyst was freed from its carbon cover. This way, its regeneration was carried out. Consequently, these bands no longer appeared in the spectrum of the calcined residue (Figure 18).

3.7.5. UV–VIS Spectroscopy

Figure 19 shows the UV–VIS spectra by diffuse reflectance obtained from the solid residues of the experiments carried out with the rotary reactor and their corresponding calcined residues. The change in the spectra of the residues of the experiments carried out with the rotary reactor concerning their respective calcined residues was observed. According to Zhang et al. [46], the calcined residues correspond to the UV–VIS spectrum of MgO contaminated with a little Si, which agrees with Section 3.7.3. (Table 11) regarding the presence of Si.

3.7.6. Thermogravimetric Analysis (TGA)

Figure 20 shows the TGA analysis of the solid residues from experiments R-3 to R-7 carried out with the rotary reactor; it was observed that most of the weight loss took place between 500 and 600 °C.

3.7.7. Calcination of Samples

The calcination results were the following: the weight loss of the MgO catalyst without pyrolysis reaction was 10.58 wt%, which is attributed to humidity. On the other hand, the weight loss in the calcination of the solid residue from the G1 experiment carried out with the glass reactor was 46.79 wt %, and this result of the carbon content of the G1 run solid residue approximately coincided with the result (48.95 wt %) shown in Section 3.7.3. (Table 10).
Table 12 shows the calcination results of the solid residues generated in the experiments R-3 to R-7 carried out with the rotary reactor; they were compared with the results of the thermogravimetric analysis (TGA) discussed in Section 3.7.6. It was observed that the carbon content results were similar.
Experiment G1 was carried out with the static glass reactor, and experiments R-3 to R-7 were carried out with the rotating reactor, so it was shown that the movement of the reactor helped the WEPS back-mixing and the deposit of carbon on the catalyst was lower. However, it should also be considered that the experiments with the rotary reactor were carried out at a higher temperature.

4. Conclusions

Preliminary experiments were carried out in a static glass reactor at 250 °C to determine which catalyst would be used in the WEPS pyrolysis. MgO was selected as the best catalyst due to its stability, low cost, and availability in the market. Later, catalytic and thermal WEPS pyrolysis experiments were carried out with a rotating steel reactor at higher temperatures, in which good results were obtained. The catalyst regeneration was studied for its reuse in pyrolysis. The highest styrene yield obtained was 94.35 wt%, with the catalyst regenerated three times, which coincided with the highest average temperature reached inside the rotary reactor, which was 528 °C. The best styrene yield was directly related to a higher temperature, with the temperature being the predominant variable in WEPS pyrolysis. The effect of the MgO catalyst was more significant at low temperatures than at higher temperatures. However, the movement in the rotating reactor also helped to obtain a higher styrene yield than when the reactor was static because the reactant bed back-mixing took place, and heat transfer was improved.
Given that good styrene yields were obtained with the rotary reactor, even with the MgO catalyst regenerated several times and without a catalyst, its industrial application is feasible and technically recommendable for styrene production from WEPS. It is crucial to have a good insulation system to minimize heat losses, operate the rotary reactor with a low rotation speed (1.6 rpm), and install mechanical seals and expansion joints for better control of leaks. This process implementation at an industrial level could contribute to the circular economy.
MgO catalyst is mesoporous and does not undergo any modification after pyrolysis. Thus, it can be reused with good results, employing its regeneration at 600 °C before reuse, with which the pyrolysis remaining carbon cover can be easily removed, since this carbon is of the highly disordered type, that is, not graphitic, which was verified with Raman spectroscopy. Furthermore, the presence of F, Si, and Fe impurities, among others generated at the pyrolysis end, do not affect the catalytic activity of the MgO regenerated with the pyrolysis solid residue calcination.
It is confirmed that the WEPS pyrolysis follows a first-order kinetics, according to reports in the literature. From the thermodynamic analysis, the increase in the reaction entropy ΔSr with the temperature rise suggests that the WEPS pyrolysis is favored with higher temperature since a higher styrene yield is obtained at a higher temperature. ΔHr and ΔGr were calculated to characterize the WEPS pyrolysis thermodynamically.

Author Contributions

Conceptualization, methodology, and proposal of the investigation project, J.F.R. and J.L.C.-L.; experimentation, G.P.-B., J.L.C.-L., B.Z.-S., D.A.-B., R.L.-M. and T.V.-R.; analysis of results, G.P.-B., J.L.C.-L., B.Z.-S., D.A.-B., R.L.-M., T.V.-R. and J.S.-B.; writing—review and editing, G.P.-B., J.L.C.-L. and J.S.-B. All authors have read and agreed to the published version of the manuscript.

Funding

This research received no external funding.

Institutional Review Board Statement

Not applicable.

Informed Consent Statement

Not applicable.

Data Availability Statement

Not applicable.

Acknowledgments

The authors thank the Consejo Nacional de Ciencia y Tecnología (CONACYT), a dependency of the Mexico Government, for supporting this work, as well as the Universidad Autónoma Metropolitana, the Instituto Politécnico Nacional, Síntesis y Aplicaciones Industriales, S. A., and the Instituto Mexicano del Petróleo for the use of its laboratories and equipment for the development of this investigation project.

Conflicts of Interest

The authors declare no conflict of interest.

Appendix A

Figure A1 shows the arrangement of the rotary reactor equipment that was used to carry out the experiments, wherein the different elements are observed: (1) rotary reactor; (2) mechanical seal; (3) expansion joint; (4) manometer; (5) condenser; (6) liquid–gas accumulator–separator tank; (7) motor-speed reducer; (8) temperature indicators, internal and external of the reactor; (9) volumetric gas meters; (10) cooling system water container.
Figure A1. Arrangement of rotary reactor equipment.
Sustainability 14 14914 g0a1
Figure A2 shows the insulation that consisted of an internal layer of ceramic fiber (not seen in the image) and the covering of the entire reactor (in the picture, the lateral cover of the front of the reactor is observed). In addition, a fiberglass layer was placed above this rotary reactor cover.
Figure A2. Reactor insulation.
Sustainability 14 14914 g0a2

Appendix B

The WEPS weight loss as a function of time and the evolution of the weight with the time of the liquid products obtained in all the pyrolysis experiments carried out with the rotary reactor are shown in Figure A3.
Figure A3. Weight evolution over time of WEPS and liquid products in the rotary reactor experiments: (a) R-1; (b) R-2; (c) R-3; (d) R-4; (e) R-5; (f) R-6; (g) R-7; (h) R-8; (i) R-9; (j) R-10.
Sustainability 14 14914 g0a3

References

  1. Ivask, A.; Suarez, E.; Patel, T.; Boren, D.; Ji, Z.; Holden, P.; Telesca, D.; Damoiseaux, R.; Bradley, K.A.; Godwin, H. Genome-Wide Bacterial Toxicity Screening Uncovers the Mechanisms of Toxicity of a Cationic Polystyrene Nanomaterial. Environ. Sci. Technol. 2012, 46, 2398–2405. [Google Scholar] [CrossRef] [PubMed]
  2. Jeong, C.B.; Won, E.J.; Kang, H.M.; Lee, M.C.; Hwang, D.S.; Hwang, U.K.; Zhou, B.; Souissi, S.; Lee, S.J.; Lee, J.S. Microplastic Size-Dependent Toxicity, Oxidative Stress Induction, and p-JNK and p-p38 Activation in the Monogonont Rotifer (Brachionus koreanus). Environ. Sci. Technol. 2016, 50, 8849–8857. [Google Scholar] [CrossRef] [PubMed]
  3. Lee, K.W.; Shim, W.J.; Kwon, O.Y.; Kang, J.H. Size-Dependent Effects of Micro Polystyrene Particles in the Marine Copepod Tigriopus japonicus. Environ. Sci. Technol. 2013, 47, 11278–11283. [Google Scholar] [CrossRef] [PubMed]
  4. Rossi, G.; Barnoud, J.; Monticelli, L. Polystyrene Nanoparticles Perturb Lipid Membranes. J. Phys. Chem. Lett. 2014, 5, 241–246. [Google Scholar] [CrossRef]
  5. Xia, T.; Kovochich, M.; Liong, M.; Zink, J.I.; Nel, A.E. Cationic Polystyrene Nanosphere Toxicity Depends on Cell-Specific Endocyticand Mitochondrial Injury Pathways. ACS Nano 2008, 2, 85–96. [Google Scholar] [CrossRef]
  6. Sussarellu, R.; Suquet, M.; Thomas, Y.; Lambert, C.; Fabioux, C.; Pernet, M.E.J.; Le Goïc, N.; Quillien, V.; Mingant, C.; Epelboin, Y.; et al. Oyster reproduction is affected by exposure to polystyrene microplastics. PNAS 2016, 113, 2430–2435. [Google Scholar] [CrossRef] [Green Version]
  7. Lebreton, L.; Slat, B.; Ferrari, F.; Sainte-Rose, B.; Aitken, J.; Marthouse, R.; Hajbane, S.; Cunsolo, S.; Schwarz, A.; Levivier, A.; et al. Evidence that the Great Pacific Garbage Patch is rapidly accumulating plastic. Sci. Rep. 2018, 8, 4666. [Google Scholar] [CrossRef] [Green Version]
  8. Environment Secretariat (SEDEMA), Mexico City Government. Solid Waste Inventory; Environment Secretariat (SEDEMA), Mexico City Government: Mexico City, Mexico, 2020; Volume 16, p. 164. [Google Scholar]
  9. Environment and Natural Resources Secretariat (SEMARNAT), Mexico Government. Basic Diagnostics for Integral Solid Waste Management; Environment and Natural Resources Secretariat (SEMARNAT), Mexico Government: Mexico City, Mexico, 2020; p. 23. [Google Scholar]
  10. Chaukura, N.; Gwenzi, W.; Bunhu, T.; Ruziwa, D.T.; Pumure, I. Potential uses and value-added products derived from waste polystyrene in developing countries: A review. Resour. Conserv. Recycl. 2016, 107, 157–165. [Google Scholar] [CrossRef]
  11. Ojha, D.K.; Vinu, R. Resource recovery via catalytic fast pyrolysis of polystyrene using zeolites. J. Anal. Appl. Pyrolysis 2015, 113, 349–359. [Google Scholar] [CrossRef]
  12. Mo, Y.; Zhao, L.; Wang, Z.; Chen, C.L.; Tan, G.Y.A.; Wang, J.Y. Enhanced styrene recovery from waste polystyrene pyrolysis using response surface methodology coupled with Box–Behnken design. Waste Manag. 2014, 34, 763–769. [Google Scholar] [CrossRef]
  13. Hu, Y.; Li, S. The effects of magnesium hydroxide on flash pyrolysis of polystyrene. J. Anal. Appl. Pyrolysis 2007, 78, 32–39. [Google Scholar] [CrossRef]
  14. Park, J.J.; Park, K.; Kim, J.S.; Maken, S.; Song, H.; Shin, H.; Park, J.W.; Choi, M.J. Characterization of Styrene Recovery from the Pyrolysis of Waste Expandable Polystyrene. Energy Fuels 2003, 17, 1576–1582. [Google Scholar] [CrossRef]
  15. William, P.T.; Bagri, R. Hydrocarbon gases and oils from the recycling of polystyrene waste by catalytic pyrolysis. Int. J. Energy Res. 2004, 28, 31–44. [Google Scholar] [CrossRef]
  16. Miandad, R.; Nizami, A.S.; Rehan, M.; Barakat, M.A.; Khan, M.I.; Mustafa, A.; Ismail, I.M.I.; Murphy, J.D. Influence of temperature and reaction time on the conversion of polystyrene waste to pyrolysis liquid oil. Waste Manag. 2016, 58, 250–259. [Google Scholar] [CrossRef]
  17. Hadi, B.; Sokoto, A.M.; Muhammad, A.B.; Garba, M.M. Effect of neat kaolin and CuO/Kaolin on the yield and composition of products from pyrolysis of polystyrene waste. Energy Sources Part A Recovery Util. Environ. Eff. 2017, 39, 148–153. [Google Scholar] [CrossRef]
  18. Çelikgöğüs, Ç.; Karaduman, A. Thermal-catalytic Pyrolysis of Polystyrene Waste Foams in a Semi-batch Reactor. Energy Sources Part A Recovery Util. Environ. Eff. 2015, 37, 2507–2513. [Google Scholar] [CrossRef]
  19. Imani Moqadam, S.; Mirdrikvand, M.; Roozbehani, B.; Kharaghani, A.; Shishehsaz, M.R. Polystyrene pyrolysis using silica-alumina catalyst in fluidized bed reactor. Clean Technol. Environ. Policy 2015, 17, 1847–1860. [Google Scholar] [CrossRef]
  20. Zhang, Z.; Hirose, T.; Nishio, S.; Morioka, Y.; Azuma, N.; Ueno, A. Chemical Recycling of Waste Polystyrene into Styrene over Solid Acids and Bases. Ind. Eng. Chem. Res. 1995, 34, 4514–4519. [Google Scholar] [CrossRef]
  21. Shah, A.; Jan, J.; Rasul, M. Polystyrene degradation studies using Cu supported catalysts. J. Anal. Appl. Pyrolysis 2014, 109, 196–204. [Google Scholar]
  22. Xie, C.; Liu, F.; Yu, S.; Xie, F.; Li, L.; Zhang, S.; Yang, J. Study on catalytic pyrolysis of polystyrene over base modified silicon mesoporous molecular sieve. Catal. Commun. 2008, 9, 1132–1136. [Google Scholar] [CrossRef]
  23. Kruse, T.M.; Wong, H.W.; Broadbelt, L.J. Modeling the Evolution of the Full Polystyrene Molecular Weight Distribution during Polystyrene Pyrolysis. Ind. Eng. Chem. Res. 2003, 42, 2722–2735. [Google Scholar] [CrossRef]
  24. Karaduman, A.; Șimșek, E.H.; Çiçek, B.; Bilgesü, A.Y. Thermal degradation of polystyrene wastes in various solvents. J. Anal. Appl. Pyrolysis 2002, 62, 273–280. [Google Scholar] [CrossRef]
  25. Kim, Y.S.; Hwang, G.H.; Bae, S.Y.; Yi, S.C.; Moon, S.K.; Kumazawa, H. Pyrolysis of polystyrene in a batch-type stirred vessel. Korean J. Chem. Eng. 1999, 16, 161–165. [Google Scholar] [CrossRef]
  26. Rezvanipour, M.; Hesari, F.A.; Pazouki, M. Catalytic Pyrolysis of General Purpose Polystyrene Using Red Mud as a Catalyst. Iran. J. Chem. Eng. 2014, 11, 10–20. [Google Scholar]
  27. Monroy-Alonso, A.; Ordaz-Quintero, A.; Ramirez, J.C.; Saldívar-Guerra, E. Thermal Pyrolysis of Polystyrene Aided by a Nitroxide End-Functionality Improved Process and Modeling of the Full Molecular Weight Distribution. Polymers 2022, 14, 160. [Google Scholar] [CrossRef]
  28. Sun, H.; Rosenthal, C.; Schmidt, L.D. Oxidative pyrolysis of polystyrene into styrene monomers in an autothermal fixed-bed catalytic reactor. ChemSusChem 2012, 5, 1883–1887. [Google Scholar] [CrossRef] [PubMed]
  29. Artetxe, M.; Lopez, G.; Amutio, M.; Barbarias, I.; Arregi, A.; Aguado, R.; Bilbao, J.; Olazar, M. Styrene recovery from polystyrene by flash pyrolysis in a conical spouted bed reactor. Waste Manag. 2015, 45, 126–133. [Google Scholar] [CrossRef]
  30. Camiti, P.; Beltrame, P.L.; Armada, M.; Gervasini, A.; Audisio, G. Polystyrene Thermodegradation. 2. Kinetics of Formation of Volatile Products. Ind. Eng. Chem. Res. 1991, 30, 1624–1629. [Google Scholar]
  31. Encinar, J.M.; González, J.F. Pyrolysis of synthetic polymers and plastic wastes, Kinetic study. Fuel Process. Technol. 2008, 89, 678–686. [Google Scholar] [CrossRef]
  32. Nisar, J.; Ali, G.; Shah, A.; Raza Shah, M.; Iqbal, M.; Naeem Ashiq, M.; Nawaz Bhatti, H. Pyrolysis of Expanded Waste Polystyrene: Influence of Nickel-Doped Copper Oxide on Kinetics, Thermodynamics, and Product Distribution. Energy Fuels 2019, 33, 12666–12678. [Google Scholar] [CrossRef]
  33. Mo, Y.; Zhao, L.; Chen, C.L.; Tan, G.Y.A.; Wang, J.Y. Comparative pyrolysis upcycling of polystyrene waste: Thermodynamics, kinetics, and product evolution profile. Therm. Anal. Calorim. 2013, 111, 781–788. [Google Scholar] [CrossRef]
  34. Aguado, R.; Olazar, M.; Gaisán, B.; Prieto, R.; Bilbao, J. Kinetics of polystyrene pyrolysis in a conical spouted bed reactor. Chem. Eng. J. 2003, 92, 91–99. [Google Scholar] [CrossRef]
  35. Gowariker, V.R.; Vishwanathan, N.V.; Shreedhar, J. Polymer Science, 1st ed.; New Age International (P) Ltd., Publishers: New Delhi, India, 2005; p. 356. [Google Scholar]
  36. Smith, J.M. Chemical Engineering Kinetics, 2nd ed.; McGraw-Hill: Tokyo, Japan, 1970; p. 11. [Google Scholar]
  37. Billmeyer, F.W. Textbook of Polymer Science, 3rd ed.; John Wiley & Sons: New York, NY, USA, 1984; p. 72. [Google Scholar]
  38. Sandler, S.I. Chemical and Engineering Thermodynamics, 1st ed.; Interamericana: Mexico City, Mexico, 1981; p. 52. [Google Scholar]
  39. Brunauer, S.; Emmett, P.H.; Teller, E. Adsorption of Gases in Multimolecular Layers. J. Am. Chem. Soc. 1938, 60, 309–319. [Google Scholar] [CrossRef]
  40. Lippens, B.C.; Boer, J.H. Studies on Pore Systems in Catalysts: V. The t Method. J. Catal. 1965, 4, 319–323. [Google Scholar] [CrossRef]
  41. Barrett, E.P.; Joyner, L.G.; Halenda, P.P. The Determination of Pore Volume and Area Distributions in Porous Substances. I. Computations from Nitrogen Isotherms. J. Am. Chem. Soc. 1951, 73, 373–380. [Google Scholar] [CrossRef]
  42. García, M.T.; Gracia, I.; Duque, G.; de Lucas, A.; Rodríguez, J.F. Study of the solubility and stability of polystyrene wastes in a dissolution recycling process. Waste Manag. 2009, 29, 1814–1818. [Google Scholar] [CrossRef]
  43. Kol, R.; De Somer, T.; D’hooge, D.R.; Knappich, F.; Ragaert, K.; Achilias, D.S.; De Meester, S. State-of-the-Art Quantification of Polymer Solution Viscosity for Plastic Waste Recycling. ChemSusChem 2021, 14, 4071–4102. [Google Scholar] [CrossRef]
  44. Contreras, J.L.; Gomez, G.; Zeifert, B.; Salmones, J. Synthesis of mesoporous alumina for catalytic applications, Book Chapter No. 1. In Comprehensive Guide for Mesoporous Materials; Mahmood Aliofkhazraei, Nova Science Publishers Inc.: New York, NY, USA, 2015; pp. 11–23. [Google Scholar]
  45. Johnson, C.A.; Thomas, K.M. Applications of Raman microprobe spectroscopy to the characterization of carbon deposits on catalysts. Fuel 1984, 63, 1073–1080. [Google Scholar] [CrossRef]
  46. Zhang, M.; Gao, M.; Chen, J.; Yu, Y. Study on key step of 1,3-butadiene formation from ethanol on MgO/SiO2. RSC Adv. 2015, 5, 25959–25966. [Google Scholar] [CrossRef]
Figure 1. Glass reactor diagram, without stirring and its components.
Sustainability 14 14914 g001
Figure 2. Semi-batch rotary reactor process diagram.
Sustainability 14 14914 g002
Figure 3. Viscosity against WEPS concentration dissolved in toluene at 25 °C. The dotted line corresponds to the mathematical model and the solid line corresponds to the experimental data.
Sustainability 14 14914 g003
Figure 4. ln (ηr)/C against WEPS concentration in toluene. The dotted line corresponds to the mathematical model.
Sustainability 14 14914 g004
Figure 5. IR spectrum of WEPS pyrolysis liquid products obtained in the glass reactor, using MgO as a catalyst at 250 °C.
Sustainability 14 14914 g005
Figure 6. Styrene yield evolution over time of experiments G0 and G1 carried out with the static glass reactor at 250 °C.
Sustainability 14 14914 g006
Scheme 1. Proposed mechanism model using solid acid catalysts; adapted from Zhang et al. [20].
Sustainability 14 14914 sch001
Scheme 2. Proposed mechanism model using solid basic catalysts; adapted from Zhang et al. [20].
Sustainability 14 14914 sch002
Figure 7. Experimental test data using the glass reactor without a catalyst at 250 °C (G0): (a) WEPS weight loss with time t; (b) ln (m0/m) against time t.
Sustainability 14 14914 g007
Figure 8. Experimental test data using the glass reactor with MgO as a catalyst at 250 °C (G1): (a) WEPS weight loss with time t; (b) ln (m0/m) against time t.
Sustainability 14 14914 g008
Figure 9. Evolution over time of WEPS and liquid products of experiment R-8 using the rotary semi-batch reactor.
Sustainability 14 14914 g009
Figure 10. Average internal temperature evolution over time of all experiments performed with the rotary reactor and wall temperature profile of the no-load WEPS test.
Sustainability 14 14914 g010
Figure 11. Evolution over time of styrene yield of experiments carried out using the rotary reactor: (a) no catalyst; (b) fresh MgO catalyst; (c) regenerated MgO catalyst.
Sustainability 14 14914 g011
Figure 12. Fresh MgO catalyst adsorption and desorption isotherm.
Sustainability 14 14914 g012
Figure 13. Pore distribution of fresh MgO catalyst.
Sustainability 14 14914 g013
Figure 14. MgO X-ray diffractogram before pyrolysis; the blue color corresponded to C.
Sustainability 14 14914 g014
Figure 15. MgO X-ray diffractogram after pyrolysis.
Sustainability 14 14914 g015
Figure 16. Scanning electron microscopy and mapping of MgO catalyst elements by EDS before pyrolysis. (a) SEM image; (b) mapping of Mg; (c) mapping of Si; (d) mapping of Ca; (e) mapping of O.
Sustainability 14 14914 g016
Figure 17. Scanning electron microscopy and EDS element mapping of the MgO catalyst after pyrolysis. (a) SEM image; (b) mapping of C; (c) Si mapping; (d) S mapping; (e) O mapping; (f) Mg mapping; (g) Ca mapping.
Sustainability 14 14914 g017aSustainability 14 14914 g017b
Figure 18. Raman spectra of the solid residues generated in the rotary reactor.
Sustainability 14 14914 g018
Figure 19. UV–VIS spectra of the solid residues generated with the rotary reactor of the experiments: (a) R-3; (b) R-4; (c) R-5.
Sustainability 14 14914 g019
Figure 20. TGA results of pyrolysis solid residues from experiments performed with the rotary reactor.
Sustainability 14 14914 g020
Table 1. Summary of experiments carried out in the semi-batch rotary reactor.
ExperimentFeatures
R-1No catalyst
R-2Fresh catalyst
R-3Fresh catalyst
R-4Fresh catalyst
R-5Fresh catalyst, improved insulation
R-6Regenerated catalyst, improved insulation
R-7Two times regenerated catalyst, improved insulation
R-8Three times regenerated catalyst, improved insulation
R-9Four times regenerated catalyst, improved insulation
R-10No catalyst, improved insulation
Table 2. Styrene yields obtained from the WEPS pyrolysis experiments in the static glass reactor.
ExperimentCatalystTemperature (°C)Styrene Yield (wt%)
G0Without catalyst25023.27
G1MgO25056.29
G2Calcined dolomite25050.69
G3MgO40066.42
Table 3. Calculated thermodynamic parameters of WEPS pyrolysis.
Temperature (°K)ΔHr (KJ/mol)ΔGr (KJ/mol)ΔSr (KJ/mol °K)
5739340.07175.4115.99
67316,745.95202.3124.58
77325,765.10229.3433.03
87336,122.29256.4741.08
97347,572.83283.7048.60
Table 4. Yields of products of the gaseous, liquid, and solid fraction of the experiments carried out with the rotary reactor.
ExperimentGas Yield (wt%)Liquid Yield (wt%)Solid Yield (wt%)
R-118.3981.540.07
R-29.5989.361.05
R-321.6977.151.16
R-413.2485.850.91
R-512.6386.600.77
R-61.6797.490.84
R-75.2093.541.26
R-80.1999.230.58
R-97.1791.801.03
R-1010.8189.080.11
Table 5. Final concentrations of the liquid products in the oil of the experiments carried out with the rotary reactor.
ExperimentStyrene (wt%)Toluene (wt%)Ethylbenzene (wt%)Heavier Products (wt%)
R-192.762.360.844.04
R-287.266.354.751.64
R-389.806.152.611.44
R-491.086.371.700.85
R-592.055.521.840.59
R-692.876.580.360.19
R-794.374.550.600.48
R-895.084.220.410.29
R-992.706.250.770.28
R-1096.882.100.470.55
Table 6. Final styrene yield, LP gas consumption, and the maximum average temperature reached in the experiments made without a catalyst.
ExperimentMaximum Average Temperature (°C)Styrene Yield (wt%)LP Gas Consumption (L)
R-1438.475.63391
R-10507.986.31395
Table 7. Final styrene yield, LP gas consumption, and the maximum average temperature reached in the experiments using the fresh MgO catalyst.
ExperimentMaximum Average Temperature (°C)Styrene Yield (wt%)LP Gas Consumption (L)
R-248477.98374
R-344569.29368
R-4450.278.20363
R-5479.679.72364
Table 8. Final styrene yield, LP gas consumption, and the maximum average temperature reached in the experiments carried out with regenerated MgO catalyst.
ExperimentMaximum Average Temperature (°C)Styrene Yield (wt%)LP Gas Consumption (L)
R-6504.190.54351
R-7519.588.28343
R-852894.35345
R-9513.285.09338
Table 9. Comparison of present study results with some relevant investigations.
ReferenceTemperature (°C) *Oil Yield (wt%)Styrene Content in Oil (wt%)Styrene Yield (wt%)Reactor TypeCatalyst
Park et al. [14]45095.176.3172.57Flask with paddle stirrer (semi-batch)No catalyst
Miandad et al. [16]45080.84838.78Stainless steel static reactor (semi-batch)No catalyst
Imani Moqadam et al. [19]41097.380.9878.79Fluidized bed reactor (semi-batch)Silica–alumina
Zhang et al. [20]35093.476.471.35Stainless steel static reactor (semi-batch)BaO
Kim et al. [25]39095.971.6368.69Stainless steel reactor with a mechanical agitator (semi-batch)No catalyst
Monroy-Alonso et al. [27]39088.675.266.62Stainless steel static reactor (semi-batch)No catalyst
Artexte et al. [29]500----70.57Conical spouted bed reactor (continuous)No catalyst
Carniti et al. [30]400--13.5--Glass tubes sealed under vacuum (batch)No catalyst
This study52899.2395.0894.35Steel rotary reactor (semi-batch)MgO
* Temperature at maximum styrene yield.
Table 10. MgO catalyst chemical composition before and after pyrolysis.
ElementBefore Pyrolysis (wt%)After Pyrolysis (wt%)
O79.9434.82
C0.0048.95
Mg19.312.95
Si0.382.33
Ca0.380.71
S0.000.24
Table 11. Chemical compositions of the solid residues from the rotary reactor experiments by EDS.
ElementWeight %
R-3R-4R-5R-6R-7
C8.7532.7711.5512.3819.05
O45.5239.8535.5932.9922.63
F5.332.901.5913.9523.60
Mg17.868.4248.6113.4921.75
Al6.054.420.150.561.18
Si14.1911.121.4212.347.37
S0.150.160.320.350.39
Ca1.180.350.7713.042.27
Fe0.960.000.000.891.75
Table 12. Weight loss during the spent catalyst calcination (1 g) and the TGA analysis results (5–8 mg) of the experiments carried out with the rotary reactor.
ExperimentCarbon Weight % with CalcinationCarbon Weight % with TGA
R-314.1513.7376
R-410.7513.1138
R-58.699.3167
R-68.749.0359
R-712.7611.9905
Publisher’s Note: MDPI stays neutral with regard to jurisdictional claims in published maps and institutional affiliations.

