Article

The Influence of Structural Design on the Dimensional Accuracy of CuCrZr Alloy Produced by Laser Powder Bed Fusion

Ji Hua Laboratory, Institute of Advanced Additive Manufacturing, Foshan 528000, China
*
Author to whom correspondence should be addressed.
Sustainability 2022, 14(21), 14639; https://doi.org/10.3390/su142114639
Submission received: 13 October 2022 / Revised: 2 November 2022 / Accepted: 3 November 2022 / Published: 7 November 2022
(This article belongs to the Special Issue Sustainability in Metal Additive Manufacturing)

Abstract

:
With the upgrade of additive manufacturing (AM) equipment, pure copper and various Cu-based alloys with almost full density have been successfully produced, maintaining their excellent thermal and electrical conductivity and good mechanical properties at high temperatures as well. In this paper, a model with a series of inclined surface structures was designed and fabricated to investigate the structural design on the formability of CuCrZr alloy produced by laser powder bed fusion (LPBF). The typical structure dimensions of the as-built samples were measured and compared with their corresponding dimensions and the inclined angle (α) and the relative angle (γ) between the inclined surface and recoating directions. The results demonstrate that the inclined structures with α < 50° were fabricated either with varying buckling deformation and powder adhesion or in failure for severe distortion. The differences (Ld) between the typical structure dimensions and their models increase with the decreasing of α. It has been observed that Ld reaches 1 mm when α is 20° and drastically reduces to around 200 μm when α is above 50°. When α < 50°, Ld is generally increasing with a rising γ value from 0° to 180°, significantly affecting the dimensional accuracy.

1. Introduction

As one of the most typical and promising additive manufacturing (AM) techniques, laser powder bed fusion (LPBF) can process major categories of materials with its high focus laser energy beam implemented, and thus is widely adopted in various industries. Up to now, many kinds of alloys have been fabricated and studied using LPBF, such as Al-based alloys [1,2,3,4,5], Fe-based alloys [6,7,8,9,10], Ni-based alloys [11,12,13,14,15], Cu-based alloys [16,17,18,19], etc.
For copper and copper alloys, due to their excellent electrical and thermal conductivity, they are widely used in many fields, such as aerospace, and petrochemical and mechanical applications, such as radiators, heat exchangers, and cooling systems due to its high thermal conductivity [20]. Early research on additive manufacturing of copper and copper alloys focused on the selective laser sintering (SLS) [21,22] and cold spraying [23,24]. Due to the low absorption rate and high reflection rate of copper when using the laser with 1062 nm wavelength, it is difficult for standard LPBF parameters to manufacture bulk copper parts with high density. In recent years, with high power laser widely equipped in LPBF devices, there have been increasing kinds of copper alloys successfully produced and studied, such as CuCrZr [25,26,27], Cu-Sn [18,19,28], Cu-Zn [17,29,30], Cu-Ni [16,31], Cu-W [32,33,34], Cu2O [35], etc.
The current research on copper and copper alloys mainly focuses on process parameter optimization and performances of fabricated parts. For pure copper, Ikeshoji et al. [36] obtained samples with 96% relative density at 800 W laser power. Jadhav et al. [37] deeply analyzed the densification mechanism of pure copper using a small focus laser (35 μm) and pointed out that the bulk solid copper parts with near full density (99.3% relative density) can be fabricated in a keyhole regime prior to the onset of keyhole-induced porosity. For copper alloys, there are more investigations on these issues. Zhang et al. [17] fabricated a Cu10Zn alloy with high density (99.97%) under very high laser power (1800 W) and they found that there is crystallographic texture in as-built samples, which results in an anisotropy on micro-hardness. Jadhav et al. [38] adopted a novel method to coat a very thin film of Sn on pure copper powders to produce CuSn0.3 powders, significantly improving the laser absorptivity of the raw powder, which is in favor of producing highly dense Cu-Sn products. As one of the precipitation hardenable Cu-based alloys, substantial attention has been drawn to selective laser melted CuCrZr alloys in recent years due to their good mechanical strength at high temperatures, and excellent thermal and electrical conductivity. With the most updated optimized the process parameters, LPBFed CuCrZr samples can obtain a high relative density of more than 99%, with the as-built sample showing strong anisotropy [39]. Salvan et al. [25] studied CuCrZr alloy (Cr: 0.5–1.2%, Zr: 0.03–0.3) in detail and the results demonstrated that direct aging resulted in better mechanical properties compared to the as-built samples, due to the formation of nano-scaled Cr precipitates.
However, for the influence of structural design on the formability of copper and copper alloys produced by LPBF, there are only few studies involving these issues. In this regard, this paper further investigated the formability of Cu-Cr-Zr alloy based on previous work [39]. The model with different inclined structures to determine the forming limits in LPBF was designed in order to investigate the influences of angles, including inclined angles and the relative angles between the scraper recoating direction and the inclined direction, on the dimensional accuracy of Cu-Cr-Zr alloy produced by LPBF. The fabrication dimensions of the samples were compared with their corresponding theoretical models and the dimension accuracy with the variation of angles above was measured and evaluated.

2. Materials and Methods

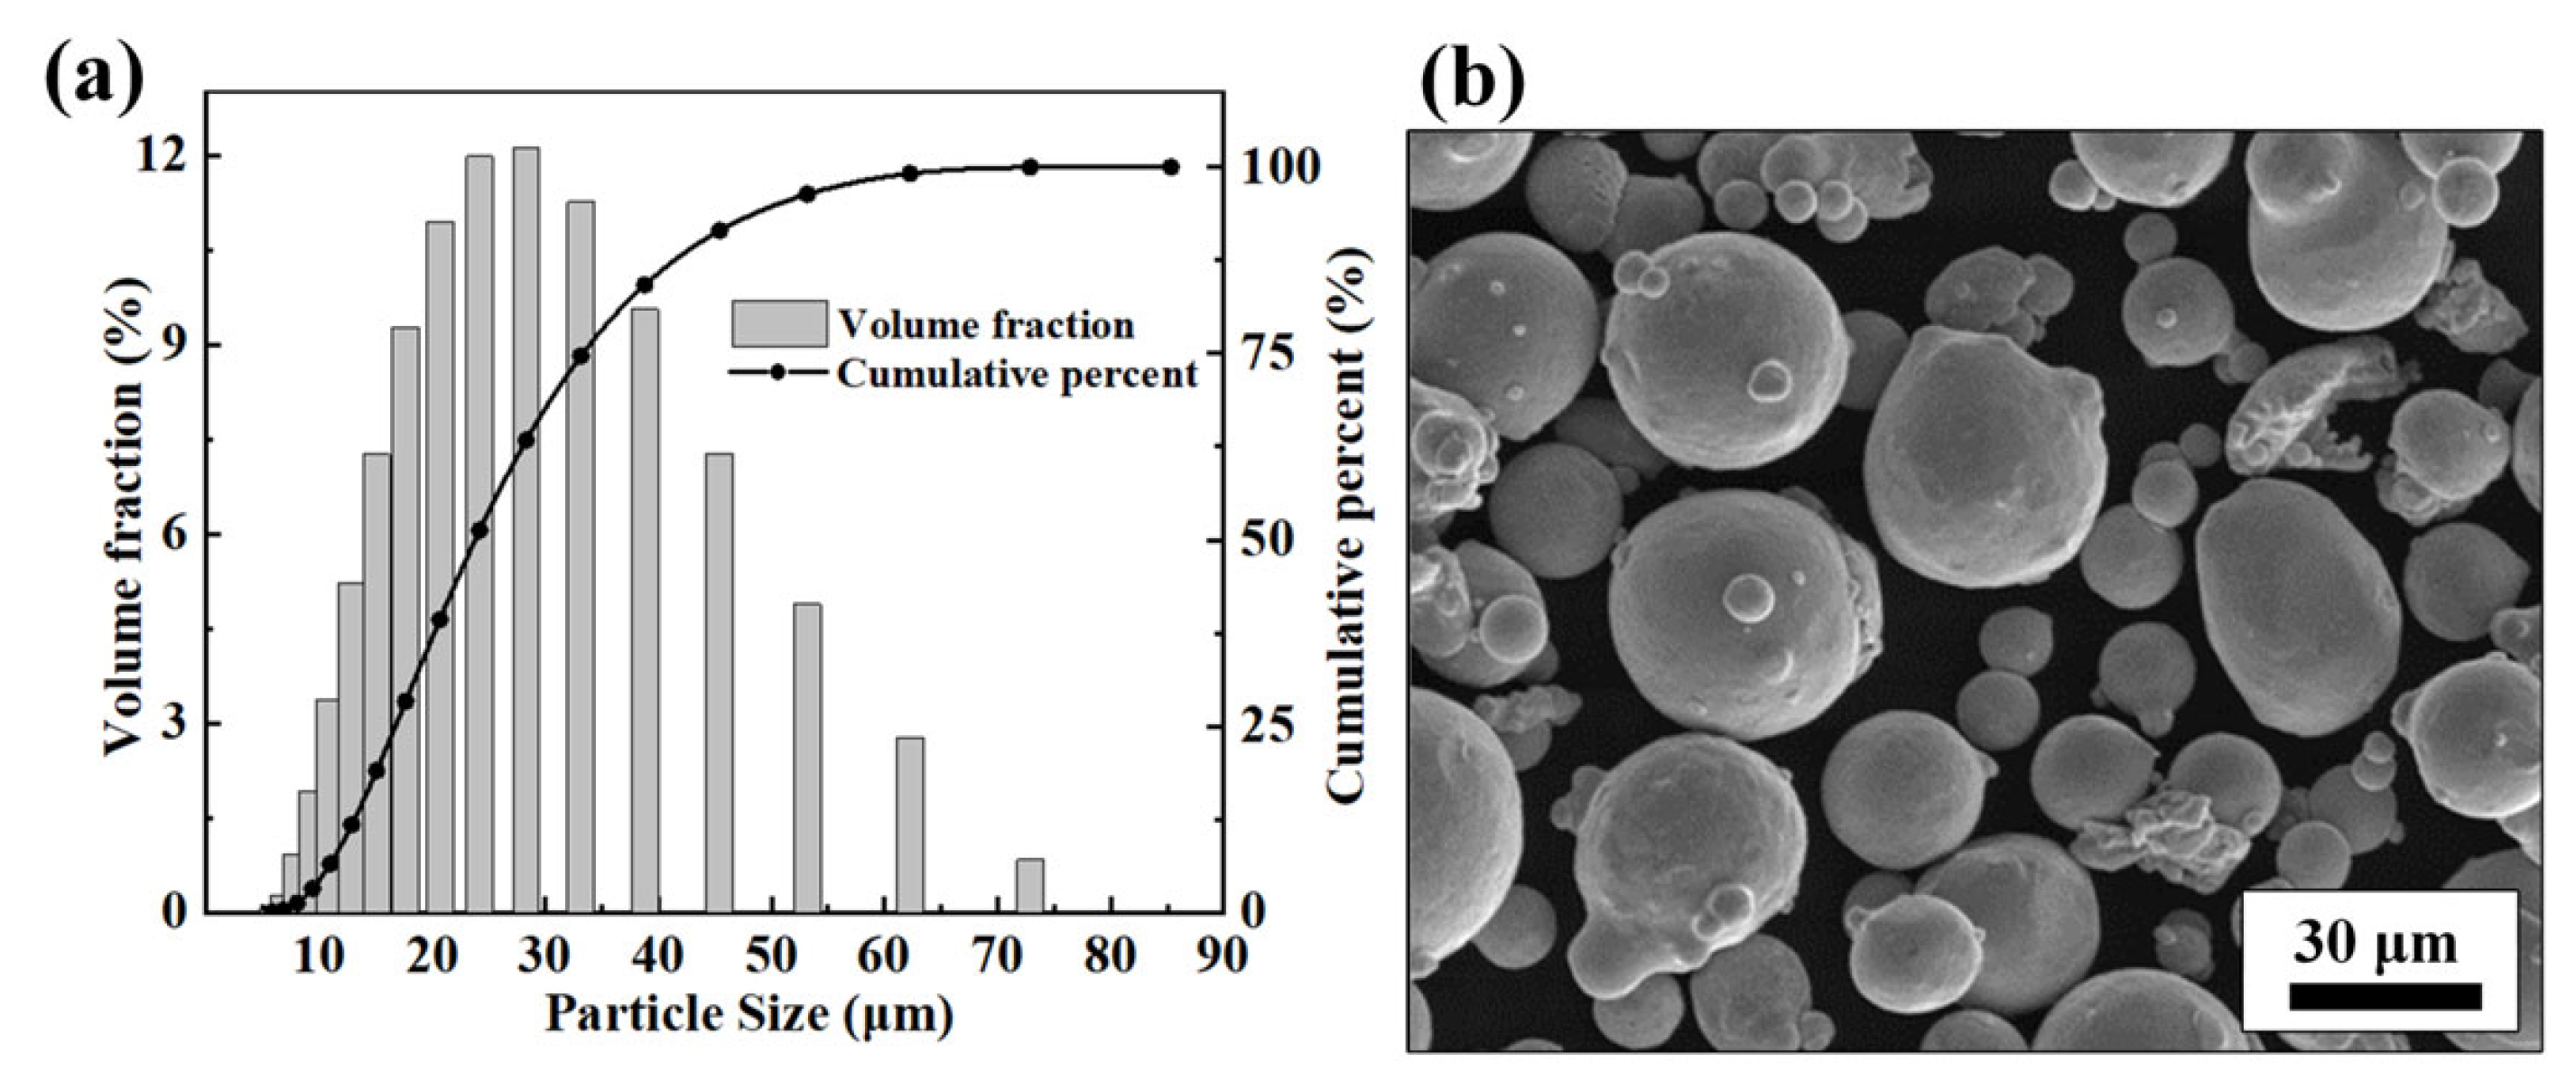
2.1. Materials and Sample Fabrication

The powder material used in this study was gas-atomized Cu-Cr-Zr alloy (Grinm Advanced Materials Co., Ltd., Beijing, China) with the chemical composition exhibited in Table 1. The size of the powders was measured using a laser particle size analyzer (Mastersizer 2000, Malvern Instruments Ltd., Malvern, UK), and the powder morphology was observed by a scanning electron microscope (SEM) with JSM-7800F, JEOL Ltd., Tokyo, Japan, as shown in Figure 1a,b, respectively. The particle size of this powder ranges from 15 μm to 53 μm, with the average size of 27 μm. As shown in Figure 1b, most particles exhibit a nearly spherical shape with few satellite particles around. The spherical morphology contributes to the excellent mobility and thus spreadability during LPBF.
All samples analyzed in this study were fabricated on a commercial LPBF machine XDM250 (Suzhou XDM 3D Printing Technology Co., Ltd., Suzhou, China), equipped with a 500 W single-mode ytterbium fiber laser. The mean diameter of the laser beam spot was 90 µm with Gaussian profile energy intensity distribution. In addition, a 67° rotation of scanning direction between every two consecutive layers with a raster scanning strategy in every single layer was employed. During the manufacturing process, the oxygen content in argon atmosphere was controlled below 700 ppm and the substrate temperature was maintained at 80 °C. After cutting off from the substrate, the samples were immersed into alcohol solution (95%) to wash off the powder residues adhered to the sample surface in an ultrasonic-cleaning machine. In the following tests and characterization, the typical morphology of the inclined surface was observed and pictured with Digital Microscope VHX-1000 (Keyence, Osaka, Japan). The digital vernier caliper was used to measure the sample size.

2.2. Methods

2.2.1. Density Optimization

Table 2 is the central composite design (CCD) experiment from the response surface method (RSM). The maximum density in the design matrix reached 99.25% (relative to 8.95 g/mm3) and the analysis of variance (ANOVA) results demonstrated that the density reached maximum value when the process parameters were 425 W laser power, 650 mm/s scanning speed, and 110 μm hatch distance and the validation results proved to be 8.883 g/cm3 (99.25% relative density). In this regard, the core parameter setting in the current work was selected.

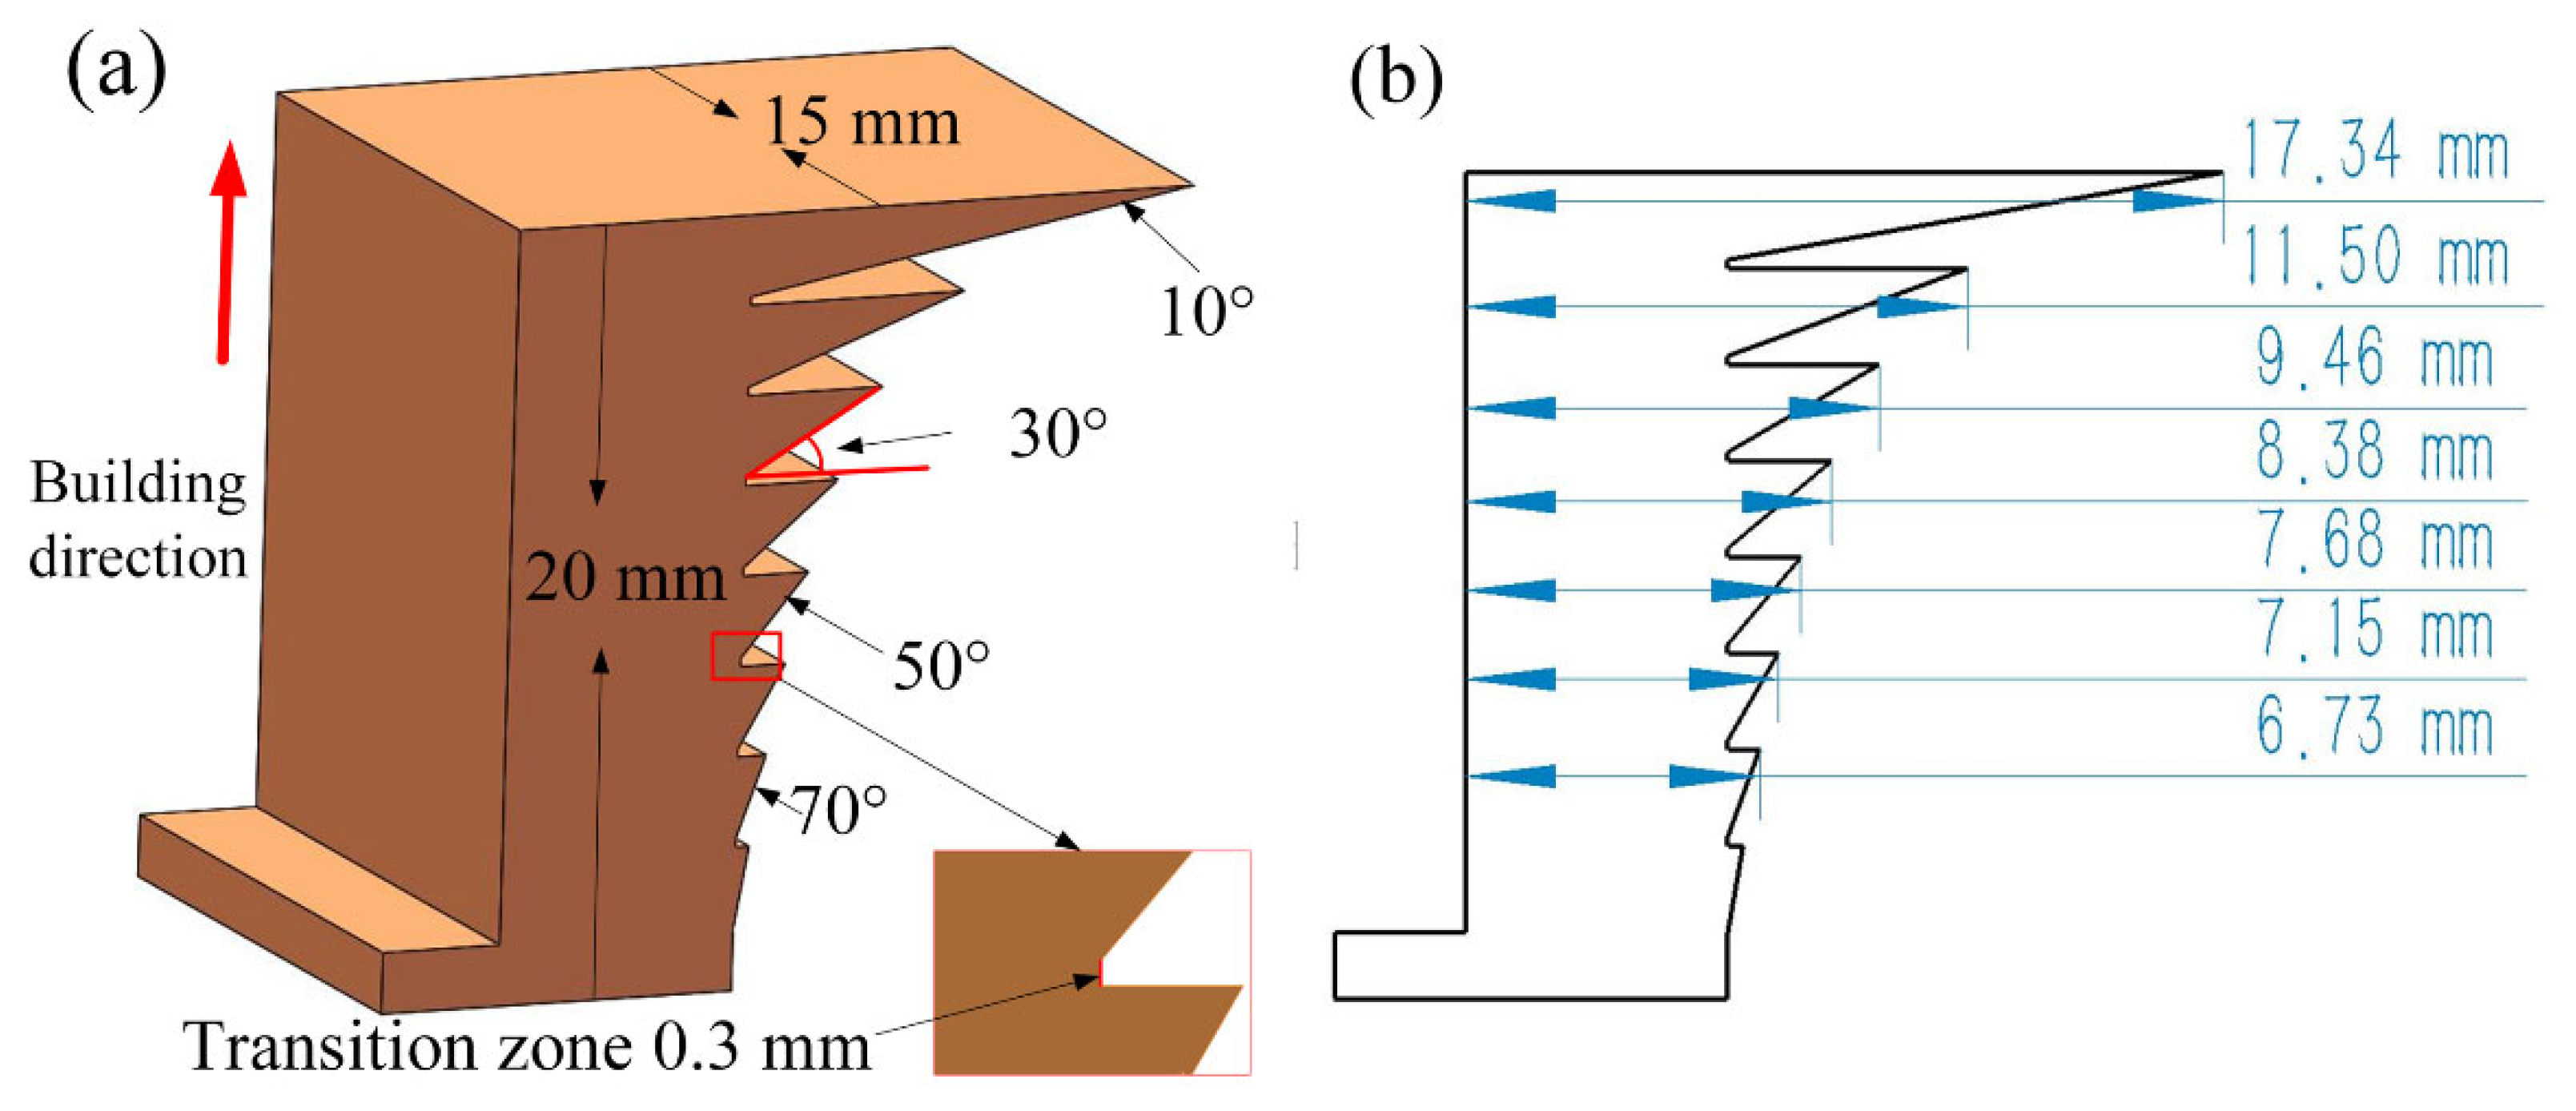
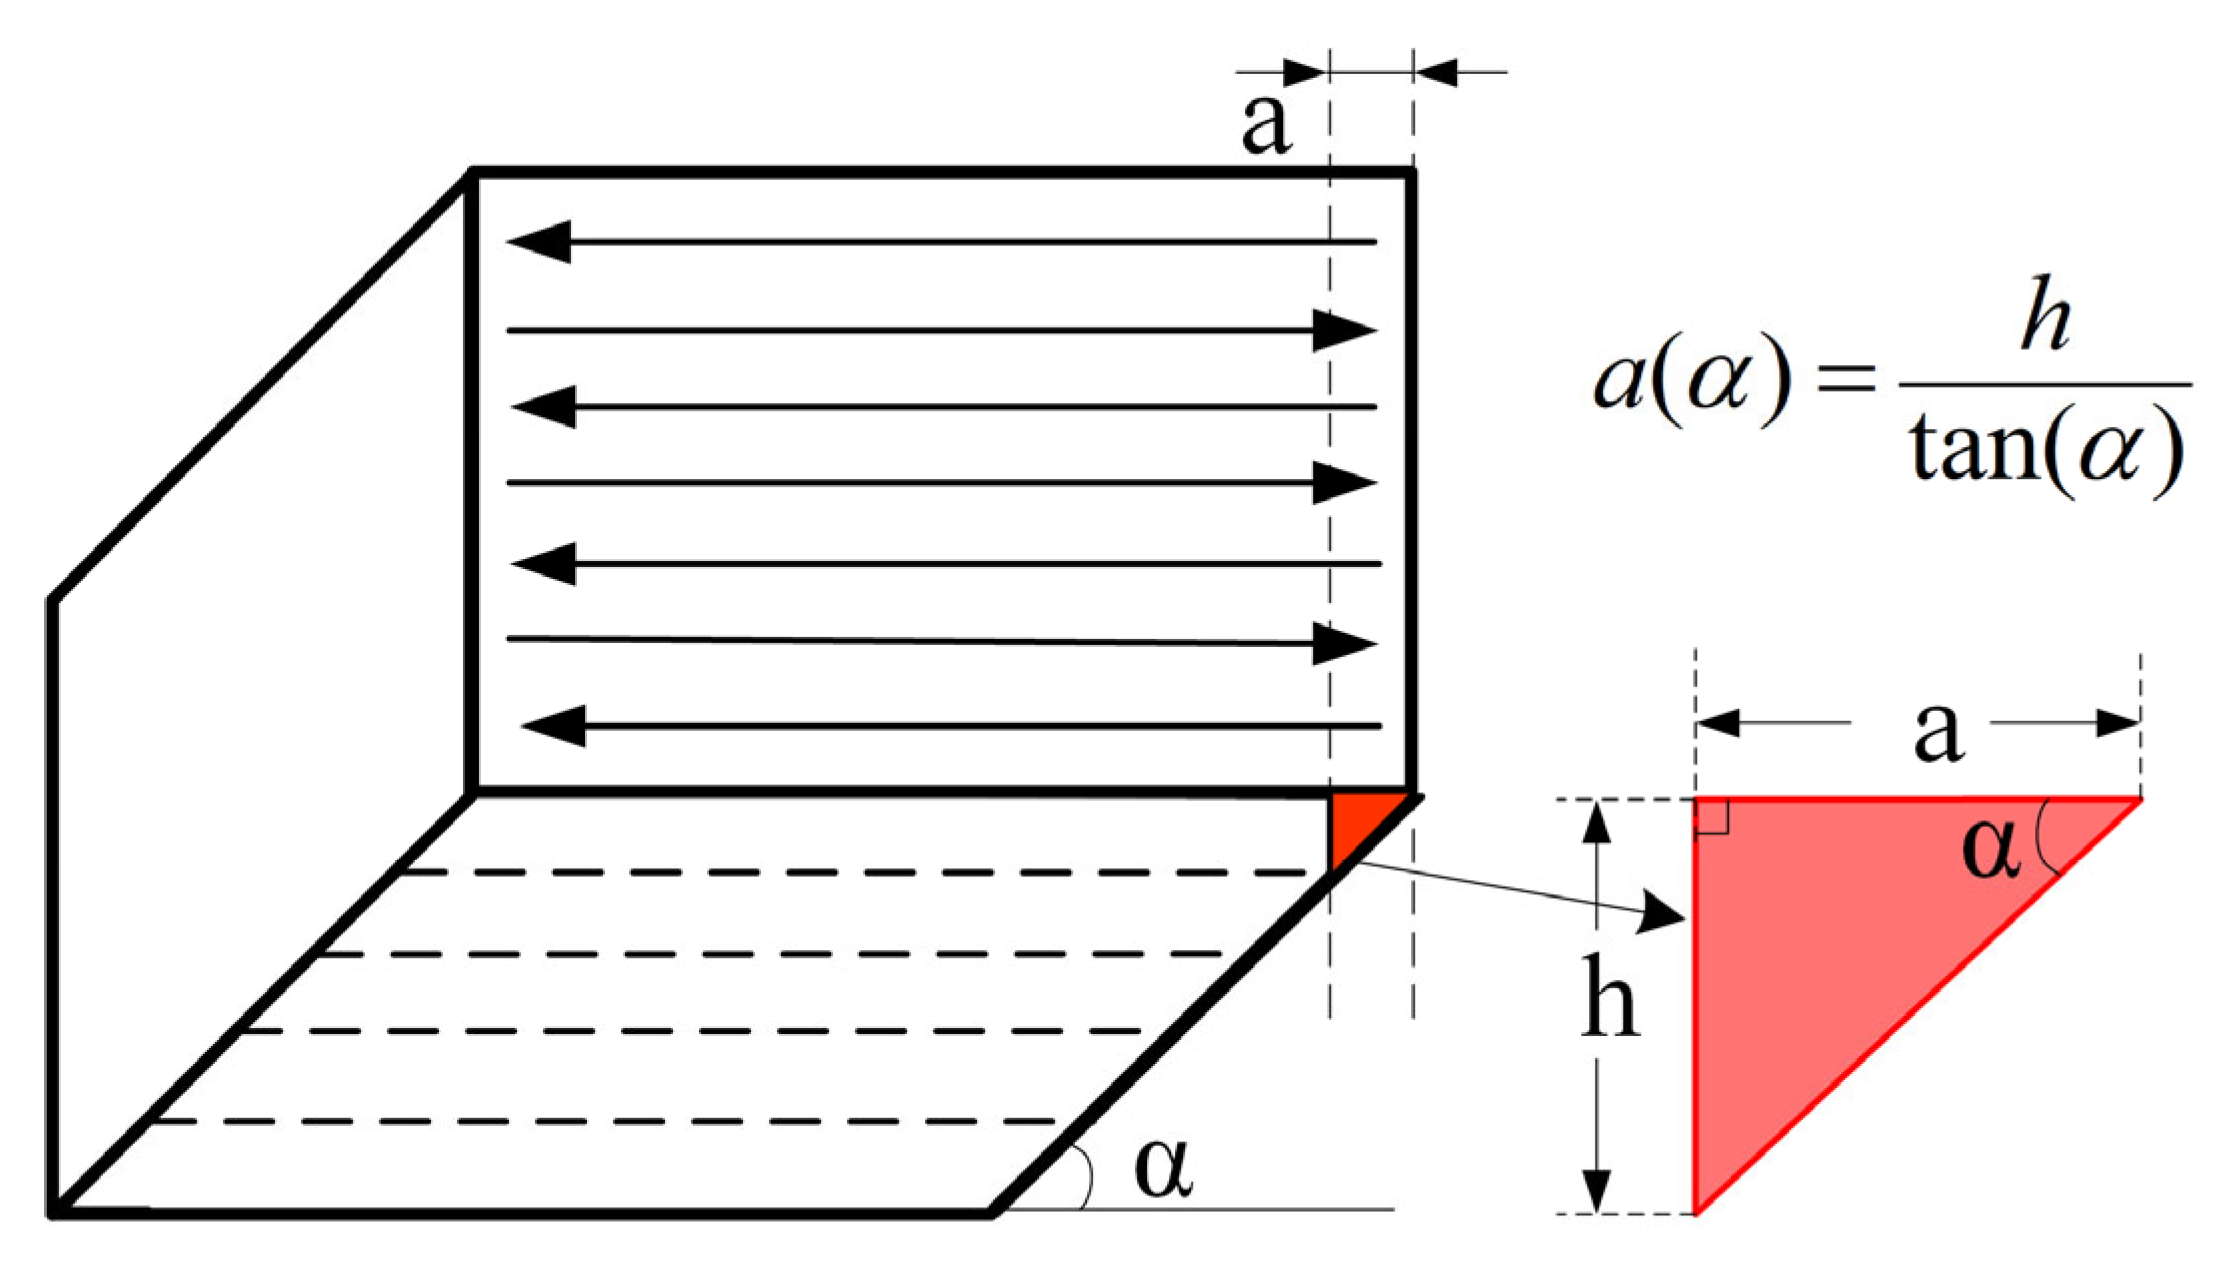
2.2.2. Schemata and Definition of Structure Angles

For convenient description, the inclined-angle α and azimuth-angle γ were defined as the slope degree and lying style of the sample in LPBF, respectively, as shown below:
γ = < Onp, Opf >;
α = < On, Ofex >;
where On is the normal vector of the inclined surface, Onp is the projection of On in the plane that is parallel to the build substrate, Opf is the vector parallel to the recoating direction, and Ofex is the vector perpendicular to the build substrate, as shown in Figure 2.
With the angle γ increasing from 0° to 180°, it is obvious that the inclined surface transforms from along to against the recoating direction. Similarly, the inclined surface gets steeper with α increasing in the range of 0° to 90°. In addition, because the similar forming environment of the inclined surfaces can be found when the degree of γ changes in the range 0–180° and 180–360°, only the azimuth-angle γ within 0–180° was considered when the forming experiments were designed.

2.2.3. Experiment and Sample Model Design

As described above, the sizes of γ and α affect the LPBF manufacturing. Therefore, a series of experiments were designed to investigate the influences of γ and α values on the forming performances of Cu-Zr-Cr alloy in LPBF. For γ, 0°, 45°, 90°, 135°, and 180° were considered. Under every situation of γ, the changes of α should be taken into account. A comprehensive model was designed in this paper for more effective investigation, as shown in Figure 3. The model possesses series of inclined angle structures: 20°, 30°, 40°, 50°, 60°, and 70°, and between each inclined structure, a 0.3 mm high transition zone was designed to avoid interaction of the adjacent inclined structures during their construction. In general, inclined structures with steeper slope are manufactured more easily. Therefore, the inclined surfaces of the model with larger α were designed at the lower part of the model, ensuring successful manufacturing of the model. In this regard, the total number of the experimental samples to investigate the effects of α angle on formability could be reduced to 10.
When manufactured, the models above were placed on the build platform in ways of 0°, 45°, 90°, 135°, and 180° sample-azimuth-angle(γ). In this condition, the Onp of the inclined surface was parallel to the recoating direction when γ was 0°.

3. Results and Discussion

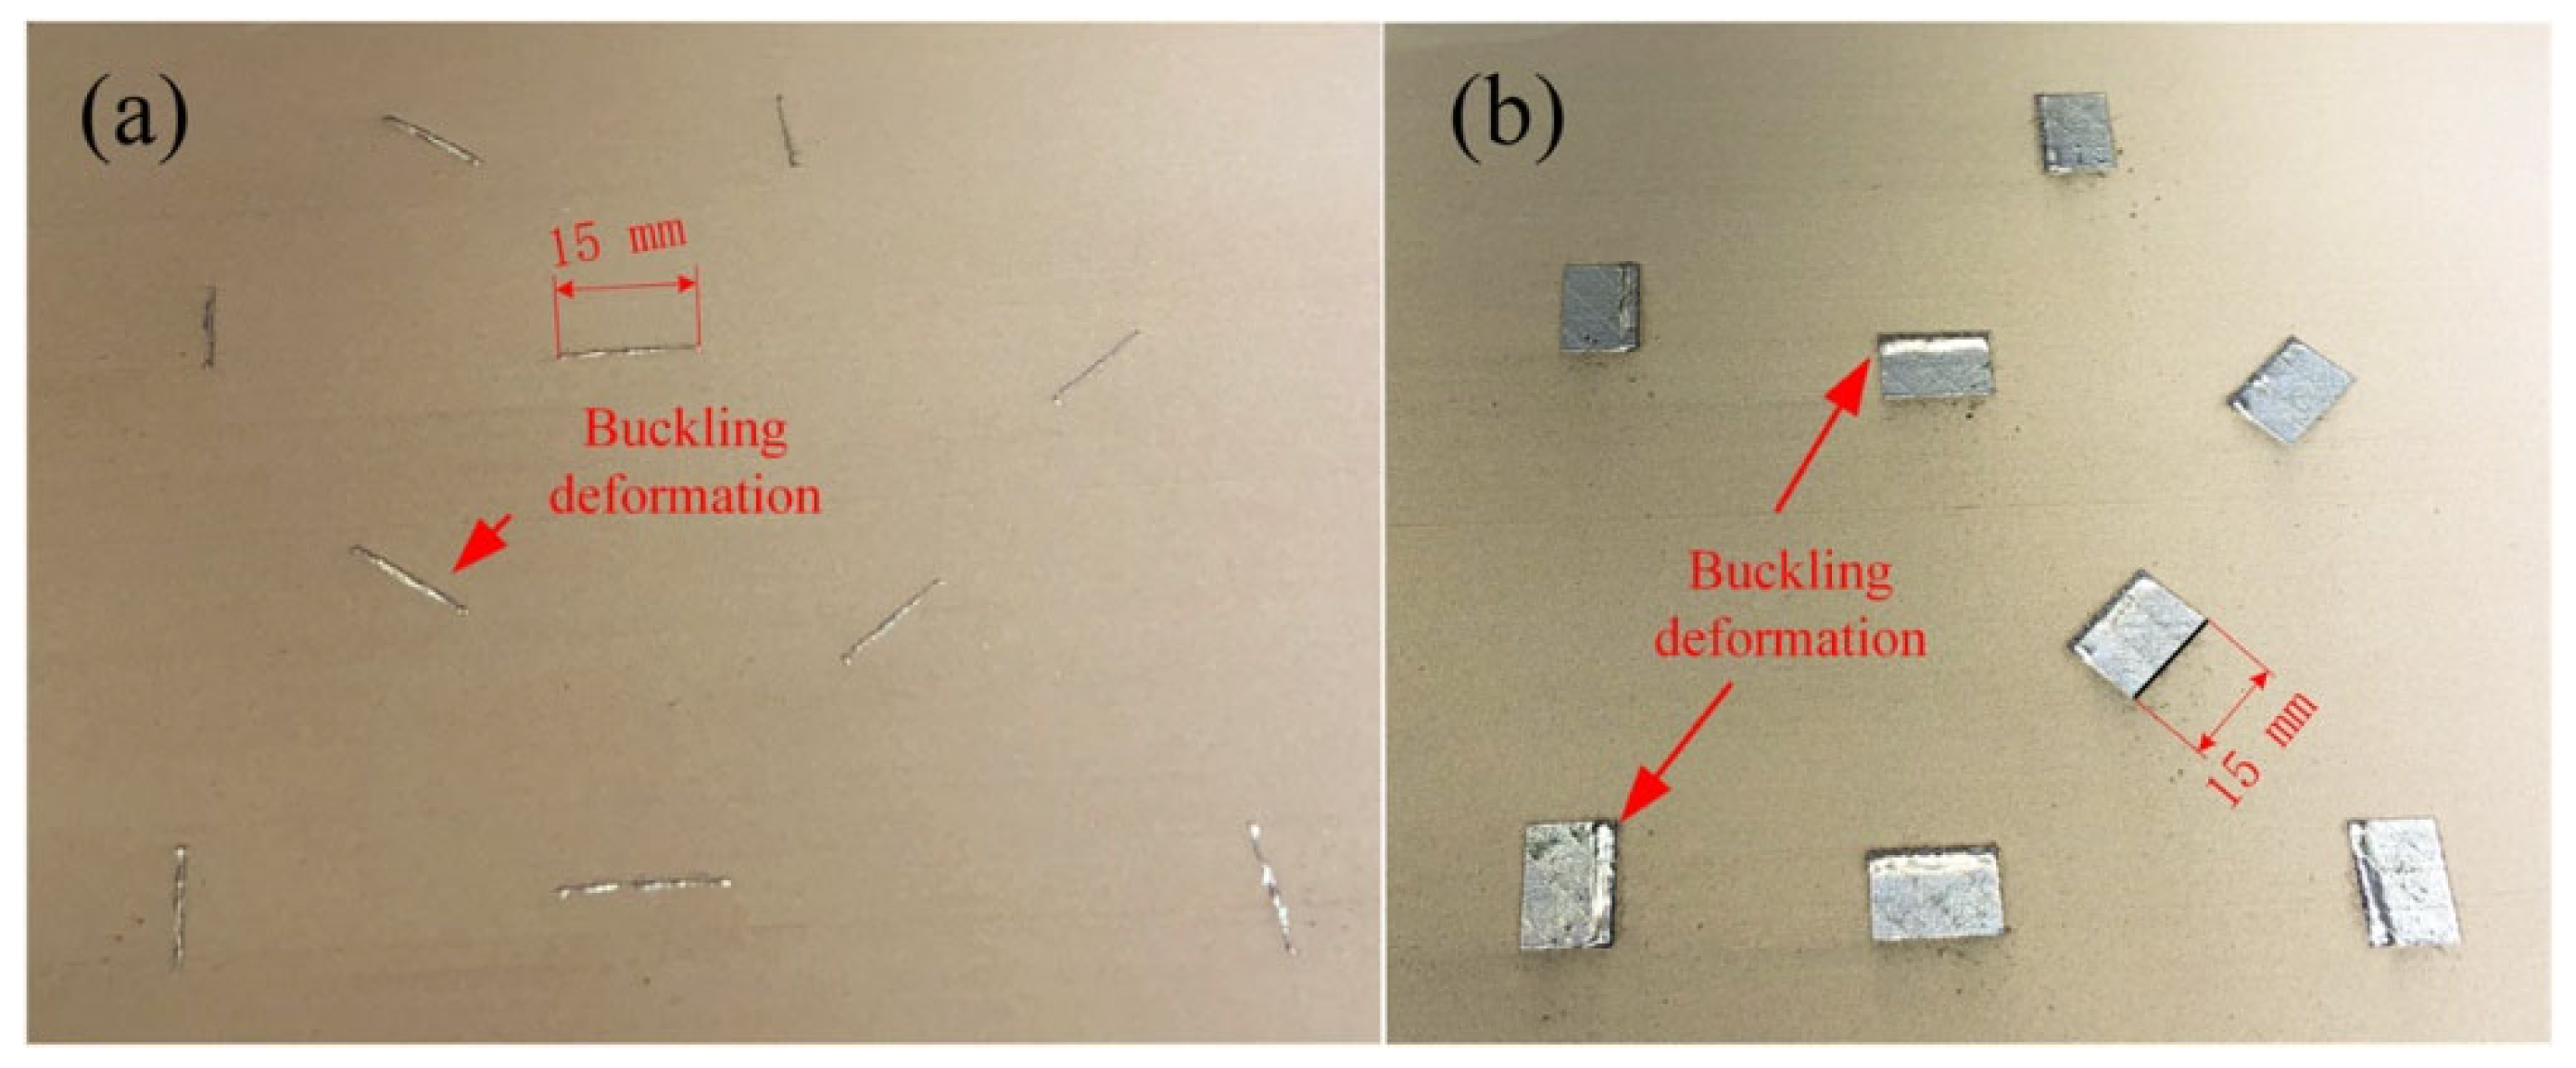
3.1. Marking Principles and Statistical Results

In this work, the fabrication results can be classified into four categories:
A.
Building process cannot continue due to severe deformation of the inclined surface structures, leading to the collision between the scraper and deformation zone of the sample. The corresponding structures above are marked “×” in Table 3.
B.
For the inclined structure that has a certain buckling deformation but can be reluctantly fabricated, the label “☐” was marked. In this situation, although there was some local deformation on the building plane of the sample, the recoating process can still proceed.
C.
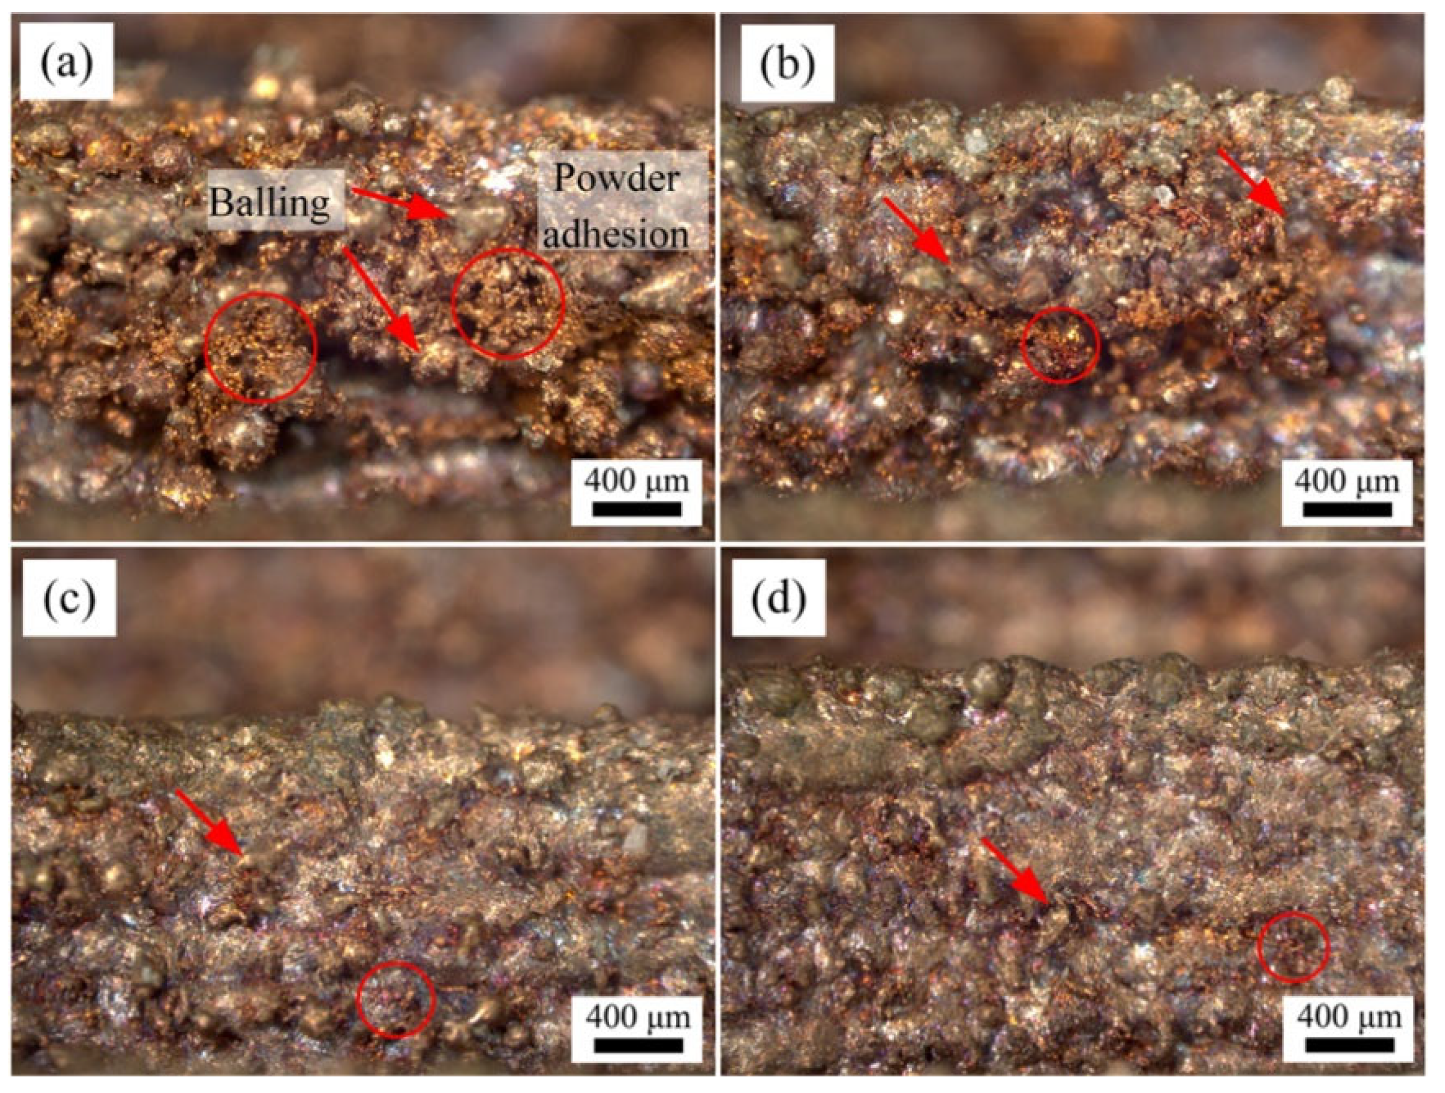
When the recoating quality gets worse with the forming process continuing, the structures are marked “○”, which are fabricated successfully without deformation while the slope surfaces of the structures are very rough and have many balling particles and heavily powder adhesion phenomena.
D.
For the structures that are successfully built without buckling deformation and have normal powder adhesion phenomenon, they are marked “√”.
The corresponding statistical results are presented in Table 2. It is obvious that the structures with α within the ranges of 50–80° were fabricated successfully without buckling deformation, while the structures with α less than 50° were fabricated either with varying degrees of buckling deformation and powder adhesion or in failure for severe distortion. For structures with 40° of α, they were all fabricated without buckling but possessed heavily powder adhesion, while for the structures with 20° or 30° of α, the buckling deformation of the structures varied with the differences of γ. During sample manufacturing, heavy distortion was observed in all the structures with α of 20° and the collision between the distortion zone of the samples against the scraper might cause a damage risk for the scraper. Therefore, fabrication of 10° structures were intentionally stopped and they were identified as failure by default. As presented in Figure 4, the edges of slope structures are not covered by the recoated powders (Figure 4a), which demonstrated that the structures with 30° of α generated a certain degree of distortion behaviors during fabrication. Heavy deformation can be intensified when the α of the slope structures decreased to 20°, as presented in Figure 4b.

3.2. The Inclined Angle α on the Forming Performance

To reveal the forming performance of the samples quantitatively, the dimension accurancy was determined by measuring the edge of the inclined surface to the vertical plane of the fabricated samples and then compared to their corresponding models, as shown in Figure 3b. The dimensions of the samples were measured, as shown in Table 4 above the “/” mark. In order to represent the influence of the α and γ on the forming performance clearly and intuitively, the differences (Ld) of the sample from the edge of inclined surface to the vertical plane between samples and corresponding models were calculated, which are listed in Table 4 below the “/” mark.
Figure 5 exhibits the histograms of Ld under different γ conditions. The Ld in Figure 5 is the average of the differences of structures with different α but the same γ. It is clear that the dimensions of the inclined structures are less than those of their corresponding models when the α is 20° and 30°, respectively. However, when the α is above or equal to 40°, the sizes of the inclined structures are greater than those of their models and the corresponding Ld increases with an increasing α value. In the end, the Ld remained at about 0.2 mm when the α was above 60°. It is worth mentioning that the existence of the differences between the forming size and the model size is reasonable before the LPBF machine is calibrated for a certain material. In this regard, as the difference becomes stable after 60°, we assume 0.2 mm to be a reasonable variable under the experimental condition in this work, and thus set it as the dimension accuracy standard in this work. According to the analysis above, it could be determined that the forming size is consistent with the model size in the condition of α ≥ 60°. Moreover, the differences between the forming size and model size tend to be bigger with a decreasing α value under the condition of α ≤ 40°, which is ended with the differences of 1 mm at α = 20°.
In general, the thermal conductivity of powders is less than their corresponding bulk materials. Hence it will cause excessive energy accumulation when using the normal process parameters, and thus defects such as bucking deformation, massive powder adhesion, and balling phenomena will be formed [40]. For inclined structures with different α, the powder surface area on which the laser scanned directly differs with varying α and so do the corresponding defects and degree of warping. Figure 6 shows the building schematic diagram of the inclined structures.
In the current scanned layer, the width of the forming area a(α) that is directly built on the powders can be described in Equation (3), where h is the thickness of the layers and α is the inclined angle. When defining the first and second derivative of α with respect to Equation (5), as shown in Equations (4) and (5), respectively, the value of a′(α) is constantly smaller than 0 while a″(α) is constantly greater than 0 with α varying from 0 to π/2, demonstrating that Equation (3) is a strictly monotonically decreasing concave function. Hence, an increasing trend of a(α) can be deduced with a decreasing α, which is in accordance with the change of Ld. Moreover, it is also intuitively inferred from Equation (3) that a(α) tends to be infinite when α is towards zero and tends to be zero when α is towards π/2.
a ( α ) = h tan ( α )
a ( α ) = ( csc ( α ) ) 2
a ( α ) = 2 sin ( α ) cos ( α )
Therefore, the forming environment of the edge of the inclined surface gets worse with a decreasing α and when γ = 0°, as shown in Figure 7, under which condition the balling phenomena, irregularity of melt line, and power adhesion would emerge and worsen. Comparing Figure 7a–d, the balling phenomena, irregularity of melt lines, and powder adhesion were alleviated with the α increasing from 30° (Figure 7a) to 60° (Figure 7d), which is in accordance with the analysis of the Figure 5 and Figure 6. Hence, it can be concluded that the inclined angle α has a significant influence on the surface quality of the inclined structures and the forming surface quality is worse for the surfaces with smaller α. In addition, the defects above would interact with the scraper during recoating course and cause bigger differences between the forming sample and model dimension, which will be discussed in detail in Section 3.3. While under the conditions of larger α, the a(α) area is narrower and the forming environments are similar to those of the core zone, resulting in smaller dimension differences, as shown in Figure 7d.
Figure 8 shows the histograms of the differences between the highest and the lowest point of the inclined surfaces with different α degrees, which were extracted from the topography contrast images of Figure 7. The histograms can quantitatively show the morphology differences of the surface with different α degree through the local height differences. The local maximum height differences increase with the decreasing inclined angle α and the increasing trend tends to be bigger in smaller α condition. Specifically, the maximum height difference (723 μm) occurred on the inclined surface of 30° and is three times higher than that of the 60° inclined surface (208 μm), while the local height differences of α = 50° surface is 243 μm which is only higher than that of α = 60° inclined surface by 33 μm.

3.3. The Azimuth Angle γ on the Forming Performance

Figure 9 shows the behaviors of Ld with the variation of sample azimuth-angle γ. It can be found that the value of Ld slightly varied with the azimuth-angle γ for the inclined structures with the same α degree. For the inclined structures with α = 60°/70°, the Ld maintains at roughly 0.2 mm, namely the forming sizes are almost the same as the model sizes. However, for the inclined structures with α ≤ 50°, the forming sizes of them are smaller than those of the corresponding models in varying degrees and their Ld generally increases with an increased γ value from 0° to 180°.
In addition, a negative correlation between the initial buckling deformation and inclined angle α can be determined from Figure 9. Above all, it can be concluded that the azimuth-angle γ has an apparent influence on the forming performance when α < 50°, and a slight influence when α  50°. On the one hand, during LPBF fabrication, the issues of the interaction between the scraper and the sintered area cannot be ignored, especially for the inclined or similar inclined structures. As described above, the edges of the inclined surfaces were not well fabricated because of the energy accumulation resulting from the poor thermal conductivity of the Cu alloy powder compared with the solid parts, which causes defects such as balling, powder adhesion and buckling deformation (Figure 7). On the other hand, with α = 60°/70°, the area a(α) is so small and so are corresponding defects that the initial defects are fewer. Therefore, the interaction of the scraper and the defects of the inclined structures with bigger α was gentle relative to that of smaller α.
Figure 10 shows the schematics of the interaction between the scraper and the edges of the inclined surface structures during the recoating process in LPBF. In Figure 10b, when the γ is in the ranges of 90° to 180°, the initial buckling deformation gets worse. In this situation, the force F2, generated from the collision between the scraper and the sintered part during the recoating process, is perpendicular to the deformed surface up, which deteriorates the initial deformation, while for the inclined surfaces with γ in the ranges of 0° to 90°, as shown in Figure 10a, the force F1 is perpendicular to the deformed surface down and will restrain the initial buckling deformation resulting in the alleviation of the buckling deformation. In this regard, the increase of the Ld with the γ increasing from 0° to 180° can be well explained.
It is worth mentioning that although using Ld to evaluate the buckling deformation of the samples is not outstanding, the corresponding buckling deformation is remarkable. As shown in Figure 11, it is clear that with the same α, warping effects are more serious on the top surface of the samples in γ = 180° (Figure 11a) than the samples in γ = 90°, 45°, 0°. For the samples in γ = 180°, the whole edge of the top surface warps relative to the forming plane up. When the γ = 90°, warping is alleviated, while for the samples in γ < 90°, only the corner of the edge of the top surface slightly warps.

4. Conclusions

In this work, the influences of the azimuth-angle γ and the inclined-angle α on the formability of Cu-Cr-Zr alloy produced by laser powder bed fusion have been systematically studied and the following conclusions are summarized:
(1)
The forming statistical results demonstrate that the inclined structures with α > 50° were fabricated successfully without buckling deformation, while those α < 50° were fabricated either with varying degrees of buckling deformation and powder adhesion or in failure as severe distortion. Under the current process parameters, the equipment dimension compensation is around 0.2 mm larger than the model size.
(2)
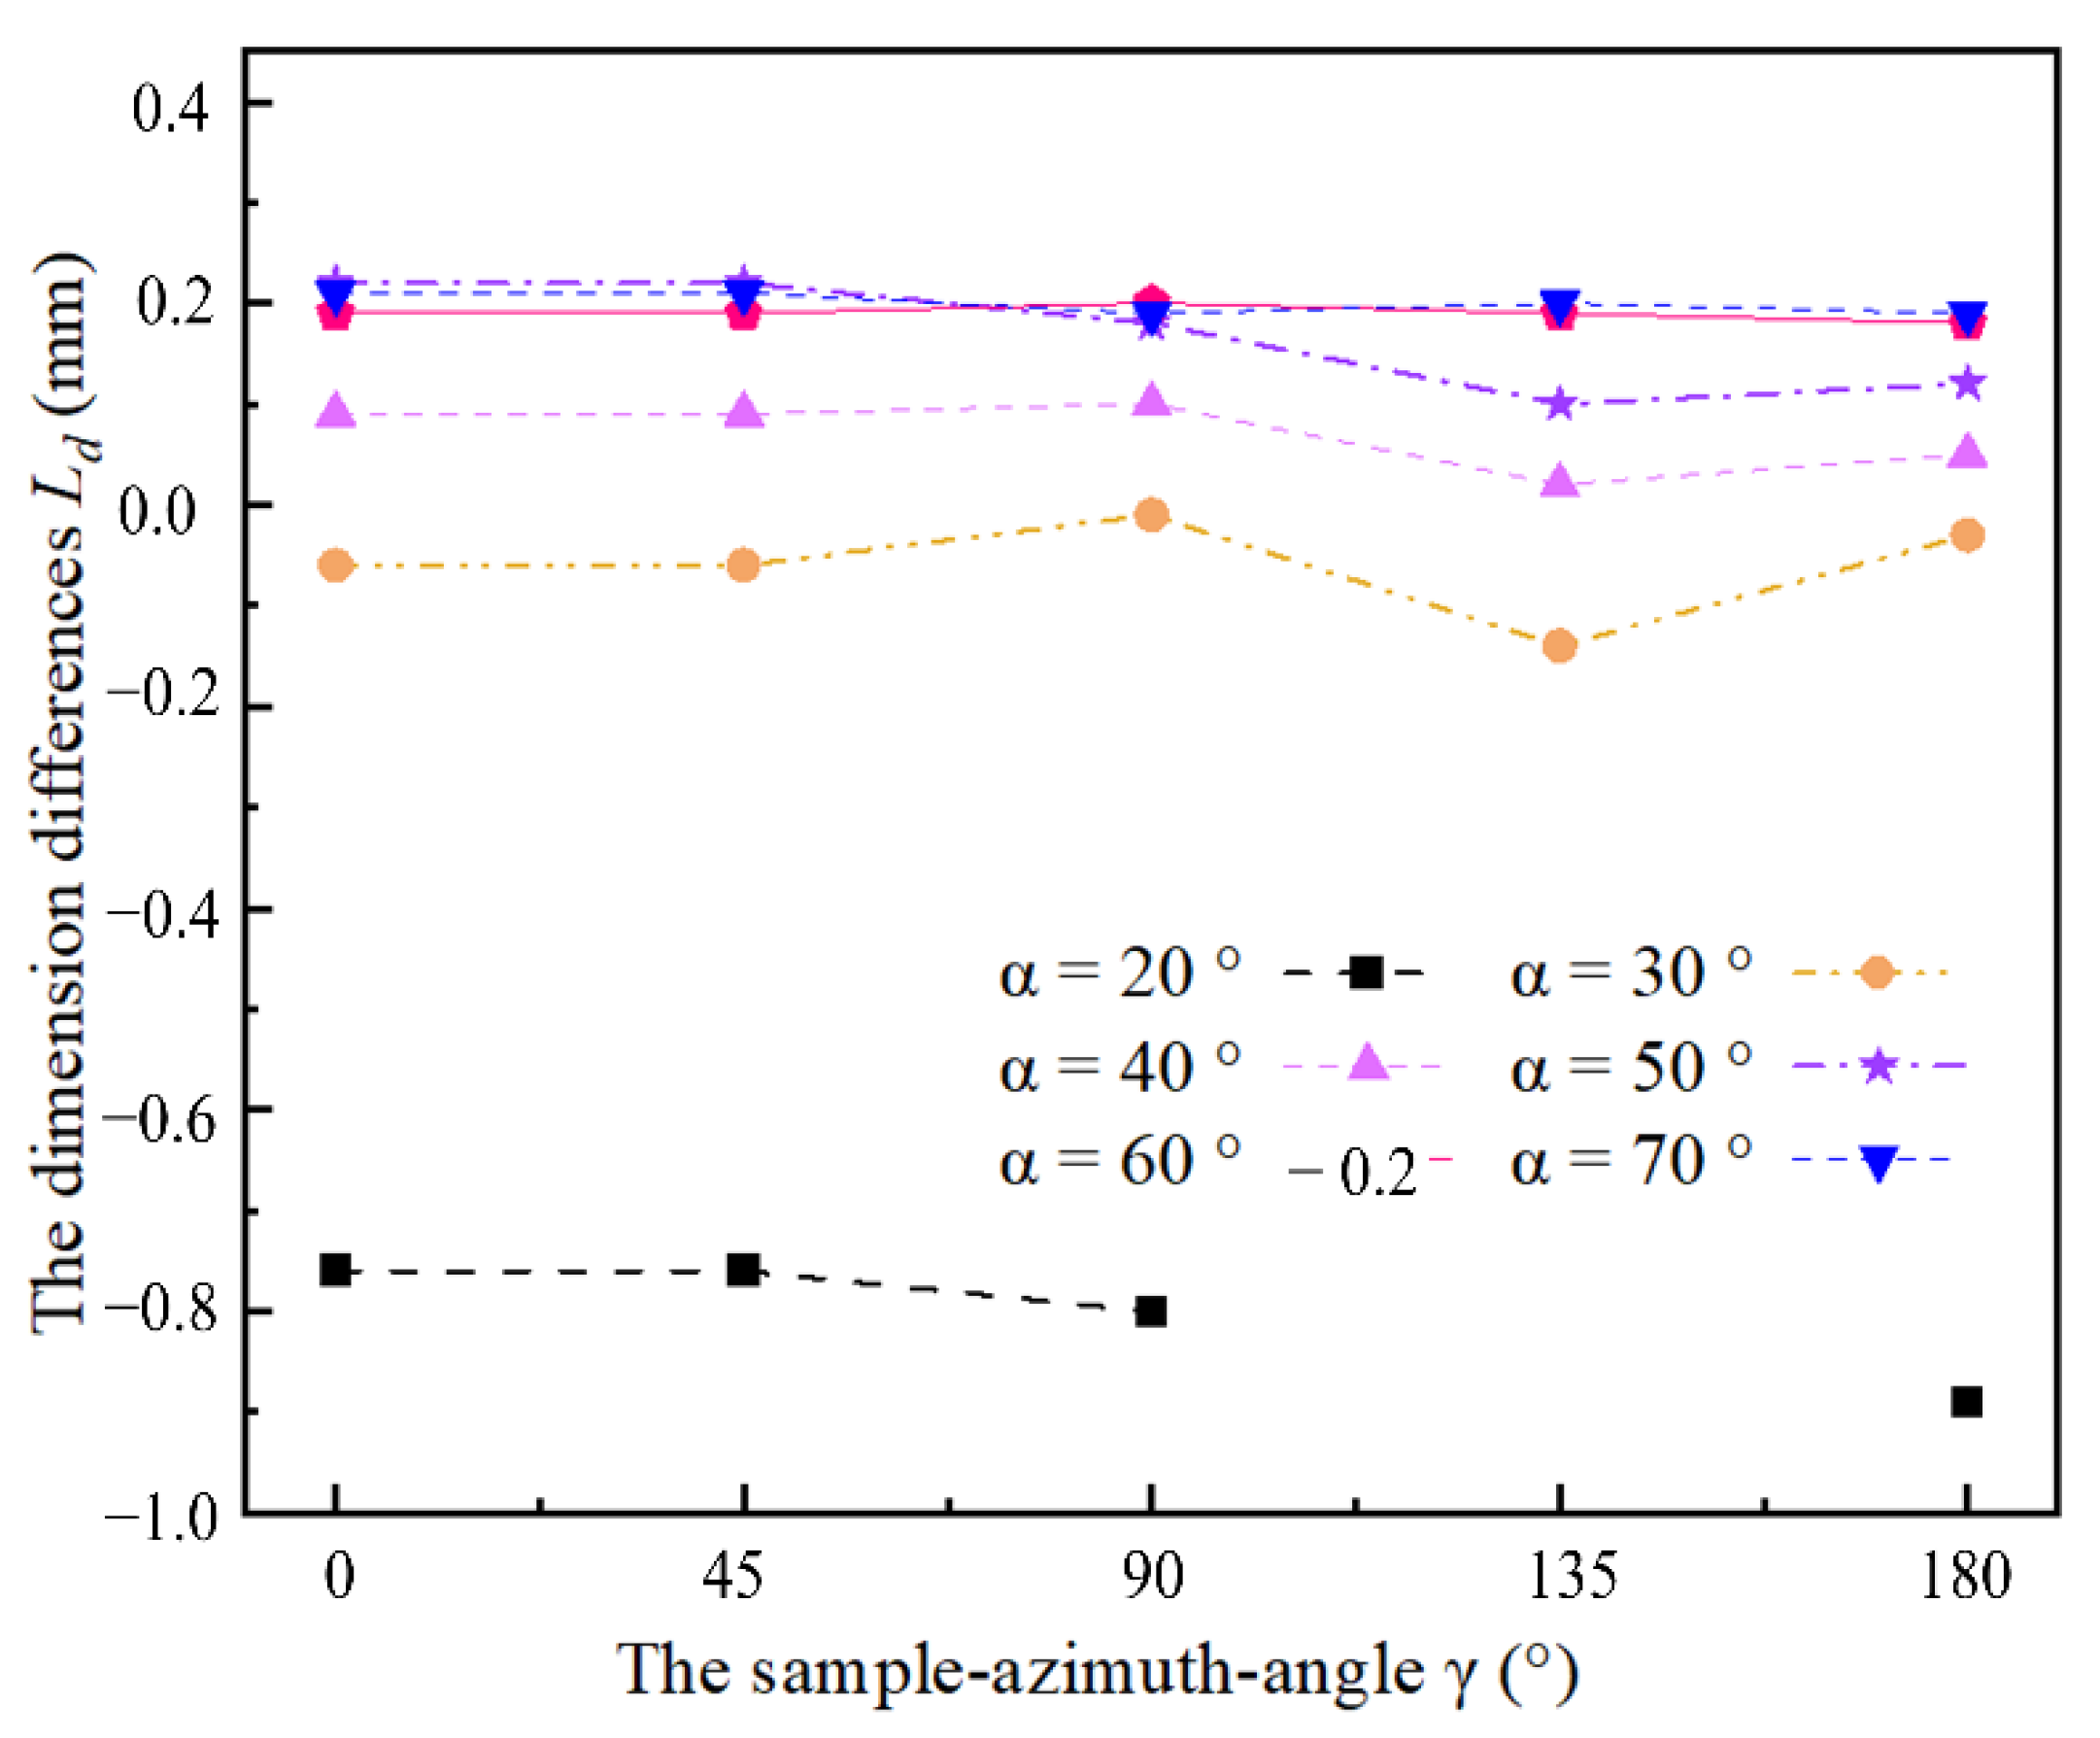
The dimensions of the inclined structures are less than those of their corresponding models when α < 50° and are roughly equal to the models when the α > 50°. Further, the differences (Ld) increase with a decreasing α, which reaches 0.3 mm when α is 30° and drastically increases to 1 mm when α is 20° for the interaction between the scraper and the serious deformation.
(3)
Defects, such as balling phenomena, irregularity of melt lines, and powder adhesion, deteriorated with a decreasing α. The maximum height differences between the highest point to the lowest point reach 723 μm when the α is 20°, which drastically reduces to around 200 μm when the α increases to above 50°.
(4)
For the CuCrZr alloy, the azimuth-angle γ has a significant influence on the forming performance when α < 50° and a very slight influence when α  50°. The differences Ld generally increases with the increasing γ value from 0° to 180° with α < 50°. These phenomena mainly result from the interaction between the scraper and the severe deformation of the edges of the inclined surface.
(5)
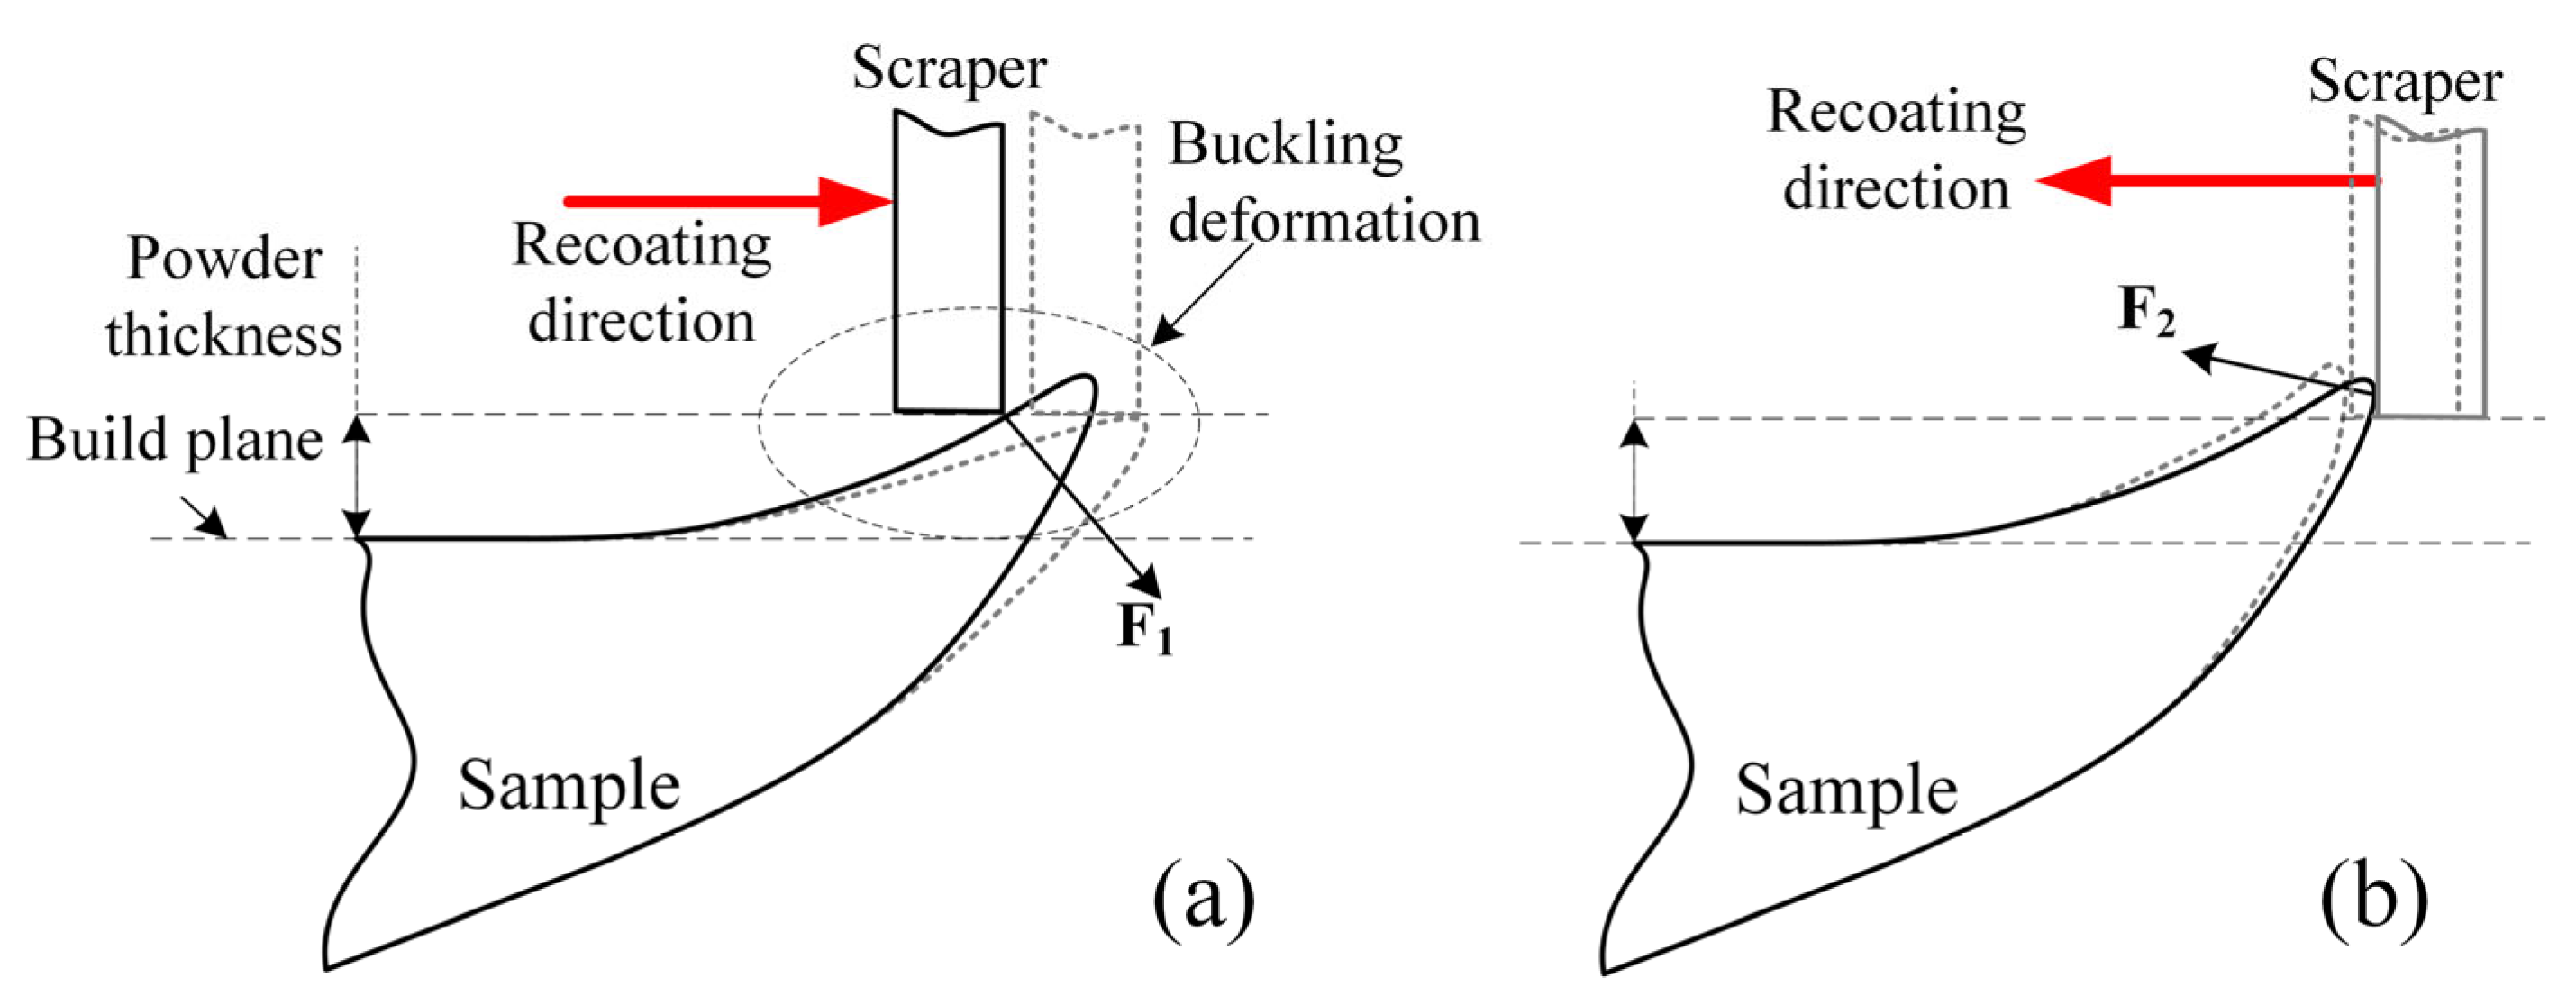
For the parts that possess inclined structures, they are recommended to be placed on the build substrate along with the recoating direction to avoid interaction between the scraper and the severe deformation of the edges of the inclined surface. In addition, for the Cu-Cr-Zr structures with inclined angle α < 50°, support structures are recommended to assist the structures fabrication to avoid bucking deformation

Author Contributions

Z.M. and J.H.R. wrote the paper; Z.M., S.Z. and X.G. designed and performed the experiments; Z.M., C.G. and X.X. analyzed the data; Y.B. provided the facilities and scientific consultation. All authors have read and agreed to the published version of the manuscript.

Funding

This research was funded by Jihua Laboratory “Development of additive manufactured core process and special equipment for key parts of aero-engines”, grant number X190351TM190.

Institutional Review Board Statement

Not applicable.

Informed Consent Statement

Not applicable.

Acknowledgments

The authors acknowledge the facilities, scientific, and technical assistance of Institute of Advanced Additive Manufacturing of Jihua Laboratory, Foshan Municipal Government and Guangdong Provincial Government and acknowledge the Basic and Applied Basic Research Foundation of Guangdong Province (No. 2022A1515011597).

Conflicts of Interest

The authors declare no conflict of interest.

References

  1. Read, N.; Wang, W.; Essa, K.; Attallah, M.M. Selective laser melting of AlSi10Mg alloy: Process optimisation and mechanical properties development. Mater. Des. 2015, 65, 417–424. [Google Scholar] [CrossRef] [Green Version]
  2. Liu, Y.J.; Liu, Z.; Jiang, Y.; Wang, G.W.; Yang, Y.; Zhang, L.C. Gradient in microstructure and mechanical property of selective laser melted AlSi10Mg. J. Alloy. Compd. 2018, 735, 1414–1421. [Google Scholar] [CrossRef]
  3. Yu, W.; Sing, S.L.; Chua, C.K.; Tian, X. Influence of re-melting on surface roughness and porosity of AlSi10Mg parts fabricated by selective laser melting. J. Alloy. Compd. 2019, 792, 574–581. [Google Scholar] [CrossRef]
  4. Zhao, L.; Song, L.; Macías, J.G.S.; Zhu, Y.; Huang, M.; Simar, A.; Li, Z. Review on the correlation between microstructure and mechanical performance for laser powder bed fusion AlSi10Mg. Addit. Manuf. 2022, 56, 102914. [Google Scholar] [CrossRef]
  5. Rometsch, P.A.; Zhu, Y.; Wu, X.; Huang, A. Review of high-strength aluminium alloys for additive manufacturing by laser powder bed fusion. Mater. Des. 2022, 219, 110779. [Google Scholar] [CrossRef]
  6. Miranda, G.; Faria, S.; Bartolomeu, F.; Pinto, E.; Madeira, S.; Mateus, A.; Carreira, P.; Alves, N.; Silva, F.S.; Carvalho, O. Predictive models for physical and mechanical properties of 316L stainless steel produced by selective laser melting. Mater. Sci. Eng. A-Struct. Mater. Prop. Microstruct. Process. 2016, 657, 43–56. [Google Scholar] [CrossRef]
  7. Liverani, E.; Toschi, S.; Ceschini, L.; Fortunato, A. Effect of selective laser melting (SLM) process parameters on microstructure and mechanical properties of 316L austenitic stainless steel. J. Mater. Process. Technol. 2017, 249, 255–263. [Google Scholar] [CrossRef]
  8. Jeon, J.M.; Park, J.M.; Yu, J.-H.; Kim, J.G.; Seong, Y.; Park, S.H.; Kim, H.S. Effects of microstructure and internal defects on mechanical anisotropy and asymmetry of selective laser-melted 316L austenitic stainless steel. Mater. Sci. Eng. A-Struct. Mater. Prop. Microstruct. Process. 2019, 763, 138152. [Google Scholar] [CrossRef]
  9. Mao, S.; Zhang, D.Z.; Ren, Z.; Fu, G.; Ma, X. Effects of process parameters on interfacial characterization and mechanical properties of 316L/CuCrZr functionally graded material by selective laser melting. J. Alloy. Compd. 2022, 899, 163256. [Google Scholar] [CrossRef]
  10. Linares, J.M.; Chaves-Jacob, J.; Lopez, Q.; Sprauel, J.M. Fatigue life optimization for 17-4Ph steel produced by selective laser melting. Rapid Prototyp. J. 2022. ahead of print. [Google Scholar] [CrossRef]
  11. Zhang, D.; Niu, W.; Cao, X.; Liu, Z. Effect of standard heat treatment on the microstructure and mechanical properties of selective laser melting manufactured Inconel 718 superalloy. Mater. Sci. Eng. A-Struct. Mater. Prop. Microstruct. Process. 2015, 644, 32–40. [Google Scholar] [CrossRef]
  12. Macoretta, G.; Monelli, B.D. SLM process parameters effects on the fatigue strength of AMed Inconel 718. In Proceedings of the 4th International Conference on Structural Integrity (ICSI), Electr Network, Online, 30 August 2021; pp. 632–643. [Google Scholar]
  13. Leary, M.; Mazur, M.; Williams, H.; Yang, E.; Alghamdi, A.; Lozanovski, B.; Zhang, X.Z.; Shidid, D.; Farahbod-Sternahl, L.; Witt, G.; et al. Inconel 625 lattice structures manufactured by selective laser melting (SLM): Mechanical properties, deformation and failure modes. Mater. Des. 2018, 157, 179–199. [Google Scholar] [CrossRef]
  14. Ding, Y.T.; Wang, H.; Xu, J.Y.; Hu, Y.; Zhang, D. Evolution of Microstructure and Properties of SLM Formed Inconel 738 Alloy During Stress Relief Annealing. Rare Met. Mater. Eng. 2020, 49, 4311–4320. [Google Scholar]
  15. Nadammal, N.; Cabeza, S.; Mishurova, T.; Thiede, T.; Kromm, A.; Seyfert, C.; Farahbod, L.; Haberland, C.; Schneider, J.A.; Portella, P.D.; et al. Effect of hatch length on the development of microstructure, texture and residual stresses in selective laser melted superalloy Inconel 718. Mater. Des. 2017, 134, 139–150. [Google Scholar] [CrossRef]
  16. Murray, T.; Thomas, S.; Wu, Y.; Neil, W.; Hutchinson, C. Selective laser melting of nickel aluminium bronze. Addit. Manuf. 2020, 33, 101122. [Google Scholar] [CrossRef]
  17. Zhang, S.S.; Zhu, H.H.; Hu, Z.H.; Zeng, X.Y.; Zhong, F. Selective Laser Melting of Cu 10Zn alloy powder using high laser power. Powder Technol. 2019, 342, 613–620. [Google Scholar] [CrossRef]
  18. Samei, J.; Amirmaleki, M.; Ventura, A.P.; Pawlikowski, G.T.; Bayes, M.; Misiolek, W.Z.; Wilkinson, D.S. In-situ X-ray tomography analysis of the evolution of pores during deformation of a Cu-Sn alloy fabricated by selective laser melting. Addit. Manuf. 2020, 34, 101196. [Google Scholar] [CrossRef]
  19. Karthik, G.M.; Sathiyamoorthi, P.; Zargaran, A.; Park, J.M.; Asghari-Rad, P.; Son, S.; Park, S.H.; Kim, H.S. Novel precipitation and enhanced tensile properties in selective laser melted Cu-Sn alloy. Materialia 2020, 13, 100861. [Google Scholar] [CrossRef]
  20. Sharabian, E.; Leary, M.; Fraser, D.; Gulizia, S. Electron beam powder bed fusion of copper components: A review of mechanical properties and research opportunities. Int. J. Adv. Manuf. Technol. 2022, 122, 513–532. [Google Scholar] [CrossRef]
  21. Tang, Y.; Loh, H.T.; Wong, Y.S.; Fuh, J.Y.H.; Lu, L.; Wang, X. Direct laser sintering of a copper-based alloy for creating three-dimensional metal parts. J. Mater. Process. Technol. 2003, 140, 368–372. [Google Scholar] [CrossRef]
  22. Zhu, H.H.; Lu, L.; Fuh, J.Y.H. Development and characterisation of direct laser sintering Cu-based metal powder. J. Mater. Process. Technol. 2003, 140, 314–317. [Google Scholar] [CrossRef]
  23. Kang, N.; Coddet, P.; Liao, H.L.; Coddet, C. Cold gas dynamic spraying of a novel micro-alloyed copper: Microstructure, mechanical properties. J. Alloy. Compd. 2016, 686, 399–406. [Google Scholar] [CrossRef]
  24. Kang, N.; Coddet, P.; Liao, H.L.; Coddet, C. The effect of heat treatment on microstructure and tensile properties of cold spray Zr base metal glass/Cu composite. Surf. Coat. Technol. 2015, 280, 64–71. [Google Scholar] [CrossRef]
  25. Salvan, C.; Briottet, L.; Baffie, T.; Guetaz, L.; Flament, C. CuCrZr alloy produced by laser powder bed fusion: Microstructure, nanoscale strengthening mechanisms, electrical and mechanical properties. Mater. Sci. Eng. A-Struct. Mater. Prop. Microstruct. Process. 2021, 826, 141915. [Google Scholar] [CrossRef]
  26. Li, J.; Kuai, Z.; Li, Z.; Liu, B.; Chen, Y.; Lu, S.; Nie, Y.; Yang, Z. Effects of Process Parameters on the Relative Density and Properties of CuCrZr Alloy Produced by Selective Laser Melting. Metals 2022, 12, 701. [Google Scholar] [CrossRef]
  27. Hu, Z.; Du, Z.; Yang, Z.; Yu, L.; Ma, Z. Preparation of Cu–Cr–Zr alloy by selective laser melting: Role of scanning parameters on densification, microstructure and mechanical properties. Mater. Sci. Eng. A-Struct. Mater. Prop. Microstruct. Process. 2022, 836, 142740. [Google Scholar] [CrossRef]
  28. Mao, Z.F.; Zhang, D.Z.; Jiang, J.J.; Fu, G.; Zhang, P. Processing optimisation, mechanical properties and microstructural evolution during selective laser melting of Cu-15Sn high-tin bronze. Mater. Sci. Eng. A-Struct. Mater. Prop. Microstruct. Process. 2018, 721, 125–134. [Google Scholar] [CrossRef] [Green Version]
  29. Wang, S.; Pang, X.J.; Guo, X.H.; Cheng, C.; Liu, Y.; Zhang, Y.Z. Mechanical and tribological properties of WC particles reinforced Cu-20Zn matrix composites. Powder Technol. 2022, 406, 117571. [Google Scholar] [CrossRef]
  30. Yilmaz, S.O.; Teker, T.; Batmaz, Y.O.; Yuksel, C. Effect of thermomechanical processing on the mechanical properties of CuZn10 alloy. Materials Testing 2022, 64, 1026–1032. [Google Scholar] [CrossRef]
  31. Orzolek, S.M.; Semple, J.K.; Fisher, C.R. Influence of processing on the microstructure of nickel aluminum bronze (NAB). Addit. Manuf. 2022, 56, 102859. [Google Scholar] [CrossRef]
  32. Song, C.H.; Yang, Y.Q.; Liu, Y.; Luo, Z.Y.; Yu, J.K. Study on manufacturing of W-Cu alloy thin wall parts by selective laser melting. Int. J. Adv. Manuf. Technol. 2015, 78, 885–893. [Google Scholar] [CrossRef]
  33. Su, S.; Lu, Y.Z. Densified W-Cu composite fabricated via laser additive manufacturing. Int. J. Refract. Met. Hard Mater. 2020, 87, 105122. [Google Scholar] [CrossRef]
  34. Wang, G.Y.; Qin, Y.; Yang, S. Characterization of laser-powder interaction and particle transport phenomena during laser direct deposition of W-Cu composite. Addit. Manuf. 2021, 37, 101722. [Google Scholar] [CrossRef]
  35. Ullah, A.; Rehman, A.U.; Salamci, M.U.; Pitir, F.; Liu, T.T. The influence of laser power and scanning speed on the microstructure and surface morphology of Cu2O parts in SLM. Rapid Prototyping J. 2022, 28, 1796–1807. [Google Scholar] [CrossRef]
  36. Ikeshoji, T.T.; Nakamura, K.; Yonehara, M.; Imai, K.; Kyogoku, H. Selective Laser Melting of Pure Copper. Jom 2018, 70, 396–400. [Google Scholar] [CrossRef]
  37. Jadhav, S.D.; Goossens, L.R.; Kinds, Y.; Hooreweder, B.V.; Vanmeensel, K. Laser-based powder bed fusion additive manufacturing of pure copper. Addit. Manuf. 2021, 42, 101990. [Google Scholar] [CrossRef]
  38. Jadhav, S.D.; Fu, D.; Deprez, M.; Ramharter, K.; Willems, D.; van Hooreweder, B.; Vanmeensel, K. Highly conductive and strong CuSn0.3 alloy processed via laser powder bed fusion starting from a tin-coated copper powder. Addit. Manuf. 2020, 36, 101607. [Google Scholar] [CrossRef]
  39. Ma, Z.; Zhang, K.; Ren, Z.; Zhang, D.Z.; Tao, G.; Xu, H. Selective laser melting of Cu–Cr–Zr copper alloy: Parameter optimization, microstructure and mechanical properties. J. Alloy. Compd. 2020, 828, 154350. [Google Scholar] [CrossRef]
  40. Tian, Y.; Tomus, D.; Rometsch, P.; Wu, X. Influences of processing parameters on surface roughness of Hastelloy X produced by selective laser melting. Addit. Manuf. 2017, 13, 103–112. [Google Scholar] [CrossRef]
Figure 1. (a) Size distribution of the powder material and (b) SEM image of the powder.
Sustainability 14 14639 g001
Figure 2. The schematic diagram of inclination angle α and azimuth angle γ.
Sustainability 14 14639 g002
Figure 3. (a) Sample model of the experiment and (b) the model size from the edge of the inclined surface to the vertical plane.
Sustainability 14 14639 g003
Figure 4. Fabrication images of the inclined structures (a) after powder spreading (α = 30°) and (b) after forming (α = 20°) during LPBF.
Sustainability 14 14639 g004
Figure 5. The histograms of the dimension differences (Ld) between the samples and their models under different γ condition.
Sustainability 14 14639 g005
Figure 6. The schematic diagram of the fabrication of the inclined structure.
Sustainability 14 14639 g006
Figure 7. The surface morphology of LPBFed inclined structures with different α but the same γ = 0° and (a) α = 30°, (b) α = 40°, (c) α = 50°, (d) α = 60°.
Sustainability 14 14639 g007
Figure 8. The histograms of the differences between the highest and the lowest point of the inclined surfaces with different α degrees. The illustrations are contrast images of inclined surface morphology when γ = 0° extracted from Figure 7 with (a) α = 30°, (b) α = 40°, (c) α = 50°, (d) α = 60°.
Sustainability 14 14639 g008
Figure 9. The behaviors of the dimension differences (Ld) between LPBFed part and the corresponding model with the variation of γ.
Sustainability 14 14639 g009
Figure 10. Schematics of the interaction between the scraper and the edges of the inclined surface structures: (a) the inclined surface along with the recoating direction and (b) the inclined surface against the recoating direction.
Sustainability 14 14639 g010
Figure 11. Images of LPBFed parts with different inclined structures in different γ condition (the α of the top structures is 20°), (a) γ = 180°, (b) γ = 90°, (c) γ = 45°, (d) γ = 0°.
Sustainability 14 14639 g011
Table 1. The chemical compositions of the Cu-Cr-Zr alloy. Reprinted with permission from ref. [39]. Copyright 2020 Elsevier B.V.
ElementsZrCrCuImpurities
Content (wt.%)0.43%0.66%balance≤0.2%
Table 2. Design matrix of the CCD experiment and the corresponding densities and relative densities of the LPBFed Cu-Cr-Zr specimens.
Standard OrderRun
Order
FactorsResponse
Laser Power
(W)
Scanning Speed
(mm/s)
Hatch Distance (μm)Density
(g/cm3)
Relative Density (%)
11410480728.86799.08
213440480728.87499.15
316410720728.87299.14
419440720728.87699.17
5104104801108.87299.12
6114404801108.87199.14
7144107201108.87399.14
8124407201108.87699.18
918400600908.87899.21
106450600908.88399.25
113425400908.86999.09
1217425800908.87999.21
1315425600608.87599.17
1424256001208.87599.16
157425600908.88199.23
169425600908.87799.18
174425600908.87299.13
1820425600908.87499.15
198425600908.87399.14
205425600908.87799.18
Table 3. Experimental and statistical results of the inclined structures formed by LPBF.
γ (°)45°90°135°180°
α (°)
10°×××××
20°×
30°
40°
50°
60°
70°
80°
Table 4. The measured sample dimensions and the differences compared with their model.
A (°)203040506070
γ (°)
010.74/−0.769.40/−0.068.47/0.097.90/0.227.34/0.196.94/0.21
4510.74/−0.769.45/−0.018.48/0.17.88/0.27.35/0.26.95/0.22
9010.7/−0.89.45/0.018.48/0.17.86/0.187.35/0.26.92/0.19
135--9.32/−0.148.4/0.027. 78/0.17.34/0.196.93/0.2
18010.61/−0.899.43/−0.898.43/0.057.8/0.127.33/0.186.92/0.19
Average10.70/−0.89.41/−0.058.45/0.0727.84/0.167.34/0.196.93/0.20
Model size11.509.468.387.687.156.73
Publisher’s Note: MDPI stays neutral with regard to jurisdictional claims in published maps and institutional affiliations.

