Article

Natural Radioactivity Measurements and Radiological Hazards Evaluation for Some Egyptian Granites and Ceramic Tiles

by
Essam Sidique
1,*,
Sedky H. A. Hassan
2,3 and
Mohammad Mahmoud Dawoud
4,*
1
Physics Department, Faculty of Science, New Valley University, El-Kharga 72511, Egypt
2
Biology Department, College of Science, Sultan Qaboos University, Muscat 123, Oman
3
Botany & Microbiology Department, Faculty of Science, New Valley University, El-Kharga 72511, Egypt
4
Radioisotopes Department, Nuclear Research Center, Egyptian Atomic Energy Authority, Giza 12311, Egypt
*
Authors to whom correspondence should be addressed.
Sustainability 2022, 14(21), 14611; https://doi.org/10.3390/su142114611
Submission received: 24 September 2022 / Revised: 27 October 2022 / Accepted: 30 October 2022 / Published: 7 November 2022
(This article belongs to the Special Issue Radioactivity: Sustainable Materials and Innovative Techniques)

Abstract

:
All over the world, people widely use granites and ceramic tiles in their residential establishments. Information concerning the radiological properties of such materials reveals how to ensure the sustainability of their safe use in terms of these properties. In the present work, the distribution of the terrestrial radioisotopes U-238 (Ra-226), Th-232, and K-40 for 23 different brands of Egyptian commercial granites and ceramic tiles samples (widely used domestically and exported) was determined using gamma radiation spectroscopy. This process pinpoints the possible radiological health risks related to gamma ray exposure and radon gas resulting from the use of these materials indoors. The concentration values of the aforementioned radioisotopes in the examined samples were compared to the corresponding global average values (GAVs) of the UNSCEAR and to those available in other countries. The overall average concentrations for U-238, Th-232, and K-40 in the total samples were observed to be 46.17 ± 2.81 (less than its GAV), 51.65 ± 2.35 (slightly above its GAV), and 701.62 ± 40.60 Bq/kg (1.4 times greater than the GAV), respectively. The related radiological parameters and indices were calculated and compared to the prescribed limits set by commissions and organizations concerned with radiation protection (the WHO, ICRP, UNSCEAR, and EC) to ensure the safe use of the investigated granites and ceramic tiles. The assessed indices and parameters fall within the recommended values and safety limits. In conclusion, there is no risk from using the granites and ceramic tiles under investigation in residential facilities.

1. Introduction

For humans, exposure to natural ionizing radiation is unavoidable. Exposure arises primarily from both terrestrial and cosmogenic radioisotopes. Terrestrial radioisotopes (K-40, U-238, and Th-232) exist naturally in all different environmental media, including air, water, food, soil, rock, building materials, etc. [1,2,3]. The existence of the abovementioned radioisotopes in building materials is responsible for delivering about 85% of the radiation dosage to the world’s population [3,4]. Accordingly, providing information on terrestrial radioisotope concentrations and distributions in building materials is essential and it is required to monitor contamination originating from their radioactivity in residential environments.
The natural radioactivity level in building materials is confined in the terrestrial radionuclide concentrations in the geological materials from which they are derived [4,5], i.e., it varies according to the geological origin and geochemical characteristics of the constituent materials. Additionally, the radiation dose received is controlled by several factors, including residences places ventilation, and kinds [1].
In fact, gamma rays and radon gas (Rn-222 and Rn-220) are the most significant products of the terrestrial radioisotopes’ radioactivity in building materials, in light of the radiological hazards to the population [6]. Gamma rays are responsible for the external exposure of populations and their dose comes mainly from Tl-208 and Ac-228 of the Th-232 disintegration chain, from Pb-214 and Bi-214 derived from R-226 of the U-238 disintegration chain, and from K-40. On the other hand, radon gas (specifically Rn-222) which originates as a result of radium disintegration (Ra-226 of the U-238 chain), is responsible for the internal exposure [7]. According to the UNSCEAR [6], the average yearly external exposure indoors due to gamma rays was assessed as 0.41 mSv, while the internal exposure from Rn-222 inhalation was about 1.15 mSv. It is worth mentioning that several epidemiological investigations conducted in many countries have demonstrated substantial evidence linking raised levels of radon exposure in houses to an increased risk of lung cancer [8,9,10].
Construction materials that typically come from the soil and rocks of the earth may be categorized into three groups: structural materials, covering materials, and additive raw materials. Structural materials such as cement, concrete, mortar, and clay bricks, etc., are primarily used for building structures. The covering materials (granite, ceramic, marble, etc.) are employed for ornamentation and insulation purposes, whereas fly ash, bauxite, phosphogypsum, etc., are the additive raw materials used as optional components for modifying certain properties of building materials [1]. In light of global recommendations, determining the natural radioactivity levels of construction materials is crucial for assessing the radiological risks owing to radiation exposures as well as for developing national standards and guidelines for these materials. Recently, as a result of rising social concern, there has been a high worldwide interest in studying the natural radioactivity of construction materials as well as investigating their impact on the public (e.g., [4,5,11,12,13,14,15,16,17,18,19,20]). To the best of the authors’ knowledge, important international studies on natural radioactivity measurements and radiological hazards evaluation for granites and ceramic tiles were published in the Refs. [1,2,9,18,19,21,22,23,24,25,26,27,28,29,30,31,32,33,34,35,36,37,38,39], just to name a few. Nevertheless, although granites and ceramic tiles of various brands are widely used in residences for interior and exterior ornamentation and decoration purposes in Egypt, no detailed studies have been conducted to determine the activity levels of terrestrial radioisotopes in these materials.
The present work investigates in depth the natural radioactivity of twenty-three well-known Egyptian brands of commercial granites and ceramic tiles samples widely used in Egypt and abroad, as well as the potential health risks associated with their use indoors. Moreover, its overall goal is to complete a radiometric study on some sample Egyptian commercial granites and ceramic tiles which have not been previously covered. Hopefully, the findings of the present work and the accompanying assessments will establish baseline data for monitoring radioactive pollution in residential environments and will provide adequate public protection recommendations.

2. Experimental Arrangements

2.1. Sample Preparation

A total of 107 tile samples (42 granite samples plus 65 ceramic samples) from 23 different brands were purchased from Egyptian building materials markets and suppliers. The commercial ceramics and granites studied are among the best widely used decorative building materials brands in Egypt. Before transporting the samples to the lab, they were properly catalogued, labeled, and named according to their popular names known in both the global and domestic markets (Table 1). More detailed information, particularly for granite, is available at (www.stonecontact.com, accessed on 19 June 2022). The samples have been given identification numbers in brackets, which are (1 to 42) for granites, and (43 to 107) for ceramic tiles. Then, each sample was individually ground to a powder, to avoid contamination between samples, and sieved through a sieve (200 μm mesh). All the samples were oven-dried for 5 h at 105 °C to remove the moisture content. These prepared samples were subsequently weighed (between 600 g and 850 g) and sealed in plastic cylindrical beakers (48 mm radius, 82 mm height, and 0.5 mm thickness) for more than 4 weeks to guarantee access to the secular equilibrium between parent radioisotopes and daughters in the natural disintegration series (232Th and 238U).

2.2. Gamma Spectrometric Analysis

To measure the activity concentrations of the radioisotopes (γ-emitters) in the samples, a low-background γ-rays spectroscopy system consisting of a semiconductor HPGe (Hyper-Pure Germanium) detector (Model GR4020, Canberra, Meriden, CT, USA) with a 40% relative efficiency and energy resolution (FWHM) of 2 keV at the 1332 keV γ-line (Co-60) was used. In addition, the system contains a suitable lead shield (Model 747E, Canberra, USA) surrounding the detector to prevent more than 98% of the external background radiation from reaching the detector during the analysis. The gamma spectrums were acquired and analyzed utilizing the Genie-2000 software (Version 3.3, Canberra, USA) [40] coupled with a multichannel analyzer (Model DAS-1000, Canberra, USA). For calibrating the detector’s energy and efficiency, the LabSOCS (Laboratory Sourceless Calibration Software) designed using the features of geometry composer and gamma analysis within the Genie-2000 software, was used. The Genie-2000 software also contains the detector’s characterization files created based on the system manufacturer’s fundamental calibration tests (Canberra). To authenticate the efficiency data provided by LabSOCS, measurements were completed in our laboratory with a set of gamma calibration sources (Co-60, Cs-137, Ba-133, Mn-54, Zn-65, and Na-22), which revealed a significant agreement (90%) between empirical and mathematical peak efficiency.
Each prepared sample was put on the detector for a time period no less than 12 h in order to obtain an accurate counting statistic for gamma lines (photo-peaks) of importance. Additionally, the background level in the laboratory was measured using an empty beaker in similar conditions. The K-40 radionuclide was determined directly by its own gamma line intensity (1460.8 keV). As for U-238 (Ra-226), it was specified through its progeny Bi-214 (1764.5, 1120.3, and 609.3 keV) and Pb-214 (351.9 and 295.2 keV). On the other hand, Th-232 was identified via its daughters Ac-228 (968.9, 911.2, and 338.3 keV), Tl-208 (2614.5 and 583.2 keV), and Pb-212 (238.6 keV). The activity concentration (AC) and the uncertainty in activity concentration (UAC) of the previously mentioned radionuclides in each sample were calculated from their corresponding gamma line intensities taking into account the sample mass, counting time, gamma decay transition probabilities, and detector efficiencies [41,42,43].

Activity Concentrations Estimation

The activity concentration (AC) in the granites and ceramic tiles samples under investigation was estimated as follows [41]:
AC [ Bq / kg ] = N c , E P γ , E · ε E · M s
where Nc,E is the net count rate resulting from subtracting the count rate of the peak at energy E in the sample spectrum minus that of the background spectrum at the same energy E, Pγ,E denotes the probability of emitting gamma radiation with energy E for the radioisotope of interest, εE is the detector absolute efficiency at energy E, and Ms refers to the sample mass. Moreover, using the equation below, the uncertainty in activity concentration, UAC, was calculated based on uncertainties in Nc,E, Pγ,E, εE, and Ms [43]:
U AC = AC [ U N c , E N c , E ] 2 + [ U P γ , E P γ , E ] 2 + [ U ε E ε E ] 2 + [ U M s M s ] 2

3. Estimation of Radiological Risks

For understanding the effect of radiological hazards on human health when using the investigated granites and ceramic tiles as tiling materials in buildings, several radiation hazard indices were estimated. The radium equivalent activity (Raeq), gamma index (Iγ), indoor absorbed gamma dose rate (Din), yearly effective gamma dose rate (Ein), and excess lifetime cancer risk (ELCR) were used to investigate gamma radiation risks, while the alpha index (Iα), radon exhalation rate (RX), radon concentration (CRn), and yearly effective dose due to radon (ERn) were evaluated in order to investigate the potential radon risks.

3.1. Radium Equivalent Activity (Raeq)

The Raeq is one of the most effective radiological indices for determining gamma radiation hazards due to the radioisotopes K-40, U-238 and Th-232 content in tiling materials, considering the non-uniform distribution of these radioisotopes in matter. As per Beretka et al. [44], Raeq is described by the following equation:
Ra eq [ Bq   kg 1 ] = ( AC U 370 + AC Th 259 + AC K 4810 ) × 370
where ACU, ACTh, and ACK are the specific activity concentrations of the radioisotopes U-238 (Ra-226), Th-232, and K-40, respectively. In fact, the Raeq reflects the weighted total of the abovementioned three radioisotopes’ concentrations within materials under the premise that gamma dose rates from 4810 Bq/kg of K-40, 259 Bq/kg of Th-232, and 370 Bq/kg of U-238 (Ra-226) are almost equal.
From a radiation protection perspective, the ceramic and granite tiles studied herein are safe provided that their Raeq levels are not above 370 Bq/kg [44] (permissible limit) corresponding to a yearly effective dosage of 1.5 mSv [41,45].

3.2. Gamma Index (Iγ)

The Iγ is taken into consideration as a monitoring tool specifying whether construction materials are safe to use or not. Considering that the external exposure due to gamma radiation from the tiling (superficial or covering) materials has a limit of 1 mSv/year, the Iγ is adopted by the European Commission [46] to be estimated via the following equation:
I γ = AC U 300   Bq   kg 1 + AC Th 200   Bq   kg 1 + AC K 3000   Bq   kg 1
According to the European Commission [46], for covering materials such as the ceramic and granite tiles under investigation, if they have a Iγ ≤ 2, this leads to an increase in the annual gamma dose rate with an amount ≤ 0.3 mSv/y resulting from these materials. In other words, these materials fall within the exemption level for building materials from all limitations about their radioactivity. Furthermore, if materials achieve criteria 2˂ Iγ ≤ 6, they will contribute to the annual gamma dose rate with an amount ≤ 1 mSv/y and fall within the recommended action level. Eventually, materials with Iγ > 6 are not suitable for safe use in buildings [46].

3.3. Indoor Absorbed Gamma Dose Rate (Din) and Yearly Effective Dose (Ein)

Estimation of the indoor absorbed gamma dose rate (Din) and its associated yearly effective dose (Ein) are significant mechanisms for determining the external exposure caused by terrestrial radioisotopes (Th-232, U-238, and K-40). According to the European Commission [46], Equations (5) and (6) can be used to estimate the Din and Ein in the air within rooms as a result of using the investigated granites and ceramic tiles as superficial construction materials:
D i n [ nGy   h 1 ] = ( 12 AC Ra + 14 AC Th + 0.96 AC K ) × 10   2
E i n [ mSvy 1 ] = D i n [ nGy   h 1 ] × F 1 × F 2 × F 3 × 10 6
where F1 (=0.7 Sv/Gy), F2 (=0.8), and F3 (=8766 h) represent the conversion factor from the absorbed dose to the effective dose in the air, indoor residency factor, and hours of the year, respectively.

3.4. Excess Lifetime Cancer Risk (ELCR)

The ELCR is an important quantity through which the incidence of cancer for an individual exposed to a low gamma radiation dose over their lifetime (66-years) can be figured out. Depending on the Ein incurred by individuals from the studied ceramic and granite tiles (superficial building materials) when used in buildings, the ELCR can be estimated as follows [4,41]:
ELCR = E i n [ Sv / y ] × C 1 × C 2
where C1(=66 y [47]) and C2 (=0.05 Sv−1 for the general population) stand for life expectancy on average and fatal cancer risk, respectively [42,48].

3.5. Alpha Index (Iα)

The Iα given by the equation below [41] is used for estimating the risk of exposure to internal alpha radiation owing to the inhalation of radon. The estimation of Iα is fundamentally dependent on the U-238 (Ra-226) activity concentration (ACRa) in construction materials, considering that materials with a concentration of 226Ra < 200 Bq kg−1 cannot emit an indoor radon concentration >200 Bq m−3, i.e., these materials come within the range of the recommended action level of indoor radon exposure for buildings, as previously agreed upon by the European Commission [46] and ICRP [49].
I α = AC Ra 200 Bq   kg 1 1

3.6. Radon Concentration (CRn) and Yearly Effective Dose Resulting Therefrom (ERn)

In this study, the parallelepiped room model (4 × 5 × 2.8 m) is taken into account to assess the concentration of radon and the associated absorbed dose rate delivered to residents, assuming the floor is made of the investigated ceramic or granite tiles. Thus, Equation (9) is applied, according to the European Commission [46], to determine the increase in indoor radon concentration (CRn) brought on by the radon exhalation rate (RX) from the investigated ceramic or granite tiles used in buildings:
C Rn   [ Bq   m 3 ] = R X · S ( λ + λ o ) · V
where RX [Bq m−2 h−1], λ (=0.0076 h−1), λo [h−1], S [m2], and V [m3] represent the radon exhalation rate per unit area, Ra-226 decay constant, ventilation rate, tiled floor surface, and volume of the room, respectively. Based on the determined Ra-226 concentration (ACRa), Equation (10) can be applied to estimate the RX for the investigated tiles with thickness d (=3 cm and 1 cm for granites and ceramic tiles, respectively), density ρ (=2600 kg/m3), and emanation coefficient η (=0.45), as reported in Refs. [20,41,50]:
R X = AC Ra · λ · ρ · η · d · 0.5
It is worth noting that the room ventilation rate (λo) was chosen with 0.5 h−1 for normal ventilation and 0.1 h−1 for poor ventilation. [9,41]. Furthermore, the (S/V) ratio of the room surface tiled with the investigated ceramic and granite tiles was chosen to be 2 m−1 [41].
As per the UNSCEAR [6] report, the yearly effective dose (ERn) that dwellers obtain from the indoor radon concentration (CRn) was estimated by the following formula:
E Rn   [ mSv   y 1 ] = C Rn   [ Bq   m 3 ] × C 1 × 8766 [ h   y 1 ] × C 2 × C 3 × 10 6
where C1 (=9 nSv per Bq m−3 h), C2 (=0.8), and C3 (=0.4) stand for the factors of dose conversion, dwellers’ indoor residency, and equilibrium equivalent radon concentration indoors, respectively [6,51].

4. Results and Discussion

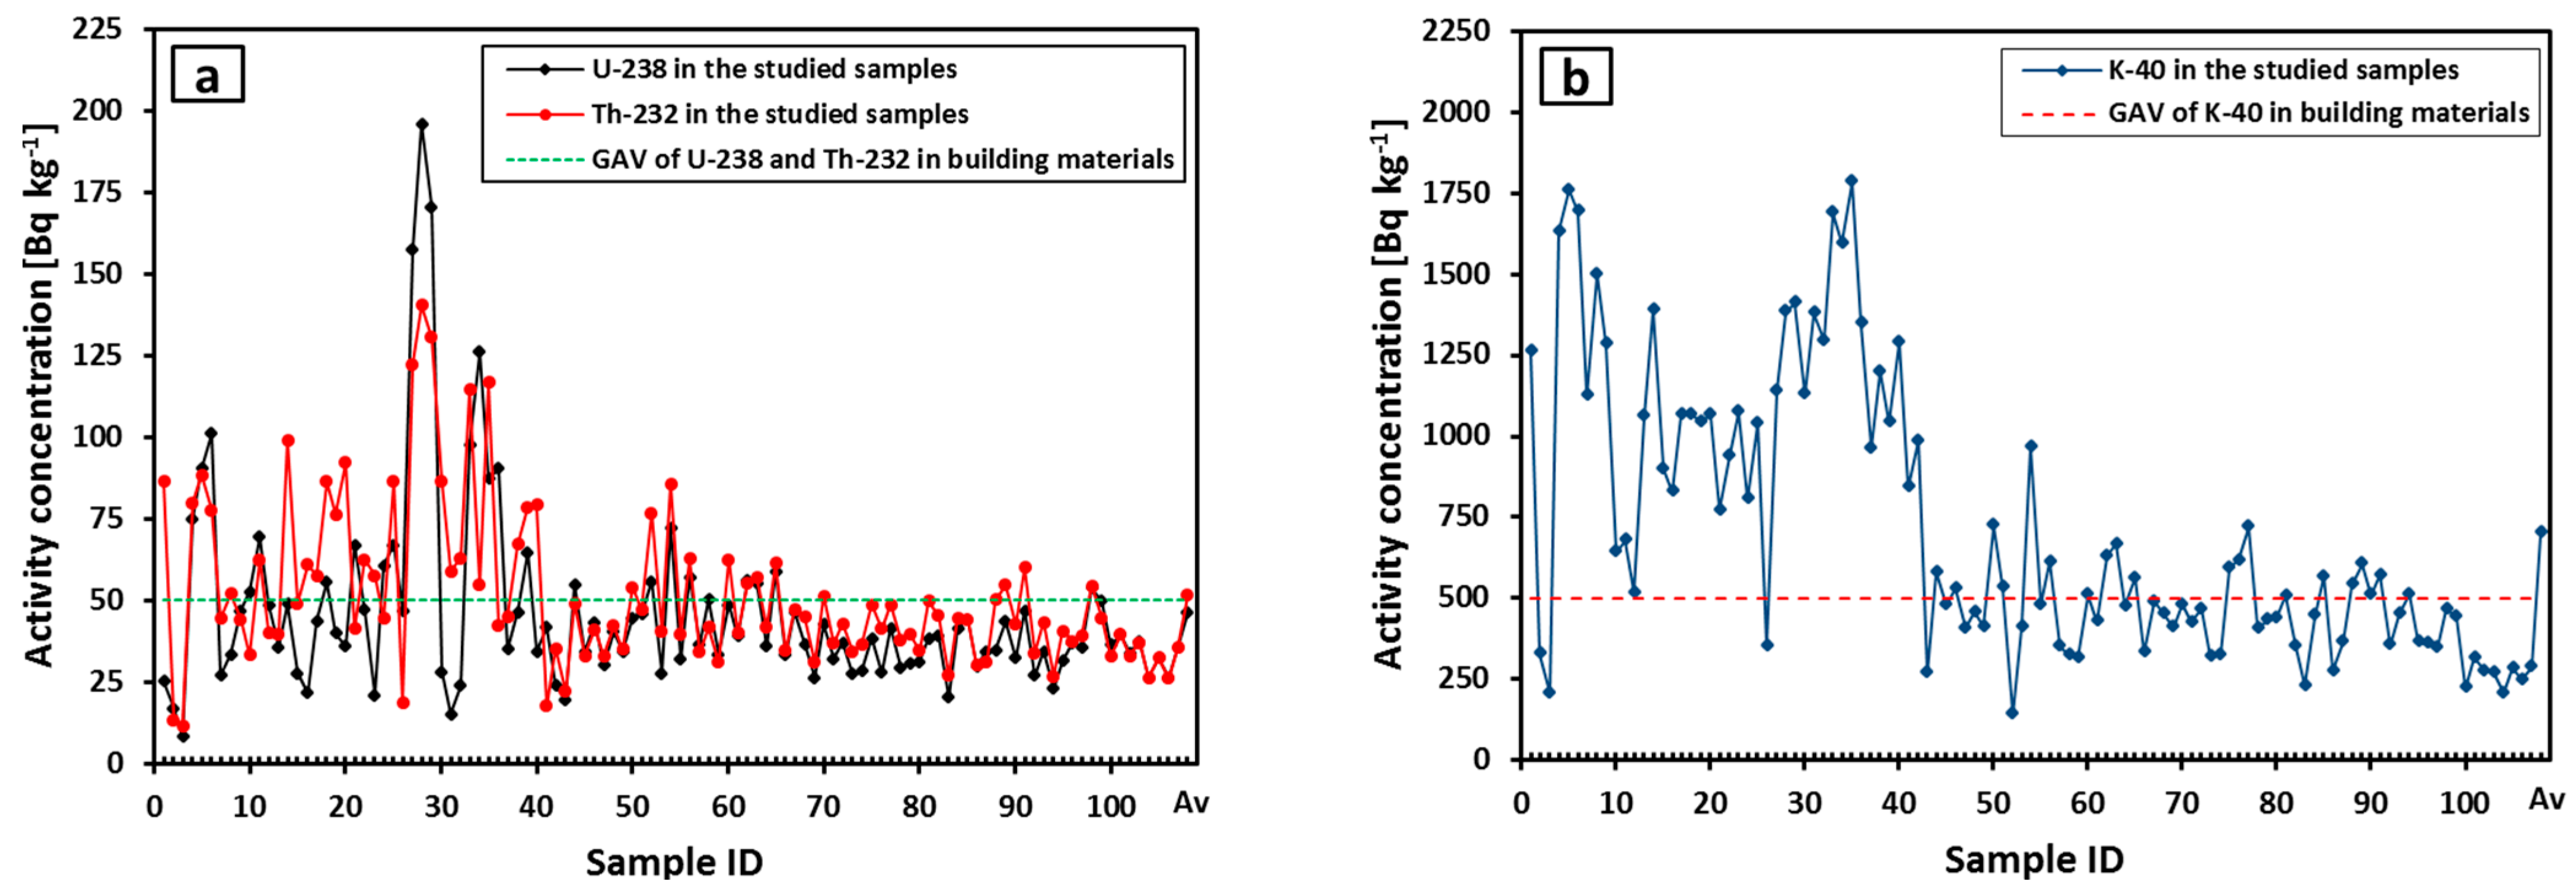
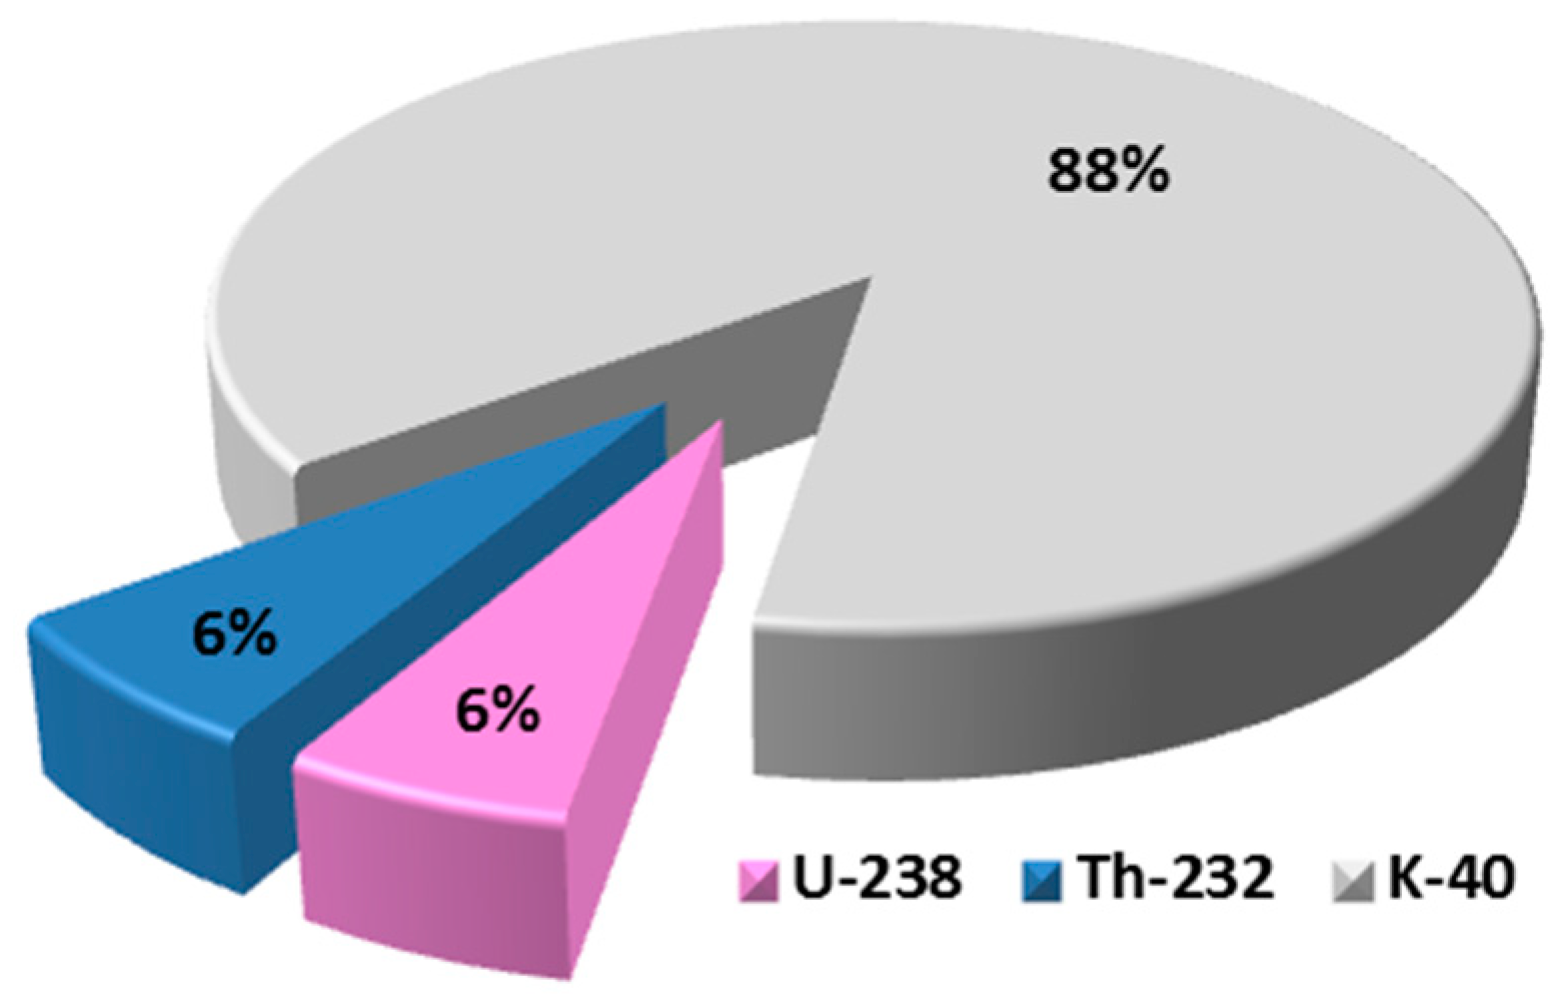
4.1. Radioisotope (238U, 232Th, and 40K) Concentrations

Table 2 displays the ranges and averages, as well as standard errors, for the estimated concentrations values of U-238 (Ra-226), Th-232, and K-40 in the granites and ceramic tiles collected. Furthermore and by way of illustration, Figure 1 depicts the variations of the abovementioned radioisotopes concentrations in the samples under examination. Evidently, Figure 1 and Table 2 show that the concentrations of the considered radioisotopes fluctuate from 8.40 ± 2.09 in GBiH (sample No. 3) to 196.01 ± 37.84 Bq kg−1 in GRSS (sample No. 28), 11.62 ± 1.28 in GBiH (sample No. 3) to 140.32 ± 27.41 Bq kg−1 in GRSS (sample No. 28), and 141.01 ± 12.83 in CAR (sample No. 52) to 1785.78 ± 125.00 Bq kg−1 in GRN (sample No. 35) for 238U, 232Th, and 40K, respectively. Conceivably, the observed variations in radioisotopes’ concentrations could be attributed to the samples’ various origins and compositions. Evidently, most of the ceramic samples (samples No. 43 to 107) have lower concentrations of the three radioisotopes (U-238, Th-232, and K-40) than those of the granite samples (samples No. 1 to 42). This materializes the granite’s naturally high level of terrestrial radioisotopes [3].
Regarding the mean values of the radioisotope concentrations inserted in Table 2 and plotted in Figure 2, it is clear that CVE samples contain the lowest mean concentrations of both K-40 and Th-238, with levels of 269.36 ± 13.15 and 32.96 ± 1.94 Bq/kg, respectively, while GBiHa samples have the lowest mean concentration of U-238 with a level of 16.95 ± 4.90 Bq/kg. In contrast, GRSS samples appear to have the highest mean concentrations of both U-238 and Th-232, with levels of 174.55 ± 11.38 and 131.07 ± 5.20 Bq/kg, respectively, whereas, GBrHu samples have the highest mean concentration of K-40, with a level of 1695.38 ± 37.21 Bq/kg.
Figure 2 and Table 2 also display the mean values of the aforementioned radioisotope concentrations in the materials under investigation against their corresponding global average values (GAVs) in building materials as given by the UNSCEAR [52]. Notably, the GAVs for U-238, Th-232, and K-40 in building materials are 50, 50, and 500 Bq/kg, respectively, according to the UNSCEAR [52]. Apparently, the mean concentration of U-238 in all granites and ceramic tiles samples herein, except for GBrHu, GKG, GRHL, GRSS, and GRN samples, is lower than its GAV of 50 Bq/kg in building materials [52], (Figure 2 and Table 2). Similarly, the average concentration of Th-232 in the investigated samples, except for the GBrHu, GNA, GRAD, GRHL, GRAS, GRSS, GRA, GRN, GRF, and CAR samples, is lower than its GAV in building materials of 50 Bq/kg [52]. However, the average concentration of K-40 for all of the granite and ceramic brands, except for the CAL, CCL, CGL, CPH, CRO, and CVE samples, is greater than the GAV (500 Bq/kg) of building materials [52], (Figure 2 and Table 2).
The overall average concentrations for U-238, Th-232, and K-40 of the total samples were observed to be 46.17 ± 2.81 (less than its GAV), 51.65 ± 2.35 (slightly above its GAV), and 701.62 ± 40.60 Bq/kg (1.4 times greater than the GAV), respectively, as demonstrated in Table 2 and Figure 2. Moreover, in all of the investigated brands’ samples (Figure 2), the K-40 concentration is the greatest among the concentrations of the three studied radionuclides, as the granites contain about 33% potash feldspar minerals [21]. Moreover, it was found that the K-40 concentration is the largest contributor to the total concentration for all samples (Figure 3). Both U-238 and Th-232 contribute roughly the same percentage (6%), to the overall concentration of samples, while K-40 contributes a larger percentage (88%), as shown in Figure 3.
A comparison between the radioactivity levels in the studied samples and those in other previous relevant studies on granites and ceramics used in Egypt and other countries is illustrated in Table 3. From Table 3, one can deduce that many of the data from the relevant literature are comparable to our findings. This can be confirmed using the dendrogram (Figure 4) derived from the hierarchical cluster analysis (HCA) based on the three variables (U-238, Th-232, and K-40 concentrations). In HCA, the cluster method between-groups linkage is used coupled with the square Euclidean distance. Accordingly, the countries in which the studies were accomplished have been divided into homogeneous groups based on the similarity in concentrations of the three radionuclides (U-238, Th-232, and K-40) (Figure 4). Figure 4a shows that the Egyptian granite tiles studied herein come close to the granites used in Bangladesh [22] and Nigeria [2] in terms of the content of the three aforementioned radionuclides, as they were grouped into a homogeneous group. However, they are far from those used in Pakistan [25], as illustrated in Figure 4a. Likewise, Figure 4b exhibits that the ceramic tiles examined herein are matched to the ceramics used in Italy [23] and Egypt [30] but are very different to those used in Poland [37], Serbia [9], and Nigeria [2] in terms of radionuclide content.
Evidently, in many of the investigated granite and ceramic samples, the radioisotopes’ displayed concentrations were more elevated than the GAVs (Figure 2). For instance, in granites of “Rosa Sardo Sinai” (GRSS) samples, concentrations of uranium, thorium, and potassium exceed their corresponding GAVs by about three times, confirming the previous study on the granite of the Sinai area by Fares [39]. Therefore, it was crucial to assess the likely radiological risks to peoples’ health owing to the use of these materials in buildings.

4.2. Gamma Radiation Impact Estimation

Table 4 displays some of the evaluated radiological variables for the granite and ceramic samples under consideration. Through the estimated Req, Iγ, Din, Ein, and ELCR (Table 4), the gamma ray hazards posed by the materials under investigation when used as tiling in buildings can be judged. It was found that all Raeq values in the samples of ceramic tiles fell within ranges below the threshold standard of 370 Bq/kg [44]. Similarly, the Raeq values for all the samples of the investigated granite tiles were in ranges lower than the criterion limitation of 370 Bq/kg, with the exception of three samples (No. 27 to 29) of GRSS and two samples (No. 33 and 35) from GRN samples. Furthermore, the mean Raeq values varied between 100.96 Bq/kg in the CVE samples and 463 Bq/kg in the GRSS samples, with an overall mean of 174.06 Bq/kg. Accordingly, the granites and ceramic tiles of the different brands herein don’t constitute any considerable radiological risks for individuals when used as tiling materials, except for the GRSS samples which may be a cause for concern due to the mean value of Raeq going beyond 370 Bq/kg (recommended value) (Figure 5a).
According to the calculated values of Iγ (Table 4), none of the values in the samples under investigation go beyond the exemption limit of 2. This implies that the yearly effective gamma dose resulting from the investigated materials herein when used as covering or superficial building materials indoors is less than 0.3 mSv/y (exemption limit indicated by the European Commission [46]). Thus, the granites and ceramic tiles of the brands under investigation are suitable for use without any restrictions. Furthermore, and by way of illustration, Figure 5b displays the estimated mean values of Iγ for the granites and ceramic tiles where they do not go beyond their allowable limit, indicating that all of the investigated materials do not raise any cause for concern when used in buildings.
Considering the estimated Din and Ein values for the samples under investigation (Table 4), neither the granites nor the ceramic samples of the various brands examined herein had Din and Ein values going beyond their corresponding worldwide average values of 84 nGy/h and 0.41 mSv/y [3] and of 70 nGy/h and 1 mSv/y [46]. Notably, the mean values of Din and Ein for the studied granites and ceramic tiles compared with the corresponding global average values (GAVs) are illustrated in Figs. 5c and 5d, where they are below the adopted limits, reflecting their safe use.
The indoor ELCR values based on Ein, as well as their mean values in the granites and ceramics under investigation, are shown in Table 4 and plotted in Figure 5e. Evidently, all the ELCR values are within the range of 0.07 to 0.91, with an overall mean of 0.32. Namely, the mean ELCR values in all the brands of tiling materials are less than their corresponding GAV of 1.16 indicated by Sidique et al. [41] and Qureshi et al. [53], as shown in Figure 5e. Thus, in buildings where the materials under investigation are used, over a 66-year lifespan, their residents are at a very insignificant risk of developing cancer resulting from exposure to gamma rays emitted by these materials.

4.3. Radon Impact Assessment

The potential radon (Rn-222) risks posed by the studied materials when used as tiles in buildings can be investigated through the estimated Iα, RX, CRn, and ERn. For the samples of each brand, Table 5 displays ranges and averages of Iα, RX, CRn, and ERn values, while Figure 6 compares averages of these parameters with their corresponding allowable limits. Table 5 reveals that the Iα values oscillate between 0.04 and 0.98, with an overall mean value of 0.23. Furthermore, no mean value of Iα for any of the brands’ samples under investigation goes beyond the unity, as shown in Figure 6a. Thus, arguably, the materials under consideration come under the range of the indoor radon safe exposure action level for buildings, as indicated by the European Commission [46] and ICRP [49].
Regarding the mean values of the radon exhalation rate (RX) for the samples under investigation (Table 5 and Figure 6b), they stretch between 1.44 Bq/m2 h in the CGL samples and 23.28 Bq/m2 h in the GRSS samples, with an overall mean value of 4.09 Bq/m2 h. Moreover, no mean value of RX for samples of any brand of ceramic or granite exceeds the global average value (GAV) of 57.6 Bq/m2 h (0.016 Bq/m2 s) as declared by the UNSCEAR [3], as shown in Figure 6b. It is therefore expected that the materials under investigation do not constitute any health risks to dwellers.
Based on the RX values, the indoor radon concentration (CRn) was assessed from the indirect mathematical model of a typical residence room tiled by the studied ceramics and granites in both poor and normal ventilation cases as per Equation (9). Accordingly, for the room model with normal ventilation, the mean values of CRn of granites and ceramics from the different brands under investigation fluctuate between 5.67 Bq/m3 in the CGL samples to 91.73 Bq/m3 in the GRSS samples, with an overall mean value of 16.13 Bq/m3 (Table 5 and Figure 6c). Consequently, for the normal ventilation case, none of the mean values of CRn in the studied brands of granites and ceramic tiles, as shown in Figure 6c, go beyond the acceptable range (100–300 Bq/m3) declared by the WHO (World Health Organization) [8]. On the other hand, for the room model with poor ventilation, the mean values of the CRn of granites and ceramics from the brands under examination oscillate between 26.75 Bq/m3 in the CGL samples and 432.75 Bq/m3 in the GRSS samples, with an overall mean value of 76.08 Bq/m3 (Table 5 and Figure 6c). Thus, for the poor ventilation case, none of the mean values of CRn in the studied brands of ceramics and granites, as shown in Figure 6c, exceed the acceptable range (100–300 Bq/m3) declared by the WHO [8], except for GRSS which as a result is not recommended for poorly ventilated buildings.
Regarding the yearly effective dose rate (ERn) due to radon concentration (Table 5 and Figure 6d), the mean values span a range from 0.14 mSv/y in the CGL samples to 2.32 mSv/y in the GRSS samples, with an overall mean value of 0.41 mSv/y in the case of normal ventilation. Moreover, all of these values fluctuated below the acceptable range of 3–10 mSv/y documented by ICRP [49], (Figure 6d). On the other hand, for the poor ventilation case, the mean values of ERn for the granites and ceramics from the different brands under investigation stretch between 0.68 mSv/y in the CGL samples to 10.93 mSv/y in the GRSS samples, with an overall mean value of 1.92 mSv/y. Furthermore, as shown in Figure 6d for poor ventilation, the granite from the brand GRSS is the only one that has a mean value of CRn going beyond the recommended range of 3–10 mSv/y [49]. Therefore, it is not recommended for poorly ventilated rooms.
The hierarchical cluster analysis (HCA) coupled with the Pearson correlation method was performed to effectively prove the relationship among all considered radiological variables. The dendrogram obtained from the HCA shows the relationship between the radionuclide concentrations and the relevant radiological parameters (Figure 7). Depending on the similarities in existence, all considered variables are gathered into two principal clusters. Cluster I comprised U-238 and Th-232 concentrations as well as all radiological parameters with a highly similar correlation (Figure 7). This reflects that the slight radioactivity level arising in both of the examined granites or ceramic tiles is ascribable to U-238 and Th-232 concentrations. On the other hand, cluster II is only comprised K-40, reflecting the weak relationship of K-40 with the radiological parameters, i.e., despite the high concentration of K-40 in the examined granites and ceramic tiles, K-40 contributes very little to the radioactivity level.

5. Conclusions

A radiological evaluation for 23 well-known brands of Egyptian commercial granites and ceramic tile samples was performed for hazard and dose estimations. A total of 107 samples representative of the materials under investigation were analyzed using a HPGe detector. The terrestrial radionuclides (U-238 (Ra-226), Th-232, and K-40) concentrations in the investigated samples together with their radiological indices (Raeq, Iγ, Din, Ein, ELCR, Iα, CRn, ERn) were determined. It was found that the concentrations of the aforementioned radioisotopes were higher in most of the granite samples than in the ceramic samples. Furthermore, the concentration values of the terrestrial radionuclides indicated significant differences in the granite and ceramic tile samples collected from the different brands. This is significant in differentiating between the considered brands. K-40 concentration was found to be the biggest contributor to the total concentration for all samples, followed by Th-232 and U-238. Generally, the terrestrial radioisotope concentrations in the materials under investigation are comparable to many of those from the relevant literature and come within the worldwide range. Although the average concentration values for K-40 and Th-232 were higher than their GAVs, the obtained results for the majority of the radiological parameters showed that the studied granites and ceramic tiles are safe to use indoors except “Rosa Sardo Sinai” granite (GRSS). The GRSS samples go beyond the recommended values in terms of their high radium equivalent (Raeq) mean values, and indoor radon concentration (CRn), as well as their associated yearly effective dose rate (ERn) in poorly ventilated buildings, which may be a cause for concern. Therefore, it is not recommended for poorly ventilated buildings. In line with the HCA conducted herein, it reflects the weak relationship of K-40 with all different radiological parameters without exception. In other words, the insignificant risk levels originating from the use of the concerned granites and ceramic tiles are principally due to Th-232 and U-238, with only a weak contribution of K-40.
Our data herein are important for two reasons: firstly, they may raise awareness among the general population of the natural radioactivity of the materials under investigation, and secondly, they are required for developing the standards, rules, and management of tiling materials used in Egypt and in any other country to which such materials are exported.

Author Contributions

All the authors contributed to the conception of the study, study design, methodology, data analysis, validation, writing of the original draft, revision of the manuscript, and final publication. All authors have read and agreed to the published version of the manuscript.

Funding

This research received no external funding.

Institutional Review Board Statement

Not applicable.

Informed Consent Statement

Not applicable.

Data Availability Statement

Not applicable.

Acknowledgments

The authors sincerely thank Mervat A. Elhaddad, Department of Geology, Faculty of Science, Assiut University, Egypt, for her support during the editing and revision of this research article.

Conflicts of Interest

The authors declare that they have no competing interest.

References

  1. Turhan, Ş.; Kurnaz, A.; Karataşlı, M. Evaluation of natural radioactivity levels and potential radiological hazards of common building materials utilized in Mediterranean region, Turkey. Environ. Sci. Pollut. Res. 2022, 29, 10575–10584. [Google Scholar] [CrossRef] [PubMed]
  2. Aladeniyi, K.; Arogunjo, A.M.; Pereira, A.J.S.C.; Khandaker, M.U.; Bradley, D.A.; Sulieman, A. Evaluation of radiometric standards of major building materials used in dwellings of South-Western Nigeria. Radiat. Phys. Chem. 2021, 178, 109021. [Google Scholar] [CrossRef]
  3. UNSCEAR. Sources and Effects of Ionizing Radiation: UNSCEAR 2000 Report to the General Assembly, with Scientific Annexes; United Nations: New York, NY, USA, 2000; Volume 1.
  4. Abdullahi, S.; Ismail, A.F.; Samat, S. Determination of indoor doses and excess lifetime cancer risks caused by building materials containing natural radionuclides in Malaysia. Nucl. Eng. Technol. 2019, 51, 325–336. [Google Scholar] [CrossRef]
  5. Al-Sulaiti, H.; Alkhomashi, N.; Al-Dahan, N.; Al-Dosari, M.; Bradley, D.A.; Bukhari, S.; Matthews, M.; Regan, P.H.; Santawamaitre, T. Determination of the natural radioactivity in Qatarian building materials using high-resolution gamma-ray spectrometry. Nucl. Instrum. Methods Phys. Res. Sect. A 2011, 652, 915–919. [Google Scholar] [CrossRef] [Green Version]
  6. UNSCEAR. Sources and Effects of Ionizing Radiation, United Nations Scientific Committee on the Effects of Atomic Radiation (UNSCEAR) 2008 Report; United Nations: New York, NY, USA, 2010; Volume I. [CrossRef]
  7. Aykamış, A.Ş.; Turhan, Ş.; Aysun Ugur, F.; Baykan, U.N.; Kılıç, A.M. Natural radioactivity, radon exhalation rates and indoor radon concentration of some granite samples used as construction material in Turkey. Radiat. Prot. Dosim. 2013, 157, 105–111. [Google Scholar] [CrossRef] [PubMed]
  8. WHO; Zeeb, H. WHO Handbook on Indoor Radon: A Public Health Perspective; World Health Organization: Geneva, Switzerland, 2009.
  9. Kuzmanović, P.; Todorović, N.; Filipović Petrović, L.; Mrđa, D.; Forkapić, S.; Nikolov, J.; Knežević, J. Radioactivity of building materials in Serbia and assessment of radiological hazard of gamma radiation and radon exhalation. J. Radioanal. Nucl. Chem. 2020, 324, 1077–1087. [Google Scholar] [CrossRef]
  10. Axelsson, G.; Andersson, E.M.; Barregard, L. Lung cancer risk from radon exposure in dwellings in Sweden: How many cases can be prevented if radon levels are lowered? Cancer Causes Control 2015, 26, 541–547. [Google Scholar] [CrossRef] [Green Version]
  11. Higgy, R.H.; El-Tahawy, M.S.; Abdel-Fattah, A.T.; Al-Akabawy, U.A. Radionuclide content of building materials and associated gamma dose rates in Egyptian dwellings. J. Environ. Radioact. 2000, 50, 253–261. [Google Scholar] [CrossRef]
  12. Rizzo, S.; Brai, M.; Basile, S.; Bellia, S.; Hauser, S. Gamma activity and geochemical features of building materials: Estimation of gamma dose rate and indoor radon levels in Sicily. Appl. Radiat. Isot. 2001, 55, 259–265. [Google Scholar] [CrossRef]
  13. Moghazy, N.M.; El-Tohamy, A.M.; Fawzy, M.M.; Awad, H.A.; Zakaly, H.M.H.; Issa, S.A.M.; Ene, A. Natural Radioactivity, Radiological Hazard and Petrographical Studies on Aswan Granites Used as Building Materials in Egypt. Appl. Sci. 2021, 11, 6471. [Google Scholar] [CrossRef]
  14. Kumar, A.; Kumar, M.; Singh, B.; Singh, S. Natural activities of 238U, 232Th and 40K in some Indian building materials. Radiat. Meas. 2003, 36, 465–469. [Google Scholar] [CrossRef]
  15. Roy, S.; Alam, M.S.; Begum, M.; Alam, B. Radioactivity in building materials used in and around Dhaka city. Radiat. Prot. Dosim. 2005, 114, 527–532. [Google Scholar] [CrossRef] [PubMed]
  16. Al-Zahrani, J.H. Estimation of natural radioactivity in local and imported polished granite used as building materials in Saudi Arabia. J. Radiat. Res. Appl. Sci. 2017, 10, 241–245. [Google Scholar] [CrossRef] [Green Version]
  17. Çetinkaya, H.; Manisa, K.; Işık, U. Radioactivity content of building materials used in kutahya province, turkey. Radiat. Prot. Dosim. 2022, 198, 167–174. [Google Scholar] [CrossRef] [PubMed]
  18. Imani, M.; Adelikhah, M.; Shahrokhi, A.; Azimpour, G.; Yadollahi, A.; Kocsis, E.; Toth-Bodrogi, E.; Kovács, T. Natural radioactivity and radiological risks of common building materials used in Semnan Province dwellings, Iran. Environ. Sci. Pollut. Res. 2021, 28, 41492–41503. [Google Scholar] [CrossRef] [PubMed]
  19. Tuo, F.; Peng, X.; Zhou, Q.; Zhang, J. Assessment of natural radioactivity levels and radiological hazards in building materials. Radiat. Prot. Dosim. 2020, 188, 316–321. [Google Scholar] [CrossRef]
  20. Kuzmanović, P.; Todorović, N.; Nikolov, J.; Hansman, J.; Vraničar, A.; Knežević, J.; Miljević, B. Assessment of radiation risk and radon exhalation rate for granite used in the construction industry. J. Radioanal. Nucl. Chem. 2019, 321, 565–577. [Google Scholar] [CrossRef]
  21. Al-Hamarneh, I.F. Radiological hazards for marble, granite and ceramic tiles used in buildings in Riyadh, Saudi Arabia. Environ. Earth Sci. 2017, 76, 516. [Google Scholar] [CrossRef]
  22. Asaduzzaman, K.; Khandaker, M.; Amin, Y.; Bradley, D. Natural radioactivity levels and radiological assessment of decorative building materials in Bangladesh. Indoor Built Environ. 2016, 25, 541–550. [Google Scholar] [CrossRef]
  23. Righi, S.; Bruzzi, L. Natural radioactivity and radon exhalation in building materials used in Italian dwellings. J. Environ. Radioact. 2006, 88, 158–170. [Google Scholar] [CrossRef]
  24. Kitto, M.E.; Haines, D.K.; Menia, T.A. Assessment of gamma-ray emissions from natural and manmade decorative stones. J. Radioanal. Nucl. Chem. 2009, 282, 409. [Google Scholar] [CrossRef]
  25. Asghar, M.; Tufail, M.; Sabiha, J.; Abid, A.; Waqas, M. Radiological implications of granite of northern Pakistan. J. Radiol. Prot. 2008, 28, 387–399. [Google Scholar] [CrossRef]
  26. Sharaf, J.M.; Hamideen, M.S. Measurement of natural radioactivity in Jordanian building materials and their contribution to the public indoor gamma dose rate. Appl. Radiat. Isot. 2013, 80, 61–66. [Google Scholar] [CrossRef] [PubMed]
  27. Sonkawade, R.G.; Kant, K.; Muralithar, S.; Kumar, R.; Ramola, R.C. Natural radioactivity in common building construction and radiation shielding materials. Atmos. Environ. 2008, 42, 2254–2259. [Google Scholar] [CrossRef]
  28. Anjos, R.M.; Veiga, R.; Soares, T.; Santos, A.M.A.; Aguiar, J.G.; Frascá, M.H.B.O.; Brage, J.A.P.; Uzêda, D.; Mangia, L.; Facure, A.; et al. Natural radionuclide distribution in Brazilian commercial granites. Radiat. Meas. 2005, 39, 245–253. [Google Scholar] [CrossRef]
  29. Guillén, J.; Tejado, J.J.; Baeza, A.; Corbacho, J.A.; Muñoz, J.G. Assessment of radiological hazard of commercial granites from Extremadura (Spain). J. Environ. Radioact. 2014, 132, 81–88. [Google Scholar] [CrossRef]
  30. Medhat, M.E. Assessment of radiation hazards due to natural radioactivity in some building materials used in Egyptian dwellings. Radiat. Prot. Dosim. 2009, 133, 177–185. [Google Scholar] [CrossRef]
  31. Amin, R.M. Gamma radiation measurements of naturally occurring radioactive samples from commercial Egyptian granites. Environ. Earth Sci. 2012, 67, 771–775. [Google Scholar] [CrossRef]
  32. Amrani, D.; Tahtat, M. Natural radioactivity in Algerian building materials. Appl. Radiat. Isot. 2001, 54, 687–689. [Google Scholar] [CrossRef]
  33. Rajamannan, B.; Viruthagiri, G.; Suresh Jawahar, K. Natural radionuclides in ceramic building materials available in Cuddalore district, Tamil Nadu, India. Radiat. Prot. Dosim. 2013, 156, 531–534. [Google Scholar] [CrossRef]
  34. Abdullahi, S.; Ismail, A.F.; Mohd Fadzil, S.; Samat, S. Assessment of the long-term possible radiological risk from the use of ceramic tiles in Malaysia. Nucl. Sci. Tech. 2019, 30, 19. [Google Scholar] [CrossRef]
  35. Amin, S.A.; Naji, M. Natural radioactivity in different commercial ceramic samples used in Yemeni buildings. Radiat. Phys. Chem. 2013, 86, 37–41. [Google Scholar] [CrossRef]
  36. Iwaoka, K.; Hosoda, M.; Suwankot, N.; Omori, Y.; Ishikawa, T.; Yonehara, H.; Tokonami, S. Natural radioactivity and radon exhalation rates in man-made tiles used as building materials in Japan. Radiat. Prot. Dosim. 2015, 167, 135–138. [Google Scholar] [CrossRef] [PubMed]
  37. Zalewski, M.; Tomczak, M.; Kapala, J. Radioactivity of building materials available in northeastern Poland. Pol. J. Environ. Stud. 2001, 10, 183–188. [Google Scholar]
  38. Shohda, A.M.; Draz, W.M.; Ali, F.A.; Yassien, M.A. Natural radioactivity levels and evaluation of radiological hazards in some Egyptian ornamental stones. J. Radiat. Res. Appl. Sci. 2018, 11, 323–327. [Google Scholar] [CrossRef] [Green Version]
  39. Fares, S. Natural Radioactivity Emitted from Granite and Marble Samples Collected from Sinai Area Egypt and Excess Lifetime Cancer Risk. Int. J. Sci. Eng. Res. 2016, 7, 432–444. [Google Scholar]
  40. Canberra. The Genie-2000 Operations Manual, Including the S501 Gamma Analysis Option; Canberra Industries: Canberra, Australia, 2013. [Google Scholar]
  41. Sidique, E.; Elhaddad, M.A.; Abdelwahab, S.F.; El Hadek, H.H. Health Hazards Assessment and Geochemistry of ElSibai-Abu ElTiyur Granites, Central Eastern Desert, Egypt. Appl. Sci. 2021, 11, 12002. [Google Scholar] [CrossRef]
  42. El-Gamal, H.; Sidique, E.; El-Haddad, M.; Farid, M.E.-A. Assessment of the natural radioactivity and radiological hazards in granites of Mueilha area (South Eastern Desert, Egypt). Environ. Earth Sci. 2018, 77, 691. [Google Scholar] [CrossRef]
  43. El-Gamal, H.; Sidique, E.; El-Haddad, M. Spatial Distributions and Risk Assessment of the Natural Radionuclides in the Granitic Rocks from the Eastern Desert, Egypt. Minerals 2019, 9, 386. [Google Scholar] [CrossRef] [Green Version]
  44. Beretka, J.; Matthew, P.J. Natural radioactivity of Australian building materials, industrial wastes and by-products. Health Phys. 1985, 48, 87–95. [Google Scholar] [CrossRef]
  45. NEA-OECD. Exposure to Radiation from Natural Radioactivity in Building Materials; Report by NEA Group of Experts of the Nuclear Energy Agency; OECD: Paris, France, 1979. [Google Scholar]
  46. European Commission. Radiological protection principles concerning the natural radioactivity of building materials. Radiat. Prot. 1999, 112, 5–16. [Google Scholar]
  47. Khan, A.R.; Rafique, M.; Jabbar, A.; Rahman, S.U.; Shahzad, M.I.; Khan, M.E.; Yasin, M. Radionuclide concentrations in sand samples from riverbanks of Muzaffarabad, Azad Kashmir. Nucl. Sci. Tech. 2018, 29, 93. [Google Scholar] [CrossRef]
  48. ICRP. ICRP Publication 60: 1990 Recommendations of the International Commission on Radiological Protection; SAGE Publications: Southend Oaks, CA, USA, 1990. [Google Scholar]
  49. ICRP. ICRP Publication 65: Protection Against Radon-222 at Home and at Work; SAGE Publications: Southend Oaks, CA, USA, 1994. [Google Scholar]
  50. Papadopoulos, A.; Christofides, G.; Koroneos, A.; Papadopoulou, L.; Papastefanou, C.; Stoulos, S. Natural radioactivity and radiation index of the major plutonic bodies in Greece. J. Environ. Radioact. 2013, 124, 227–238. [Google Scholar] [CrossRef] [PubMed]
  51. Salaheldin, G.; Elhaddad, M.; Sidique, E. Radon concentration and exhalation rate for granitic rocks, Central Eastern Desert, Egypt. Arab. J. Geosci. 2022, 15, 1221. [Google Scholar] [CrossRef]
  52. UNSCEAR. Sources and Effects of Ionizing Radiation: UNSCEAR 1993 Report to the General Assembly, with Scientific Annexes; United Nations: New York, NY, USA, 1993.
  53. Qureshi, A.A.; Tariq, S.; Din, K.U.; Manzoor, S.; Calligaris, C.; Waheed, A. Evaluation of excessive lifetime cancer risk due to natural radioactivity in the rivers sediments of Northern Pakistan. J. Radiat. Res. Appl. Sci. 2014, 7, 438–447. [Google Scholar] [CrossRef]
Figure 1. U-238, Th-232 and K-40 concentrations in the investigated granites and ceramic tiles samples.
Sustainability 14 14611 g001
Figure 2. Comparison of the average values of U-238 (Ra-226), Th-232 and K-40 in the investigated ceramic and granites tiles to their corresponding GAVs in the building materials.
Sustainability 14 14611 g002
Figure 3. Contributions of the three radioisotopes, 238U, 232Th, and 40K, to the studied samples’ overall concentration.
Sustainability 14 14611 g003
Figure 4. The dendrogram for comparing the Egyptian granites and ceramic tiles investigated herein with those used in Egypt and other countries in terms of the natural radioactivity.
Sustainability 14 14611 g004
Figure 5. The radiological parameters showing the gamma impact from the ceramic and granite tiles of the brands under investigation.
Sustainability 14 14611 g005
Figure 6. The radiological parameters showing the Rn impact from the studied ceramic and granite tiles.
Sustainability 14 14611 g006
Figure 7. The dendrogram for exhibiting the relationship among the studied radiological variables of the granites and ceramic tiles under consideration.
Sustainability 14 14611 g007
Table 1. Granites and ceramic tiles of various brands used in Egypt.
Tiling MaterialBrand NameBrand IDSample SizeSample Origin
GraniteBianco HalayebGBiHa3Abu Ghusun, Red Sea, Egypt
Brown HurgadaGBrHu3Hurghada, Egypt
Imperial RedGIR3Aswan, South of Egypt
Karnak GreyGKG3Aswan, South of Egypt
Negro AswanGNA4Aswan, South of Egypt
Rosa Aswan DarkGRAD3Aswan, South of Egypt
Rosa El Hody LightGRHL3Aswan, South of Egypt
Rosa Abu SimbleGRAS4Wadi Halfa, Aswan, Egypt
Rosa Sardo SinaiGRSS3Sinai, Egypt
Red AswanGRA3Aswan, South of Egypt
Red NefertaryGRN4Aswan, South of Egypt
Red ForsanGRF3Wadi Forsan, northeastern Egypt
Yellow GhazalGYG3Sinai, Egypt
CeramicAlfaCAL76th of October City (2), Giza, Egypt
ArtCAR76th of October City (2), Giza, Egypt
CleopatraCCL510th of Ramadan City (1), Cairo, Egypt
Gemma (Al-Jawhara)CGE7El Sadat City Desert, Menoufia, Egypt
GloriaCGL6Nasr City, Cairo, Egypt
LabotieCLA610th of Ramadan City, Sharqia, Egypt
Pharaohs (Alfaraeina)CPH7Al Azbakeya, Cairo, Egypt
PrimaCPR75th Industrial zone, Menoufia, Egypt
RoyalCRO6Al Obour, Al Qalyubia, Egypt
VeneziaCVE76th of October City (2), Giza, Egypt
Table 2. Mean concentrations of 238U (226Ra), 232Th, and 40K (mean value ± standard error) in the investigated samples of the considered granite and ceramic brands, compared to their global average values (AGVs) in building materials.
Tiling MaterialBrand IDSample SizeActivity Concentration [Bq kg−1]
Ra-226Th-232K-40
RangeMean ± SERangeMean ± SERangeMean ± SE
GraniteGBiHa38.40–25.3716.95 ± 4.9011.62–86.7537.31 ± 24.73207.21–1260.66598.67±332.83
GBrHu375.12–101.2088.90 ± 7.5677.66–88.5382.05 ± 3.311631.50–1760.391695.38±37.21
GIR327.20–47.0535.93 ± 5.8544.37–52.0146.99 ± 2.511124.02–1500.221302.47±109.03
GKG348.81–69.4956.98 ± 6.3533.32–62.6645.38 ± 8.86516.76–678.58612.54±49.02
GNA421.65–48.8533.49 ± 5.8839.69–99.0662.28 ± 13.02827.73–1391.411044.82±125.30
GRAD340.01–55.7446.55 ± 4.7357.57–86.3273.44 ± 8.431045.65–1068.331060.42±7.39
GRHL335.98–67.0850.06 ± 9.1041.40–92.1165.34 ± 14.71771.84–1065.73925.86±85.13
GRAS421.13–67.0848.99 ± 10.1918.67–86.7151.89 ± 14.15350.61–1073.63817.88±166.70
GRSS3157.24–196.01174.55 ± 11.38122.33–140.32131.07 ± 5.201139.85–1411.171311.92±86.37
GRA315.31–28.1322.46 ± 3.7858.88–86.3269.42 ± 8.541128.03–1380.241267.88±74.09
GRN487.24–126.01100.37 ± 8.8242.37–116.8382.22 ± 19.521346.94–1785.781604.53±94.24
GRF335.03–64.7648.78 ± 8.6545.05–78.7163.70 ± 9.89962.71–1198.791067.69±69.39
GYG324.08–41.9233.48 ± 5.1717.74–79.2044.09 ± 18.28842.65–1291.411039.86±132.37
CeramicCAL719.65–54.9036.77 ± 4.1822.25–49.1036.59 ± 3.25268.80–580.00447.99±37.90
CAR727.67–72.4447.97 ± 5.8339.71–85.6758.16 ± 6.75141.01–967.61553.36±97.53
CCL533.67–50.2441.70 ± 3.3231.00–62.5641.93 ± 5.51314.01–508.89385.20±36.68
CGE733.25–58.8846.13 ± 4.1034.57–61.4848.98 ± 3.59332.64–667.11515.68±43.22
CGL626.41–42.6232.37 ± 2.6031.18–51.3138.88 ± 2.94318.72–480.82404.54±28.08
CLA628.05–41.5833.26 ± 2.2234.78–48.7541.87 ± 2.34407.88–719.45535.22±51.80
CPH720.50–44.1735.47 ± 3.0627.04–49.8238.96 ± 3.45230.25–565.65391.33±45.91
CPR723.11–46.8734.64 ± 3.1926.84–60.1744.59 ± 4.38354.45–606.42506.75±31.46
CRO631.46–53.7740.73 ± 3.6432.94–54.4741.58 ± 3.02222.48–467.20366.72±35.20
CVE726.40–39.6133.09 ± 1.9226.11–39.6332.96 ± 1.94206.35–317.18269.36±13.15
Total1078.40–196.0146.17 ± 2.8111.62–140.3251.65 ± 2.35141.01–1785.78701.62 ± 40.60
GAV (Global Average Value) UNSCEAR [52])---50---50---500
Table 3. The radioisotopes concentrations (present study) in comparison to other similar previous international research.
Tiling MaterialsCountries’ NamesConcentrations [Bq/kg]References
U-238Th-232K-40
GraniteTurkey45.4082.30931.60[1]
Saudi Arabia54.5043.40677.70[21]
Nigeria741001098[2]
China355.9317.91636.5[19]
Bangladesh49.5175.501122.15[22]
Italy81.331291065[23]
Iran3847917[18]
USA31611210[24]
Serbia200771280[9]
Pakistan6595981218[25]
Jordan41.5258.42897[26]
India821121908[27]
Brazil31731648[28]
Spain101481293[29]
Egypt6560885[30]
Egypt137821082[31]
Egypt15.2515.35399.39[38]
Egypt58.4665.761107.55Current study
CeramicTurkey43.537.9310.9[1]
Saudi Arabia47.1880.70590.2[21]
Nigeria8577877[2]
China172.35135.5351.4[19]
Algeria5541410[32]
Italy5242.5450[23]
Iran3227292[18]
India17.5238.93298.59[33]
Malaysia9268673[34]
Serbia6761828[9]
Yemen131.8883.55400.7[35]
Jordan33.8628.82411[26]
Japan82.763.9527[36]
Poland5050963[37]
Egypt5233450[30]
Egypt38.2342.54439.33Current study
Table 4. Ranges and mean values of the radiological parameters showing the gamma impact of the studied granite and ceramic brands.
Tiling MaterialBrand IDSample SizeParameters Showing Gamma Impact
Raeq [Bq/kg]IγDin [nGy/h]Ein [mSv/y]ELCR/103
GraniteGBiHa3(40.97–246.48)
116.39
(0.16–0.94)
0.44
(4.62–27.29)
13.00
(0.02–0.13)
0.06
(0.07–0.44)
0.21
GBrHu3(315.09–352.52)
336.77
(1.19–1.33)
1.27
(35.87–40.14)
38.43
(0.18–0.20)
0.19
(0.58–0.65)
0.62
GIR3(177.53–223.44)
203.42
(0.69–0.87)
0.79
(20.30–25.71)
23.39
(0.10–0.13)
0.11
(0.33–0.42)
0.38
GKG3(146.02–211.34)
169.04
(0.54–0.77)
0.62
(16.44–23.63)
19.07
(0.08–0.12)
0.09
(0.27–0.38)
0.31
GNA4(167.45–297.64)
202.99
(0.64–1.12)
0.77
(18.86–33.09)
22.77
(0.09–0.16)
0.11
(0.31–0.54)
0.37
GRAD3(208.47–261.36)
233.22
(0.79–0.97)
0.88
(23.58–29.02)
26.05
(0.12–0.14)
0.13
(0.38–0.47)
0.42
GRHL3(185.71–249.75)
214.78
(0.69–0.94)
0.80
(21.25–27.44)
24.04
(0.10–0.12)
0.12
(0.34–0.44)
0.39
GRAS4(100.68–271.20)
186.17
(0.37–1.00)
0.70
(11.62–30.18)
20.99
(0.06–0.15)
0.10
(0.19–0.49)
0.34
GRSS3(419.94–503.29)
463.00
(1.52–1.82)
1.67
(46.94–56.46)
51.89
(0.23–0.28)
0.25
(0.76–0.91)
0.84
GRA3(205.78–238.43)
219.35
(0.81–0.90)
0.84
(23.33–26.29)
24.59
(0.11–0.13)
0.12
(0.38–0.43)
0.40
GRN4(254.79–391.81)
341.48
(0.96–1.47)
1.28
(29.72–44.00)
38.96
(0.15–0.22)
0.19
(0.48–0.71)
0.63
GRF3(173.58–257.52)
222.08
(0.66–0.96)
0.84
(19.75–28.79)
25.02
(0.10–0.14)
0.12
(0.32–0.47)
0.41
GYG3(132.17–247.14)
176.59
(0.51–0.94)
0.68
(15.60–27.62)
20.17
(0.08–0.14)
0.10
(0.25–0.45)
0.33
CeramicCAL7(72.17–169.77)
123.58
(0.27–0.62)
0.45
(8.05–19.03)
13.83
(0.04–0.09)
0.07
(0.13–0.31)
0.22
CAR7(117.76–269.45)
173.75
(0.43–0.99)
0.64
(12.99–29.98)
19.21
(0.06–0.15)
0.09
(0.21–0.49)
0.31
CCL5(102.18–177.47)
131.31
(0.37–0.65)
0.48
(11.39–19.50)
14.57
(0.06–0.1)
0.07
(0.18–0.32)
0.24
CGE7(108.30–190.11)
155.88
(0.39–0.69)
0.57
(12.02–21.07)
17.34
(0.06–0.1)
0.09
(0.19–0.34)
0.28
CGL6(101.24–153.02)
119.11
(0.37–0.56)
0.44
(11.18–16.91)
13.21
(0.05–0.08)
0.06
(0.18–0.27)
0.21
CLA6(114.95–166.65)
134.34
(0.42–0.62)
0.50
(12.76–18.72)
14.99
(0.06–0.09)
0.07
(0.21–0.30)
0.24
CPH7(76.90–151.06)
121.31
(0.28–0.56)
0.44
(8.46–16.93)
13.47
(0.04–0.08)
0.07
(0.14–0.27)
0.22
CPR7(100.94–176.82)
137.43
(0.38–0.65)
0.51
(11.41–19.52)
15.27
(0.06–0.10)
0.07
(0.18–0.32)
0.25
CRO6(100.61–167.64)
128.42
(0.36–0.61)
0.47
(11.11–18.56)
14.23
(0.05–0.09)
0.07
(0.18–0.30)
0.23
CVE7(80.21–120.70)
100.96
(0.29–0.44)
0.36
(8.86–13.35)
11.17
(0.04–0.07)
0.05
(0.14–0.22)
0.18
Total107(40.97–503.29)
174.06
(0.16–1.82)
0.65
(4.62–56.46)
19.51
(0.02–0.28)
0.10
(0.07–0.91)
0.32
Allowable Value or GAV370 a2 b84 a or 70 b0.41 a or 1 b1.16 c
a GAV given by the UNSCEAR [3]. b GAV reported by the European Commission [46]. c GAV indicated by Sidique et al. [41] and Qureshi et al. [53].
Table 5. Ranges and mean values of the radiological parameters showing the Rn impact of the studied granite and ceramic brands.
Tiling MaterialBrand IDSample SizeIαRX [Bq/m2 h]Poor Ventilation Case Normal Ventilation Case
CRn [Bq/m3]ERn [mSv/y]CRn [Bq/m3]ERn [mSv/y]
GraniteGBiHa3(0.04–0.13)
0.08
(1.12–3.38)
2.26
(20.81–62.88)
42.01
(0.53–1.59)
1.06
(4.41–13.33)
8.91
(0.11–0.34)
0.22
GBrHu3(0.38–0.51)
0.44
(10.02–13.50)
11.86
(186.24–250.89)
220.39
(4.70–6.33)
5.56
(39.48–53.18)
46.72
(1.00–1.34)
1.18
GIR3(0.14–0.24)
0.18
(3.63–6.28)
4.79
(67.43–116.65)
89.09
(1.70–2.94)
2.25
(14.29–24.73)
18.88
(0.36–0.62)
0.48
GKG3(0.24–0.35)
0.28
(6.51–9.27)
7.60
(121.01–172.28)
141.27
(3.05–4.35)
3.57
(25.65–36.52)
29.95
(0.65–0.92)
0.76
GNA4(0.11–0.24)
0.17
(2.89–6.52)
4.47
(53.67–121.11)
83.02
(1.36–3.06)
2.10
(11.38–25.67)
17.60
(0.29–0.65)
0.44
GRAD3(0.20–0.28)
0.23
(5.34–7.43)
6.21
(99.19–138.19)
115.39
(2.50–3.49)
2.91
(21.03–29.29)
24.46
(0.53–0.74)
0.62
GRHL3(0.18–0.34)
0.25
(4.80–8.95)
6.68
(89.20–166.29)
124.10
(2.25–4.20)
3.13
(18.91–35.25)
26.31
(0.48–0.89)
0.66
GRAS4(0.11–0.34)
0.24
(2.82–8.95)
6.53
(52.38–166.29)
121.45
(1.32–4.20)
3.07
(11.10–35.25)
25.75
(0.28–0.89)
0.65
GRSS3(0.79–0.98)
0.87
(20.97–26.14)
23.28
(389.83–485.94)
432.75
(9.84–12.27)
10.93
(82.63–103.01)
91.73
(2.09–2.60)
2.32
GRA3(0.08–0.14)
0.11
(2.04–3.75)
3.00
(37.94–69.74)
55.67
(0.96–1.76)
1.41
(8.04–14.78)
11.80
(0.20–0.37)
0.30
GRN4(0.44–0.63)
0.50
(11.64–16.81)
13.39
(216.28–312.40)
248.83
(5.46–7.89)
6.28
(45.85–66.22)
52.75
(1.16–1.67)
1.34
GRF3(0.18–0.32)
0.24
(4.67–8.64)
6.51
(86.85–160.55)
120.93
(2.19–4.05)
3.05
(18.41–34.03)
25.63
(0.46–0.86)
0.65
GYG3(0.12–0.21)
0.17
(3.21–5.59)
4.47
(59.69–103.91)
83.00
(1.51–2.62)
2.10
(12.65–22.03)
17.59
(0.32–0.56)
0.44
CeramicCAL7(0.10–0.27)
0.18
(0.87–2.44)
1.63
(16.24–45.37)
30.38
(0.41–1.15)
0.77
(3.44–9.62)
6.44
(0.09–0.24)
0.16
CAR7(0.14–0.36)
0.24
(1.23–3.22)
2.13
(22.87–59.86)
39.64
(0.58–1.51)
1.00
(4.85–12.69)
8.40
(0.12–0.32)
0.21
CCL5(0.17–0.25)
0.21
(1.50–2.23)
1.85
(27.82–41.52)
34.46
(0.70–1.05)
0.87
(5.90–8.80)
7.30
(0.15–0.22)
0.18
CGE7(0.17–0.29)
0.23
(1.48–2.62)
2.05
(27.48–48.66)
38.12
(0.69–1.23)
0.96
(5.82–10.31)
8.08
(0.15–0.26)
0.20
CGL6(0.13–0.21)
0.16
(1.17–1.89)
1.44
(21.83–35.22)
26.75
(0.55–0.89)
0.68
(4.63–7.47)
5.67
(0.12–0.19)
0.14
CLA6(0.14–0.21)
0.17
(1.25–1.85)
1.48
(23.18–34.36)
27.48
(0.59–0.87)
0.69
(4.91–7.28)
5.83
(0.12–0.18)
0.15
CPH7(0.10–0.22)
0.18
(0.91–1.96)
1.58
(16.94–36.50)
29.31
(0.43–0.92)
0.74
(3.59–7.74)
6.21
(0.09–0.20)
0.16
CPR7(0.12–0.23)
0.17
(1.03–2.08)
1.54
(19.10–38.73)
28.63
(0.48–0.98)
0.72
(4.05–8.21)
6.07
(0.10–0.21)
0.15
CRO6(0.16–0.27)
0.20
(1.4–2.39)
1.81
(26.00–44.44)
33.66
(0.66–1.12)
0.85
(5.51–9.42)
7.13
(0.14–0.24)
0.18
CVE7(0.13–0.20)
0.17
(1.17–1.76)
1.47
(21.82–32.73)
27.35
(0.55–0.83)
0.69
(4.62–6.94)
5.80
(0.12–0.18)
0.15
Total107(0.04–0.98)
0.23
(0.87–26.14)
4.09
(16.24–485.94)
76.08
(0.41–12.27)
1.92
(3.44–103.01)
16.13
(0.09–2.60)
0.41
Allowable Value or GAV1 a57.6 b(100–300) c(3–10) a(100–300) c(3–10) a
a GAV reported by the ICRP [49]. b GAV declared by the UNSCEAR [3]. c GAV recommended by the WHO (World Health Organization) [8].
Publisher’s Note: MDPI stays neutral with regard to jurisdictional claims in published maps and institutional affiliations.

