Article

An ITS System for Reducing Congestion and Noise Pollution due to Vehicles to/from Port Terminals

1
Department of Civil and Industrial Engineering, University of Pisa, 56126 Pisa, Italy
2
AlgoWatt spa, 20123 Milano, Italy
*
Author to whom correspondence should be addressed.
Sustainability 2022, 14(21), 14579; https://doi.org/10.3390/su142114579
Submission received: 16 August 2022 / Revised: 31 October 2022 / Accepted: 1 November 2022 / Published: 6 November 2022
(This article belongs to the Collection Sustainable Maritime Policy and Management)

Abstract

:
This paper deals with a new ITS system aimed at reducing road congestion and noise emissions on the urban roads leading to port terminals. This system is composed of: traffic video cameras, VMS panels and an app. These three components are connected and managed by an integrated ITS system management platform, called “LIST Port ITS System Central” in this paper. Video cameras measure traffic characteristics, such as flow rates, speed and composition of the vehicle stream and provide these data to the LIST Port ITS System Central. The central elaborates the data and provide the traffic flow characteristics to the app. The app calculates, in real time, the best route to/from port terminals, according to traffic congestion and noise emissions, and provides this information to the Central. Then, the app shows to the user the best route and the traffic and noise status in real time. The calculation of the best routes takes place according to the “physical capacity” and “acoustic capacity” of road infrastructures. Noise emissions are directly calculated from traffic characteristics by means of the CNOSSOS-EU model, and are after compared to the noise emission limit levels established by law. The services provided by the LIST Port ITS system are new, because, currently, routing strategies are usually based only on congestion, while noise pollution is almost always neglected. Noise pollution could be a more restrictive constraint because the “acoustic capacity” is often lower than the physical one.

1. Introduction

Maritime transport is becoming more and more important for long distance freight transport in the global market (Abioye et al. [1]). As a result, port efficiency is a key aspect for the international trade. A limited port efficiency may result in disruptions in vessel schedules, which often are hard to recover or require container diversions. Elmi et al. [2] suggest that the main causes of disruptions are: congestion, strikes, meteorological conditions and custom delays. However, as reported in Dulebenets [3], the development of alliances among the main container operators allows to reduce costs and optimize vessel schedules. These studies concern in particular maritime container transport: as shown in Lupi et al. [4], containers are the most important freight typology for port ranking. Operational efficiency is one of the most important choice criteria for maritime carriers. According to Bastug et al. [5]) port managers consider as most important: port localization, level of services, tariffs and port facilities. Port operational efficiency is often strongly affected by the connectivity of port terminals to major roads and rail infrastructures. Ports are very often located in urban areas, therefore roads to/from port terminals are usually very congested and record a high environmental impact from the point of view of both atmospheric pollutants and noise emissions. Several studies have been performed to reduce the atmospheric pollutant emissions due to both roads and ships (Romano et al. [6]), while the ways to reduce noise emissions are very often neglected.
This paper deals with the development of an ITS system (Intelligent Transport System), aimed at reducing congestion and noise emissions on the urban roads leading to port terminals.
A large number of ITS systems has been developed in recent years. Several ones provide scheduled or real time information of only public transport (Ambrosino and Gini [7]), while others show also road congestion and availability of parking spaces. One of the purposes of ITS systems is to achieve a greater modal shift of users from private car to more sustainable transport modes (Surdonja et al. [8]). In addition, they are often an essential urban planning tool at the disposal of city mobility managers. Usually ITS systems are related to urban areas, more rarely they cover also rural zones (Barreto et al. [9]).
Some ITS systems are aimed at reducing congestion and road transport incidentality (Celidonio et al. [10], Astarita et al. [11], Meschini and Gentile [12]). Real time data about traffic, incidentality, or public transport are easily available thanks to the improvement of satellite-based geomatic techniques which allow to know, instant by instant, the position of each vehicle, as well as its speed (Boccardo et al. [13]).
ITS systems are more easily available to users thanks to the development of smartphones (Brazil and Caulfield [14]). As reported in Astarita et al. ([11,15]), smartphones allow to provide mobility information by means of an app, easily available to the users at any time, especially while travelling: this is important especially in case of disruptions (road closures, congestion, delays in public transport means). Moreover, smartphones always embed a GPS sensor, therefore they also play the role of detectors for the users position and speed.
In this paper, a new ITS system is presented which aims at reducing traffic congestion and noise pollution due to vehicles to/from port terminals. This ITS system provides the users with the best route to/from the port, from the point of view of both traffic congestion and noise pollution. As regards noise pollution, the best route choice is based on the acoustic capacity concept which will be described in the following of the paper.
The originality of the proposed ITS system relies on the fact that the existing info-mobility apps always take into consideration only road congestion, while noise pollution, which has a relevant impact on the livability of the urban environment, is almost always completely neglected.
The ITS system, here described, has been developed within the European project LIST Port (“Limitazione Inquinamento Sonoro da Traffico nei Porti commerciali”) (in French: “Limitation du traffic sonore dans les ports commerciaux”) [16], funded by the Italy-France Maritime Interreg Programme 2014–2020, for the four cities / ports involved in the project: Piombino (Italy, Tuscany region), Olbia (Italy, Sardinia region), Vado Ligure (Italy, Liguria region) and Bastia (France, Corsica region).
The proposed ITS system is composed of two subsystems:
  • A first sub-system formed by VMS (Variable Message Signs) and traffic sensors (cameras or inductive loops);
  • An app for mobile devices, such as smartphones and tablets.
These two sub-systems are connected together by the LIST Port ITS System Central, in particular the Central connects: the VMS panels with the traffic sensors (cameras or inductive loops); the subsystem VMS/traffic sensors with the app.
The LIST Port ITS System Central collects the traffic data coming from traffic sensors (videocameras or inductive loops), processes them, and provides this information to the app. The app calculates the noise emissions by using the CNOSSOS-EU (Common noise assessment methods in Europe) model. The choice of the best route, among a set of “good” possible ones, is carried out taking into account both road congestion and noise emissions. After, the app provides the route information to the LIST Port ITS System Central, which in turn chooses the information to be displayed by VMS panels.
Info mobility ITS systems are widely used, as described at the beginning of this introduction. However, to the authors knowledge, none of the existing ITS systems are capable of calculating noise emissions in real time from traffic data alone and of determining the user optimal paths according to noise pollution. This is a shortcoming of existing ITS systems because, as shown in Lupi et al. [17], acoustic capacity is often lower than the physical one, therefore a road could be not yet congested but noise emissions could be greater than the tolerance thresholds established by the legislation.
The paper is organized as follows.
In Section 2, a literature review is provided, about the main characteristics of info-mobility systems currently in operation and about the existing European and Italian legislation in the field of noise pollution. In Section 3, the architecture of the ITS system is presented. In addition, the acoustic capacity concept is described, as well as the algorithms used by the app to determine noise emissions. In Section 4, the app GUI is shown. Discussions and conclusions follow.

2. Literature Review

In this section, at first an overview of the most important info-mobility apps for road transport is presented. After, the main input data of the proposed methodology, as well as the existing laws which regulate noise emissions and immissions, are presented.

2.1. Info Mobility App Features and Barries to the Development

Info mobility ITS systems are designed to provide information and advice to the users in two main phases (Ambrosino [18]): pre-trip, that is before the beginning of the travel; and on-trip, that is during the travel. Pre-trip information helps users in planning their trip, while on-trip information helps users to reorganize their trip in case of delays or severe disruptions. As regards pre-trip information, the services provided to the users involve road traffic and public transport information. As regards on-trip information, besides road traffic and public transport, an ITS system could inform users also about the available spaces at city parkings.
In Casquero et al. [19] an overview of the main features of info mobility apps is presented. According to these authors, the main purpose of such apps should be to encourage users to a modal shift from private car towards more sustainable transport modes. Info-mobility apps are characterized by two types of features: user centered ones and persuasive ones. The most important user-centered features concern not only real time information about traffic congestion, but also online reservation and ticketing and specific services for aged or mobility impaired people. Persuasive features instead are aimed at convincing users to employ sustainable transport modes for their trips. The most common persuasive features include rewarding systems and social competitions, and information on the environmental footprint of the user travel behaviour.
In Zhao et al. [20], the main barriers to Mobility-as-a-Service (MaaS) platforms have been investigated, at the individual, organizational and social levels. Some barriers concern the deficiencies in the interaction among the various ITS platforms in operation at a given city: consequently it is not often possible to achieve real time information of some transport services. Other barriers instead regard the lack of synchronization between the user needs and the services provided by the platform, or the platform is simply unknown to the great majority of citizens.
Karlsson et al. [21] carried out another relevant study on barriers and enabling factors of the MaaS platform development and implementation. The analysis was performed at three different levels: macro, meso and micro. The macro level embraces broader social and political factors, at national scale: legislation and norms, taxation and subsidies. The meso level is comprised of private actors and various public organizations at local scale, such as public transport authorities and municipal planning departments. In the micro level, the individual perspective is at centre stage.
At the macro level, MaaS barriers and enabling factors include: legislation concerning transport, innovation policies of the national public administration. At the meso level, the presence or lack of appropriate cultures of collaboration among the various stakeholders was identified as significant factors, especially as regards the availability and integration of data provided by the app. At the micro level, people attitudes and mobility habits were recognised as important factors to be considered.
Karlsson et al. [21] provide the following suggestions for the development of effective MaaS platforms: law-making authorities should provide transport-related subsidies or taxation policies; regional and local authorities should improve the quality of road and rail infrastructures and the level of service of public transport.
Lopez-Carreiro et al. [22] investigate which services should be offered by MaaS technologies to provide travellers with tailored mobility solutions that satisfy their daily needs. This study was conducted in the metropolitan area of Madrid. The analysis shows that the following services are the most essential: route optimization; provision of real-time information about: pedestrian flows, road traffic congestion, pollution levels, road conditions and urban security.
It should be noted that noise pollution is always neglected in all the above-mentioned studies.

2.1.1. Some ICT System Examples for Traffic Management and Information in Cities and Surrounding Areas

A lot of apps are currently in operation all over the word. The majority of the ITS systems provide multimodal information about public mode of transport or bike mode of transport. ITS systems providing information about road private transport are less frequent.
In Berlin, a traffic management and information service, called VMZ (Verkehr Mobilität Zukunft) [23] is operational since 2000, which provides real time information on public and private transport. As regards private transport, VMZ relies on a set of solar powered sensors and about 100 videocameras, located in the most critical points of Berlin network. As regards public transport, VMZ gathers real time data from GPS sensors, placed in buses and urban trains. The VMZ system provides the information to the users by means of an app and by several VMS, located in the most important roads and placed at all bus stops.
In New York (U.S.), the 511NY App, offered by the New York State Department of Transportation, is the official source of traffic and travel information for the New York State [24]. The 511NY app provides real-time information about both traffic and public transport services. In addition, the app provides information on available parking slots in the most important parking sites of New York.
In Stockholm (Sweden), the ICT system, called “Trafiken in Stockholm”, provides real time traffic information and road closures [25]. The Stockholm ITS system gathers the data from 300 traffic cameras located all around the territory.
In Abu Dhabi (UAE), an Abu Dhabi Integrated Transport Centre (ITC) has been developed. Information is provided to users by means of an app called Darbi Mobile [26]. The Abu Dhabi ITC and Darbi Mobile cover the entire territory of the Abu Dhabi emirate.
Darbi Mobile provides real time information on traffic and road closures and on urban public transport. Furthermore, it shows real time information on air services at the Abu Dhabi airport and ferry services at the Abu Dhabi port. Finally, it allows to call a taxi by simply pressing a button on the app.
The app “Muoversi In Toscana” is one of the most important ITS systems in Tuscany region (Italy) and is constantly improving the quality of services provided to the users [27]. “Muoversi in Toscana” is more focused on public transport services than private car traffic, but provides also real time information about road congestion, retrieved form Google Maps. As regards to public transport services, and bike transport, “Muoversi in Toscana” provides the best multimodal path; in addition it provides the scheduled bus and train services and the real time information of buses for only the city of Firenze. In addition, it provides real time information on ferry services at the ports of Livorno, Piombino and Elba Island and on air services at the airports of Pisa and Firenze.
Another example of ITS systems for road transport concerns the traffic control and supervision system for the urban area of Catania: this system has been designed in Torrisi et al. [28], but has never been applied in the field. However, it appears as the most relevant as regards the quality of service provided to the users.
The Catania ITS system receives real-time traffic data not only from fixed radar sensors but also from Floating Car Data (FCD): a technique that has become increasingly popular in Italy for the construction also of Origin-Destination demand matrices. Thanks to FCDs, the Catania system can simulate in real time the state of the entire network, including the links not equipped with sensors. The real time traffic information is provided to users by means of an app and VMS panels, similarly to the LIST Port ITS system. The users are provided not only with the information of the current state of the network, but also with the best path, from an origin to a destination, according not only to road congestion but also to atmospheric pollution.
In synthesis, the most important features of Catania system are: the capability to forecast the demand, and thus to predict the occurrence of congestion; the path optimization taking into account also to atmospheric pollutant emissions. However, noise pollution is completely neglected.
Finally, numerous apps tailored to public mode of transport in urban areas exist: a few of them provide also some information on private transport, for example, availability of parking spaces. Other apps provide information instead on taxi, car sharing and bike sharing services. An overview of such apps falls outside the scope of this paper; however, a few examples of them are provided below.
One of the most important info mobility platform in Italy is myCicero [29], developed in 2015 and currently covering the majority of the Italian cities. It is an app for android and iOS, which provides information on parking spaces, local trains, buses and metros in several Italian municipalities, not only cities but also large touristic villages. MyCicero allows to pay the parking ticket directly from the app, as well as local buses and underground tickets.
Another relevant app is WienMobil, which provides information not only about buses, trains and metro, but also taxi, car sharing and bike sharing services.
Finally, CityMapper [30] provides information on public transport and on the best route by car in several cities in Europe, in America and in Asia. However, the information on the best route by private transport is not accurate, as the best path and the travel time are calculated only for the uncongested situation.
Other apps, which concern only road transport, and cover the entire Italian territory, are Via Michelin [31] and Infoblu [32].
Via Michelin provides also information on hotels, restaurant and touristic sites, but the traffic information is not in real time.
Infoblu is provided by Autostrade per l’Italia, the main Italian motorways managing company. It shows traffic information in real time in all motorways and in the most important urban areas and suggests real time routing basing on traffic congestion. Real time data are provided by the videocameras installed in the Italian motorway network and in the most important Italian municipalities.

2.1.2. The Google Maps Navigator

One of the most important infomobility systems, at the world level, is Google Maps. In Europe Google Maps is the most used info-mobility system for road transport, in particular it provides real time information on traffic and road closures. Google Maps receives real time traffic information from people’s smartphones, which are all equipped with a GPS sensor. The GPS satellite system allows to determine not only the exact position of people (latitude, longitude and elevation), but also their speed (Mehta et al. [33]). The state of congestion of the links is determined according to the speeds of the people, travelling on the given link, calculated by the GPS satellite system.
Google Maps provides also a routing service, that is the best path, from a given origin to a given destination, either by car or by public transport. The shortest path by car is calculated by means of a heuristic algorithm, called A*, which is a “modified” Dijkstra algorithm: in a very large network, Dijkstra requires several computation time , therefore A* allows to obtain a “very good” (but not optimal) path in a very short computation time. The best path is calculated by Google Maps considering the travel times of the links in real time, basing on the current state of congestion (Mehta et al. [33]).

2.2. The Main Regulations and Models for the Assessment of the Acoustic Capacity of a Road Infrastructure

2.2.1. The Main Regulations Currently in Force

The proposed methodology, in the LIST Port project, has been applied to the Italian and European scenarios. However, the proposed methodology has a global validity.
The Italian and European laws are herewith briefly presented: an entire overview of the European and Italian legislation is provided in Lupi et al. [17]. In this section, only the most important laws, for the acoustic capacity determination, are recalled.
The earliest general concepts and methods in the acoustic road field have been introduced by the Guide du Bruit of 1980 [34]: this French standard, recognized in all Europe, provides detailed information on the ways to measure noise emissions and immissions and on receiver positions that have been after confirmed by the most recent laws.
The main general concepts on acoustic pollution in Italy have been introduced by the so-called “framework law” about acoustic pollution, namely the Law no. 447 of 1995 [35], and in Europe by the EU Directive 2002/49/CE [36] (also known as the “Environmental Noise Directive”).
The Italian framework law no. 447/95 [35] and the Italian DPCM 14/11/1997 [37] propose two limit values, one for noise emissions and the other one for noise immissions:
  • Limit value for noise emissions: it is the maximum value of the sound pressure level (expressed in dB(A)), emitted only by the given source, measured at a receiver point, placed at 7.5 m of horizontal distance from the source: see the European Commission Recommendation of 6/8/2003 [38] (Section 3.1.1, page L212/58). The receiver height is 1.2 m above the road surface, according to the Recommendation [38], or 1.5 m, according to the UNI standard no. 11143 of 2005 [39]. The position of the receiver specified by the Recommendation of 2003 [38] has been initially suggested by the French Guide du Bruit of 1980 [34]. Noise emission limit values, in Italy, are established by the DPCM 14/11/1997 [37].
  • Limit value for noise immissions: it is the maximum value of the sound pressure level (expressed in dB(A)), measured at a given receiver point, immitted by all noise sources present in the environment. The limit value of noise immission must be measured close to the most sensible receiver:
    In the “range of acoustic pertinence” of the road infrastructure; the width of the “range of acoustic pertinence” and the related limit values are established, in Italy, by the DPR (Decree of the President of the Republic) n° 142/2004 [40].
    outside the “range of acoustic pertinence”: the related limit values are established, in Italy, by the DPCM (Decree of the President of the Council of Ministers) 14/11/1997 [37].
The position of the receiver for the calculation of noise immissions has been defined: by the DM 16th March 1998, of the Italian Ministry of Environment [41], and by the European Commission Recommendation of 6/8/2003 [38]. The receiver must be placed at 1 m in horizontal from the most exposed façade of the buildings, and at an height of 4 ± 0.2 m from the ground.
The limit values are expressed as equivalent sound pressure levels: that is, given a fluctuating noise, in a given period of measure T, the equivalent sound pressure level is calculated, and it is compared with the limit values. The equivalent sound pressure level, of a noise variable over time in a given period T, is the constant sound pressure level having the same energy as the variable noise (Guide du Bruit [34]).
The EU Directive 2002/49/CE [36] (the European “Environmental Noise Directive”) defines the “acoustic descriptor day-evening-night”, Lden, as in Equation (1):
L d e n = 10 · l g 1 24 ( 12 · 10 L d a y 10 + 4 · 10 L e v e n i n g + 5 10 + 8 · 10 L n i g h t + 10 10 )
The calculation method of the acoustic descriptors Lden, Lday, Levening and Lnight has been provided by the European Union Directive no. 2015/996/EU of 2015 [42], adopted in Italy by the Legislative Decree no. 42 of 17 February 2017 [43]. The calculation method consists of the CNOSSOS-EU model [42], described in the following section.

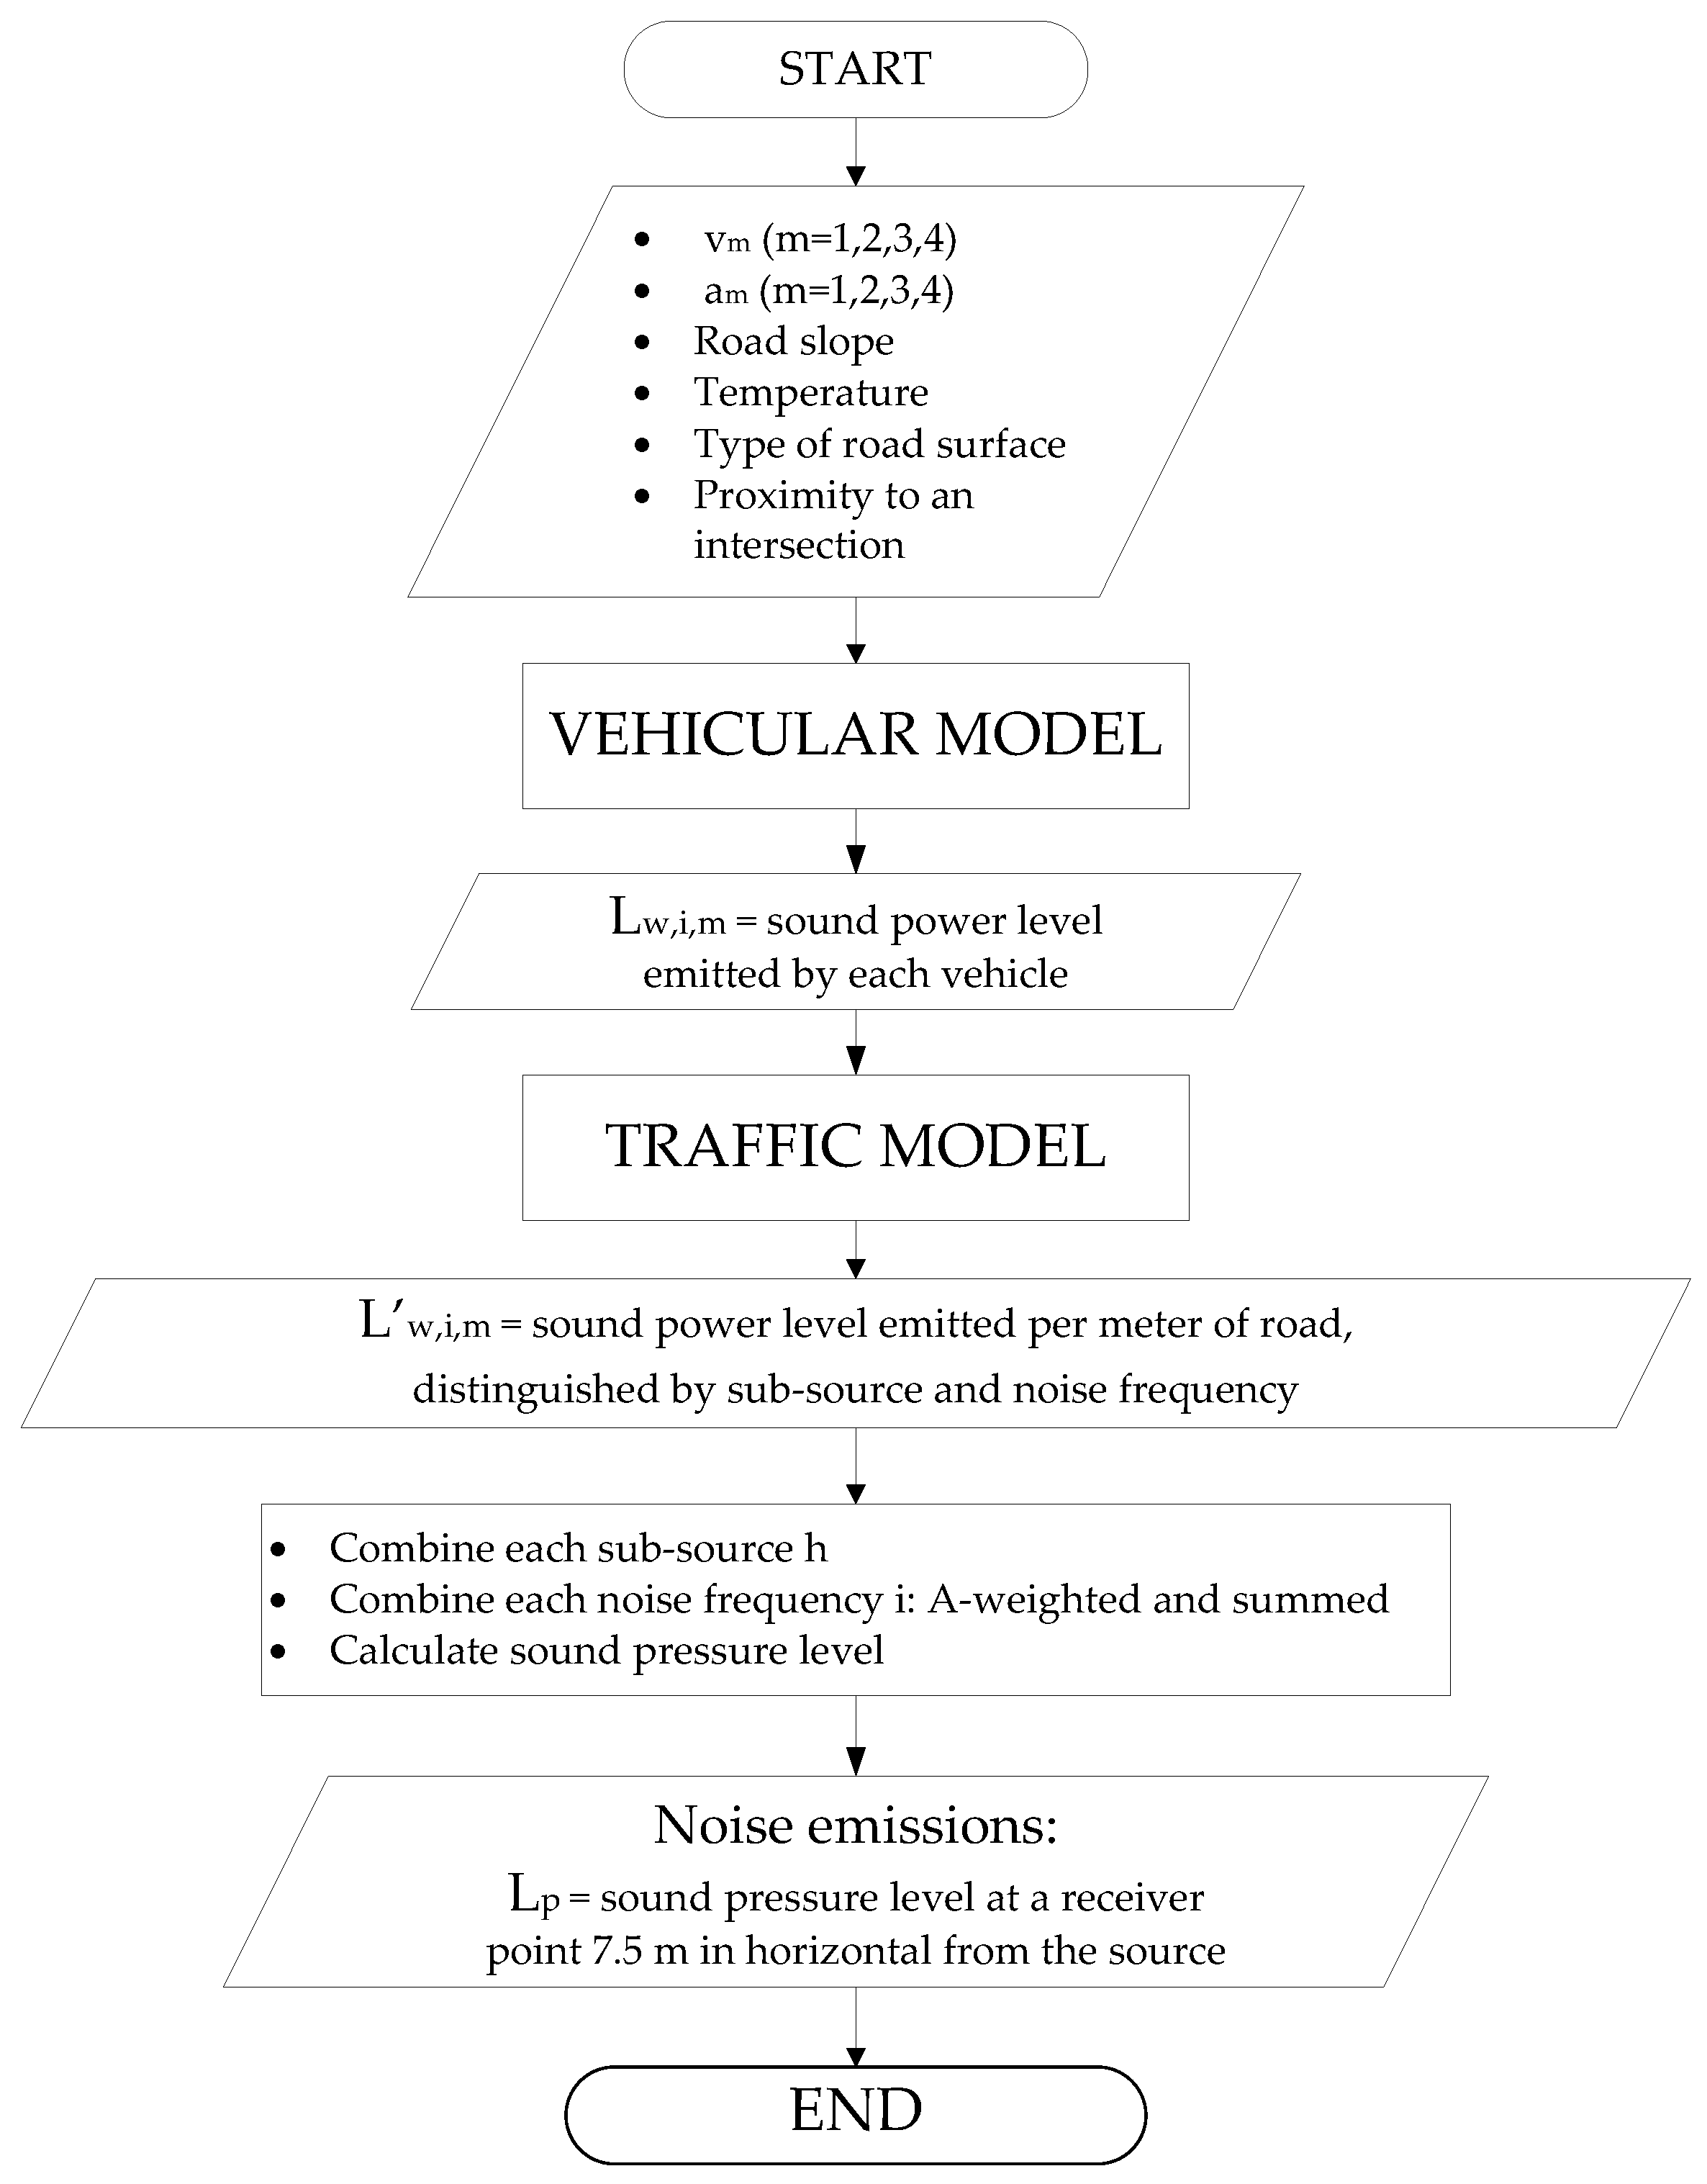
2.2.2. The CNOSSOS-EU Noise Emission Model

In the app presented in this paper the CNOSSOS-EU model has been used for the modelling of noise emissions. The CNOSSOS-EU model is substantially the Harmonoise model simplified in several parts.
The Harmonoise model is described in Nota et al. [44] and Salomons et al [45]. The CNOSSOS-EU model is described in detail in the European Commission directive 2015/996 of 19 May 2015 (European Commission [42]).
The CNOSSOS-EU noise emission model consists of two models in sequence: the vehicular model and the traffic model.
The vehicular model receives in input the average speed and acceleration and the flow rates for each vehicle category, and calculates the sound power emitted by each single vehicle.
The sound power emissions by each vehicle are the input of the traffic model which calculates the sound power level emitted per meter of length of the vehicular stream.

The CNOSSOS-EU Vehicular Model

In the CNOSSOS-EU vehicular model, vehicles are grouped into five different categories:
  • Category 1: light motor vehicles;
  • Category 2: medium heavy vehicles;
  • Category 3: heavy vehicles;
  • Category 4: powered two-wheelers, divided in: 4a: mopeds, and 4b: powerful motorcycles;
  • Category 5: currently it is empty, it has been established for future vehicle categories, with very different characteristics from the existing ones: for example, automated (driverless) vehicles.
Powered two-wheelers have been divided in two separate subclasses, mopeds and more powerful motorcycles, since their noise emissions are very different.
In CNOSSOS-EU model, different equations are provided for the categories m = 1, 2, 3, 4a, 4b. No equations are provided for category 5 as it is currently empty. See table 2.2.a, page 6 of the EU Commission Directive no. 996/2015 [42].
In the CNOSSOS-EU model, each vehicle has been modelized with only one point source, located at 5 cm of height from the ground. This is a strong simplification respect to the “original” Harmonoise model: the Harmonoise model considered three sub-sources, located respectively at 1 cm, 30 cm and 75 cm above the ground.
Detailed equations to calculate Lw,m, that is the sound power level emitted by each vehicle of category m, are reported in EU Commission Directive no. 996/2015 [42], pages 8–12.
The CNOSSOS-EU vehicular model is easier to implement than the Harmonoise one. Firstly, CNOSSOS-EU modelizes a vehicle with only one source, while Harmonoise considers three sub-sources, at different heights. In addition, in CNOSSOS-EU the various parameters are listed in tables, while in the Harmonoise model are calculated by means of formulas of difficult implementation in an informatic code.
Furthermore, the CNOSSOS-EU vehicular model, in some parts, is more sophisticated than the Harmonoise one. For example, the calculation of noise emissions of two-wheelers is more accurate than in the Harmonoise model: actually in the Harmonoise model two-wheelers were not considered separately but assimilated to light vehicles (class m = 1).
However, while the “classical” Harmonoise model has been implemented in some transport planning or simulation softwares, such as SUMO (Simulation of Urban MObility), the CNOSSOS-EU model has been implemented only in professional softwares of acoustic practitioners (such as iNoise Predictor), and not yet in any transportation software. In addition, the CNOSSOS-EU model, but also the Harmonoise one, has been never implemented in an app for route choice in real time as in the app presented in this paper.

The CNOSSOS-EU Traffic Model

The CNOSSOS-EU traffic model is the same as the Harmonoise one, described in Lupi et al. [17].

3. Materials and Methods: The Architecture of the LIST Port ITS System and of the App

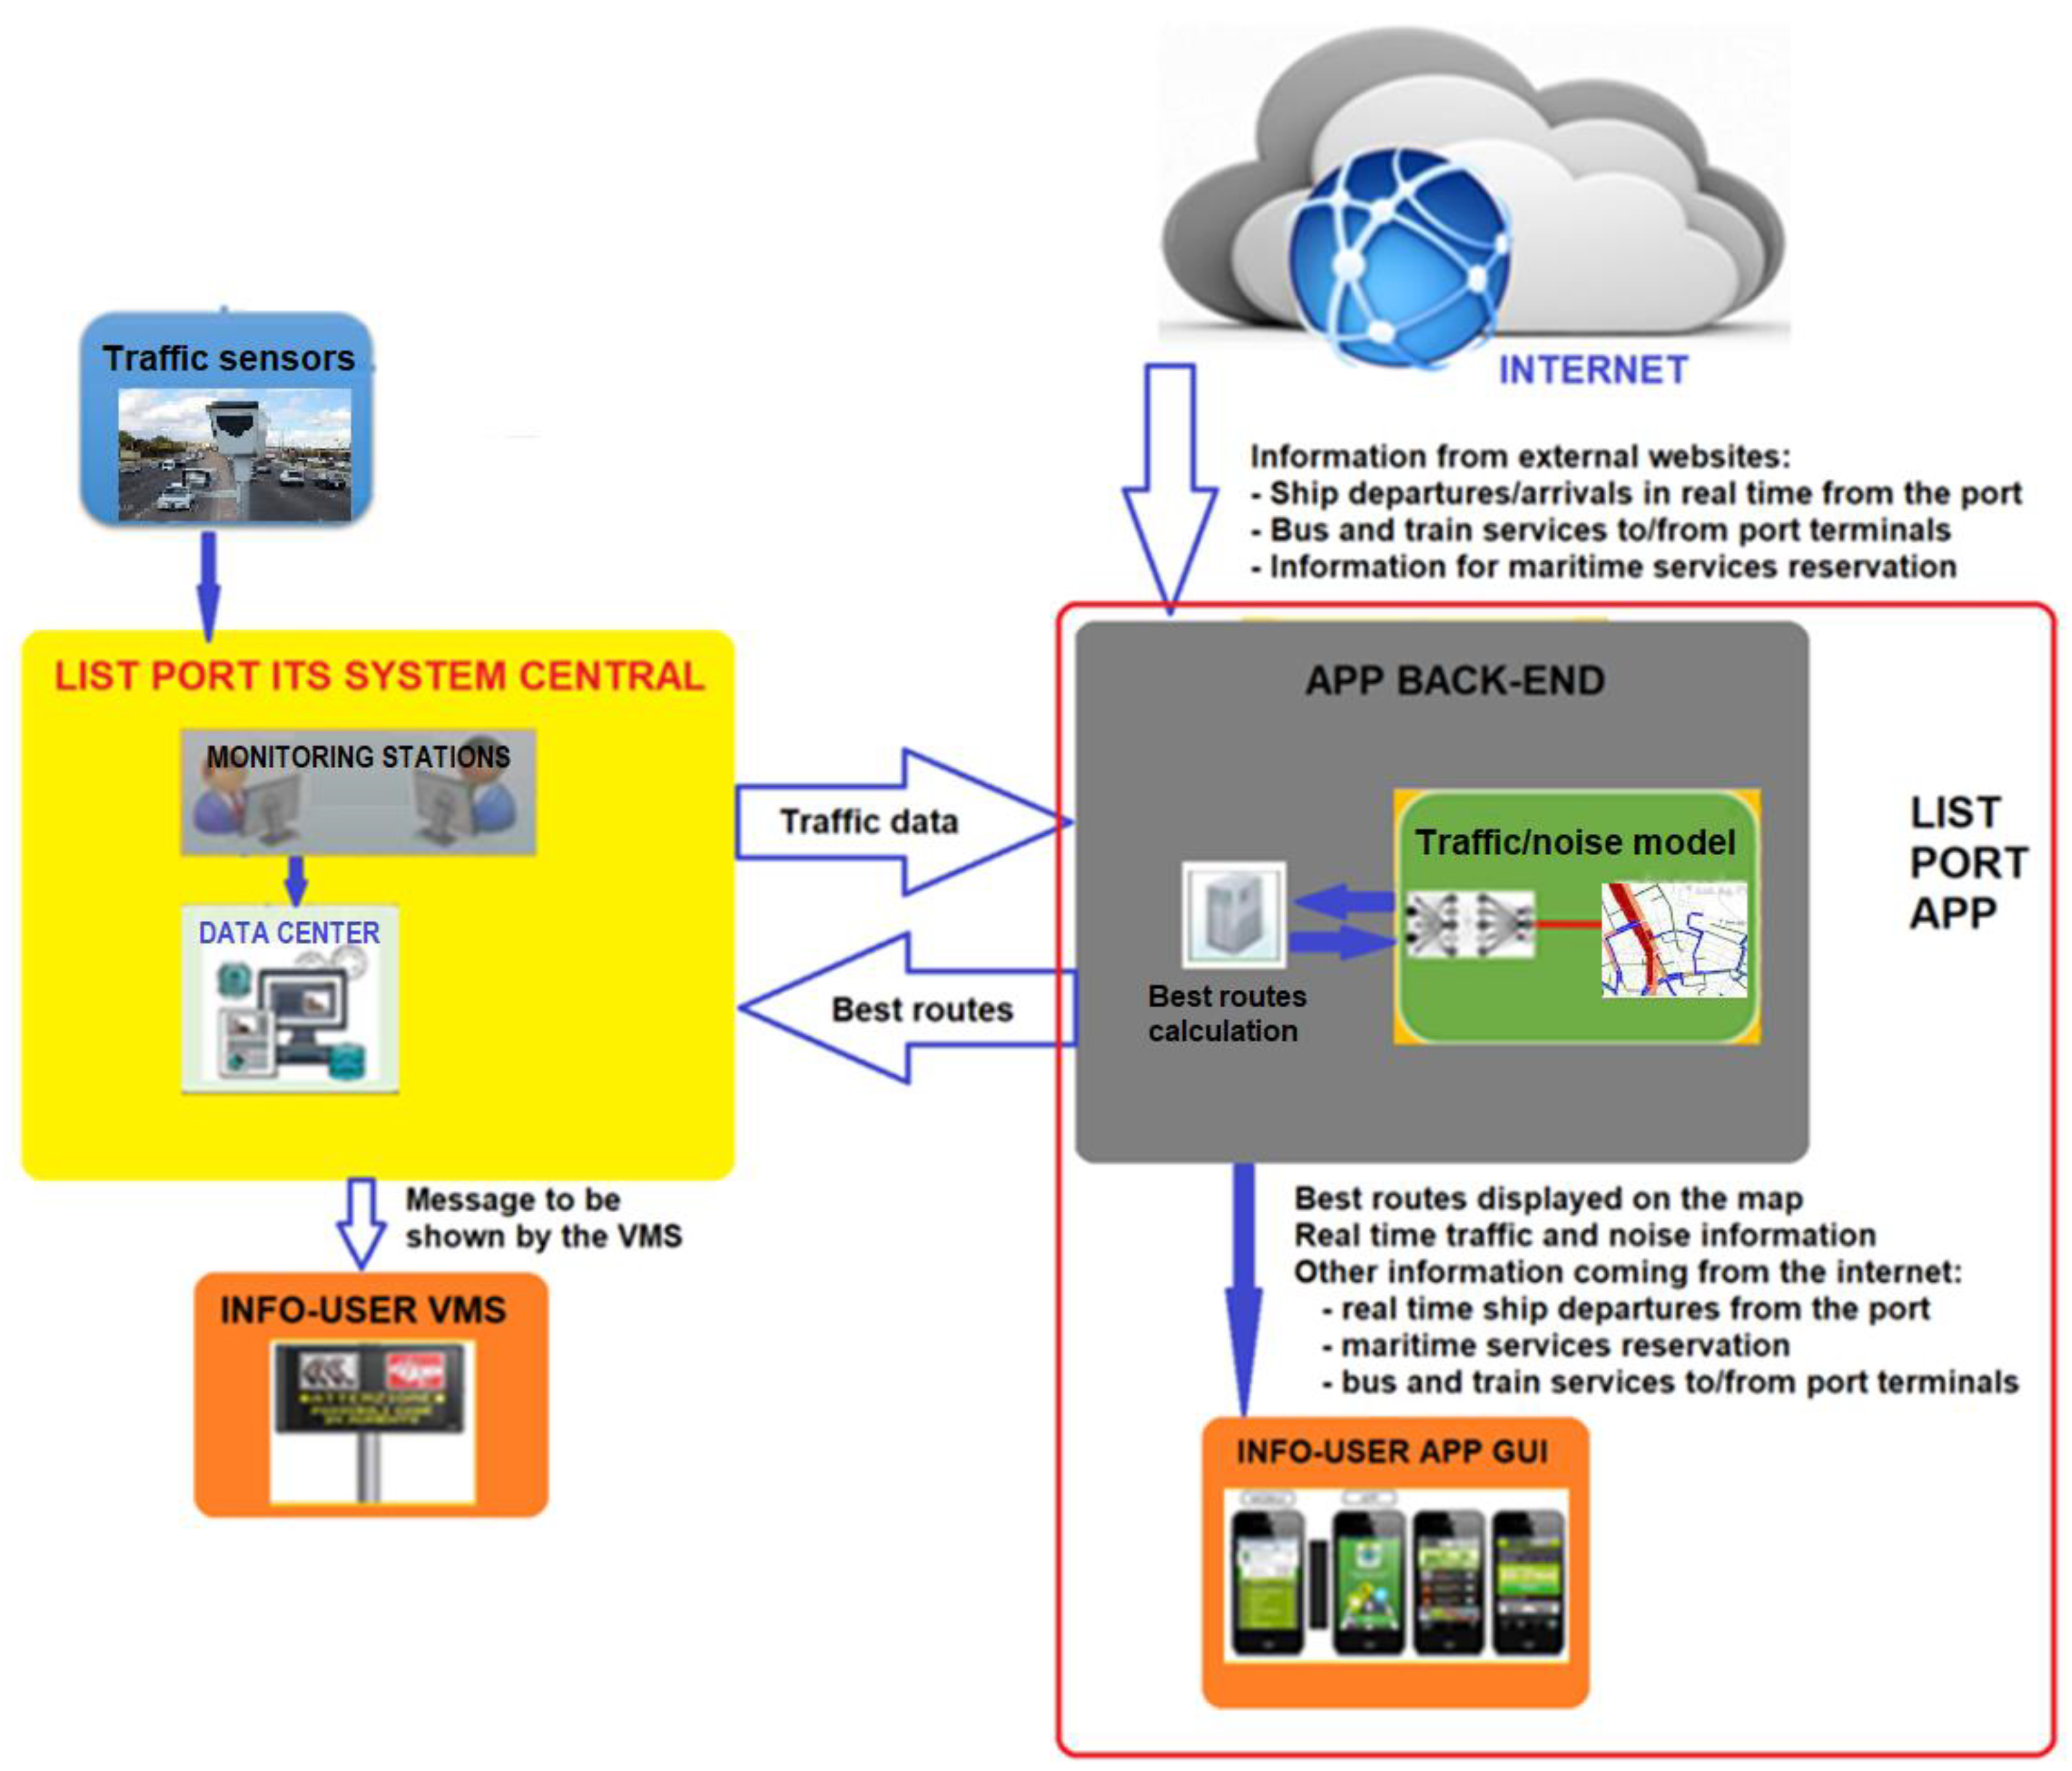
3.1. The Architecture of the Overall ITS System

As reported in the introduction, the proposed LIST Port ITS system is composed of two subsystems:
  • The sub-system formed by VMS (Variable Message Signs) and traffic sensors (cameras or inductive loops).
  • An app for mobile devices such as smartphones and tablets.
The VMS are installed in specific points of the road network, they provide routing indications (in textual and graphic form) about the access and the outflow routes to/from port terminals. The VMS system is integrated with traffic sensors, that is video cameras (in Piombino, Vado Ligure and Bastia) or inductive loops (in Olbia), which detect, in specific points of the urban area, traffic flow characteristics such as: flow rates; speed and acceleration of the traffic streams; traffic stream composition, i.e. percentage of: cars, motorcycles, medium-heavy vehicles, heavy vehicles. This information is necessary for the calculation of noise pollution by means of the CNOSSOS-EU model.
The app provides to the users, before and during the journey, information such as those displayed by VMS panels. The app is also complementary to VMS, because: VMS provide punctual information, while the app provides the entire routes from outside the urban area to the port terminal and return. The app is composed of: the app GUI (Graphical User Interface), which is the part of the app interacting with the user; and the app back-end which comprises all the modules necessary for the app functioning.
These two sub-systems are connected together by the LIST Port ITS System Central which in particular interconnects together VMS panels and traffic sensors (cameras or inductive loops) and the subsystem VMS / traffic sensors with the app.
The best route, to/from port terminals, is chosen by the app (in particular by the app back-end), among a set of predefined routes leading to the port terminal.
The choice of the best route, within the set of predefined routes, is performed by the app back-end in real time according to two criteria:
  • Road congestion. Traffic sensors installed in appropriate points of the road network measure in real time: the speed and the acceleration of each vehicle; flow rates distinguished by vehicle category (light vehicles, motorcycles, medium-heavy vehicles, heavy vehicles).
  • Noise pollution. This is calculated from the traffic flow parameters using the CNOSSOS-EU model.
The first criterion is based on the “physical capacity” concept, while the second one is based on the “acoustic capacity” concept that has been introduced in Lupi et al. [17]. The first criterion prevents the occurrence of road congestion which results in long queues and in the increase of travel times of road transport users. The second criterion prevents relevant impacts on the health of citizens (which are non-users of the road infrastructure).
The architecture of the overall LIST Port ITS system is represented in a schematic way in Figure 1. Briefly, the operation of the system, shown in the figure, can be described as follows.
The LIST Port ITS System Central collects the traffic data coming from traffic sensors (videocameras or inductive loops), processes them through the data centre and provides this information to the app.
The app calculates the noise emissions by using the CNOSSOS-EU model, and according to noise and traffic data, chooses the best route, among the set of “good” possible ones. Finally the app provides the route information to the LIST Port ITS System Central, which in turn chooses the information to be displayed by VMS panels.
As it was reported in the introduction the info mobility ITS systems are widely used, however, to the authors knowledge, none of the existing ITS systems are capable of calculating noise emissions in real time from traffic data alone and of determining the user optimal paths according to noise pollution.
Finally, the app provides a set of personalized information to the user, which are different in the four scenarios under study, and respond to the specific user needs. For example, in the case study of Piombino, ferry services to the Elba Island sometimes experience cancellations or delays causing high congestion on the access way to the port terminal. As a result, the app provides to the users the information of ship arrivals and departures in real time. In addition, the app redirects to the reservation page of ferry operators: therefore the user can make their booking without the need to access to the port terminal.
The overall architecture of the ITS system of the LIST Port project is shown in Figure 2. The main ITS components are:
  • The LIST Port ITS System Central, shown in Figure 2. by the orange rectangle, which is the “intermediary” between the LIST Port app back-end and the traffic video cameras and VMS panels;
  • The app GUI, circled by the dashed blue rectangle in Figure 2, which consists of an executable code (APK for android version, ipa for IOS version);
  • The LIST Port app back end, circled by the red rectangle in Figure 2, which is formed by myMaaS emiXer (circled by the blue rectangle) and by the two additional modules represented by the green rectangles in the figure: the noise emission estimation module and the best route choice module. The LIST Port app back end is placed on a virtual server and manages and provides to the GUI of the LIST Port app, via web services, the different information and services provided to the final user by the app.
The back-end system has been developed from the myMaaS emiXer platform. The myMaaS emiXer (circled by the blue rectangle in the figure) has been patented by algoWatt, the company which was in charge of the development of the LIST Port app, for the management of info mobility services (algoWatt [46]). However in order to have the complete functionality of the LIST Port app back-end, it has been necessary to integrate myMaaS emiXer with the following two modules:
  • The module dedicated to the calculation of the best route to/from the port terminals;
  • The module for the estimation of noise emissions.
The MyMaaS emiXer is the part of the LIST Port app back-end which interacts with the LIST Port ITS System Central and with the GUI of the LIST Port app.
The two additional modules (“noise emission” and “best route choice”) interact only with the myMaaS emiXer.

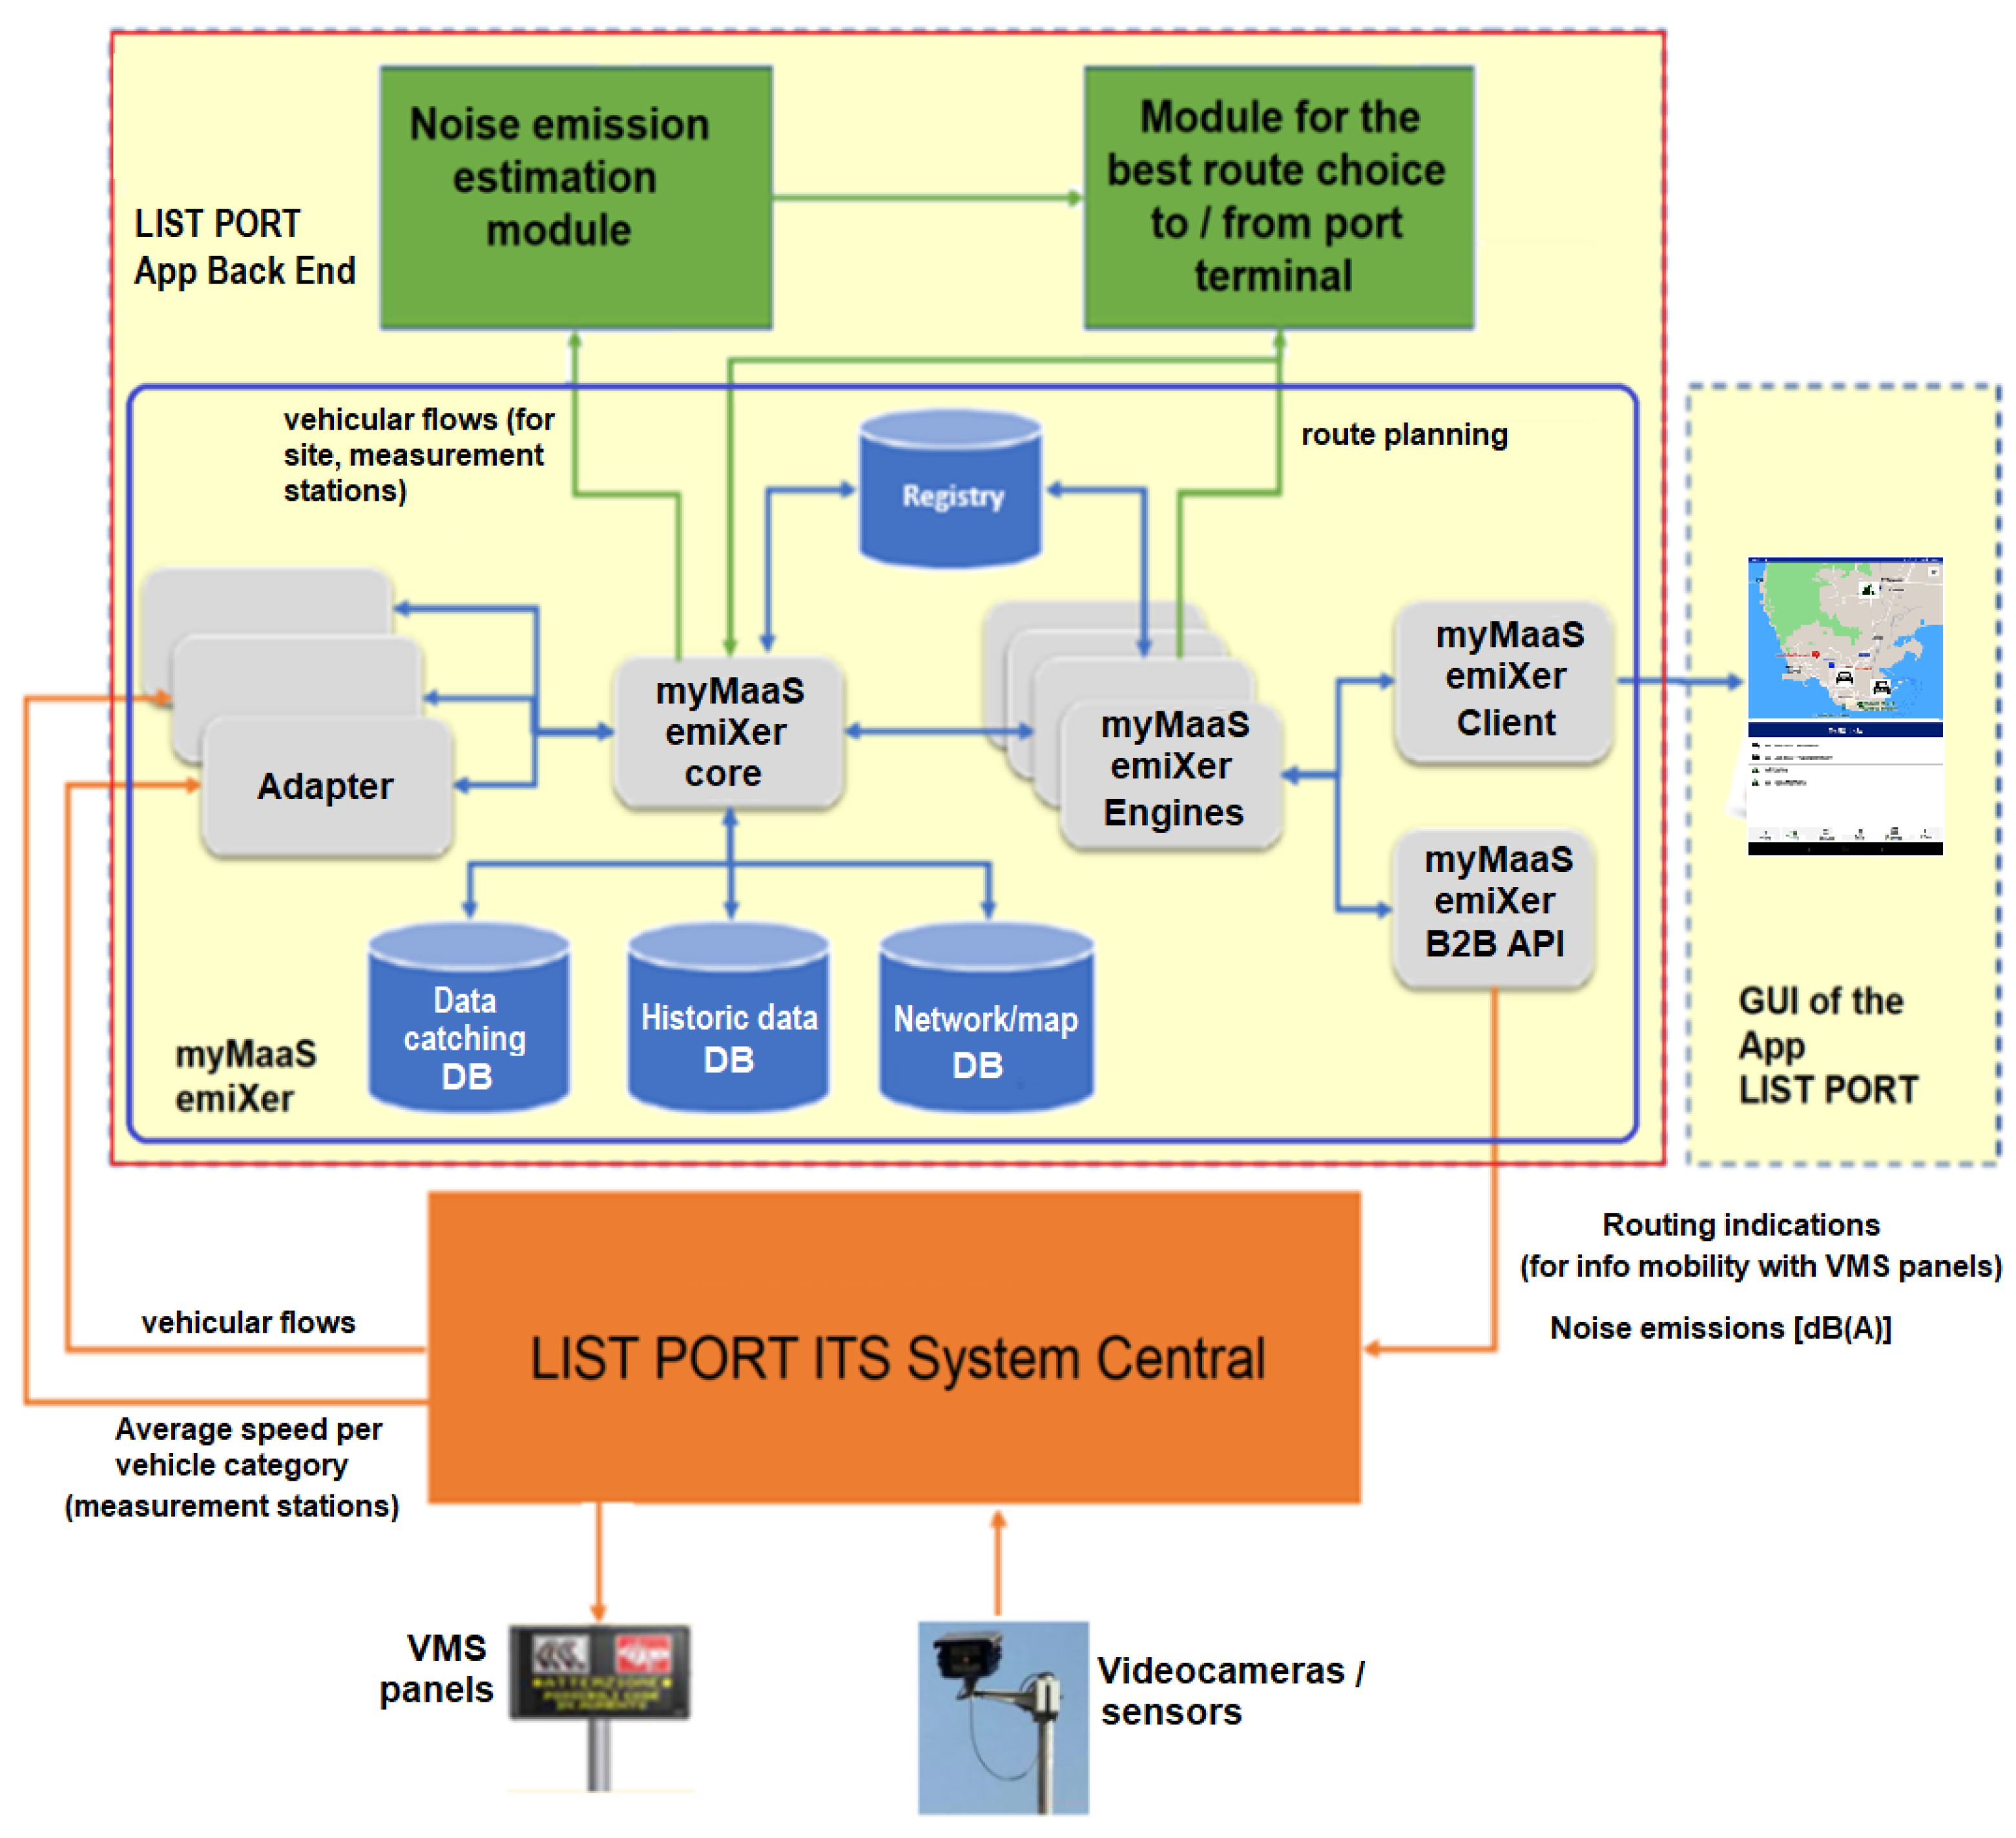
3.2. The Back-End System

The myMaas emiXer platform is part of the technology myMaaS, widely applied by algoWatt in the European Horizon 2020 project IMOVE (Unlocking Large-Scale Access to Combined Mobility through a European MaaS Network), of which algoWatt has been the coordinator (Softeco [47]).
The myMaaS emiXer platform is formed by several main elements:
  • Data Adapters: transform data and services provided by external sources into the format readable by myMaaS emiXer. Data can be provided by any type of external sources: ITS systems, platforms, websites. Each source provides data in a different format from the other sources: for example, the format of data provided by the ICT system managing the public transport is different from the format of data provided by a website about maritime transport. As a result, it is necessary to “translate” all data, provided by the different data sources, into a single format: this “translation” is performed by the Data Adapter.
  • myMaaS emiXer Core: it is the “brain” of the Data Adapter. In the “translation” of the data of the various providers, often there is some redundant information and some missing information. The “Core” has the role of calculating the missing information. After collecting all data, it organizes them according to the type of service that must be provided to the user: for example, best route by car, best hyperpath by public transport, best multimodal route (car or foot + public transport).
  • Another role of the myMaaS emiXer Core is the management of the DataBases. All data coming from the different sources are stored in a DataBase, which is organized into three parts: network DataBase, data caching DataBase, historic data DataBase. The network DataBase memorizes not only the sets of data collected but also the interaction between them. Data are organized in a hierarchical way, basing on the type of source from which data were collected and the type of information provided by the data. The Data Caching DataBase is a temporary memory, that is, data are stored temporarily in the Data Caching DataBase but are cancelled when the back-end system (myMaaS emiXer) is turned off. It is used to store data that are used immediately, or in a short time, by the app. The historic data DataBase is used to memorize the historic data.
  • myMaaS emiXer Engines: it is a group of “application engines”, that is, application modules performing a specific calculation: for example, the engine for the calculation of the best route, the engine which processes traffic data in order to provide to the user real time traffic information, the engine to collect users feedback.
  • myMaaS emiXer Clients: myMaaS emiXer is the background of the majority of apps developed by algoWatt (for example, not only the LIST Port app but also TreviMove). Each app has a different GUI and has been designed to provide a different set of information to the user. The module “Clients” is in charge of transferring the correct set of information from the back-end to the app GUI.
  • myMaaS emiXer API (Application Programming Interface) B2B (Business to Business): it is an interface designed for transferring the results of the elaborations from myMaaS emiXer to any possible ICT system. For example, through this API the information is transferred from myMaaS emiXer to the LIST Port ITS System Central, which in turn manages VMS panels. As another example, through this API the information is transferred from myMaaS emiXer to the two modules: for the calculation of the best route to/from the port terminals and for the estimation of noise emissions; in this last case the information transmission takes place through the myMaaS emiXer core and engine modules.
As regards noise emission values, it must be underlined that they are transferred from the LIST Port app back-end only to the GUI of the app and not to the LIST Port ITS System Central.
The main flows of interaction between the architecture components of the ITS LIST Port system are summarized in the Table 1.
In the first column of Table 1 the name of the component (Module) of the ITS LIST Port system is reported. In the second column, the data received in input and/or provided in output by the component, shown in the first column, are reported. In the third column, the source of the data provided in input, or the receiver of the data provided in output, is displayed. In the fourth column, it is displayed the type of protocol used for the communication between: the ITS LIST Port system component reported in column 1, and the source/receiver of data reported in column 3.

3.3. The Module for the Best Route Choice

One of the main services provided by the LIST Port app concerns the redirection of the users to the best path, among all possible paths, according not only to road congestion, but also to noise pollution.

Choice of the Best Route among the Set of Pre-Defined Routes

The best route is chosen from a set of pre-defined routes, which are different for each of the four scenarios (Piombino, Olbia, Bastia and Vado Ligure).
The information about congestion and noise is provided by the traffic sensors (videocameras and inductive loops). However they are only four for each scenario, although they are placed in the most important roads, therefore, it is not possible to know in real time traffic flows and noise emissions on all links of the road network: it is only possible to have this information on a few specific links.
As a result, the following approach, for the route choice, has been adopted.
In each of the four scenarios, the pre-defined routes have been ranked basing on these criteria: the first ranking route travels along highways and avoids residential areas and keeps far from the most “sensible” points ( for example hospitals); the other routes travel along a greater amount of urban residential roads and are used when the first route becomes congested.
For example, in the Vado Ligure scenario, three pre-defined routes, between the motorway exit and the port terminal, have been defined. The first ranking route travels almost completely along the city highway; the second one travels along a part of the city highway, but also along the industrial area; the third (and last) ranking route travels along the village of Vado Ligure, but it travels along the most wide roads (the most central and the narrow roads have been excluded from the set of pre-defined paths).
In Bastia scenario, again three pre-defined routes to/from the port terminal have been defined. The first one travels along the city highway (which however is very congested at any time of the day); the second one consists of the “old” national road; the third one is the panoramic road on the city hills (which is not congested but is formed by steep and narrow roads): the path across the Bastia city centre has been excluded from the set of pre-defined paths.
The ranking of predefined routes has been chosen, for each of the four scenarios, by the Universities of Pisa and Cagliari and by the local project partners: ANCI Toscana for Piombino, Municipality of Olbia for Olbia, ANCI Liguria for Vado Ligure, and Chamber of Commerce of Corsica for Bastia.
When the traffic sensors located along the first ranking route detect that either the physical or the acoustic capacity is overcome, then the other routes are analyzed, in succession. Vehicles are redirected to the successive route in the ranking where both the physical and the acoustic capacity constraints are respected.
For example, if the first ranking route of Vado Ligure records traffic flows above the acoustic capacity, while in the second ranking route both capacity constraints are respected, vehicles are redirected to the second ranking route.
However, the case may arise that none of pre-defined routes can be chosen, because all of them exceed at least one of the two capacity constraints. In this case, the impact of road congestion is considered worse than the impact of noise. As a result, the vehicles are redirected to the first route where the physical capacity constraint is respected, even if the acoustic capacity constraint is overcome.

3.4. The Module for the Estimation of Noise Emissions

3.4.1. The “Acoustic Capacity” Concept of a Road Infrastructure

The “physical capacity” of a road infrastructure has been defined, by the Highway Capacity Manual, as “the maximum sustainable flow rate at which vehicles or persons reasonably can be expected to traverse a point or uniform segment of a lane or roadway during a specified time period under given roadway, geometric, traffic, environmental or control conditions; it is usually expressed as vehicles per hour, passenger cars per hour, or persons per hour” (Highway Capacity Manual (HCM) 2000 [48], Chapter 5 “Glossary”, page 5–2).
As reported in Section 2.2.1, the current laws on acoustic pollution in Italy (based on European Directives) establish two types of limit values: the first one is related to noise emissions and the other one to noise immissions. The acoustic capacity of a road section can be defined as the traffic flow at which one of the two values, either the emission or the immission one, is equal to the limit value while the other one is lower, or at most equal, to the limit value.

3.4.2. The Methodology for the Acoustic Capacity Assessment of a Road Infrastructure

The modeling of the noise phenomenon due to traffic flows is composed of the following two phases:
  • Modeling of noise emissions: assessment of the noise emitted in the environment by the road traffic;
  • Modeling of noise propagation in the environment: assessment of the noise immission measured at a given receiver point.
However, if only one noise source is present (for example, road traffic), the constraint of noise emissions is more restrictive than in the case of noise immissions, because the receiver is closer to the source and the limit values, established by law, are lower. In the four scenarios under study, the only permanent noise source consists of road traffic. As a result, the “acoustic capacity” has been assessed only in terms of noise emissions.
Noise emissions are calculated on the basis of the traffic flow characteristics detected by the sensors (video cameras or inductive loops).
Noise emissions are not evaluated in all the road network but only in correspondence to traffic sensors, that is videocameras and inductive loops.
The input data required by the app for the implementation of the CNOSSOS-EU model are the following:
  • Average speed, average acceleration, flow rates, for each vehicular category. These data are provided to the app by traffic sensors (videocameras and inductive loops);
  • Road characteristics (slope, type of pavement): these data have been provided to the app only once and are not subjected to variations;
  • Proximity to intersections or roundabouts: these data have been provided to the app only once and are not subjected to variations;
  • Temperature: the average temperature for each city is taken into account.
The acoustic emission is indicated as equivalent sound pressure level in dB(A), calculated over the entire reference period: daytime, evening, night. In particular: if the app is visualized from 6 a.m. to 8 p.m., it shows the Lday; if the app is visualized from 8 p.m. to 10 p.m., it shows Levening; if the app is visualized from 10 p.m. to 6 a.m. of the following day, it shows the Lnight.
The “acoustic capacity” is reached when the noise emission, calculated by the app, equals the emission limit value established by the DPCM 14/11/1997 [37]. If the “acoustic capacity” is overcome, the app redirects the users to another path. It must be noted that, often, the acoustic capacity is lower than the physical one, therefore the “acoustic capacity” constraint is often more restrictive than the physical one.
The process for the calculation of noise emissions, by means of CNOSSOS-EU model, is synthesized in Figure 3.

3.4.3. Implementation of the CNOSSOS-EU Model in the LIST Port App

Traffic sensors (cameras or inductive loops) measure traffic stream characteristics, that is: average speed, acceleration, for each vehicle category, and traffic flows, distinguished per vehicle category. Traffic sensors are not programmed to distinguish between vehicle categories 4a and 4b, therefore in the implementation of CNOSSOS-EU in the LIST Port app categories 4a and 4b have been merged.
As regards to the other input parameters, that is: type of road surface; proximity to a crossing intersection or roundabout; temperature; road gradients; they are provided in input once by the app developer. As the temperature varies day by day, a yearly average one, given the average meteorological conditions of the area, is taken.

3.5. Output Data Provided by the App as Regards Noise Pollution

The LIST Port app gives the indications about the noise emissions, due to the estimated flow rates, along the main access and exit roads to/from the port areas of the cities involved in the project, in the road sections where traffic cameras are placed.
The noise levels due to road traffic are presented to the user in the app section named “Traffic”, which will be described in the following section. The information about noise emission levels is given in correspondence to the road sections equipped with video cameras for detecting traffic flow characteristics.

4. Results: The List Port App Gui and the Services Provided by the App

4.1. Sources of Data Distributed by the List Port App

Functions and services provided by the LIST Port app, at any time, depend on the effective accessibility of external sources and on the quality of the related data, information and services. In the following, the sources that feed the LIST Port app in the project cities are schematically summarized.
The LIST Port app aggregates, processes and distributes contents derived from three types of sources (see also Figure 1):
  • The LIST Port ITS System Central that manages traffic video cameras and VMS panels installed in the four cities involved in the project;
  • Data and services accessible to users on the internet: for example, the website Marinetraffic (which provides the real time position of all ships in the world);
  • Other ITS systems available in the project cities: for example, MONI.C.A. [49] in the port of Piombino which provides real time information about ships departing from, or arriving to, the port.

4.2. Services Provided by the List Port App in All List Port Cities

Some services are available in all LIST Port cities: Piombino, Olbia, Bastia and Vado Ligure:
  • Planning and visualization on a map of the access and exit routes to/from port terminals;
  • State of congestion and noise emissions in dB(A), in correspondence to video cameras. Noise emissions are expressed as equivalent sound pressure level calculated over the given period of the day: daytime, evening or night. If we hypothesize to visualize the app at 11 a.m., the app shows the Lday calculated over the daylight period, that is: from 6 a.m. to 11 a.m. of the current day and from 11 a.m. to 8 p.m. of the day before. If the app is visualized between 8 p.m. to 10 p.m., it shows Levening. If it is visualized between 10 p.m. and 6 a.m. of the following day, it shows Lnight;
  • Traffic levels in real time in specific points of the access/exit roads from the port area detected by video cameras;
  • Messages (text, graphical signage) in real time shown by VMS panels installed in the area;
  • Graphical representation of the suggested route on the map: the best route is chosen in real time;
  • Textual indication of navigation along the suggested route;
  • Information of bus lines in the proximity of port terminals (in case real time data are available, they are provided by the app);
  • Visualization in real time of the port terminals and of the real time position of ships in the vicinity of ports (from Marinetraffic website, https://www.marinetraffic.com/ (accessed on 1 July 2022));
  • Link to the booking pages of ro-ro and ro-pax services operators websites.

4.2.1. Additional Services Available Only in Piombino

The following services are available only in the scenario of Piombino:
  • Real time information on ferries: estimated departure and arrival times of ferry services to and from Elba island at the Piombino terminal. This information is available thanks to the integration with MONI.C.A. platform, developed in the Interreg Marittimo IT-FR MOBIMART project;
  • Redirection to the reservation page of ferry services operators: possibility of purchasing a ticket directly online;
  • Rail services: train departure and arrival times (real time information) at the two stations: Piombino city and Piombino Port.
The first two services of the app are essential in Piombino because the ferry services to the Elba Island sometimes register cancellations or delays, and this causes high congestion on the access roads to the port terminal. After surveys performed on the field, in particular during meetings with the Piombino Municipality and Port Authority, it resulted necessary for the ferry users: to know in real time the position of their ship and to purchase tickets and change their reservation without the need of physically going to the ticket office of the port terminal. The app aims at fulfilling these needs: indeed the app provides the real time position of all ships performing the maritime services between Piombino and the Elba island; in addition the app redirects the users to the various reservation pages of ferry operators.
Finally, the app provides information on rail services to/from the port terminal, for those users not accessing the port by car.

4.2.2. Additional Services Available Only in Olbia and Bastia

The traffic state in the urban area, imported from Google Maps, is an additional service available, but only in Olbia and Bastia. This additional service is important because the Olbia network is quite large and the four cameras installed are not sufficient to have an acceptable overview of the city traffic state. The Bastia network is smaller than that of Olbia, but it shows relevant congestion problems in the great majority of routes of the urban area, therefore the punctual information provided by videocameras is not sufficient.

4.2.3. Additional Services Available Only in Bastia and Vado Ligure

Bastia city is connected to its suburbs and to the city of Ajaccio by a non electrified single-track railway line, which is a feasible alternative to road transport, given the high congestion of the Bastia road network. The app provides the scheduled timetable of rail services; real time data are not available.
The port of Vado Ligure is very far from the nearest railway station which is that of Savona: the app provides, to the users who cannot access the port by private vehicle, the information about bus lines connecting the port of Vado Ligure to the train station of Savona.

4.3. Structure and Functionalities of the App

4.3.1. Splash Screen and Home Page

At each start of the app, initially, it is shown a splash screen for the time necessary for the app: to connect the GUI (Graphical User Interface) of the app to the app back-end and to load the data of the case study (Piombino, Olbia, Bastia and Vado Ligure). The app is composed of: a GUI, which is the part of the app visible to the app user, and the back-end, which is the “hidden” part of the app and consists of the modules and components which allow the functioning of the app (see also Figure 2). The back-end has been developed basing on MyMaaS emiXer platform and is described in Section 3.2. On the splash screen the user can choose the city of interest.

4.3.2. Organization of the App

The LIST Port app aggregates and makes available a set of services for the user accessible through different modalities.
The app is organized as follows:
  • A home page that allows the user to choose the city of interest, among: Piombino, Olbia, Bastia and Vado Ligure;
  • An access page to the main services provided by the app through buttons shown in the tabbar. All the four access pages, one for each of the four cities, are set by default at the “Traffic” web page.

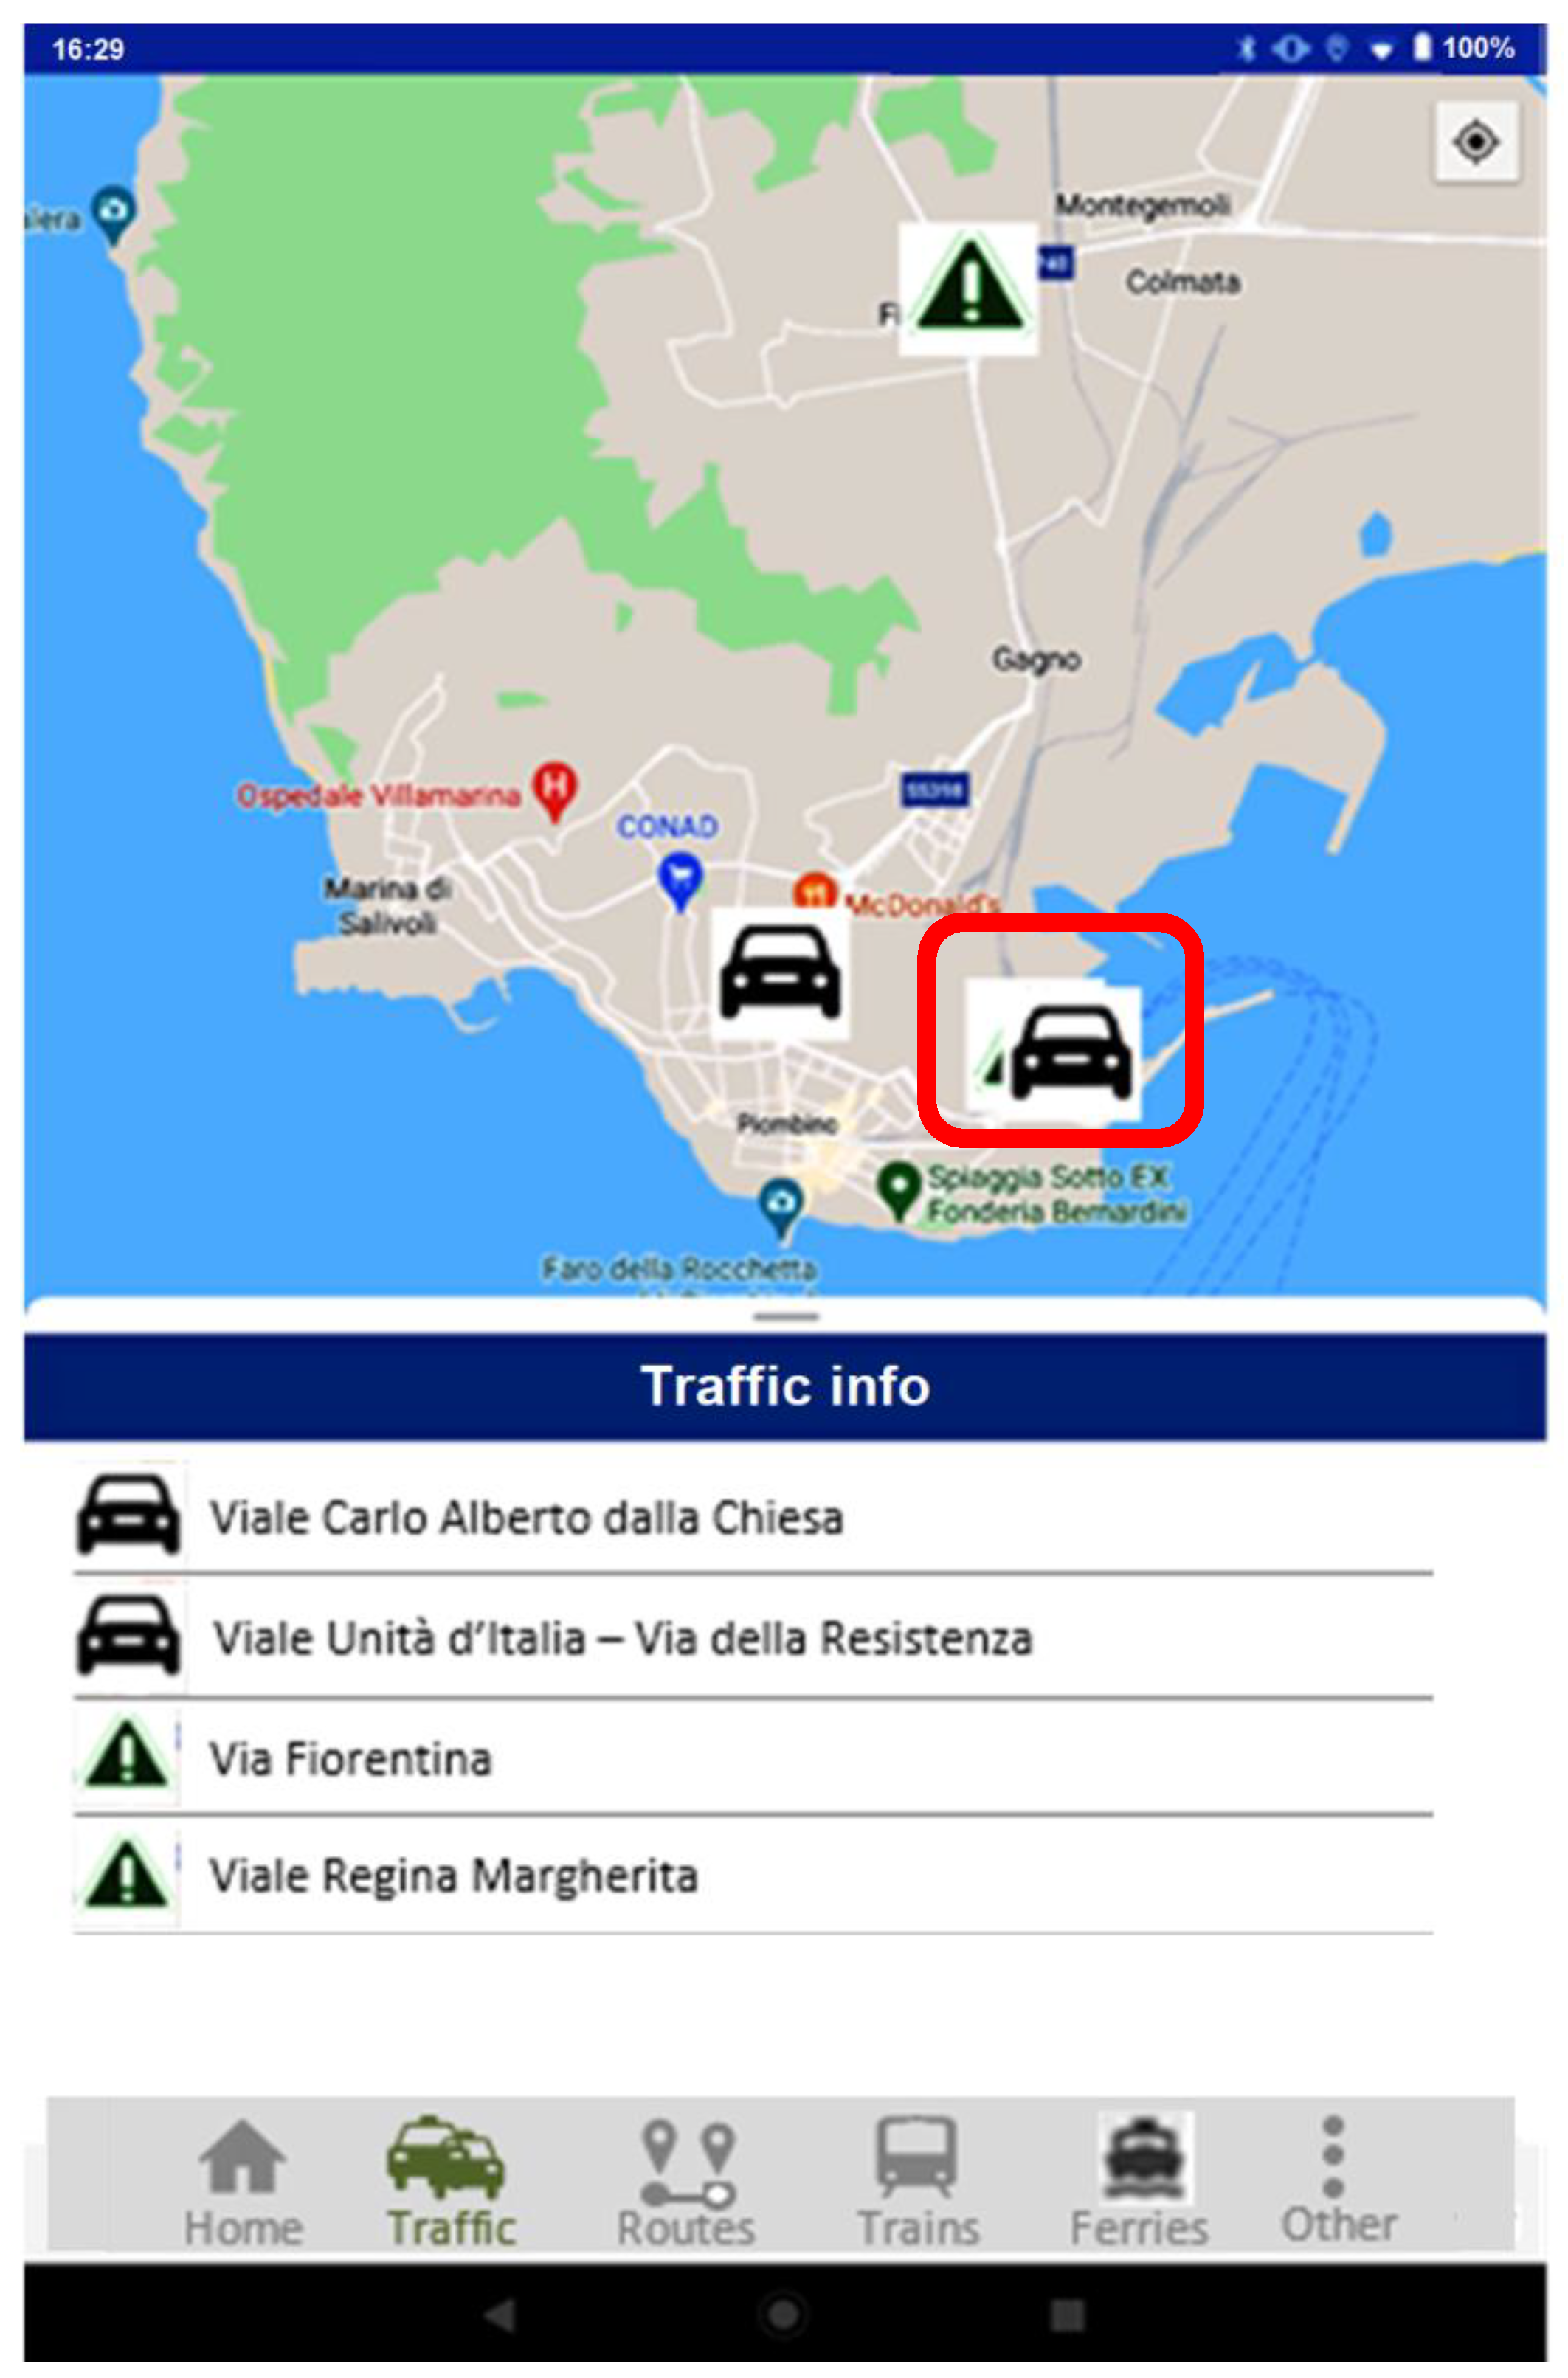
4.3.3. The “Traffic” Web Page

The “Traffic” web page is composed of (see Figure 4 which refers to the case of Piombino):
  • An upper part showing the map of the chosen city; the map can be navigated with same modalities as Google Maps. In particular, it is possible to increase or reduce the zoom by simply moving the fingers on the map: this functionality is the same as Google Maps for smartphone. In the map the location of the videocameras currently active and of VMS panels is reported. The positions of videocameras on the map are indicated with small automobiles, while the positions of VMS panels on the map are indicated by green triangles. In the moment the app was used, only 2 videocameras were active in Piombino, while the remaining 2 ones (for each case of study 4 videocameras were installed) were turned off or temporarily not connected to the LIST Port ITS System Central. In the map, the VMS panel of Viale Regina Margherita is hidden by the car representing a videocamera, because they are very near: they are circled by the red rectangle in the figure.
  • A central part (entitled “Traffic info”) which provides the addresses: of the videocameras currently active, and of the VMS panels.
  • A tabbar for moving from a web page to another of the app. In all the four cases of study, through the tabbar it is possible to move from the web page “Traffic” to the web page “Routes” and vice versa. Only in Piombino, other two services are available: “Ferries” and “Trains”, therefore by using the tabbar it is possible to move also to the “Ferries” and to the “Trains” web pages (see Figure 4). In the tabbar there is also an additional menu accessible by a scrollable panel from the right side of the page (“other” icon), that allows to access to other services, i.e. links to: real time news about road traffic and ship services, shipping companies websites, the website of the LIST Port project.
Clicking on a videocamera (a small automobile), the traffic and noise information is visualized. Clicking on a VMS panel (that is a triangle), the messages shown by the VMS panel are visualized. It is possible to click on a videocamera or on a VMS panel: directly on the map (upper part of Figure 4); or in the central part of Figure 4 where the address of the videocamera or VMS is reported.
After clicking on a videocamera, that is the little car image, the upper part (that is the map) and the lower part (that is the tabbar) of the “Traffic” web page remain the same. However the central part changes and it displays:
  • The address of the chosen videocamera;
  • The state of the traffic, which can be “Regular” or “Congested”;
  • The noise emissions in dB(A).
After clicking on a VMS panel, that is the triangle image, the upper (that is the map) and the lower part (that is the tabbar) of the “Traffic” web page remain the same. The central part changes and it displays:
  • The address of the chosen VMS panel;
  • The message displayed by the VMS panel in real time.

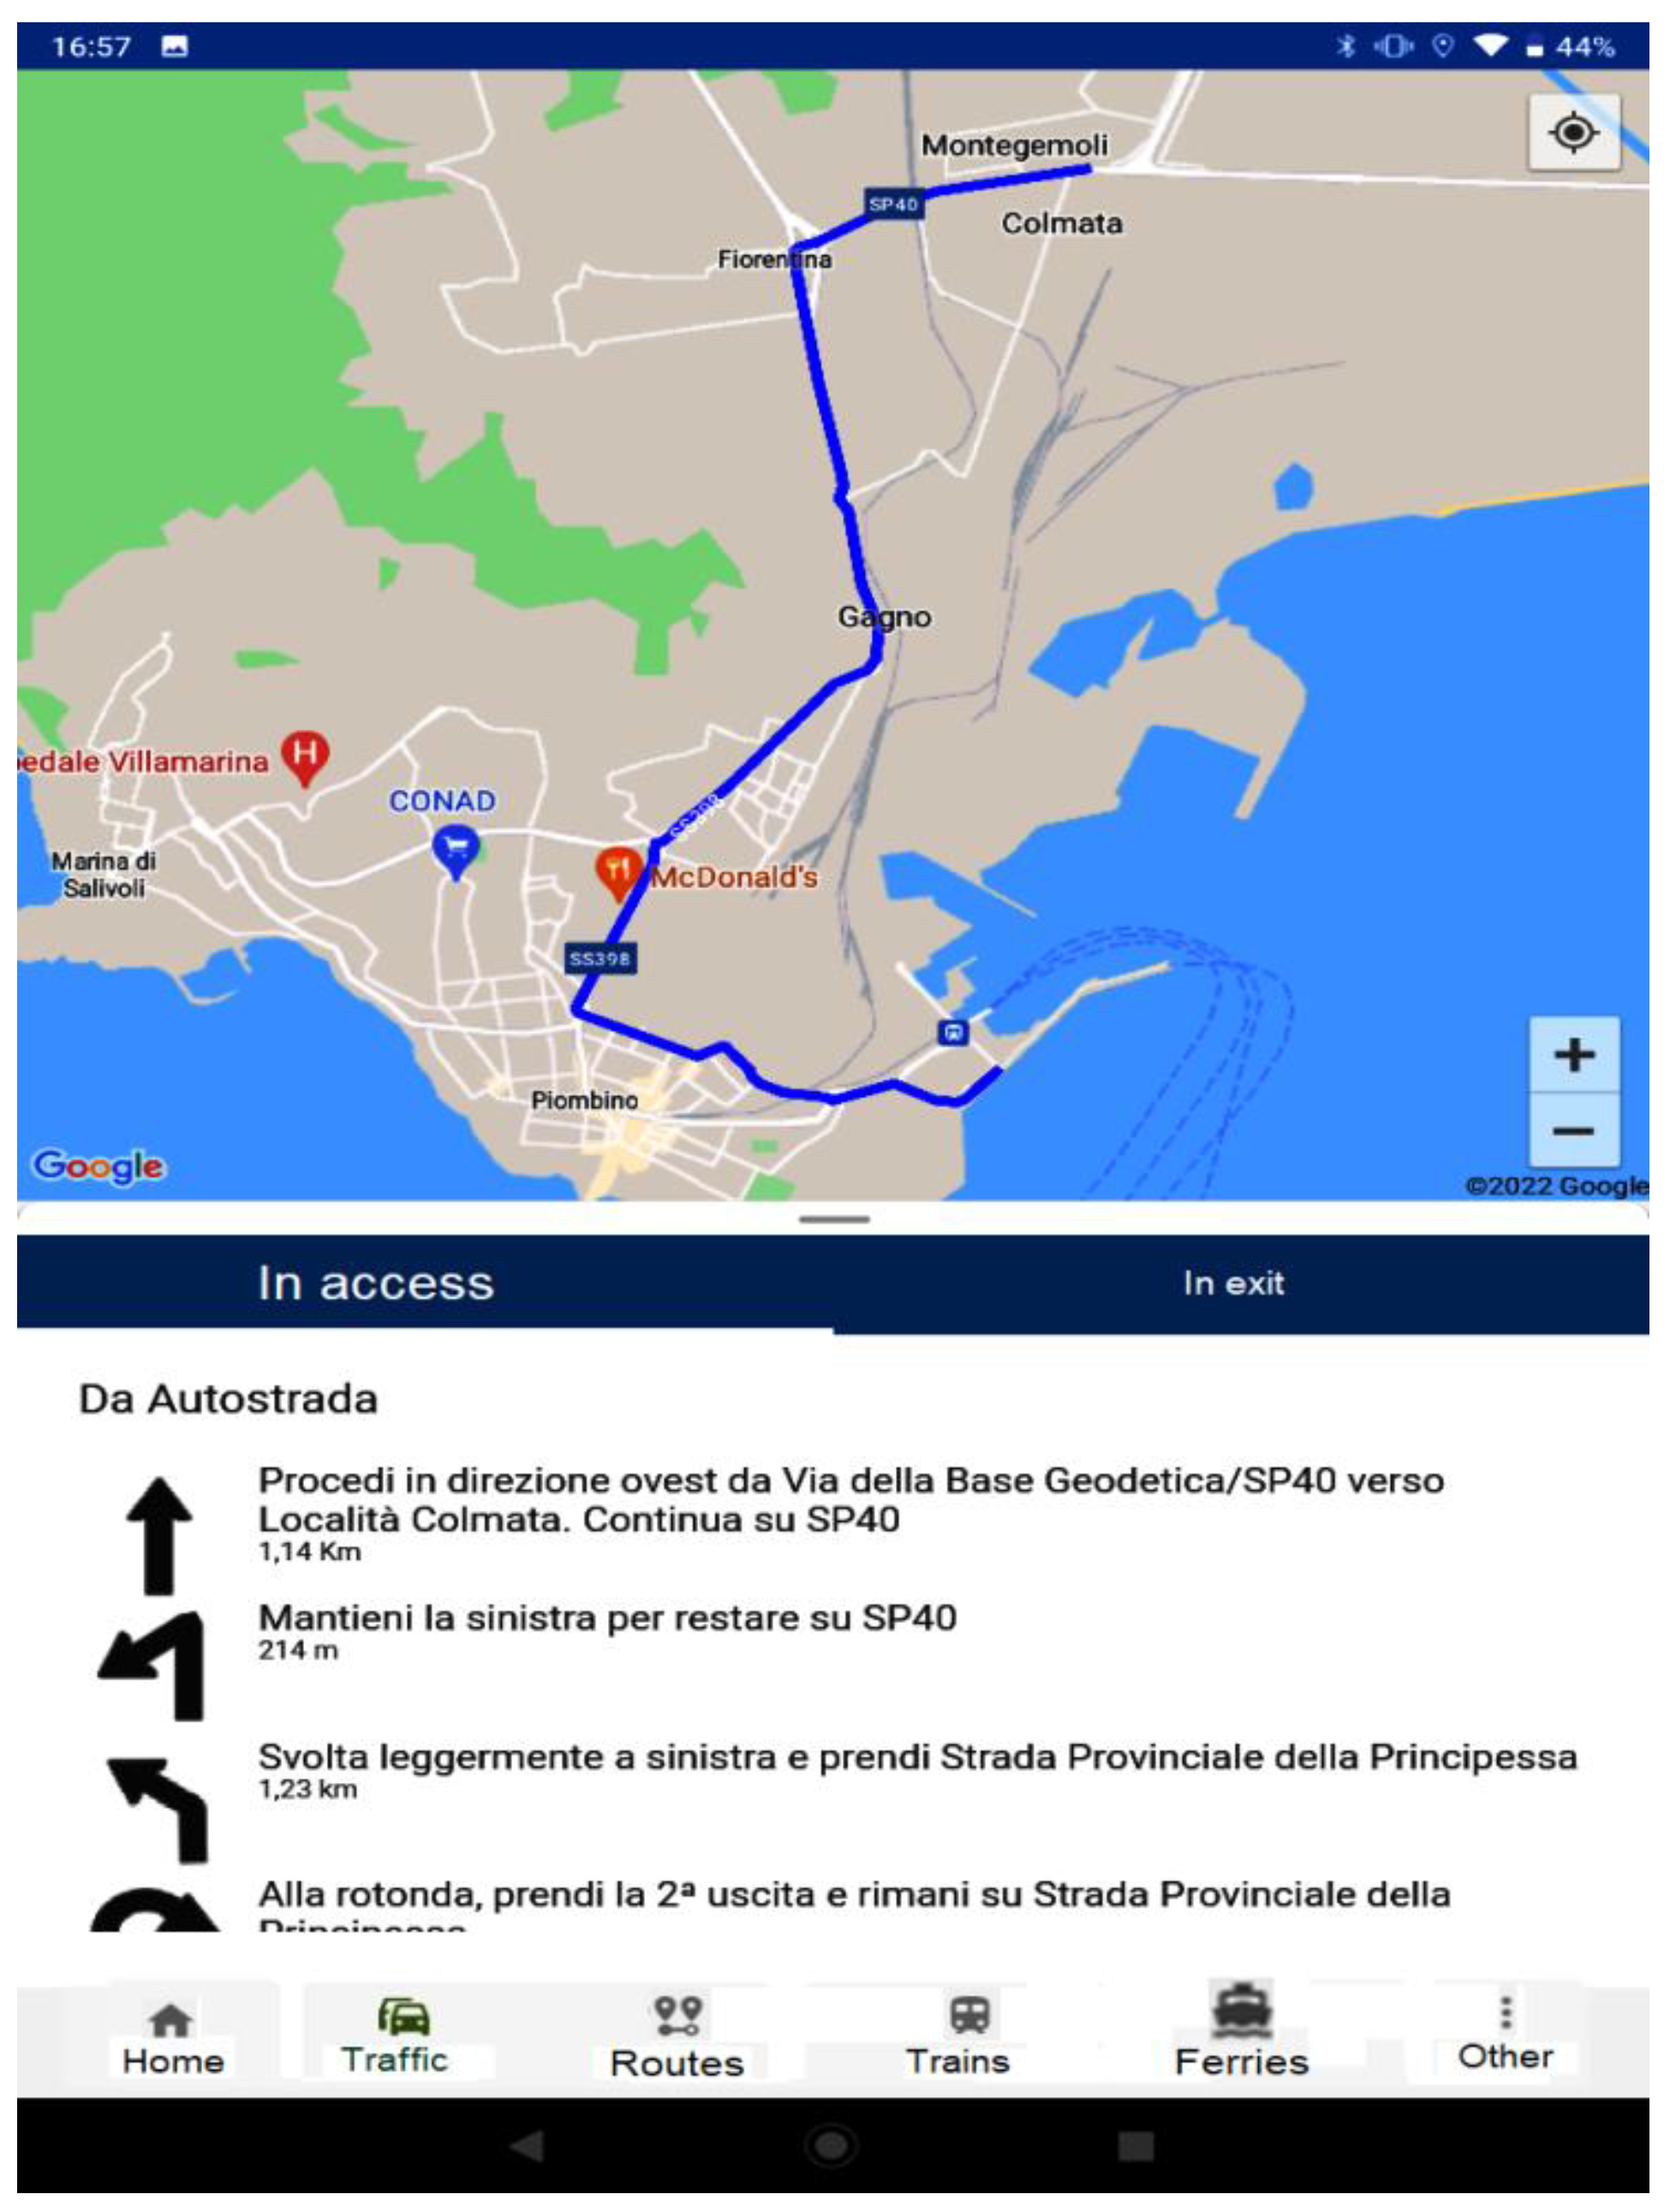
4.3.4. The “Routes” Web Page

The “routes” web page shows in real time the optimal route, determined by the app. This information is shown in a dual mode:
  • Presentation of the route in graphic form with a polyline itinerary on the map;
  • Detailed description of the route as a sequence of direction choices described in textual and graphic way.
Both descriptive elements are shown on a single page. The text description is in a vertically scrollable panel for easier consultation.
The routes service shows the suggested routes both to and from the port terminal. Through the tabbar button it is possible to switch from the visualization of the route towards the port to the visualization of the route from the port terminal. The “Routes” service of the app is shown in Figure 5.

4.3.5. The “Ferries” Web Page

The “Ferries” service uses and integrates external sources dedicated to the management of real-time information about ferry arrival and departure times at the port. This service is available only for the case study of Piombino, because the traffic congestion of this city is almost exclusively due to vehicles waiting to be loaded on the ships directed to the Elba Island.
The real time information about maritime services at the port of Piombino is imported in the app from the MONI.C.A. platform [49].
The information provided by the “Ferries” service of the app includes: ship name; shipping company name; departure/arrival time and delay/cancellation shown in real time; the status of the ship: departed, close to arrival, on the dock. The app provides this information not only for Piombino, but also for all the ports in the Elba island: Portoferraio, Cavo and Rio Marina.

4.3.6. The “Trains” Web Page

The “Trains” web page is integrated into the LIST Port app and provides information to the traveller about train services available close to the port terminal. This service is available only for Piombino and Olbia: the app directly links to the functionalities of the Trenitalia website to get this information.
This service is not available for Bastia as the website of the Bastia–Ajaccio railway is not interactive. In addition, this service is not available also for Vado Ligure because the railway station of Savona is very far from the port terminal: in the case of Vado Ligure, the app provides information on the buses linking the port terminal to the Savona train station.

4.3.7. The Other Services of the App

These additional services are accessible from the LIST Port app and provide further information which could be very important for passengers to/from port terminals. They are accessible through the button “Other” in the tabbar and in the related pop-up menu.
The additional services are the following:
  • Link to the shipping companies websites: in particular to the web pages for booking and reservation. This service is very important for the users in case of disruption: for example, when a user cannot arrive at the port terminal in time to board on the ship, therefore he needs to change the booking;
  • Link to the websites of the city local authorities or to the port authorities;
  • Link to the IT-FR Interreg Maritime web pages related to the LIST Port project;
  • Link to the website of bus companies, only in the case of Vado Ligure: bus services between the Vado Ligure port terminal and the Savona train station are shown;
  • Link to the website of the railway Bastia–Ajaccio;
  • Link to the web pages, of the Marinetraffic website, related to the ports of: Piombino, Portoferraio, Olbia, Bastia and Vado Ligure.

5. Discussion

5.1. The “Acoustic Capacity” Concept and the Proposed Methodology

Apparently, the same service provided by the calculation of noise emissions, from traffic flow characteristics through the CNOSSOS-EU model, included in the app, could have been given also by phonometers, placed close to the videocameras, which record noise emissions in continuum. In addition, noise experimental measures performed by a phonometer are more accurate than the noise calculation through a model.
However, the calculation of noise emissions implemented in the app allows a more complete control and planning strategy. By means of a traffic demand forecasting, for example based on time series, and a subsequent assignment of the demand to the network, it is possible to implement a traffic control strategy, that is, users can be redirected to another path, before the “acoustic capacity” is reached. This is impossible by simply using a phonometer: users can be redirected to another path only after the “acoustic capacity” has been exceeded.
In addition, the noise emission calculation methodology, included in the app, is not limited to the cases of study of Piombino, Vado Ligure, Bastia and Olbia, and it allows the implementation of routing strategies, based on the “acoustic capacity”, more general than the simple redirection of users to/from port terminals.
The “acoustic capacity” concept, based on the CNOSSOS-EU model and on the European Commission directive 2015/996 of 19 May 2015, can be implemented in traffic planning softwares. The open source traffic planning and simulation software SUMO (Simulation of Urban Mobility), which has been used in the LIST Port project, comprises a module for the calculation of noise emissions, but the “old” Harmonoise model is used, and not the CNOSSOS-EU methodology; in addition, in none of the existing transport planning softwares the “acoustic capacity” concept is implemented.

5.2. Comparison of the List Port Its System with Those Existing in the Literature

In Table 2, the LIST Port ITS system is compared with the info-mobility systems analyzed in the literature section (Section 2.1).
From the comparison shown in Table 2, it can be seen that the main services offered by the LIST Port app, and not available in the other info-mobility systems examined, concern not only the real time routing basing on the “acoustic capacity”, as stressed several times in this paper, but also the possibility of purchasing a ticket of maritime services directly by the app. This apparently is a minor issue, however it is essential when the maritime terminal can be reached with difficulty, as it occurs in Piombino in the most congested days of June and July.
In addition, the app is able to provide real time information on maritime services to/from the four city/ports of study, without the need of the collaboration of the Port Authorities, as is for example necessary for “Muoversi In Toscana”. Indeed the app links to the website “Marinetraffic”, which provides the real time position of all ships all over the world.
Finally, the services provided by the LIST Port app for the four scenarios (Piombino, Olbia, Vado Ligure and Bastia) are tailored to the user needs, which are different on each specific scenario. The user needs have been collected after meetings with local stakeholders.

6. Conclusions

In this paper, a new ITS system aimed at reducing traffic congestion and noise in the urban roads leading to port terminals is presented. This system has been developed within the European project LIST Port (“Limitazione Inquinamento Sonoro da Traffico nei Porti commerciali”), funded by the Italy-France Maritime Interreg Programme 2014–2020, for the four cities/ports involved in the project: Piombino (IT), Olbia (IT), Vado Ligure (IT) and Bastia (FR). The ITS system is composed of (see Figure 1 and Figure 2):
  • The LIST Port ITS System Central: it receives the traffic flow data from video cameras and inductive loops, elaborates these data, and provides real time traffic information to the app (precisely: to the LIST Port app back-end). The app back-end calculates the best routes to/from port terminals, provides the best route to the Central which in turn chooses the message that should be displayed by VMS panels. The best routes are determined according to traffic congestion and traffic noise emissions. Noise emissions are not measured but calculated, from traffic stream data, using the CNOSSOS-EU model, which is the acoustic model recognized by the European legislation.
  • Video cameras and VMS panels:
    Video cameras, installed in the most congested roads or intersections of the urban area, measure traffic flow characteristics: flow rates distinguished by vehicle category (heavy vehicles, medium-heavy vehicles, cars, motorcycles) and average speed and acceleration for each vehicle category. These data are provided in input to the CNOSSOS-EU model to calculate noise emissions. In the Olbia scenario inductive loops, instead of video cameras, were installed;
    VMS panels: they provide to customers information about the best route. The message shown by VMS panels can be automatically chosen by the LIST Port ITS System Central among a set of possible messages, or it can be manually inserted by the Municipality.
  • The app: it is made up of two parts: the LIST Port app back-end (summarized in Table 1) and the GUI of the LIST Port app:
    The LIST Port app back-end calculates the optimal routes to/from port terminals, determines noise emissions, and provides this information to the GUI of the LIST Port app; in addition it provides the best routes to the LIST Port ITS System Central. The LIST Port app back-end is composed of: myMaaS emiXer, which is the back-end main component, and two additional modules: for the calculation of the optimal routes, and for the estimation of noise emissions.
    The GUI of the LIST Port app displays to the user the best route to/from port terminals on the map and the state of congestion and noise emission in correspondence to video cameras. Moreover it provides to the user further information: ship arrivals and departures in real time at the port, redirection to booking web pages of maritime services, information of bus and rail services in the vicinity of the port.
An advantage of the proposed ITS system concerns the quality of information provided to the user by the LIST Port app. Info mobility apps, usually, provide to the user only road mobility data, while the LIST Port app provides further important information: in particular delays and cancellations of maritime services at port terminals. Furthermore, the LIST Port app provides a direct link to the booking page of maritime operators: this is especially important in case of disruption, when it is necessary to cancel the previous booking and to make a new one. These two services, as reported in this paper, are essential in the case of study of Piombino, to help users in the emergency situation of cancellation of a ship service to the Elba Island.
Moreover, the app supports the users who access the port by public transport modes, providing information about bus and train services in the vicinity of the port terminal. This is important in particular in the cases of study of Vado Ligure and Olbia, where the rail station is far from the port terminal; and of Bastia, where rail services are a feasible alternative to road transport, given the high congestion of Bastia road network.
The limitation of the LIST Port ITS system is twofold:
  • The number of sensors providing traffic data to the app is very limited. However, the installation of a videocamera is not easy from the “bureaucratic” point of view, at least in Italy, as several permissions are needed, even for the settlement of the electric line necessary for the videocamera functioning. One way to overcome this problem has been suggested by Torrisi et al. [28], namely the use of FCD (Floating Car Data). However, given the reduced number of vehicles currently equipped with “black boxes”, FCD data would have to be amplified.
  • A traffic forecasting module is not implemented in the app. As a result, users are still redirected to the best route according to only the current traffic situation, and not to a possible change in the future traffic situation. A future development of this research will be to develop a traffic forecasting model the data coming from FCD.
However the main advantage of the proposed ITS system concerns the optimization of routes, according not only to road congestion, but also to noise pollution. The calculation of the best routes takes place according to the “acoustic capacity” of road infrastructures, following the methodology described in Section 3.3 and Section 3.4. Noise emissions are directly calculated from traffic flow characteristics by means of the CNOSSOS-EU model and are after compared to the limit levels established by law. The “acoustic capacity” concept is very important in the field of transportation planning as, currently, road infrastructures are verified only in terms of physical capacity; at most, the environmental capacity due to atmospheric pollutants is taken into account, while the “acoustic capacity” is completely neglected.

Author Contributions

Conceptualization, M.L. and A.F.; methodology, M.B. and L.N.R.; software, L.N.R. and M.V.; validation, M.L., D.C. and A.F.; formal analysis, M.B.; investigation, M.L., A.F. and D.C.; resources, L.N.R.; data curation, M.V.; writing—original draft preparation, A.F., D.C., M.B. and L.N.R.; writing—review and editing, M.L.; visualization, D.C.; supervision, M.L.; project administration, M.L.; funding acquisition, M.L. and A.F. All authors have read and agreed to the published version of the manuscript.

Funding

This research was funded by the European project LIST Port (Limitazione Inquinamento Sonoro da Traffico nei Porti commerciali), funding Programme Interreg Italy—France Maritime 2014–2020, 2nd call, grant agreement no. I53I18000030006.

Institutional Review Board Statement

Not applicable.

Informed Consent Statement

Not applicable.

Data Availability Statement

Not applicable.

Acknowledgments

The authors are very grateful to the Transport group of the University of Cagliari (the LIST Port project leader) for their precious support.

Conflicts of Interest

The authors declare no conflict of interest.

References

  1. Abioye, O.F.; Dulebenets, M.A.; Kavoosi, M.; Pasha, J.; Theophilus, O. Vessel Schedule Recovery in Liner Shipping: Modeling Alternative Recovery Options. IEEE Trans. Intell. Transp. Syst. 2020, 22, 6420–6434. [Google Scholar] [CrossRef]
  2. Elmi, Z.; Singh, P.; Meriga, V.K.; Goniewicz, K.; Borowska-Stefanska, M.; Wisniewski, S.; Dulebenets, M.A. Uncertainties in Liner Shipping and Ship Schedule Recovery: A State-of-the-Art Review. J. Mar. Sci. Eng. 2022, 10, 563. [Google Scholar] [CrossRef]
  3. Dulebenets, M.A. A comprehensive multi-objective optimization model for the vessel scheduling problem in liner shipping. Int. J. Prod. Econ. 2018, 196, 293–318. [Google Scholar] [CrossRef]
  4. Lupi, M.; Farina, A.; Pratelli, A.; Gazzarri, A. Application of classification rules to Italian ports. Promet 2014, 26, 345–354. [Google Scholar] [CrossRef]
  5. Baştuğ, S.; Haralambides, H.; Esmer, S.; Eminoğlu, E. Port competitiveness: Do container terminal operators and liner shipping companies see eye to eye? Mar. Policy 2021, 135, 104866. [Google Scholar] [CrossRef]
  6. Romano, A.; Yang, Z. Decarbonisation of shipping: A state of the art survey for 2000–2020. Ocean Coast. Manag. 2021, 214, 105936. [Google Scholar] [CrossRef]
  7. Gini, S.; Ambrosino, G. Innovation, Digital Solutions and MaaS Concept in Touristic Insular and Rural Destinations: The Case of the Shared Mobility Agency in Elba. In Sustainable Mobility for Island Destinations; 2021; pp. 39–66. Available online: https://link.springer.com/chapter/10.1007/978-3-030-73715-3_3 (accessed on 15 August 2022). [CrossRef]
  8. Šurdonja, S.; Giuffrè, T.; Deluka-Tibljaš, A. Smart mobility solutions – necessary precondition for a well-functioning smart city. Transp. Res. Proc. 2020, 45, 604–611. [Google Scholar] [CrossRef]
  9. Barreto, L.; Amaral, A.; Baltazar, S. Mobility as a Service (MaaS) in rural regions: An overview. In Proceedings of the 2018 International Conference on Intelligent Systems (IS), Funchal, Portugal, 25–27 September 2018; pp. 856–860. [Google Scholar] [CrossRef]
  10. Celidonio, M.; Di Zenobio, D.; Fionda, E.; Panea, G.G.; Grazzini, S.; Niemann, B.; Pulcini, L.; Scalise, S.; Sergio, E.; Titomanlio, S. Safetrip: A bi-directional communication system operating in s-band for road safety and incident prevention. In Proceedings of the IEEE 75th Vehicular Technology Conference (VTC Spring), Yokohama, Japan, 6–9 May 2012; pp. 1–6. [Google Scholar]
  11. Astarita, V.; Festa, D.C.; Polidoro, R. M2M system (Mobile to Mobility): The use of Smartphones in the Implementation of a Cooperative Road Traffic Safety Information System. In Proceedings of the FKAD 2013 8th International Forum on Knowledge Asset Dynamics: Smart Growth: Organizations, Cities and Communities, Zagreb, Croatia, 21 September 2013. [Google Scholar]
  12. Meschini, L.; Gentile, G. Real-time traffic monitoring and forecast through OPTIMA—Optimal Path Travel Information for Mobility Actions. In Proceedings of the International Conference on Models and Technologies for Intelligent Transportation Systems, Rome, Italy, 13–15 June 2009; pp. 113–121. [Google Scholar]
  13. Boccardo, P.; Arneodo, F.; Botta, D. Application of Geomatic techniques in Infomobility and Intelligent Transport Systems (ITS). Eur. J. Remote Sens. 2014, 47, 95–115. [Google Scholar] [CrossRef] [Green Version]
  14. Brazil, W.; Caulfield, B. Does green make a difference: The potential role of smartphone technology in transport behavior. Transp. Res. Part C 2013, 37, 93–101. [Google Scholar] [CrossRef]
  15. Astarita, V.; Festa, D.C.; Giofrè, V.P. Mobile Systems applied to Traffic Management and Safety: A state of the art. Procedia Comput. Sci. 2018, 134, 407–414. [Google Scholar] [CrossRef]
  16. LIST Port Project Website. Available online: http://interreg-maritime.eu/web/listport (accessed on 31 January 2022).
  17. Lupi, M.; Pratelli, C.; Farina, A. A Methodology for the Definition of the Acoustic Capacity of a Road Infrastructure. Sustainability 2021, 13, 11920. [Google Scholar] [CrossRef]
  18. Ambrosino, G.; Boero, M.; Nelson, J.D.; Romanazzo, M. Infomobility Systems and Sustainable Transport Services; ENEA (Italian National Agency for New Technologies, Energy and Sustainable Economic Development): Rome, Italy, 2010. [Google Scholar]
  19. Casquero, D.; Monzon, A.; García, M.; Martínez, O. Key Elements of Mobility Apps for Improving Urban Travel Pat-terns: A Literature Review. Future Transp. 2022, 2, 1–23. [Google Scholar] [CrossRef]
  20. Zhao, X.; Vaddadi, B.; Sjöman, M.; Hesselgren, M.; Pernestål, A. Key barriers in MaaS development and implementation: Lessons learned from testing Corporate MaaS (CMaaS). Transp. Res. Interdiscip. Perspect. 2020, 8, 100227. [Google Scholar] [CrossRef]
  21. Karlsson, I.C.M.; Mukhtar-Landgren, D.; Smith, G.; Koglin, T.; Kronsell, A.; Lund, E.; Sarasini, S.; Sochor, J. Development and implementation of Mobility-as-a-Service—A qualitative study of barriers and enabling factors. Transp. Res. Part A 2020, 131, 283–295. [Google Scholar] [CrossRef]
  22. Lopez-Carreiro, I.; Monzon, A.; Lopez, E.; Lopez-Lambas, M.E. Urban mobility in the digital era: An exploration of travellers’ expectations of MaaS mobile-technologies. Technol. Soc. 2020, 63, 101392. [Google Scholar] [CrossRef]
  23. VMZ Berlin. Available online: https://www.vmzberlin.com/ (accessed on 15 September 2022).
  24. New York. Available online: https://511ny.org/about (accessed on 15 September 2022).
  25. Trafiken (Stockholm). Available online: https://trafiken.nu/tillganglig_app_sto/ (accessed on 15 September 2022).
  26. Darbi Mobile (Abu Dhabi). Available online: https://darbi.itc.gov.ae/darbweb/about.html (accessed on 15 September 2022).
  27. Muoversi in Toscana. Available online: https://www.regione.toscana.it/speciali/muoversi-in-toscana (accessed on 15 September 2022).
  28. Torrisi, V.; Ignaccolo, M.; Inturri, G. Innovative Transport Systems to Promote Sustainable Mobility: Developing the Model Architecture of a Traffic Control and Supervisor System. In Computational Science and Its Applications—ICCSA 2018. Book of Proceedings of the 18th International Conference Melbourne; Gervasi, O., Murgante, B., Misra, S., Stankova, E., Torre, C.M., Rocha, A.M., Taniar, D., Apduhan, B.O., Tarantino, E., Ryu, Y., Eds.; ICCSA: Melbourne, Australia, 2018. [Google Scholar]
  29. MyCicero App Website. Available online: http://www.mycicero.eu/ (accessed on 29 September 2022).
  30. CityMapper App Website. Available online: https://citymapper.com/?lang=it&l=it (accessed on 29 September 2022).
  31. Via Michelin App Website. Available online: https://www.viamichelin.it/ (accessed on 29 September 2022).
  32. Infoblu App Website. Available online: https://www.infoblu.it/?page_id=262&lang=en (accessed on 29 September 2022).
  33. Mehta, H.; Kanani, P.; Lande, P. Google Maps. Int. J. Comput. Appl. 2019, 178, 41–46. [Google Scholar] [CrossRef]
  34. Ministére de l’environnement et du cadre de vie et Ministére des Transports. Guide du Bruit des Transports Terrestres; Prévision des Niveaux Sonores: Lyon, France, 1980. [Google Scholar]
  35. Official Gazette. Official Gazette of the Italian Republic, Law no. 447 of 26th October 1995; Official Gazette: Rome, Italy, 1995. [Google Scholar]
  36. European Union. Directive no. 2002/49/CE of the European Parliament and of the Council, of 25th June 2002. Off. J. Eur. Union 2002, 189, 12–25. [Google Scholar]
  37. Official Gazette of the Italian Republic. Decree of the President of the Council of Ministers (DPCM) of 14th November 1997; Official Gazette of the Italian Republic: Rome, Italy, 1997. [Google Scholar]
  38. European Union. European Commission Recommendation no. 2003/613/EC, of 6th August 2003. Off. J. Eur. Union 2003, 212, 49–64. [Google Scholar]
  39. UNI Standard No. 11143 of 2005; Metodo per la stima dell’impatto e del clima Acustico per Tipologia di Sorgenti—Parte 2, Rumore Stradale. Intereg: Rome, Italy, March 2005.
  40. Official Gazette of the Italian Republic. Decree of the President of the Council of Ministers (DPCM) of 30th March 2004, No. 142; Official Gazette of the Italian Republic: Rome, Italy, 2004. [Google Scholar]
  41. Official Gazette of the Italian Republic. Decree of the Ministry of the Environment of 16th March 1998; Official Gazette of the Italian Republic: Rome, Italy, 1998. [Google Scholar]
  42. European Commission. Directive (EU) no. 2015/996 of the European Commission, of 19th May 2015. Off. J. Eur. Union 2015, 192, 66–75. [Google Scholar]
  43. Official Gazette of the Italian Republic. Legislative Decree (D.Lgs.) No. 42 of 17th February 2017; Official Gazette of the Italian Republic: Rome, Italy, 2017. [Google Scholar]
  44. Nota, R.; Barelds, R.; Van Maercke, D. Harmonoise WP 3 Engineering Method for Road Traffic and Railway Noise after Validation and Fine-Tuning; Technical Report HAR32TR-040922-DGMR20; Harmonoise Project: Brussels, Belgium, 2005. [Google Scholar]
  45. Salomons, E.; van Maercke, D.; Defrance, J.; de Roo, F. The Harmonoise Sound Propagation Model. Acta Acust. United Acust. 2011, 97, 62–74. [Google Scholar] [CrossRef]
  46. algoWatt s.p.a. Mobility As-a-Service e Soluzioni per la Gestione Della Mobilità Sostenibile (Mobility As-a-Service and Solutions for the Sustainable Mobility Management). Available online: https://algowatt.com/download/mymaas/?ind=1625211565886&filename=algoWatt-MyMaaS.pdf&wpdmdl=41516&refresh=60dec2af7b0c81625211567 (accessed on 1 July 2022).
  47. Softeco Sismat s.r.l. IMOVE (Unlocking Large-Scale Access to Combined Mobility through a European MaaS Net-Work)—Deliverable 2.6; Final Open API Specification; European Union: Brussel, Belgium, 2020. [Google Scholar]
  48. Transportation Research Board. Highway Capacity Manual 2000; Transportation Research Board, National Research Council: Washington, DC, USA, 2000. [Google Scholar]
  49. MONI.C.A. Available online: https://www.monicapmslivorno.eu/ (accessed on 31 January 2022).
Figure 1. General outline of the operation of LIST port ITS system.
Sustainability 14 14579 g001
Figure 2. Overall architecture of the ITS system of the LIST Port project.
Sustainability 14 14579 g002
Figure 3. The process of noise emission calculation as implemented in the LIST Port app.
Sustainability 14 14579 g003
Figure 4. The “Traffic” web page of the app for the Piombino case study.
Sustainability 14 14579 g004
Figure 5. The “Routes” web page.
Sustainability 14 14579 g005
Table 1. The main flows of interaction between the architecture components (modules) in the ITS LIST Port System.
ModuleInput/Output DataSource of Input Data/Receiver of Output DataCommunication Protocol
LIST Port ITSSystem CentralINPUT DATA:
Vehicular flows and average vehicle speed and acceleration per vehicle category, detected by each traffic sensor (videocamera or inductive loop)
INPUT SOURCE:
videocameras/inductive loops
Web service (1): it allows the interoperability of cameras/sensors with the LIST Port ITS System Central
OUTPUT DATA:
Vehicular flows and average vehicle speed and acceleration per vehicle category, detected by each traffic sensor (videocamera or inductive loop)
OUTPUT
RECEIVER:
myMaaS emiXer: Data Adapter
module
Web service (1): it allows the interoperability of the LIST Port ITS System Central with MyMaaS emiXer
INPUT DATA:
Best routes, based on congestion levels detected by traffic sensors (videocameras or inductive loops)
INPUT SOURCE:
myMaaS emiXer: API module
Web service (1): it allows the interoperability of the LIST Port ITS System Central with MyMaaS emiXer
OUTPUT DATA:
Routing indications displayed by VMS panels
OUTPUT
RECEIVER:
VMS panels
Web service (1): it allows the interoperability of VMS panels with the LIST Port ITS System Central
Module for estimation of noise emissionsINPUT DATA:
Vehicular flows and average vehicle speed and acceleration per vehicle category, detected by each traffic sensor (videocamera or inductive loop)
INPUT SOURCE:
MyMaaS emiXer: Core module and Network Data Base
Internal API of myMaaS emiXer (2)
OUTPUT DATA:
Noise emissions (Lden, Lday, Levening, Lnight), calculated by CNOSSOS-EU model, written in C/C++ language
OUTPUT
RECEIVER:
myMaaS emiXer: Core module
Internal API of myMaaS emiXer (2)
Routing moduleINPUT DATA:
• Set of potential routes to/from port terminals
• Traffic flows and noise emissions in specific points of the urban area, where traffic sensors are placed.
INPUT SOURCE:
myMaaS emiXer: Route planner Engine
Internal API of myMaaS emiXer (2)
OUTPUT DATA:
Best route (in real time) to/from port terminals, based on traffic congestion and noise pollution
OUTPUT
RECEIVER:
myMaaS emiXer: Core Module
Internal API of myMaaS emiXer (2)
LIST Port app GUIINPUT DATA:
• Routing indications
• Noise emission values
• Other info mobility services
INPUT SOURCE:
myMaaS emiXer: Clients module
Internal API of myMaaS emiXer (2) with REST protocol (3)
(1) A web service is a software system which allows to make some computers or devices connected together, for example, by a VPN network. The LIST Port ITS System Central comprises also a web service which connects together: videocameras or traffic sensors, VMSs, the Central itself, and the LIST Port app back-end (in particular, the myMaaS emiXer part). (2) An internal API is an interface that enables the access, to the back-end app LIST Port information and functionality by another app or module (in particular to the myMaaS emiXer part of the back-end app). (3) REST (REpresentation State Transfer) is a system for data transmission based on HTTP protocol.
Table 2. Comparison of the features with the LIST Port app with the other existing apps.
VMZ (Berlin)511NY (New York)Trafiken (Sotckholm)Abu Dhabi ITC and Darbi MoibileMuoversi in ToscanaGoogle MapsInfobluTorrisi et al. (Catania ITS System)LIST Port app
Real time traffic information and real time routing by carXXXXXXXXX
Real time information and routing by car based on “acoustic capacity” X
Coverage of all the world X
Bus, train and metro servicesXX XXX X
Bus or metro ticketing X
Available parking slots X X
Maritime services XXX X
Maritime services ticketing X
Air services XX
Publisher’s Note: MDPI stays neutral with regard to jurisdictional claims in published maps and institutional affiliations.

