Article

Novel COVID-19 Based Optimization Algorithm (C-19BOA) for Performance Improvement of Power Systems

by
Sheikh Safiullah
1,
Asadur Rahman
1,*,
Shameem Ahmad Lone
1,
S. M. Suhail Hussain
2 and
Taha Selim Ustun
3,*
1
Electrical Engineering Department, National Institute of Technology Srinagar, Srinagar 190006, Jammu and Kashmir, India
2
Electrical Engineering Department, King Fahad University of Petroleum and Minerals, Dhahran 31261, Saudi Arabia
3
Fukushima Renewable Energy Institute, National Institute of Advanced Science and Technology (AIST), Koriyama 963-0215, Japan
*
Authors to whom correspondence should be addressed.
Sustainability 2022, 14(21), 14287; https://doi.org/10.3390/su142114287
Submission received: 29 August 2022 / Revised: 25 October 2022 / Accepted: 27 October 2022 / Published: 1 November 2022
(This article belongs to the Collection Impact of COVID-19 on the Environment, Energy and Economics)

Abstract

:
The ongoing pandemic due to novel coronavirus disease-2019 (COVID-19) has rapidly unsettled the health sector with a considerable fatality rate. The main factors that help minimize the spread of this deadly virus are the proper use of masks, social distancing and antibody growth rate in a person. Based on these factors, we propose a new nature-inspired meta-heuristic algorithm named COVID-19 Based Optimization Algorithm (C-19BOA). The proposed C-19BOA mimics the spread and control behavior of coronavirus disease centered on three containment factors: (1) social distancing, (2) use of masks, and (3) antibody rate. Initially, the mathematical models of containment factors are presented, and further, the proposed C-19BOA is developed. To ascertain the effectiveness of the developed C-19BOA, its performance is verified on standard IEEE mathematical benchmark functions for the minimization of these benchmark functions and convergence to the optimal values. These performances are compared with established bio-inspired optimization algorithms available in the literature. Finally, the developed C-19BOA is applied on an electrical power system load–frequency–control model to test its effectiveness in optimizing the power system parameters and to check its applicability in solving modern engineering problems. A performance comparison of the proposed C-19BOA and other optimization algorithms is validated based on optimizing the controller gains for reducing the steady-state errors by comparing the effective frequency and tie-line power regulation ability of an industrially applied Proportional–Integral–Derivative controller (PID) and Active Disturbance Rejection controller (ADRC). Moreover, the robustness of C-19BOA optimized PID and ADRC gains is tested by varying the system parameters from their nominal values.

Graphical Abstract

1. Introduction

The maiden instance of the ongoing coronavirus disease-2019 (COVID-19) pandemic was diagnosed at China’s Wuhan city, the epicenter of the COVID-19 epidemic, during December 2019. The disease has globally infected around 600 million people and taken the life of more than 6 million so far [1]. The virus responsible for COVID-19 spreads primarily from one infected person to another person in contact with each other. Minute drops and aerosols comprising the virus spread from an infected person to another person through the nose and mouth during breathing, coughing, sneezing or speaking. Another factor of transmission, although not the main mode, is through contaminated surfaces. The exact mode of virus transmission is recognized convincingly, but the primary factor for virus spread is when people are in close contact for long enough. While efforts are ongoing to make available the developed drugs and vaccines in order to inhibit the virus, the primary management is symptomatic. Preventive methods involve social distancing, covering coughs and sneezes, use of masks, hand washing etc. Additionally, if a person is infected, the antibody rate formation against the virus proliferation plays an important factor in inhibiting the virus.
Owing to the recent trends in developing optimization algorithms for various optimization processes, nature-inspired phenomenon are modified to form such algorithms. Bio-inspired models are nature-inspired replicas that aimed for successful application in hybrid methodologies. These are designed to evaluate the parameters in artificial-intelligence based machine learning optimizations. Meta-heuristics deal through vast search spaces and discover sub-optimal solutions in fairly desired execution times [2]. Numerous such meta-heuristic algorithms based on natural genetics [3], biogeography [4], particle swarms [5], bee colony [6], cuckoo [7], magnetotactic bacteria [8], gray wolf [9], arithmetic optimization [10], and archimedes optimization [11] are available in the literature.
One of the main throwbacks of an optimization technique is its application in real-world problems. Almost every optimization technique finds its application in power system applications such as the load–frequency (LFC) applications of power systems. The main aim of LFC operation is to keep the system frequency within defined limits. Here, the controller gains are optimized using any optimization approach. Hence, the application of the proposed technique in real-world power system problems needs to be studied.

Related Works

One of the most protracted meta-heuristic algorithms implemented to advance deep learning problems is genetic algorithm (GA) [3]. GA is constructed on the perception of Darwin’s well-known evolution and natural selection theories, which are expressed in terms of mathematical operators for biological features. Inspired by the mathematics of GA and biological neurons, the author in [4] has formulated biogeography-based optimization (BBO). Another substantial advancement in this field is the particle swarm optimization (PSO) by [5]. The PSO algorithm is inspired by fish and bird swarm intelligence. The authors in [6] proposed an artificial bee colony (ABC) algorithm built on the smart behavior of honey-bee swarm. The cuckoo search algorithm (CSA), which is motivated based on the coercive brood-parasitic conduct of cuckoo breeds, is reported in [7]. Magnetotactic bacteria optimization (MBO) reported in [8] is inspired by the bending of a magnetic field by certain organisms for survival. The authors in [9] have proposed an interesting algorithm called gray wolf optimizer, the concept of which is driven by the supervision capabilities for hunting behavior of gray wolves persistent in a wildlife. Likewise, other bio-inspired algorithms available in the literature are the Salp Swarm Algorithm (SSA) [12], Whale Optimization Algorithm (WOA) [13], Laying Chicken Algorithm [14], Big Bang Algorithm [15] and Swine Influenza-Inspired Optimization (SIIO) [16].
It can be inferred from the above literature that meta-heuristic models are rising areas of interest in research. However, very few studies based on virus proliferation models are available in the literature. The Virus Optimization Algorithm (VOA) was suggested [17] in 2016 and further enhanced for continuous optimization problems in [18]. The authors in [19] suggested a bio-inspired meta-heuristic mimicking the coronavirus spread pattern and its infection nature. The authors in [20] have proposed COVID-19 models based on infection spreads. Similarly, the authors in [21,22,23,24] have modeled the disease propagation of COVID-19-natured processes. This motivates the authors of the present paper to propose an optimization algorithm based on COVID-19 behavior. It needs further testing for its applicability in various standard benchmark functions and modern engineering problems.
From the studies above, it can be inferred that there has been increasing attention for the development of meta-heuristic algorithms. However, very few studies in the literature are based on the application of the COVID-19 phenomenon in artificial intelligence applications. Moreover, the parameters used for the development of the present algorithm are incorporated based on the research carried out keeping in consideration the rates described by the World Health Organization (WHO). Furthermore, the evolutionary algorithms mentioned above are based on the traits of certain species. However, most of the algorithms deal with the characteristics of species that are alien to common man. Thus, the basic understanding of such algorithms is not clear, which makes it very confusing for a common man to understand the application in real-world problems. Hence, a novel algorithm is to be developed such that the basic process of the algorithm is already known to everyone.
Owing to the advances in artificial intelligence methods in practical scenarios, the optimization techniques discussed in [3,4,5,6,7,8,9,10,11,12,13,14,15,16] have been successfully employed in real-world applications. The main aim of employing such techniques in practical applications is to tune the system parameters for effective system performance results. GA-based LFC for frequency regulation of a multi-area power system is studied in [25]. Similarly, GA is employed in [26,27,28]. BBO base optimization studies are reported in [29,30,31]. The authors in in [32,33,34,35] have employed the PSO technique for controller gain tuning. The authors in [36,37] have used the ABC. Likewise, the CSA technique for LFC of a multi-area power system is used in [38]. Firefly (FA) based optimization is studied in [39,40]. GWO technique-based LFC is reported in [41]. A magnetotactic-based optimization technique (MBO) is applied for controller gain tuning in [42,43,44,45,46,47]. New optimization techniques such as flower pollination algorithm [48], satin bowerbird optimization [49], butterfly optimization algorithm [50], artificial gorilla troops [51],honey badger algorithm [52] are also used in the literature.
Any optimization technique is said to be effective enough if it tunes the controller gain parameters within its limited constraints. The main purpose of LFC operation is to adjust the controller gains for the desired frequency operation. An industrially applied proportional–integral–derivative (PID) controller has been the best choice for control system engineers for a long time. A PID controller for performance analysis of a multi-area power system is reported in [53]. Similarly, the authors in [54] have employed a PID controller for a coexisting system voltage/frequency control. Likewise, there have been ample advancements in PID controllers for LFC studies as reported in [55,56,57]. Nonetheless, the generalized operation of PID controller in practical applications is challenged by a new ADRC control strategy introduced by authors in [58]. In [59], the author established the superiority of ADRC against PID in problem-solving procedures such as time-delay, non-linear control and parallel system control. The authors in [60] have explored a simulated study of ADRC as a control tool. In [61], the linear ADRC is assessed, demonstrating the linear ADRC’s greater applicability range. In [62], researchers investigated a two-layer ADRC for frequency regulation. The authors of the present work have explored fractional-order ADRC for the frequency and voltage regulation of a hybrid power system [44]. It is important to mention that fractional-order designs increase the controller complexity. Hence, the preceding explanation motivates the authors to further develop and test a less complex yet effective ADRC scheme for analyzing the performance of a hybrid power system.
The major contributions and objectives defining the presented work are discussed in the next sections.

2. Contributions/Novelty of the Present Study

The major contributions pertaining to the present studies are:
1.
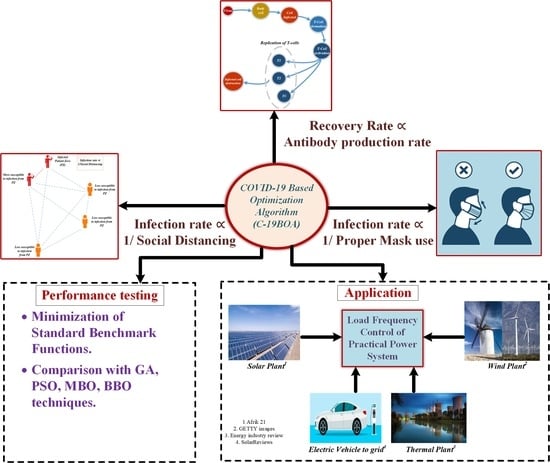
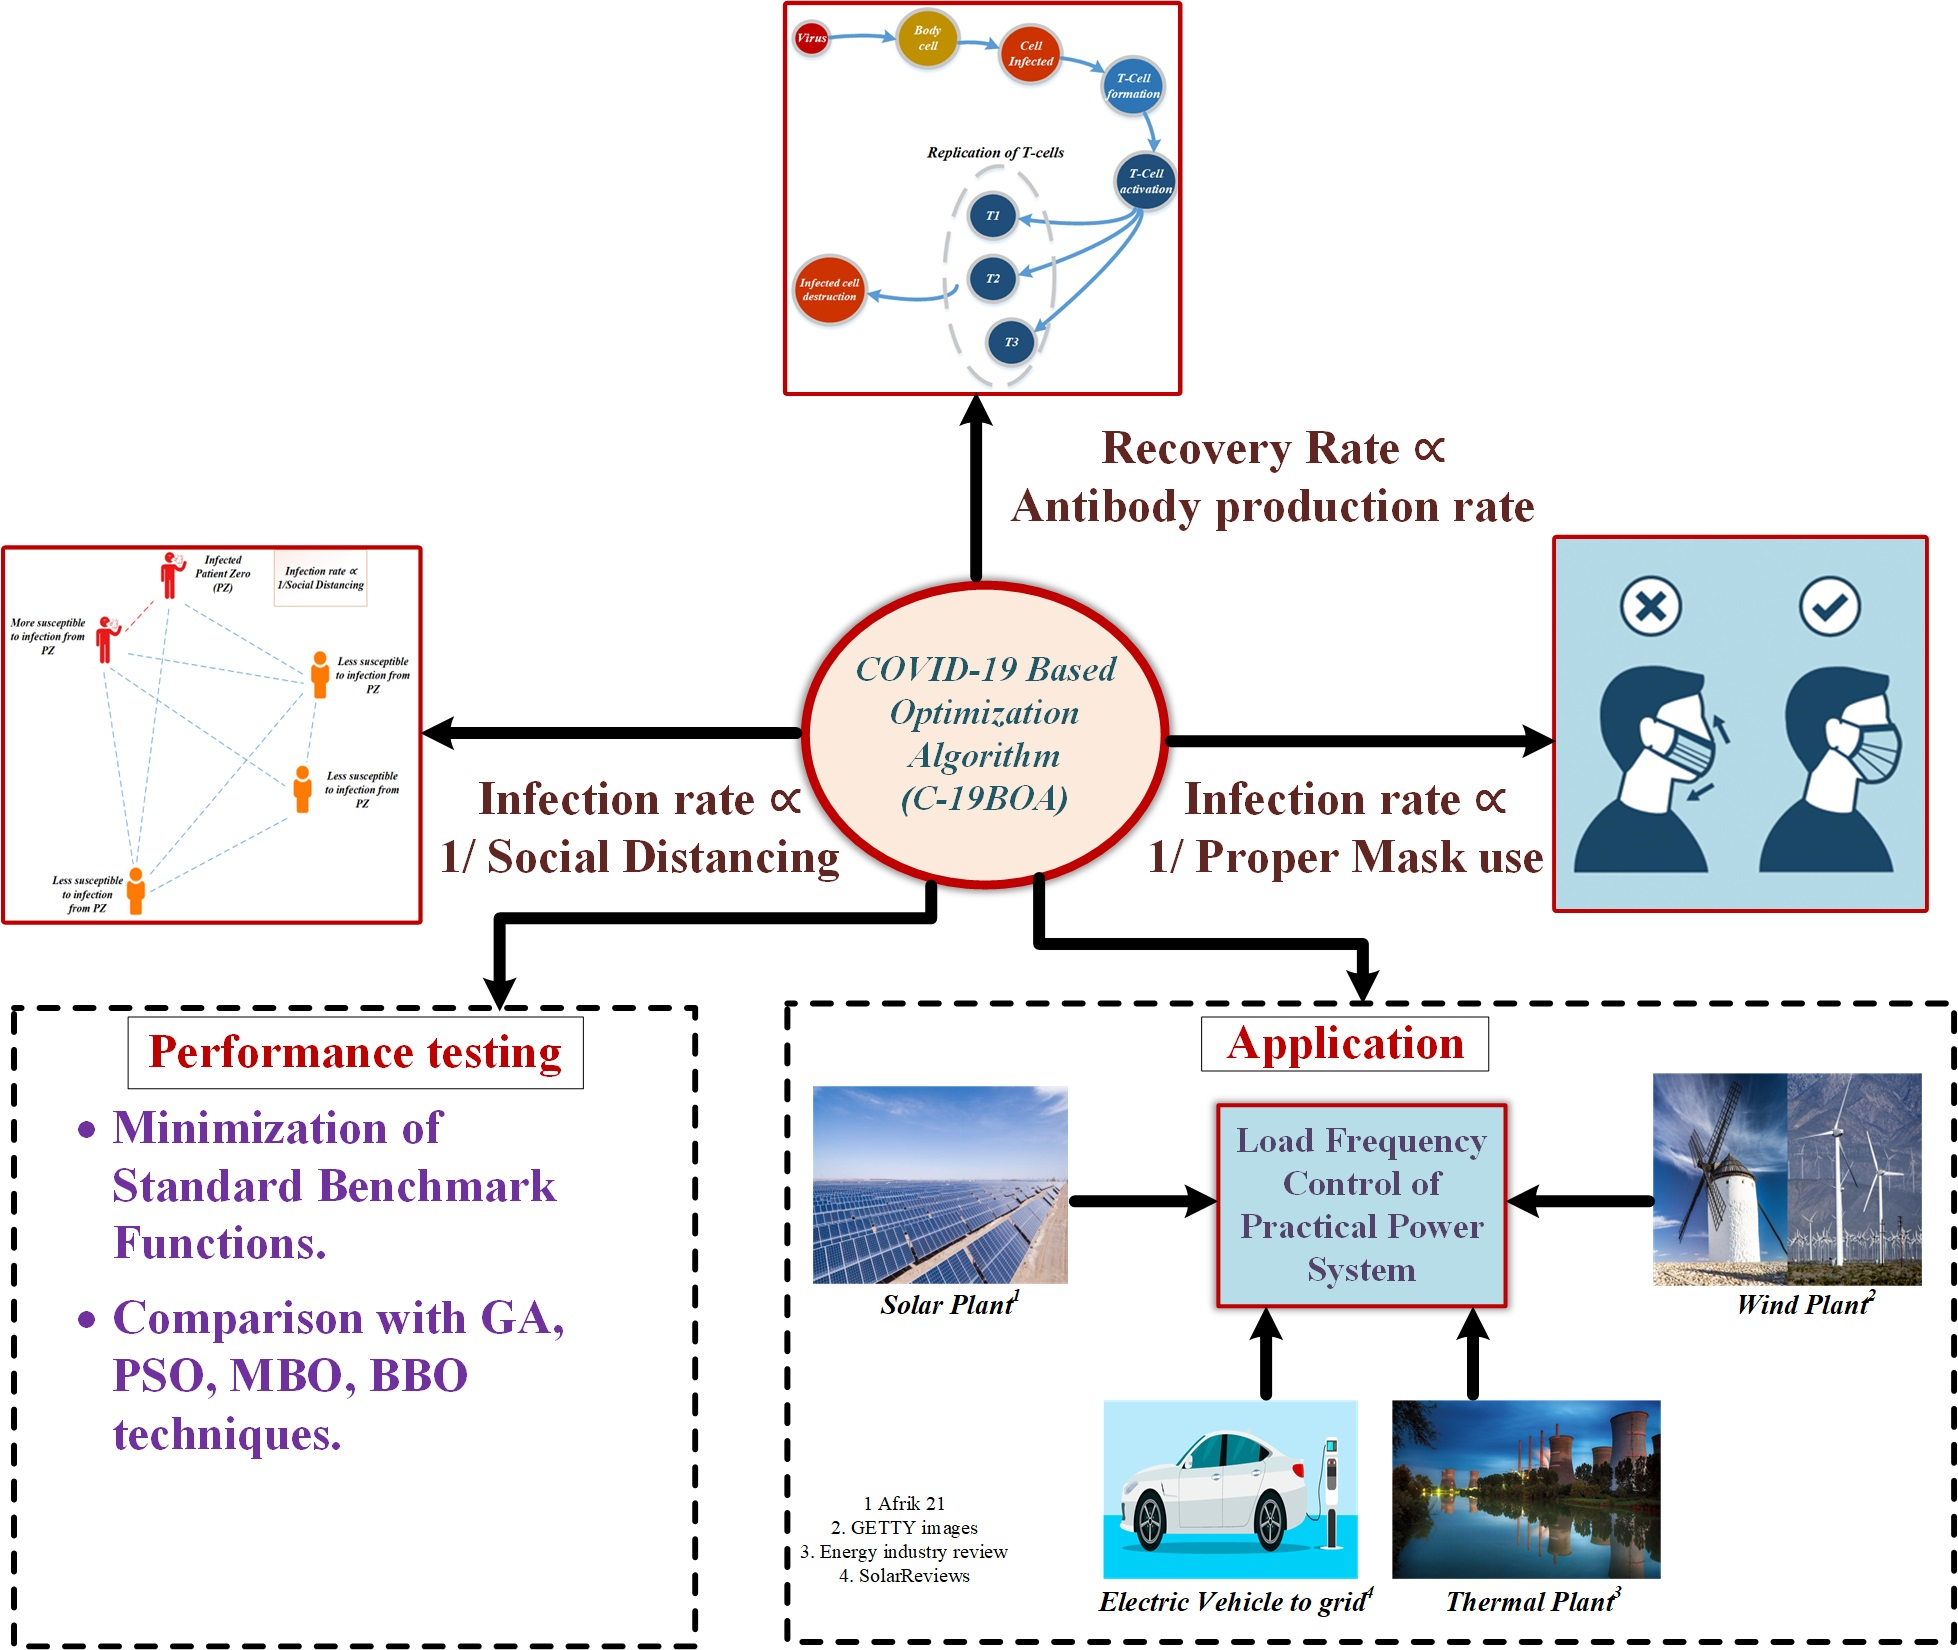
A population-based, nature-inspired COVID-19 Based Optimization Algorithm (C-19BOA) is introduced based on the behavior of present day coronavirus disease propagation. The proposed algorithm mimics the virus infection propagation and decimation phenomenon in nature. The algorithm is modeled based on some already known containment factors such as social distancing, use of masks and antibody rate.
2.
A 2nd order Active Disturbance Rejection controller (ADRC) with a state estimation-based observer is developed. The performance of ADRC is compared with an industrial applied PID controller on a hybrid power system. The dominance of the proposed controller is verified with respect to an industrially applied PID controller based on system dynamic performance analysis.
3.
Application of the proposed C-19BOA for optimizing the gains of 2nd order ADRC and PID controllers for effective frequency and tie-line power regulation capability of a power system. The power system is subjected to some practical case scenarios in order to check the applicability of the proposed optimization algorithm.

3. Objectives of the Present Study

The objectives defined for application of the proposed C-19BOA are:
1.
To develop a population-based, nature-inspired COVID-19 Based Optimization Algorithm (C-19BOA) based on the behavior of present-day coronavirus disease propagation.
2.
To compare and authenticate the performance of C-19BOA with established optimization algorithms available in the literature, based on the convergence for IEE standard mathematical benchmark functions.
3.
To validate the performance of C-19BOA on optimizing the 2nd order ADRC and PID controller gains in order to improve the performance of a practical power system.
4.
To check the robustness of C-19BOA optimized ADRC and PID controllers for alterations in power system parameters with respect to nominal conditions.

4. Paper Organization

Initially, the methodology to develop the proposed optimization algorithm C-19BOA is discussed in Section 5. Then, in Section 6, the performance of C-19BOA is evaluated for some standard benchmark functions. This is compared with a few of the established optimization techniques available in the literature, such as GA [3], BBO [4], PSO [5], MBO [8] and AOA [10]. Next, in Section 7, the design and modeling of a modern-day hybrid power system is demonstrated (Section 7.1). Furthermore, in Section 7.3, the applicability of C-19BOA on optimizing a PID controller for the LFC operation of a hybrid power system is compared with the above-mentioned different optimization techniques. The design of 2nd-order ADRC is illustrated in Section 7.2. In addition to the study reported in Section 7.3, a comparative analysis between C-19BOA optimized 2nd order ADRC and PID controllers is completed in Section 7.4 to check the performance improvement with respect to each other. Finally, in Section 7.5, a sensitivity test is performed to check the robustness of C-19BOA optimized ADRC and PID controller gains for practical changes in power system parameters.

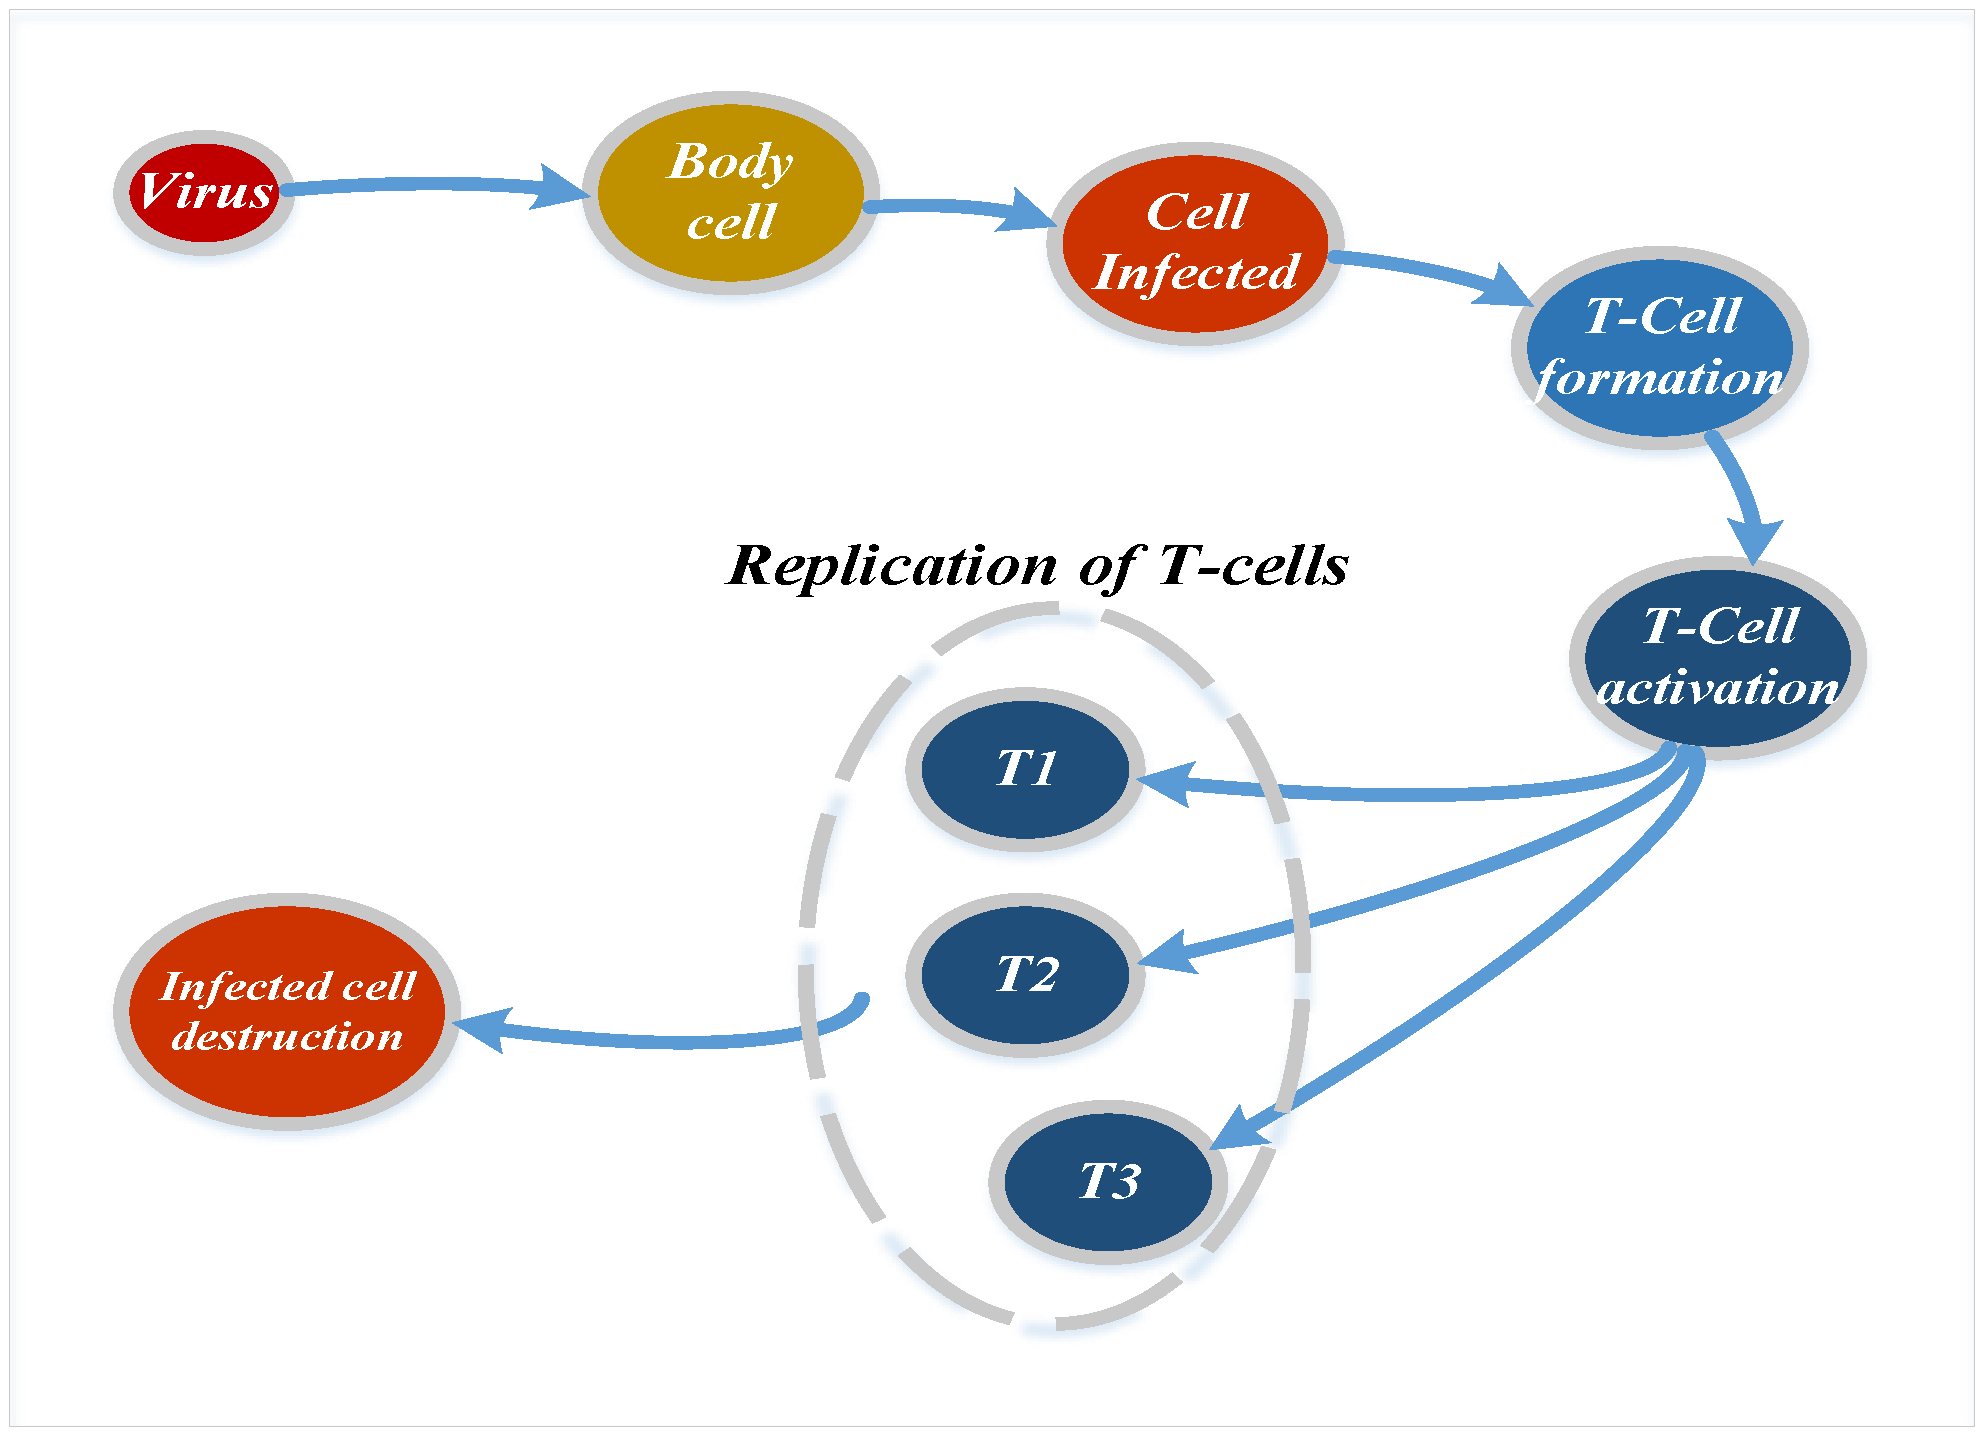
5. COVID-19 Based Optimization Algorithm (C-19BOA) Methodology

This section describes the methodology of the proposed C-19BOA. Initially, the containment factors related to the COVID-19 phenomenon are introduced, and their mathematical modeling is presented. Furthermore, the algorithm C-19BOA is framed based on these containment factors. The attributes to be estimated for C-19BOA are explained in the following subsections.

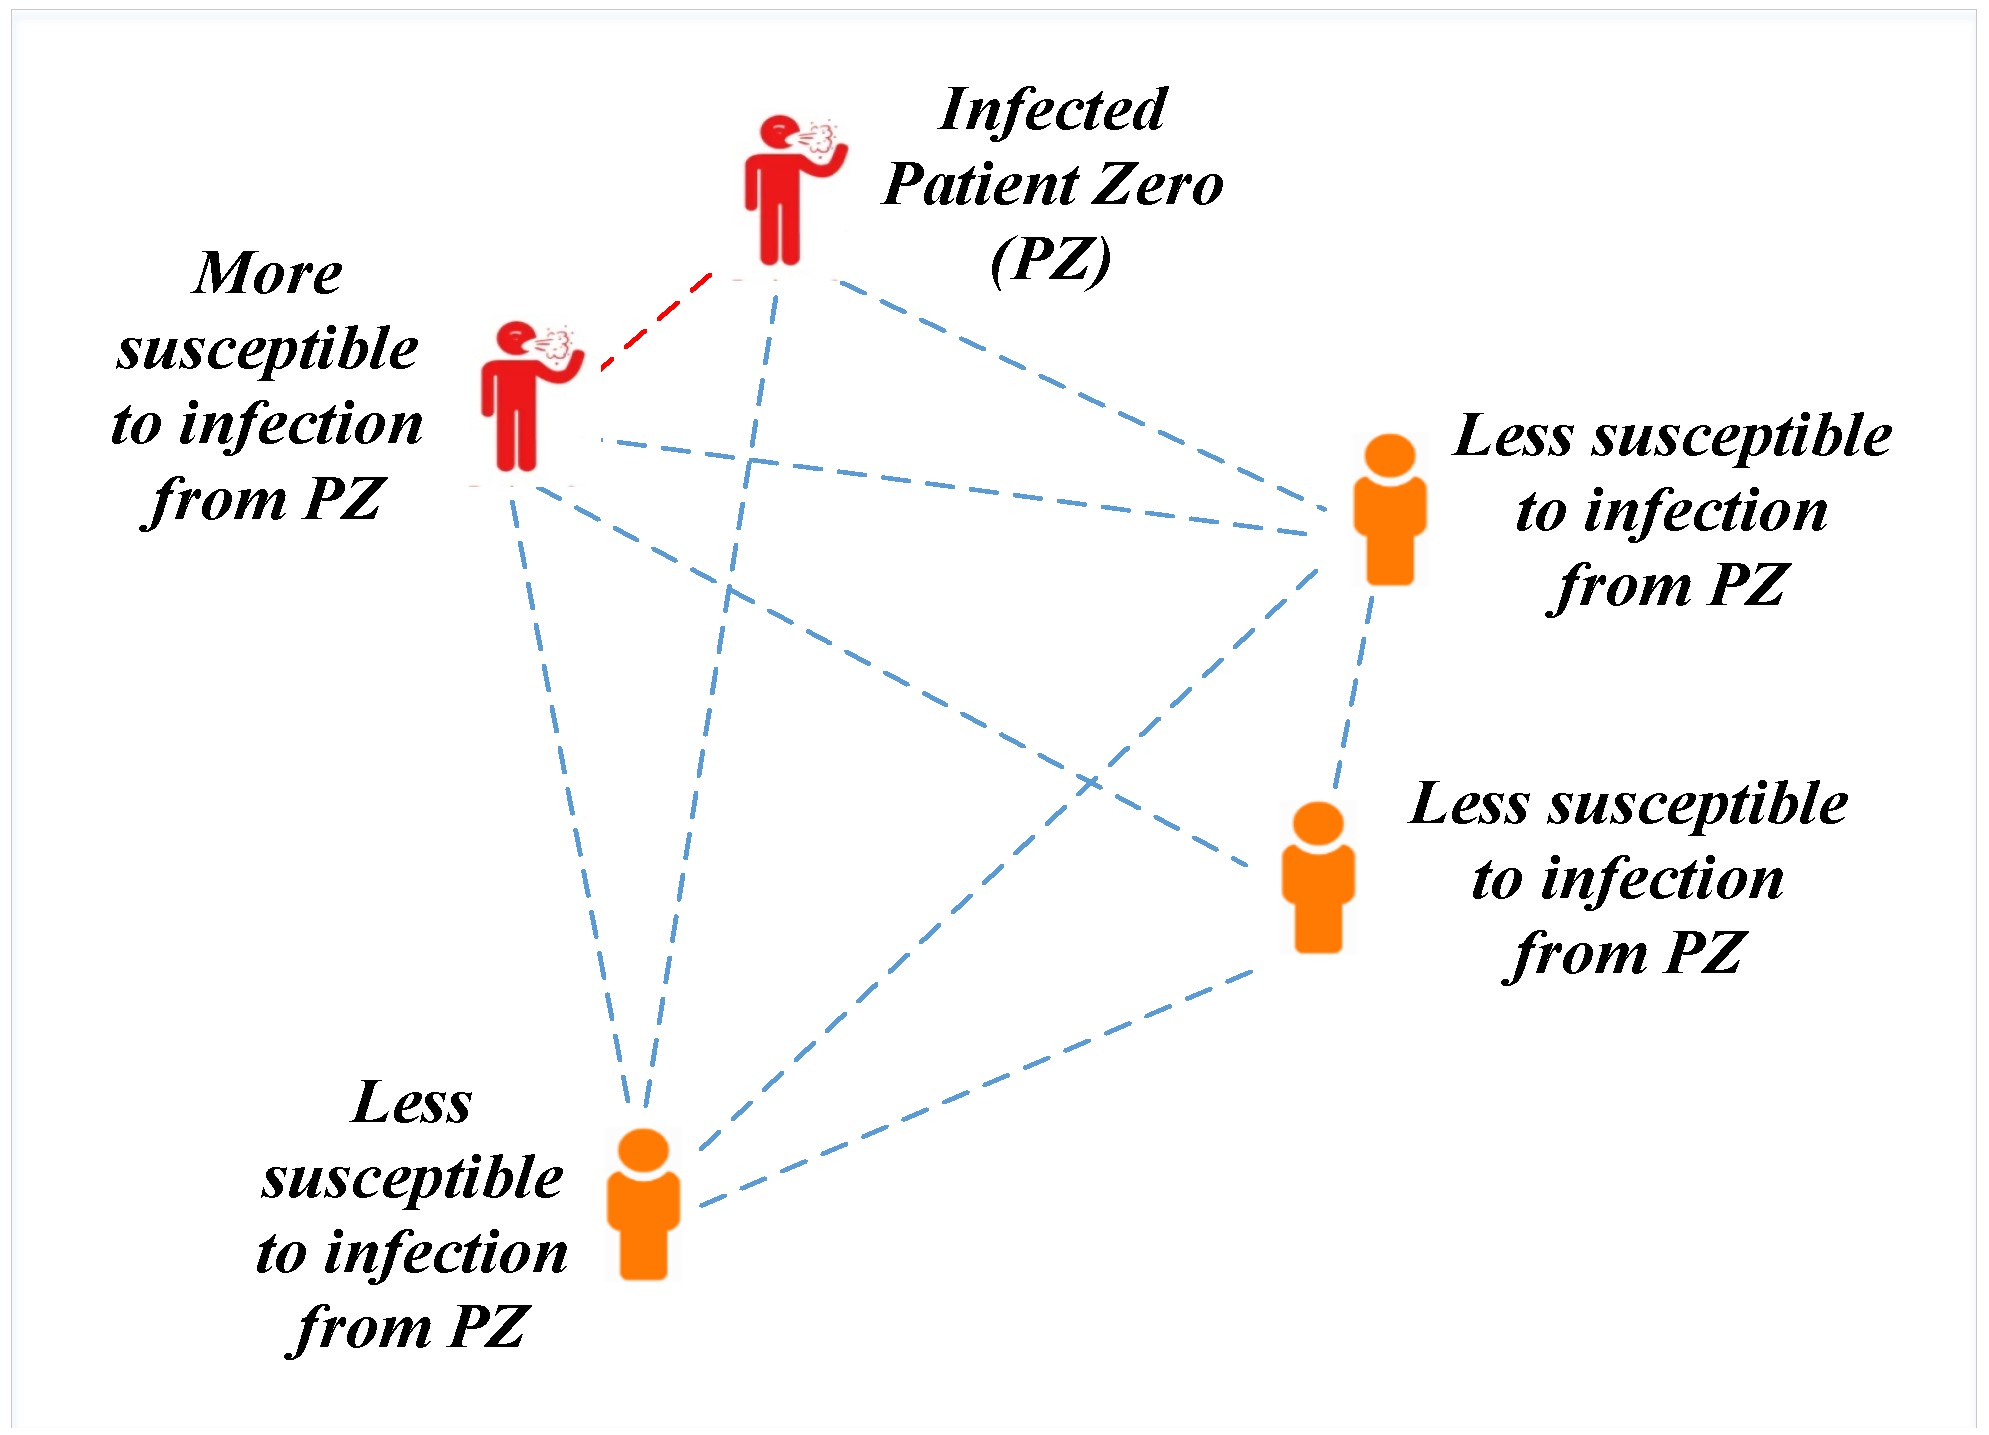
5.1. Initial Population

An initial population with ’n’ number of individuals (row) and ’p’ parameters (column) is considered. The primary population involves one infected individual, which is referred to as patient-zero (PZ). It is assumed that PZ infects some of the population. Primarily, a random initialization is performed to infect certain individuals of the population. An initial matrix x ( n , p ) is formed using (1).
x ( n , p ) = L l + r a n d o m ( n , p ) × { U l L l } .
where L l and U l are the upper and lower limits of the solution. The values of upper and lower limits vary according to the problem definition. Hence, it becomes necessary to normalize the initial matrix for further calculations. The normalization of the initial matrix x ( n , p ) is completed using (2) and represented as x n o r m ( n , p ) matrix.
x n o r m ( n , p ) = x ( n , p ) m i n ( x ) m a x ( x ) m i n ( x ) .

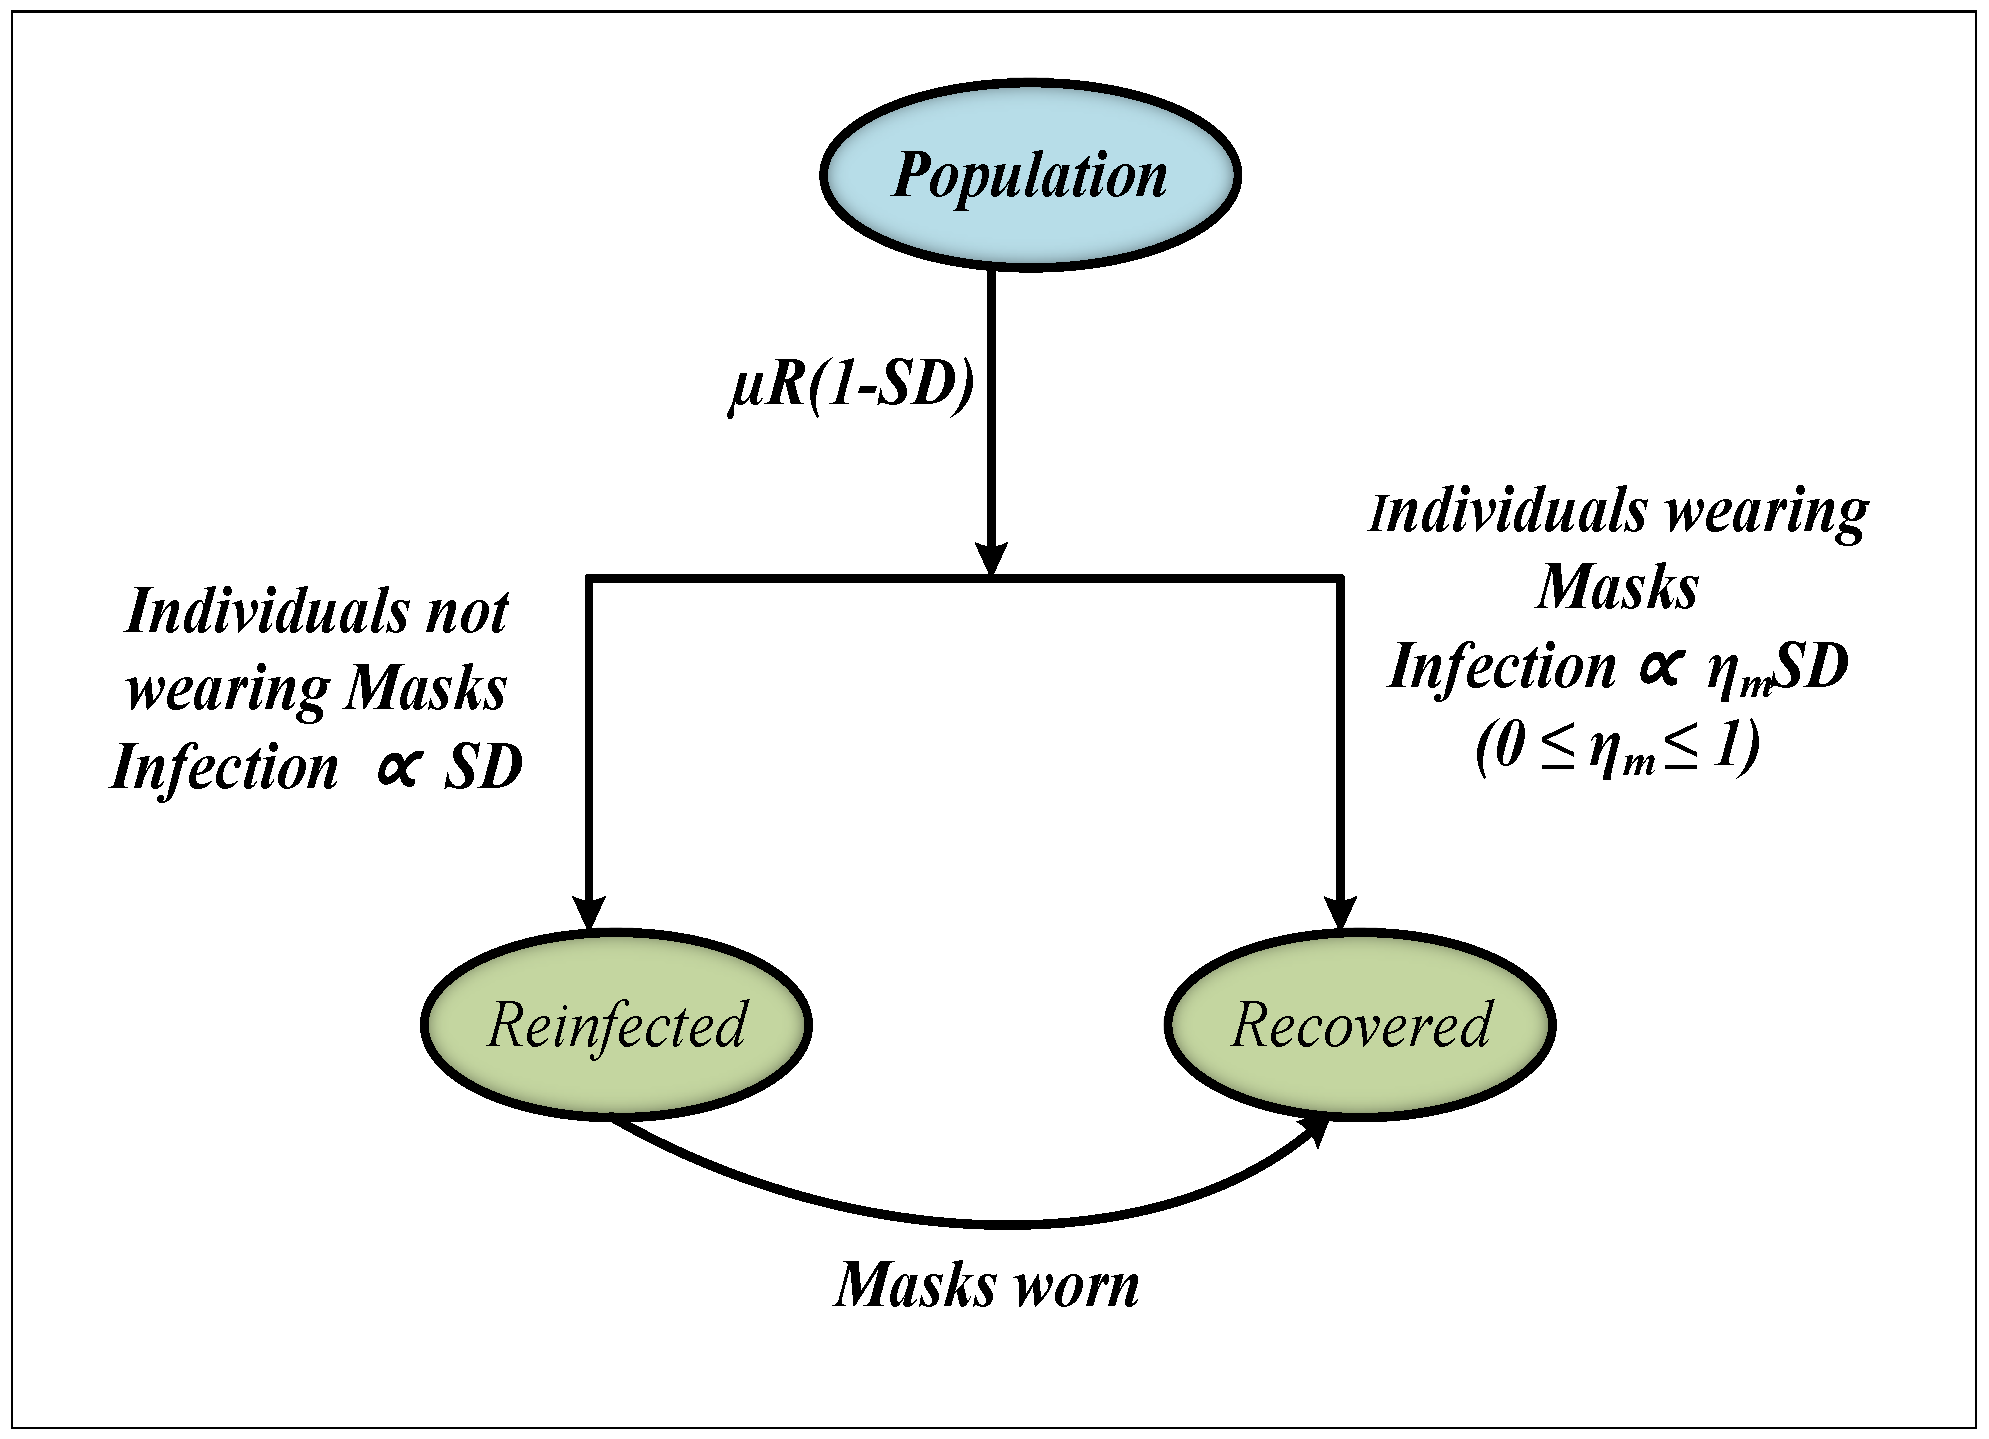
5.2. Containment Factors

The containment factors are based on the disease-propagating nature of COVID-19. Containment factors majorly include (a) social distancing, (b) use of mask, and (c) antibody rate calculation of each individual after initial infection. After patient-zero (PZ) infects some of the population, the containment factors for each individual are evaluated. Table 1 provides the description of different elements used for the containment factors’ evaluation as reported in [63]. The mathematical modeling of each containment factor is discussed below.
(a) Social Distancing (SD): As in the case of coronavirus infection, an infected person (individual) has to be isolated from the rest of the population in order to minimize the infection rate. A similar approach is dealt in the present study after initial infection. Every individual is checked for SD factor calculation. An SD matrix is formulated representing the distance among parameters in a population. In the simplest form, the distance (D) between any two normalized parameters, i and j, can be calculated as shown in (3).
D i s t a n c e ( D ) = i j ; i j .
The normalized matrix x n o r m ( n , p ) represented in (2) is considered for SD factor calculation. The matrix x n o r m ( n , p ) can be elaborated as shown in (4). An SD matrix is formulated (5) with the help of x n o r m ( n , p ) by considering the distances among parameters having dimensions equal to n × j × p. The SD matrix formed consists of p sub-matrices each having dimensions equal to n × j.
x n o r m ( n , p ) = x n o r m 11 x n o r m 12 x n o r m 1 p x n o r m 21 x n o r m 22 x n o r m 2 p | | | | | x n o r m n 1 x n o r m n 2 x n o r m n p .
S D ( n , j , p ) = { x n o r m ( n , p ) x n o r m ( j , p ) } ; j = 1 : n , n j .
If any individual violates SD norms and comes close to an infected one, it has high chances of getting infected. IR is the infection rate due to violation of the SD factor. So, the higher the value of SD factor, the less the IR. Let the distance below which infection can spread due to violation of the SD factor be named as the threshold distance (TD). The practical value of threshold distance (TD) according to guidelines of the World Health Organization (WHO) is considered as 6 feet [64]. For the present work, the practical distance is normalized between a range of 0 and 1 such that 0 indicates the least value of TD, while 1 indicates the maximum value (6 feet). Let ρ S D be the social distancing probability in the present work denoting the normalized value of practical distance; 0 ≤ ρ S D ≤ 1. A pictorial representation of the impact of SD on infection rate (IR) is depicted in Figure 1.
(b) Use of Masks: Medical/surgical face masks block the spread of breathing drops, thereby, they guarantee a higher protection against the disease propagation. As soon as the person is exposed to the infection on effective contacts (when the SD is less than TD), the individual develops infection based on rate µR. µR is the rate at which susceptible individuals of a population are exposed to infection. The value of µR is calculated using R 0 (refer Table 1) and given by (6).
μ R = R 0 T i n f e c t i o n .
Thus, the disease propagation rate (DPR) based on mask use for a ‘n × p’ population is given by (7).
D P R ( p , j , n ) = μ R { 1 S D ( n , j , p ) } .
Consider a proportion of the population correctly and constantly wearing face masks. Let η m be the efficiency of each mask to block virus proliferation. The overall infection spreading rate and recovery rate can be analyzed using Figure 2. Based on the above assumptions and schematic shown in Figure 2, the DPR model equation given in (7) is further modified to mask infection rate MIR (8), as stated in [23].
M I R ( p , j , n ) = μ R { 1 S D ( n , j , p ) } { S D ( n , j , p ) + η m x n o r m ( n , p ) } .
where S D ( n , j , p ) is the SD matrix formed using (5).
Consider ρ M being the mask use probability, denoting the normalized value of proper mask usage; 0 ≤ ρ M ≤ 1. It is considered that any individual having SD and MIR more than social distancing probability ( ρ S D ) and mask use probability ( ρ M ) , respectively, is reinfected. Finally, the individuals are checked for their antibody rates using the following antibody rate (AR) factor.
(c) Antibody Rate (AR): Previous studies reported in [65,66] have used the response of T-immune cells to mitigate influenza virus. The present model adopts the ability of T-immune cells for killing the virus propagation (W) reported in [63]. For the present work, the antibody rate of population x n o r m ( n , p ) (2) is calculated using (9):
A R ( n , j , p ) = x n o r m ( n , p ) { r ( 1 x n o r m ( j , p ) K ) ( c + 1 ) } .
where
  • AR symbolizes the infection killing rate of cells by immune response due to evolved antibody.
  • K is the maximum carrying capacity of virus replication.
  • r is the replication rate.
  • c is the rate at which virus is cleared.
The overall process of killing infected cells of the human body by T-cells is demonstrated in Figure 3. On a scale of 0 to 1, let ρ A R be the antibody rate probability of an individual. The minimum infection killing rate of cells by the immune response of an individual is denoted by 0, whereas 1 denotes the maximum infection killing rate of cells by immune response. Thus, individuals that have a greater AR value than ρ A R value are considered as recovered and are treated as healthy individuals of the population. The individual with the highest AR is treated as the healthiest individual out of the recovered population.

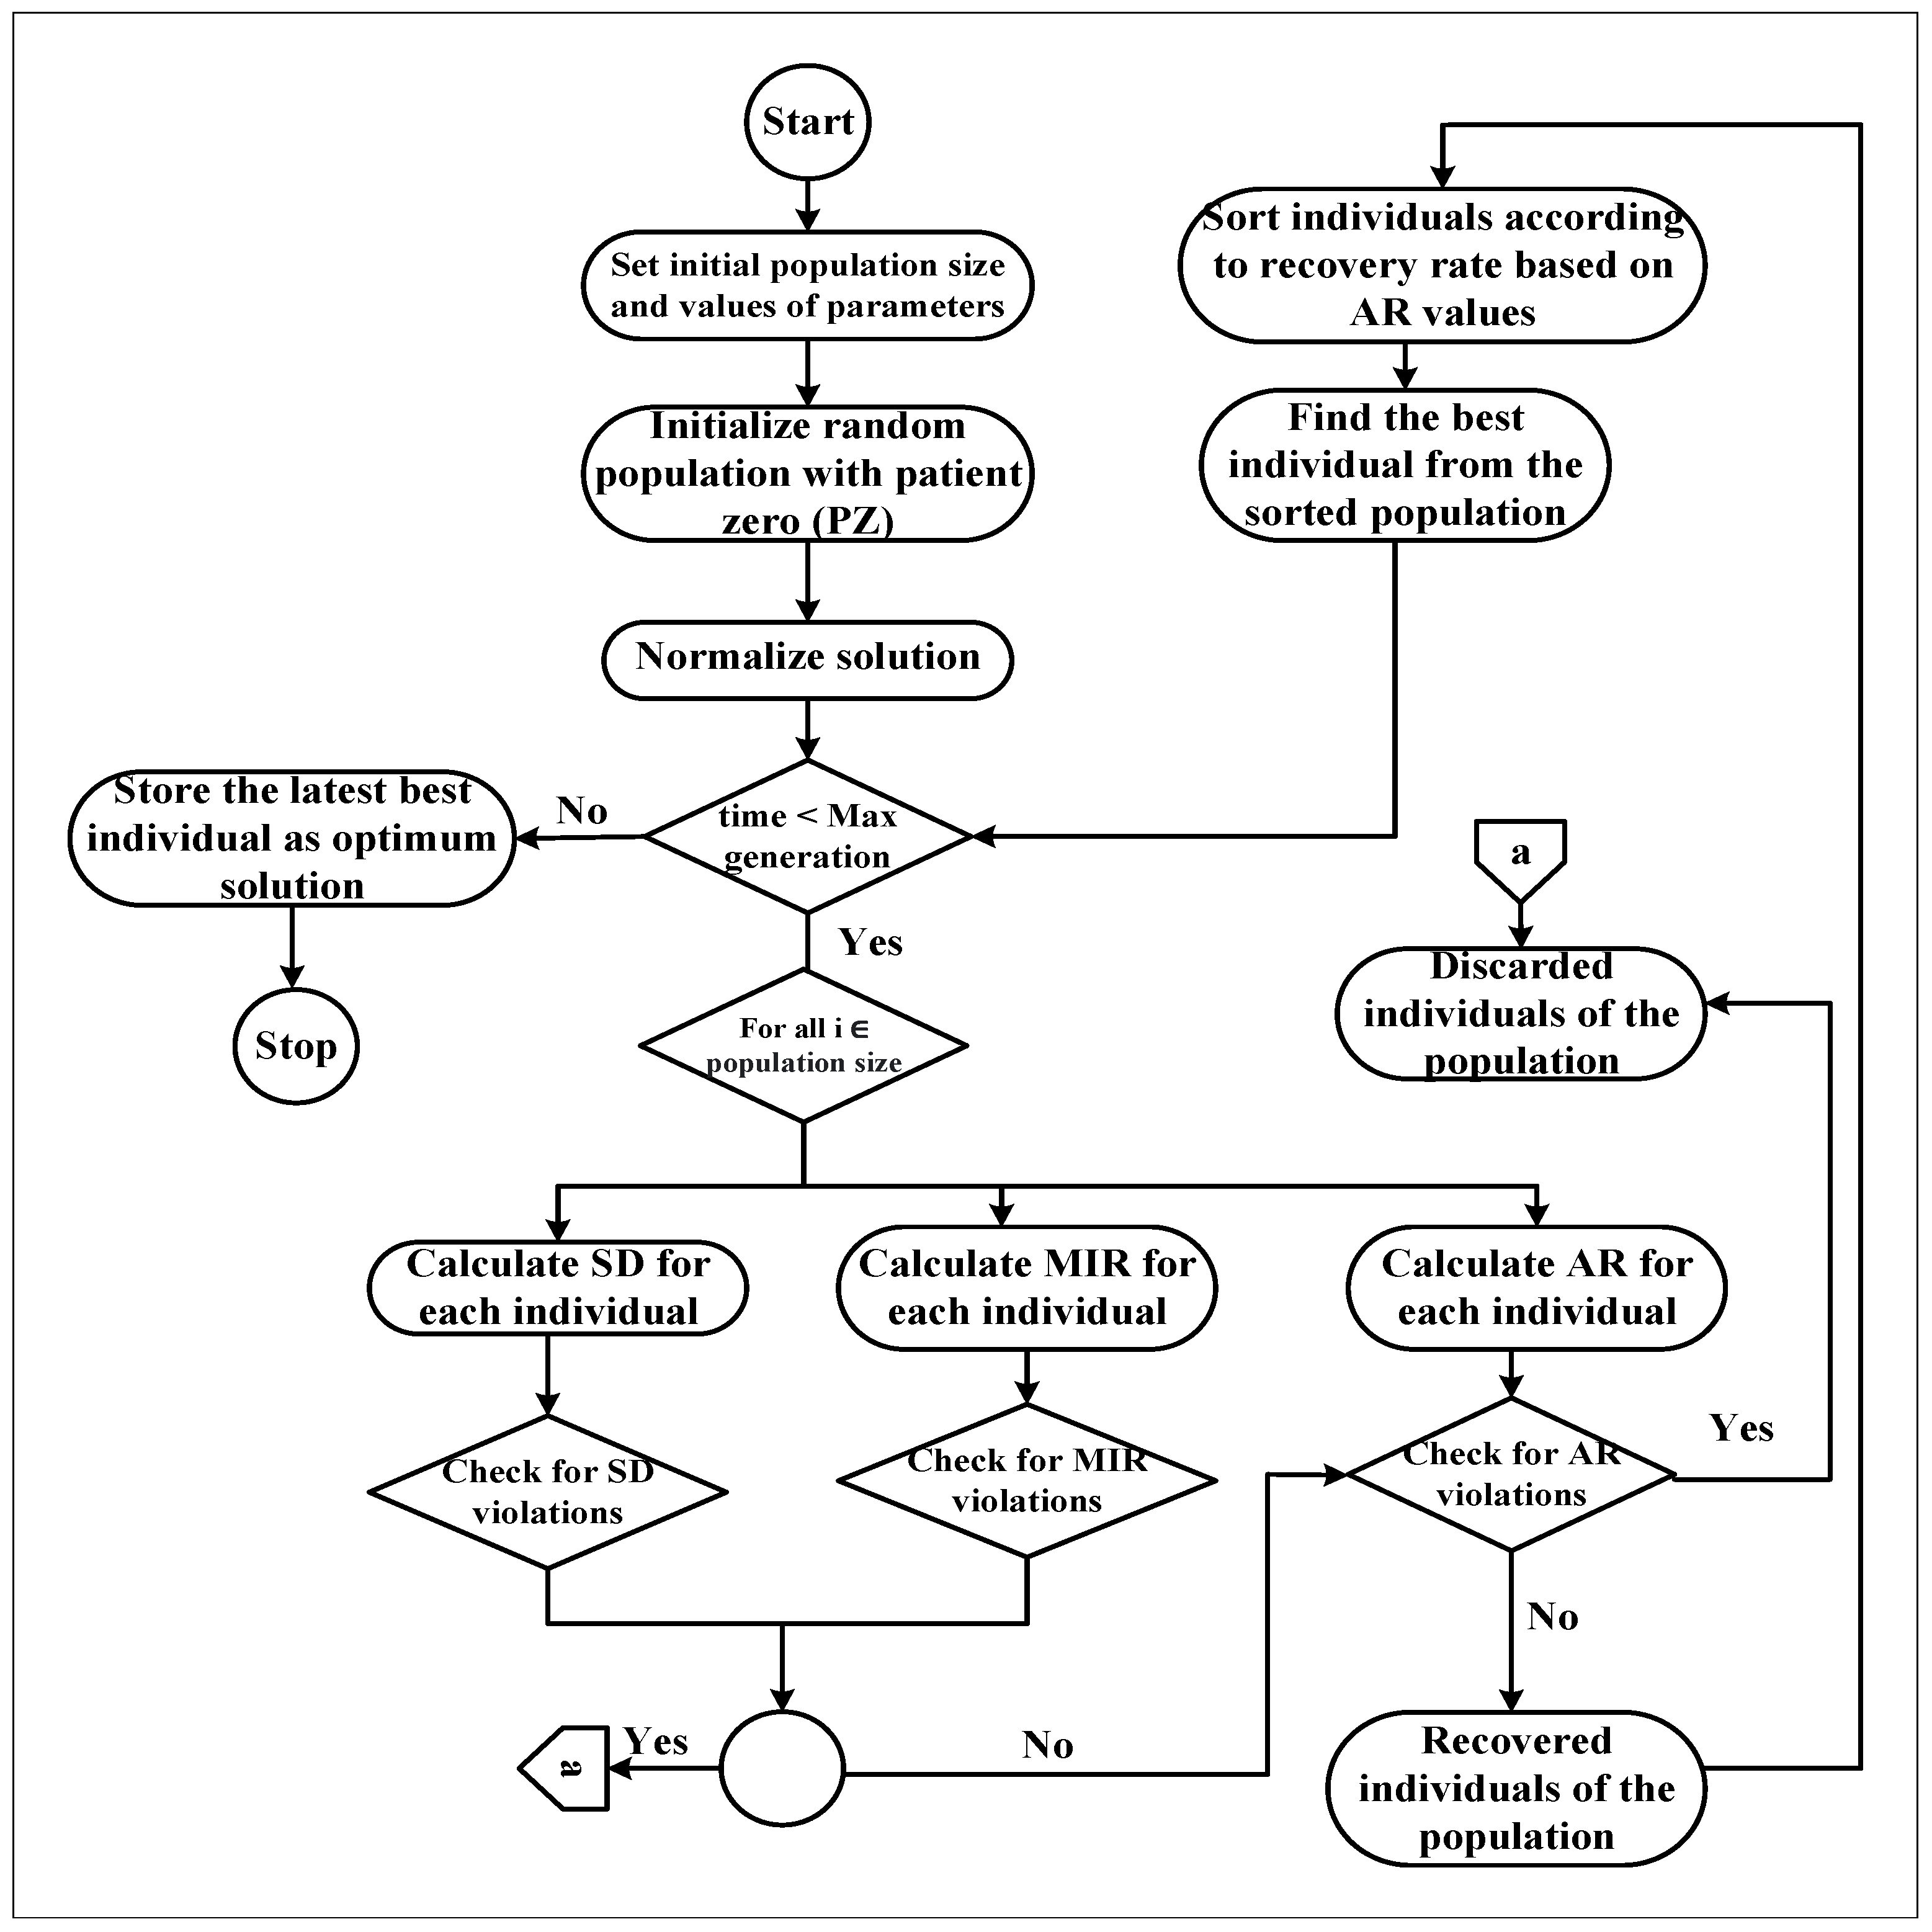
5.3. Procedure and Flowchart for C-19BOA

The step-by-step procedure of the developed optimization algorithm C-19BOA is described as mentioned below:
1.
Generate initial population with PZ as infected.
2.
Normalize population.
3.
For (time < iteration limit)
4.
Calculate SD and MIR of individuals in the population using (5) and (8), respectively.
5.
Check violations for SD and MIR.
Individuals with SD < ρ S D and MIR < ρ M are reinfected and discarded. Others go for AR check.
6.
Calculate AR of individuals in the population using (9).
7.
Individuals having AR > ρ A R are treated as recovered. However, individuals with AR < ρ A R are unhealthy and discarded.
8.
The recovered population are sorted according to their recovery rate. Store the Best individual from the sorted population having a maximum recovery rate.
9.
Continue until point no. 3 is terminated.
10.
The latest Best individual is the final optimum solution.
The flowchart for the developed algorithm C-19BOA is described in Figure 4.

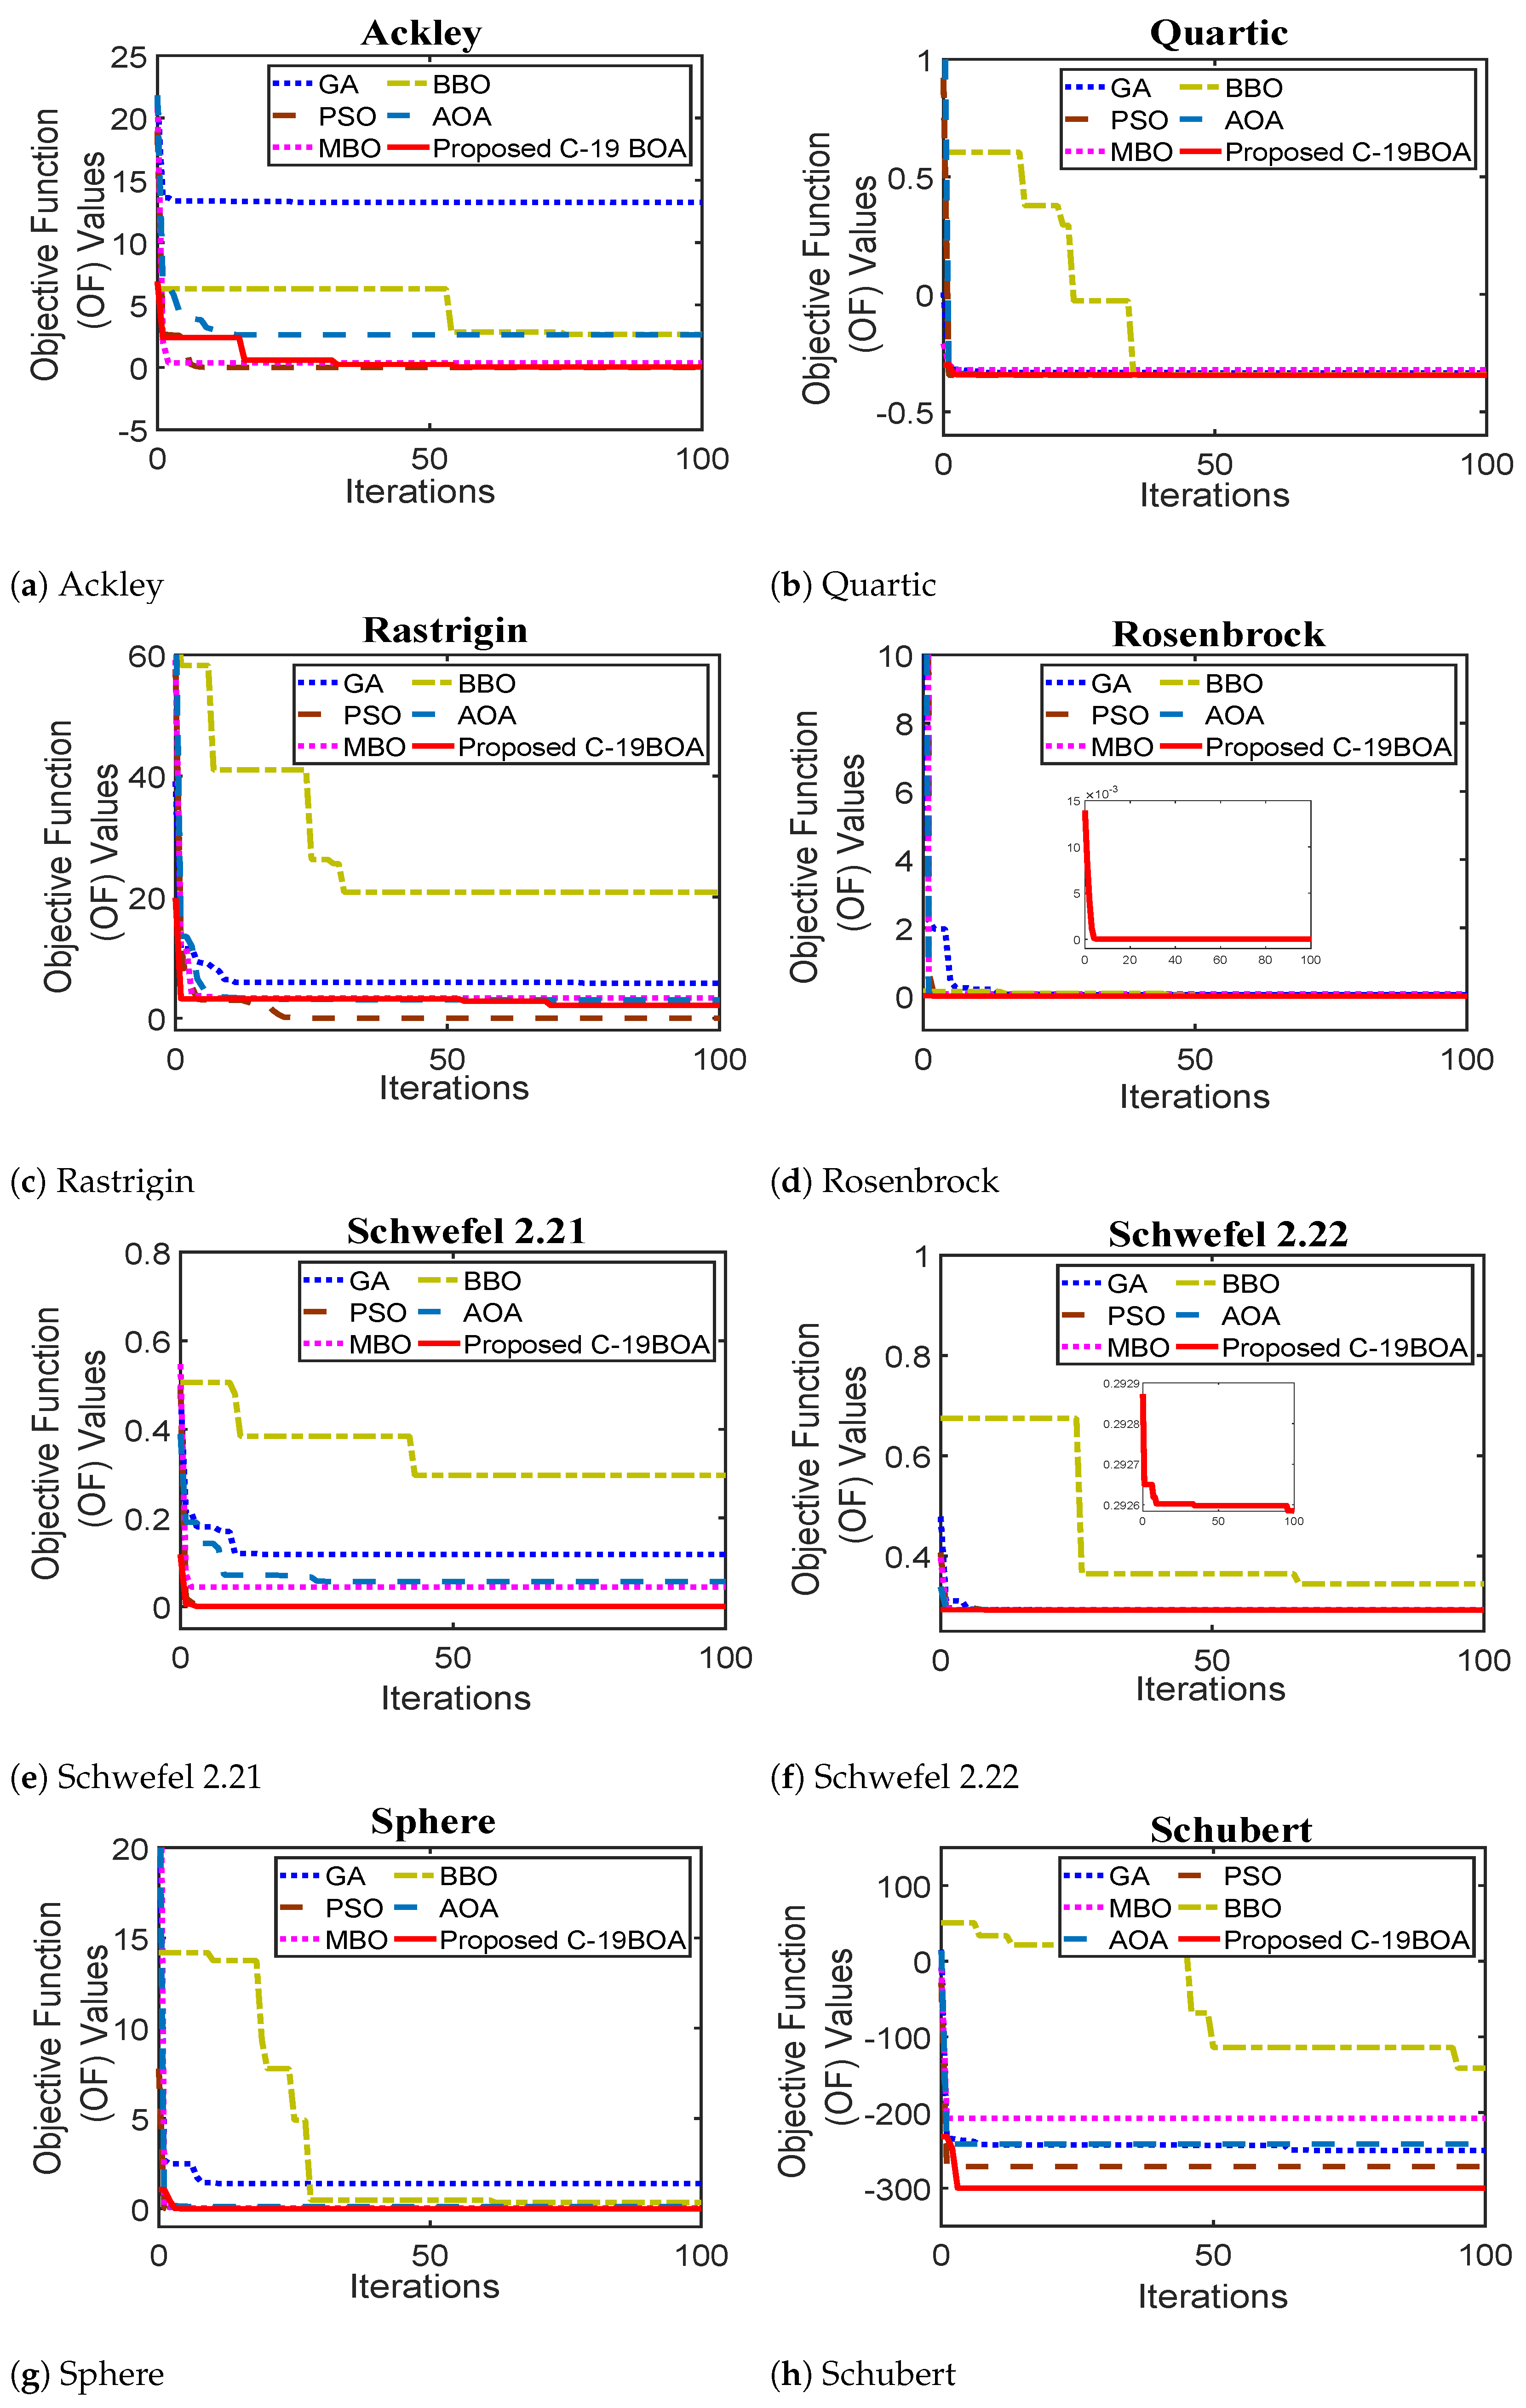
6. Performance Evaluation of Proposed C-19BOA on Standard Benchmark Functions

The performance of C-19BOA is evaluated on some of the standard mathematical benchmark functions based on the minimization and convergence characteristics. The performance of C-19BOA is compared with a few of the established population-based optimization algorithms viz. GA [3], BBO [4], PSO [5], MBO [8] and AOA [10].

6.1. Standard Mathematical Benchmark Functions

In order to discover the diverseness of C-19BOA and depict the nature of problems upon which the proposed algorithm meets the required characteristics, several standard mathematical benchmark functions are considered. To inspect the performance of C-19BOA in contrast to other optimization algorithms reported in [3,4,5,8,10], the performance comparison on these standard benchmark functions is completed. This set of benchmark functions used for comparison is sufficient enough to account for all kinds of problems. Some benchmark functions are unimodal and some are multimodal. Some of them are differentiable (regular), while some are irregular in their domains. Similarly, some functions are separable and some are non-separable. Table 2 shows the different benchmark functions used for comparison in the present work. Table 3 shows the different benchmark functions used for comparison in the present work.

6.2. Results Analysis of Benchmark Functions

The main goal of this analysis is to check how effectively an optimization algorithm minimizes the above defined functions to their minimum possible values between the defined dimension ranges. Thorough testing is carried out for various IEEE benchmark functions depending on their characteristics. The result comparisons of the proposed C-19BOA with GA, PSO, MBO, BBO and AOA on different benchmark functions are listed in Table 4. Each experiment is executed 50 times with diverse random seeds. The best mean and standard deviation (Std. Dev.) values are noted for comparison in Table 4.
It can be observed from Table 4 that both C-19BOA and PSO execute the average best on most of the benchmark functions. PSO is efficient enough in finding the minimum function value for the majority of the cases. However, C-19BOA is the next best, which is followed by MBO. For a more clear comparison, values less than 10 8 are set to 0. Critical observation of the results in Table 4 highlight that except for the Ackley and Rastrigin function, the proposed C-19BOA performs well ahead of all other optimization algorithms. C-19BOA is the most dominant for Schubert benchmark function.
It should be noted that no special effort was taken to adjust the algorithm. Some optimization algorithms may take certain significant alterations for their performance evaluation, which may affect the following. Firstly, the benchmark functions may or may not have any relationship with the real-world applications. Secondly, if any alteration is completed in tuning the algorithms, the benchmark functions can yield different results altogether. Hence, an effort was made to examine the best possible results by running the algorithms 50 times in order to reduce the possibility of any error on a certain population size with large iterations. This may yield the results as to how efficient a particular technique is by converging from a certain initial random value to optimal value.
Figure 5 depicts the convergence characteristics of the proposed C-19BOA versus GA, PSO, MBO, BBO and AOA on different benchmark functions. It is clearly seen in Figure 5 that the convergence characteristics of C-19BOA are on par with the other algorithms. C-19BOA is thus effective enough in converging the function to its optimal value. Figure 5 shows that the proposed C-19BOA has converged to a particular optimal value like most of the other established optimization algorithms. To conclude this section, the benchmark function results indicate that the proposed C-19BOA has promising outcomes, and in the plethora of population-based optimization algorithms, this new approach might be able to find a niche.

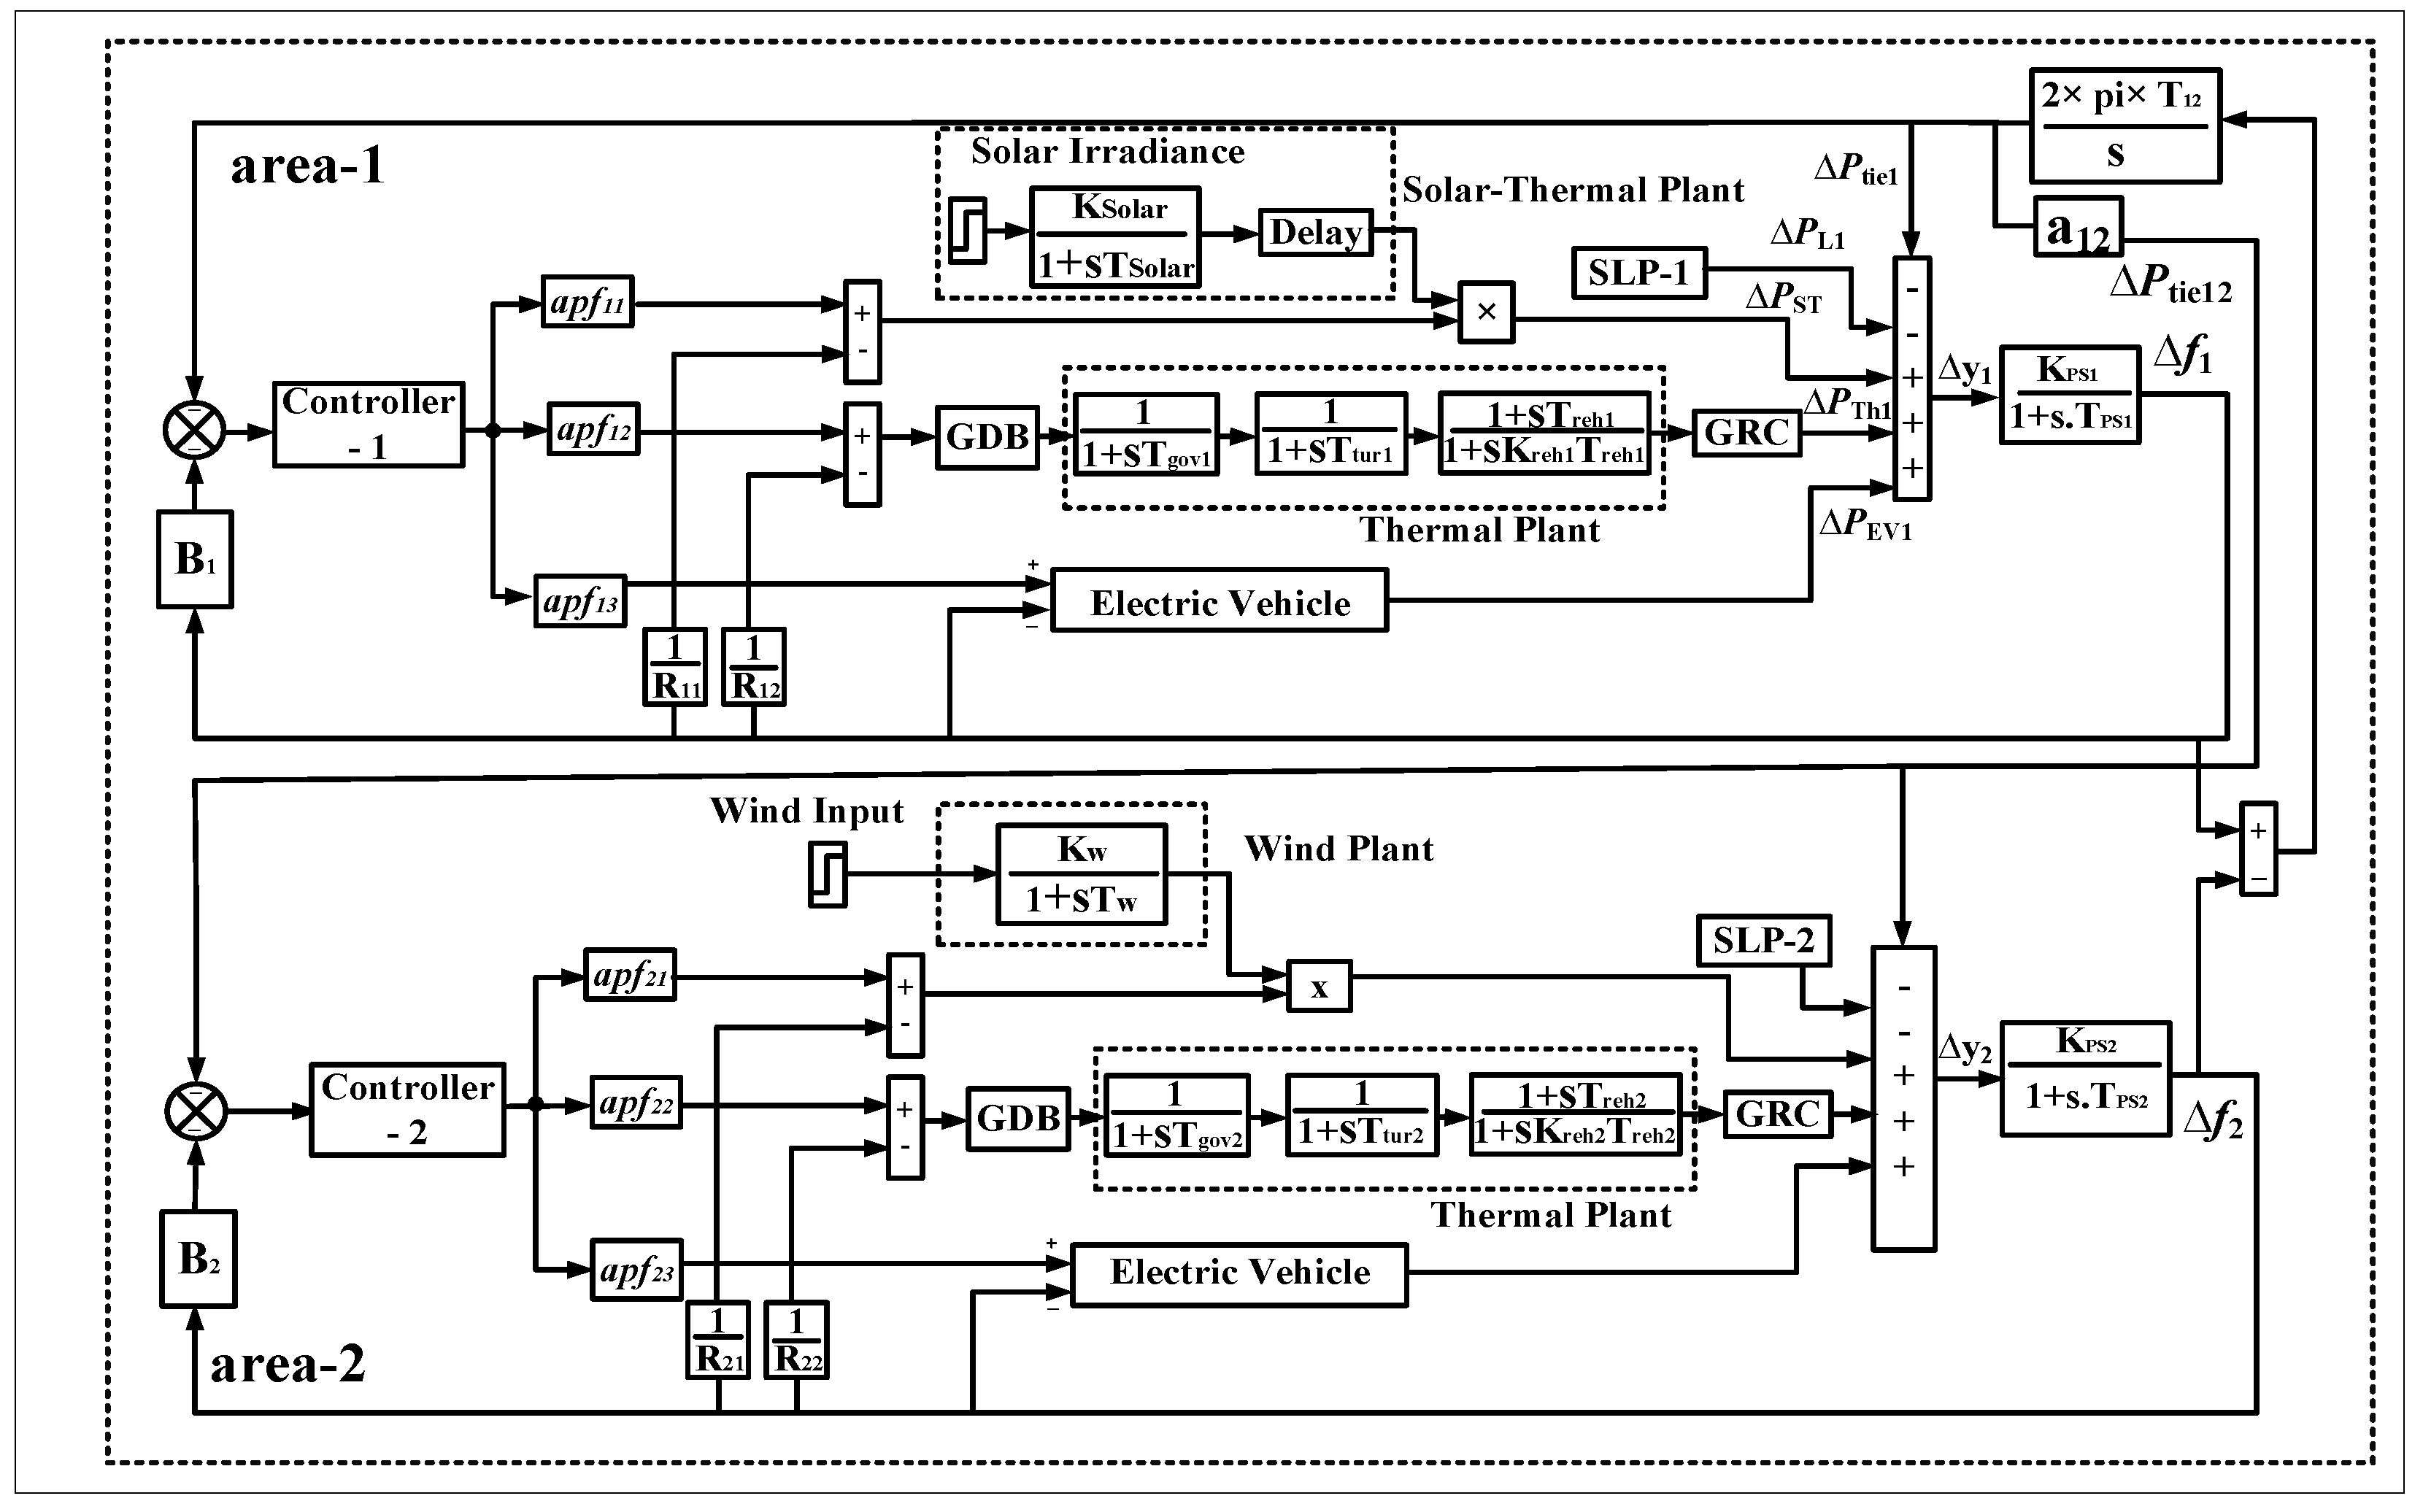
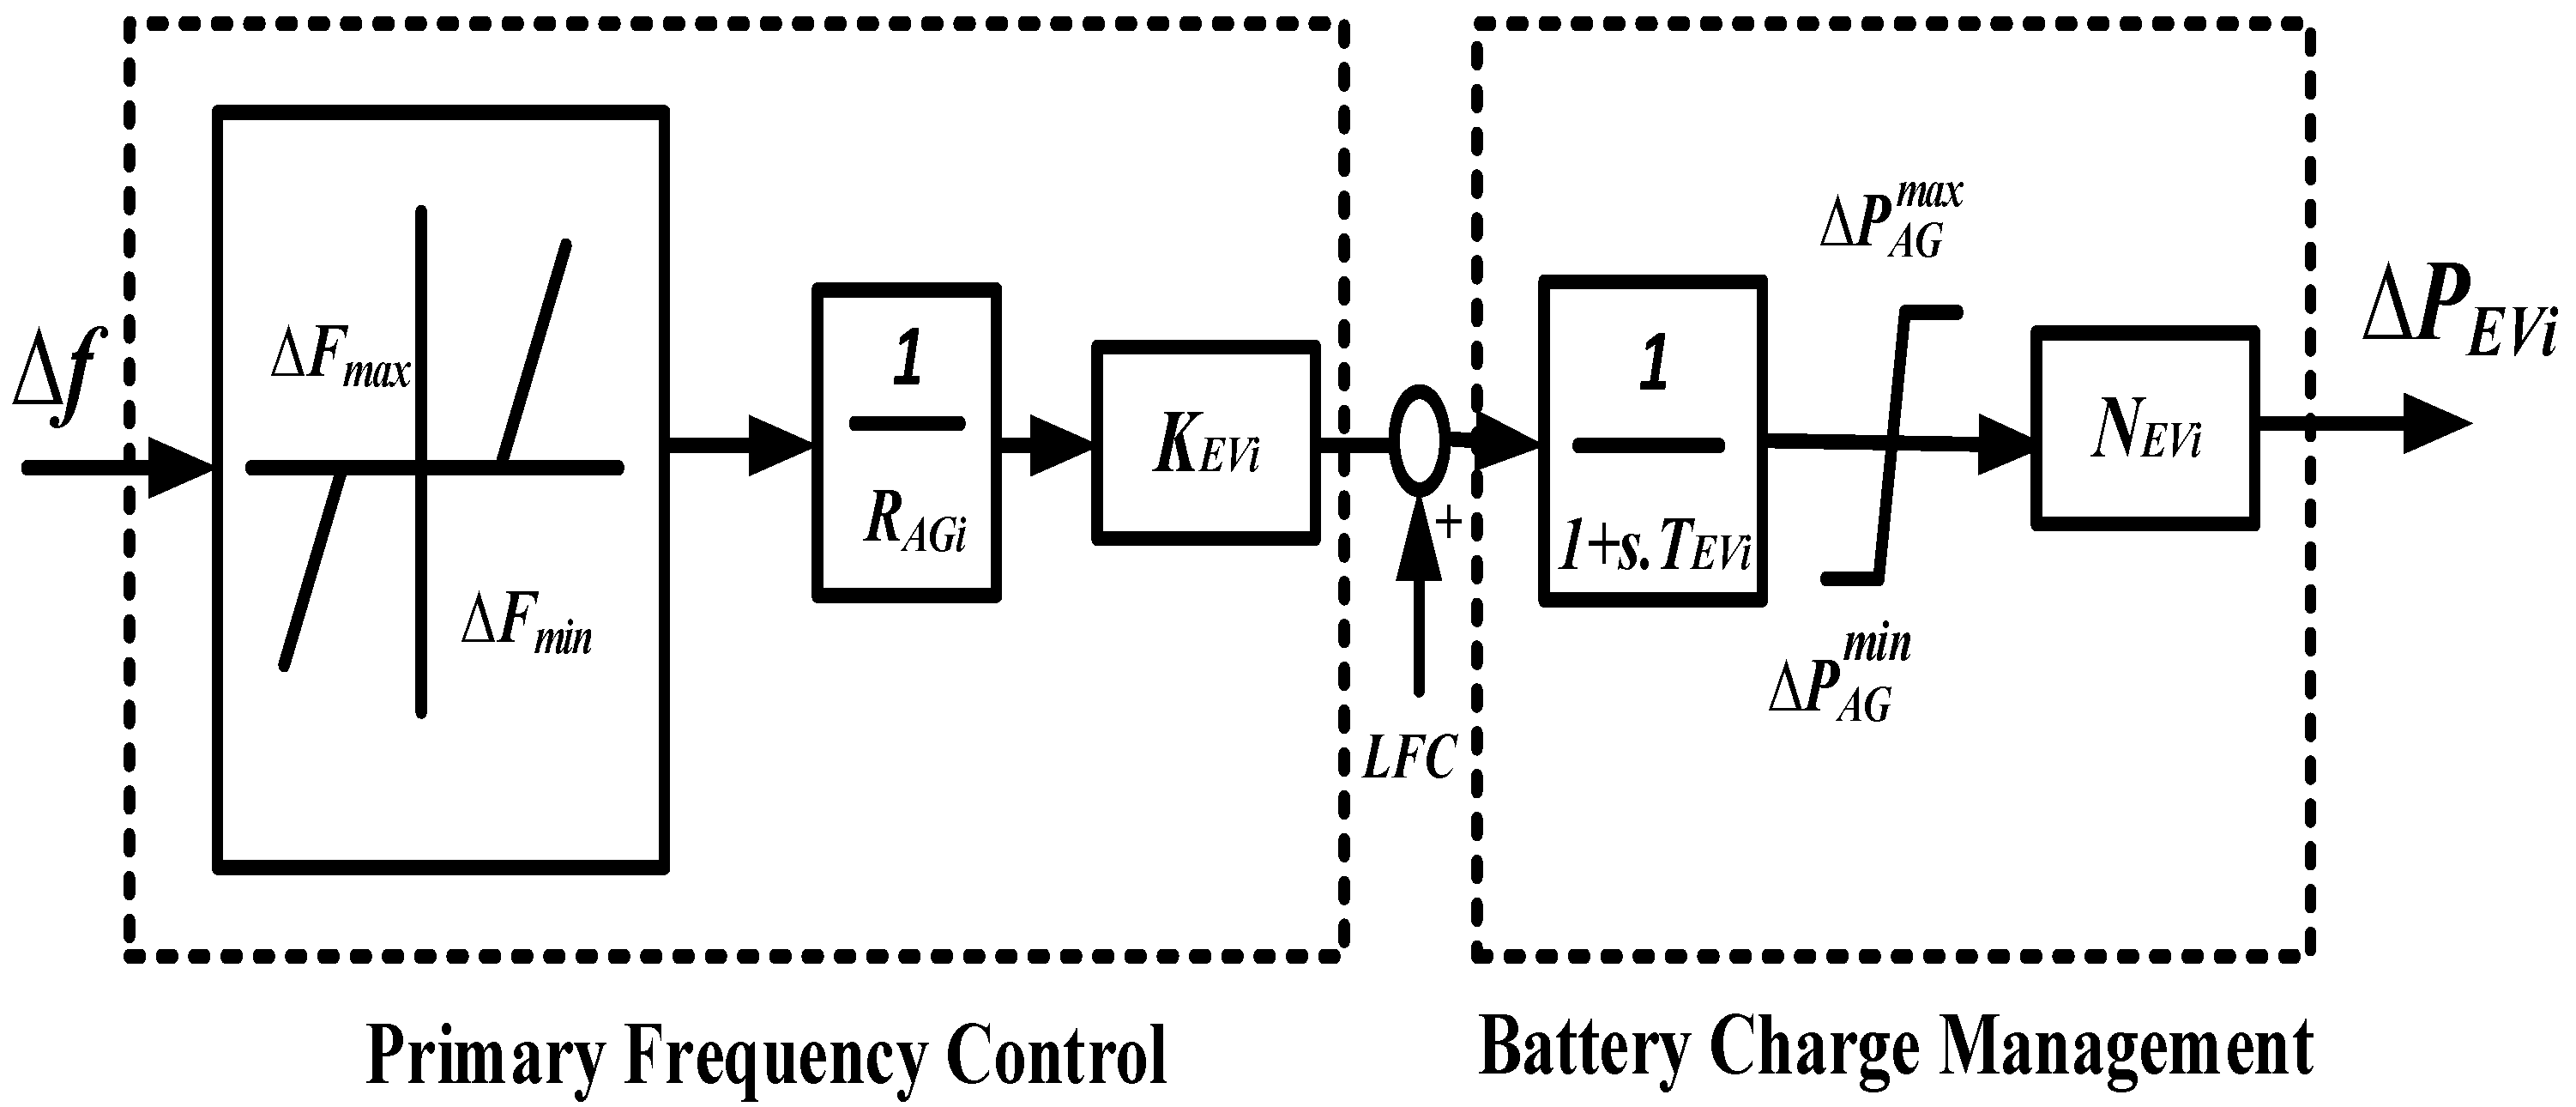
7. Performance Evaluation of Proposed C-19BOA on Modern Power System Control Operation

For any optimization algorithm, a desired characteristic is to apply the optimization algorithm for real-world problems. The optimization algorithm should be effective enough to be applicable for such problems. In this section, the proposed optimization algorithm is tested for a practical electrical power system network. The power system is designed such that it carries a real-time tracking of frequency limits when any load change or other disturbance occurs. In order to check the applicability of the proposed C-19BOA on practical systems, a modern-day power system consisting of two areas for a load frequency control (LFC) model is considered. Due to the ongoing trend of integrating EVs with the power systems, the present power system under consideration is equipped with EVs in both areas as well. For an LFC problem of a power system, controllers are installed in each area in order to maintain the balance between load demand and generations. More information regrading the modeling is discussed in Section 7.1, which is the next section. Initially, the performance of C-19BOA is tested on the PID controller, and the results are compared with other optimization techniques for effective frequency and tie-line power control. Then, an advanced 2nd order Active Disturbance Rejection controller (ADRC) with a state estimation-based observer is developed, and the performance of C-19BOA is tested in optimizing the gains of developed ADRC and PID controlled hybrid power systems. Finally, the robustness of C-19BOA-optimized ADRC and PID controller gains is analyzed for alterations in system parameters with respect to nominal conditions.

7.1. State of the Art: Power System Modeling

Figure 6 depicts the LFC configuration in a power system for any area ‘i’. The LFC system comprises a thermal plant having a governor, turbine and re-heater. In addition to the thermal plant, the LFC system is incorporated with a solar–thermal plant and electric vehicles. The controller in the LFC system keeps the frequency within desired limits. The location of controllers is as shown in Figure 6. The main aim of the present work is to optimize the gains of these controllers using different optimization algorithms available in the literature as well as the proposed C-19BOA. Load variation Δ P L ( i ) (p.u. MW) is given to LFC system resulting in a variation in frequency Δ f ( i ) . Δ P T h ( i ) represents thermal unit output (p.u. MW). The power system is equipped with system non-linearities such as dead-band of governor (GDB) and rate constraint of governor (GRC). R ( i ) denotes the regulation value for governor operation (Hz p.u. MW). Note that this model has been extensively used in the literature [53,54,55,56,57]. To regulate the frequency and tie-line power, two separate controllers are chosen for LFC loops in both areas. The capacity ratio for area-1 vs. area-2 ( a 12 ) is considered as 2:3. The rate constraint for the thermal plant is considered as 3% per minute, and the dead band reported is 0.06% (0.036 Hz). In order to implement practicality, the solar–thermal plant is provided with a variation of solar irradiance of 600 to 800 W/m2 at a time step of 30 s. The participation factor (pf) of each unit for both the areas is considered as mentioned, p f 11 = 0.3; p f 12 = 0.6; p f 13 = 0.1; p f 21 = 0.1; p f 22 = 0.8; p f 23 = 0.1. Area-1 is altered with an upsurge of Δ P L ( i ) = 0.01 p.u. MW load perturbation. System nominal values are considered from [42]. The simulation of the power system is performed in the MATLAB® Simulink platform.
Figure 7 shows the EV model integrated with the power system [67]. Sometimes, EVs are suddenly unplugged from the network, leading to an inadequate system operation. To address this problem, frequency is restricted to a range of ±10 mHz. The EV gain is denoted by K E V ( i ) , whereas the battery’s time constant is denoted by T E V ( i ) . EV charging and discharging capabilities are restricted to ±5 kW. R A G is the droop coefficient, Δ P E V ( i ) denotes the variation in EV regulation power. P A G m a x is the maximum power output of EV, whereas P A G m i n is the minimum power output of EV, as computed by Equation (10). The values of all the parameters are reported in Appendix A.
P A G m a x = + ( 1 N E V ) ( Δ P E V ( i ) ) , P A G m i n = ( 1 N E V ) ( Δ P E V ( i ) ) .
The simulation of a power system is completed in the MATLAB® Simulink platform. The Integral Squared Error (ISE), given by (11), is considered as the minimization objective function.
I S E = 0 T { Δ f i 2 + Δ P t i e 2 } d t .
For the developed power system, the dynamics for area-1 can be governed by Equations (12) and (13) in differential form as
Δ f ˙ 1 = K P 1 T P 1 ( Δ P S T + Δ P T h 1 + Δ P E V 1 Δ P tie Δ P L 1 ) Δ f 1 .
Δ f ˙ 1 = K P 1 T P 1 ( Δ P S T + Δ P T h 1 + Δ P E V 1 ) Δ f 1 K P 1 T P 1 ( Δ P tie + Δ P L 1 ) .
An LFC problem desires to maintain the frequency at its defined value. This means that the frequency deviation must be forced to its zero value. For Equations (12) and (13), in order to force Δ f 1 to zero when there is a change in system load or when the scheduled tie-line power exchange varies, this requires the output of generators to be regulated for tracking the variations in load ( Δ P L 1 ). Hence, the tie-line power deviation and variations in load of the system are considered as extended disturbance to the system.
Focusing on the LFC model presented in Equations (12) and (13), this study proposes a novel 2nd order Active Disturbance Rejection controller (ADRC) method that employs an extended state observer (ESO) and is based on the estimated extended disturbance acquired from ESO, which is discussed in next section.

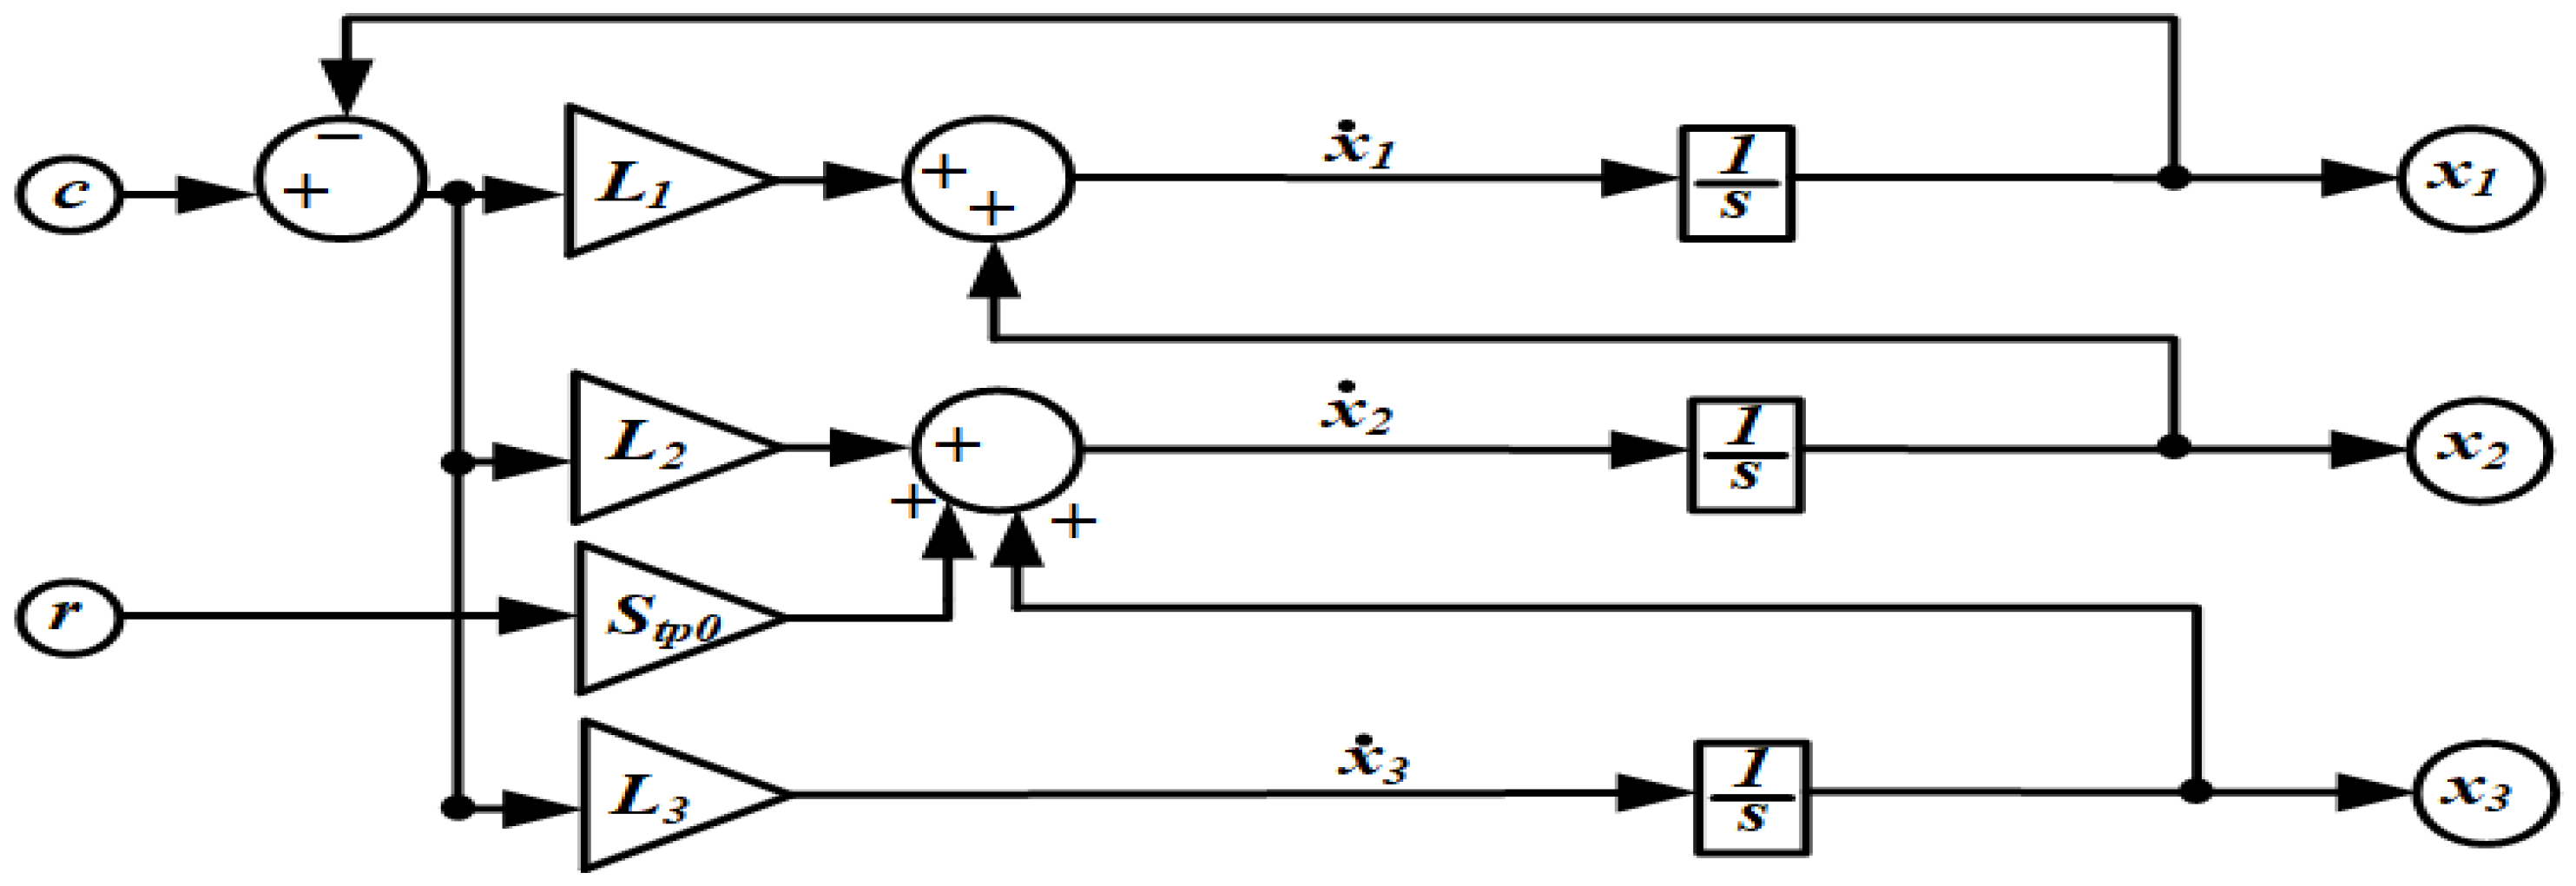
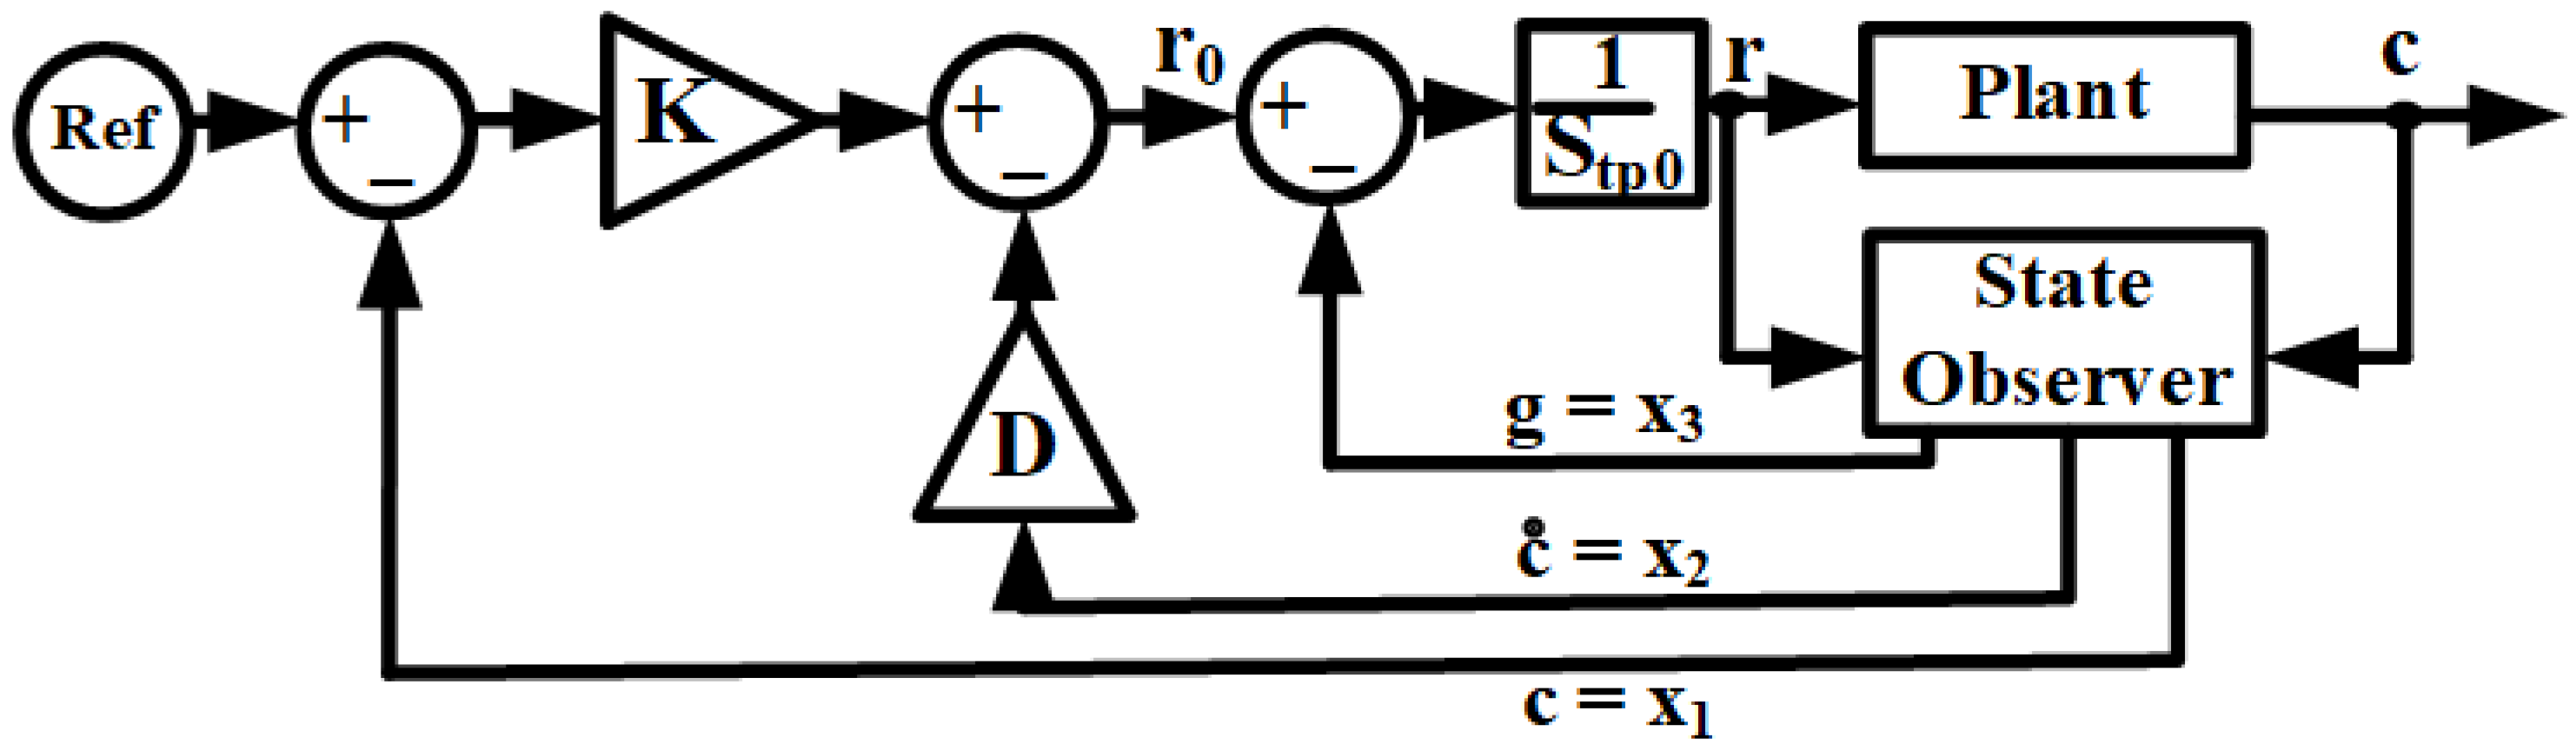
7.2. Design and Modeling of 2nd Order Active Disturbance Rejection Controller (ADRC)

Consider a system, P(s), as
P ( s ) = c ( s ) r ( s ) = K T p 2 S 2 + 2 D T p S + 1 .
T p being a time constant, and other factors denote the usual notations.
T p 2 c ¨ ( t ) + 2 D T p c ˙ ( t ) + c ( t ) = K r ( t ) .
Consider a load disturbance (SLP) as input disturbance S t p subjected to the system so that
S t p = K T p 2 .
Consider S t p = S t p 0 + Δ S t p , where S t p 0 represents the measurable disturbance, and Δ S t p represents the immeasurable error given by Equation (17)
c ¨ ( t ) = 2 D T p c ˙ ( t ) 1 T p 2 c ( t ) + 1 T p 2 S t p ( t ) + Δ S t p r ( t ) + S t p 0 r ( t ) = g ( t ) + S t p 0 r ( t ) .
where g ( t ) = 2 D T p c ˙ ( t ) 1 T p 2 c ( t ) + 1 T p 2 S t p ( t ) + Δ S t p r ( t ) represents general disturbance. The residual portion of the modeling procedure encompasses a double integrator. The disturbed double-integrator is symbolized by state-space depiction as:
x ˙ ( t ) = A x ( t ) + B r ( t ) + G g ˙ ( t ) c ( t ) = C x ( t ) .
where
A = 0 1 0 0 0 1 0 0 0 , B = 0 S t p 0 0 , G = 0 0 1 , C = 1 0 0 .
Primarily, ADRC comprises an extended-state observer (ESO) providing an approximation of g ˙ ( t ) so as to account for the consequence of g ˙ ( t ) on the system using a disturbance elimination property [60]. The ESO provides estimation for ADRC such that
x 1 ( t ) = c ( t ) , x 2 ( t ) = c ˙ ( t ) , x 3 ( t ) = g ( t ) .
The “virtual” input, g ˙ ( t ) , is immeasurable, henceforth, the construction of ESO is accomplished using r ( t ) input and c ( t ) output. To model the ESO of ADRC, a new and effective effective Luenberger observer is engaged given by Equation (21).
x ˙ ( t ) = A x ( t ) + B r ( t ) + L ( c ( t ) x 1 ( t ) ) = ( A L ) x ( t ) + B r ( t ) + L c ( t ) , L = L 1 L 2 L 3 .
Equation (21) can be simplified as:
x 1 ˙ ( t ) = L 1 [ ( c ( t ) x 1 ( t ) ] + x 2 .
x 2 ˙ ( t ) = L 2 [ ( c ( t ) x 1 ( t ) ] + S t p 0 r ( t ) + x 3 .
x 3 ˙ ( t ) = L 3 [ ( c ( t ) x 1 ( t ) ] .
The control law for the estimation-based feedback-controller is given as;
r ( t ) = r 0 g ( t ) S t p 0 .
with
r 0 = K ( R e f c ( t ) ) D ( c ˙ ( t ) ) .
Equations (22)–(24) form the basis for the modeling of ESO in MATLAB/Simulink®. The block diagram of ESO modeled in the present work is shown in Figure 8. After designing the ESO, the execution of disturbance rejection with the above-defined control law is completed with the help of estimated variables. Figure 9 shows the block diagram of 2nd order ADRC, which essentially constitutes a second-order-closed-loop ADRC controller and is equipped with adjustable dynamics.

7.3. Power System Dynamic Behaviour Using PID Controller

A PID controller is used for power system control processes in [68,69,70]. Likewise, the present work tests the application of the proposed algorithm in optimizing the gains of a PID controller. The simulated dynamic responses for frequency deviation and tie-line power deviation for both the areas in the form of Δ f 1 , Δ f 2 and Δ P t i e are shown for comparison in Figure 10a–c. A clear analysis of Figure 10a–c reveals that the proposed C-19BOA optimized PID controller depicts the optimal responses for frequency and tie-line power deviations. As shown in Figure 10a–c, the variation in frequency is inhibited significantly using a C-19BOA optimized PID controller. It is evident that Δ f 1 , Δ f 2 are restricted within −0.025 to +0.025 Hz using a C-19BOA optimized PID controller, making the smallest range among the comparison. All the above authorizes the decent performance of the proposed C-19BOA over other optimization algorithms applied in the power system.
One of the desired characteristics of a dynamic response is its minimum settling-time. The settling-time for the dynamic responses obtained in Figure 10a–c are reported in Table 5. The minimum settling-time as evident from Table 5 further validates the effective dynamic response regulation capability of the proposed algorithm C-19BOA.
Table 6 reports the objective function ISE (Equation (11)) values. The ISE values corresponding to a C-19BOA optimized PID controller are smaller compared to other optimization algorithms. This also reflects the dominance of C-19BOA over other algorithms applied to the hybrid power system. The convergence characteristics for minimization of the objective function ISE over the iterations, with respect to each optimization algorithm, is reported in Figure 10d. The minimum objective function (ISE) value corresponds to C-19BOA and converges considerably quicker than other algorithms.
Thus, the obtained dynamic responses in Figure 10a–c prove that the PID controller optimized with C-19BOA is effective enough in enhancing the system stability by improving the performance against disturbances. Moreover, the convergence curves in Figure 10d and values in Table 5 and Table 6 further reflect the better convergence properties of an objective function with C-19BOA as compared to other algorithms. So, further analyses shall be carried out with C-19BOA as the optimal optimization algorithm.

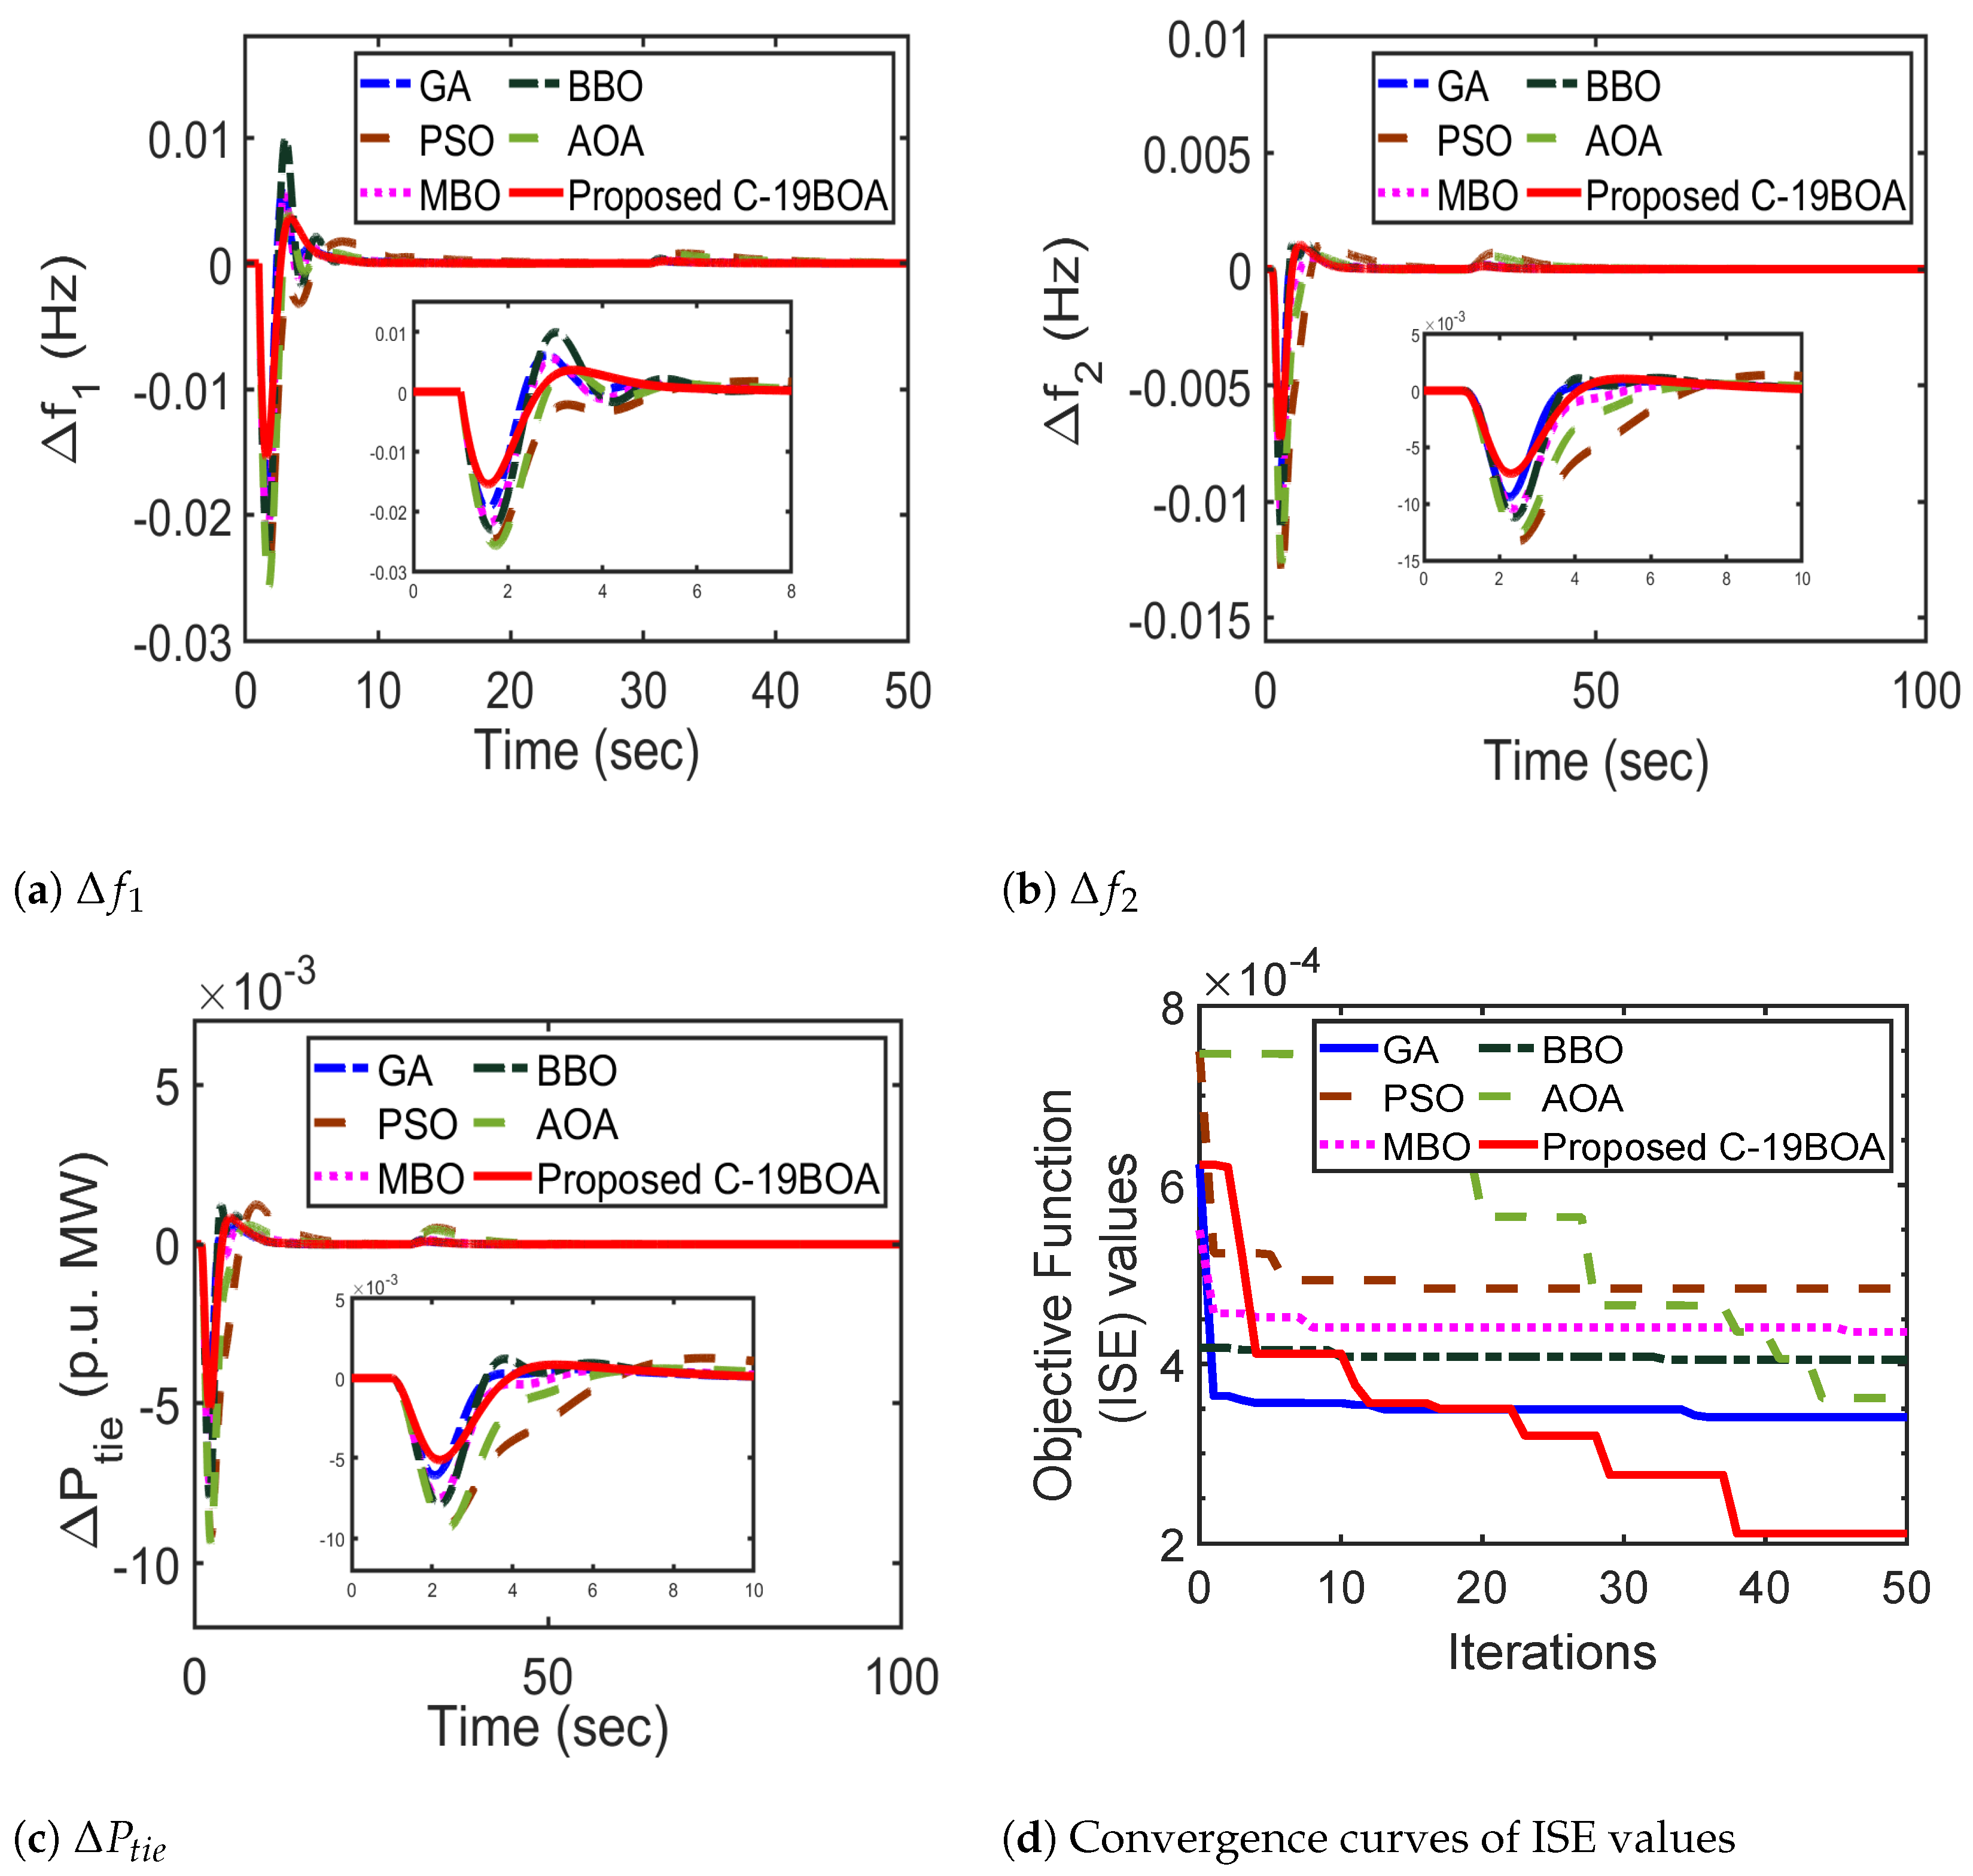
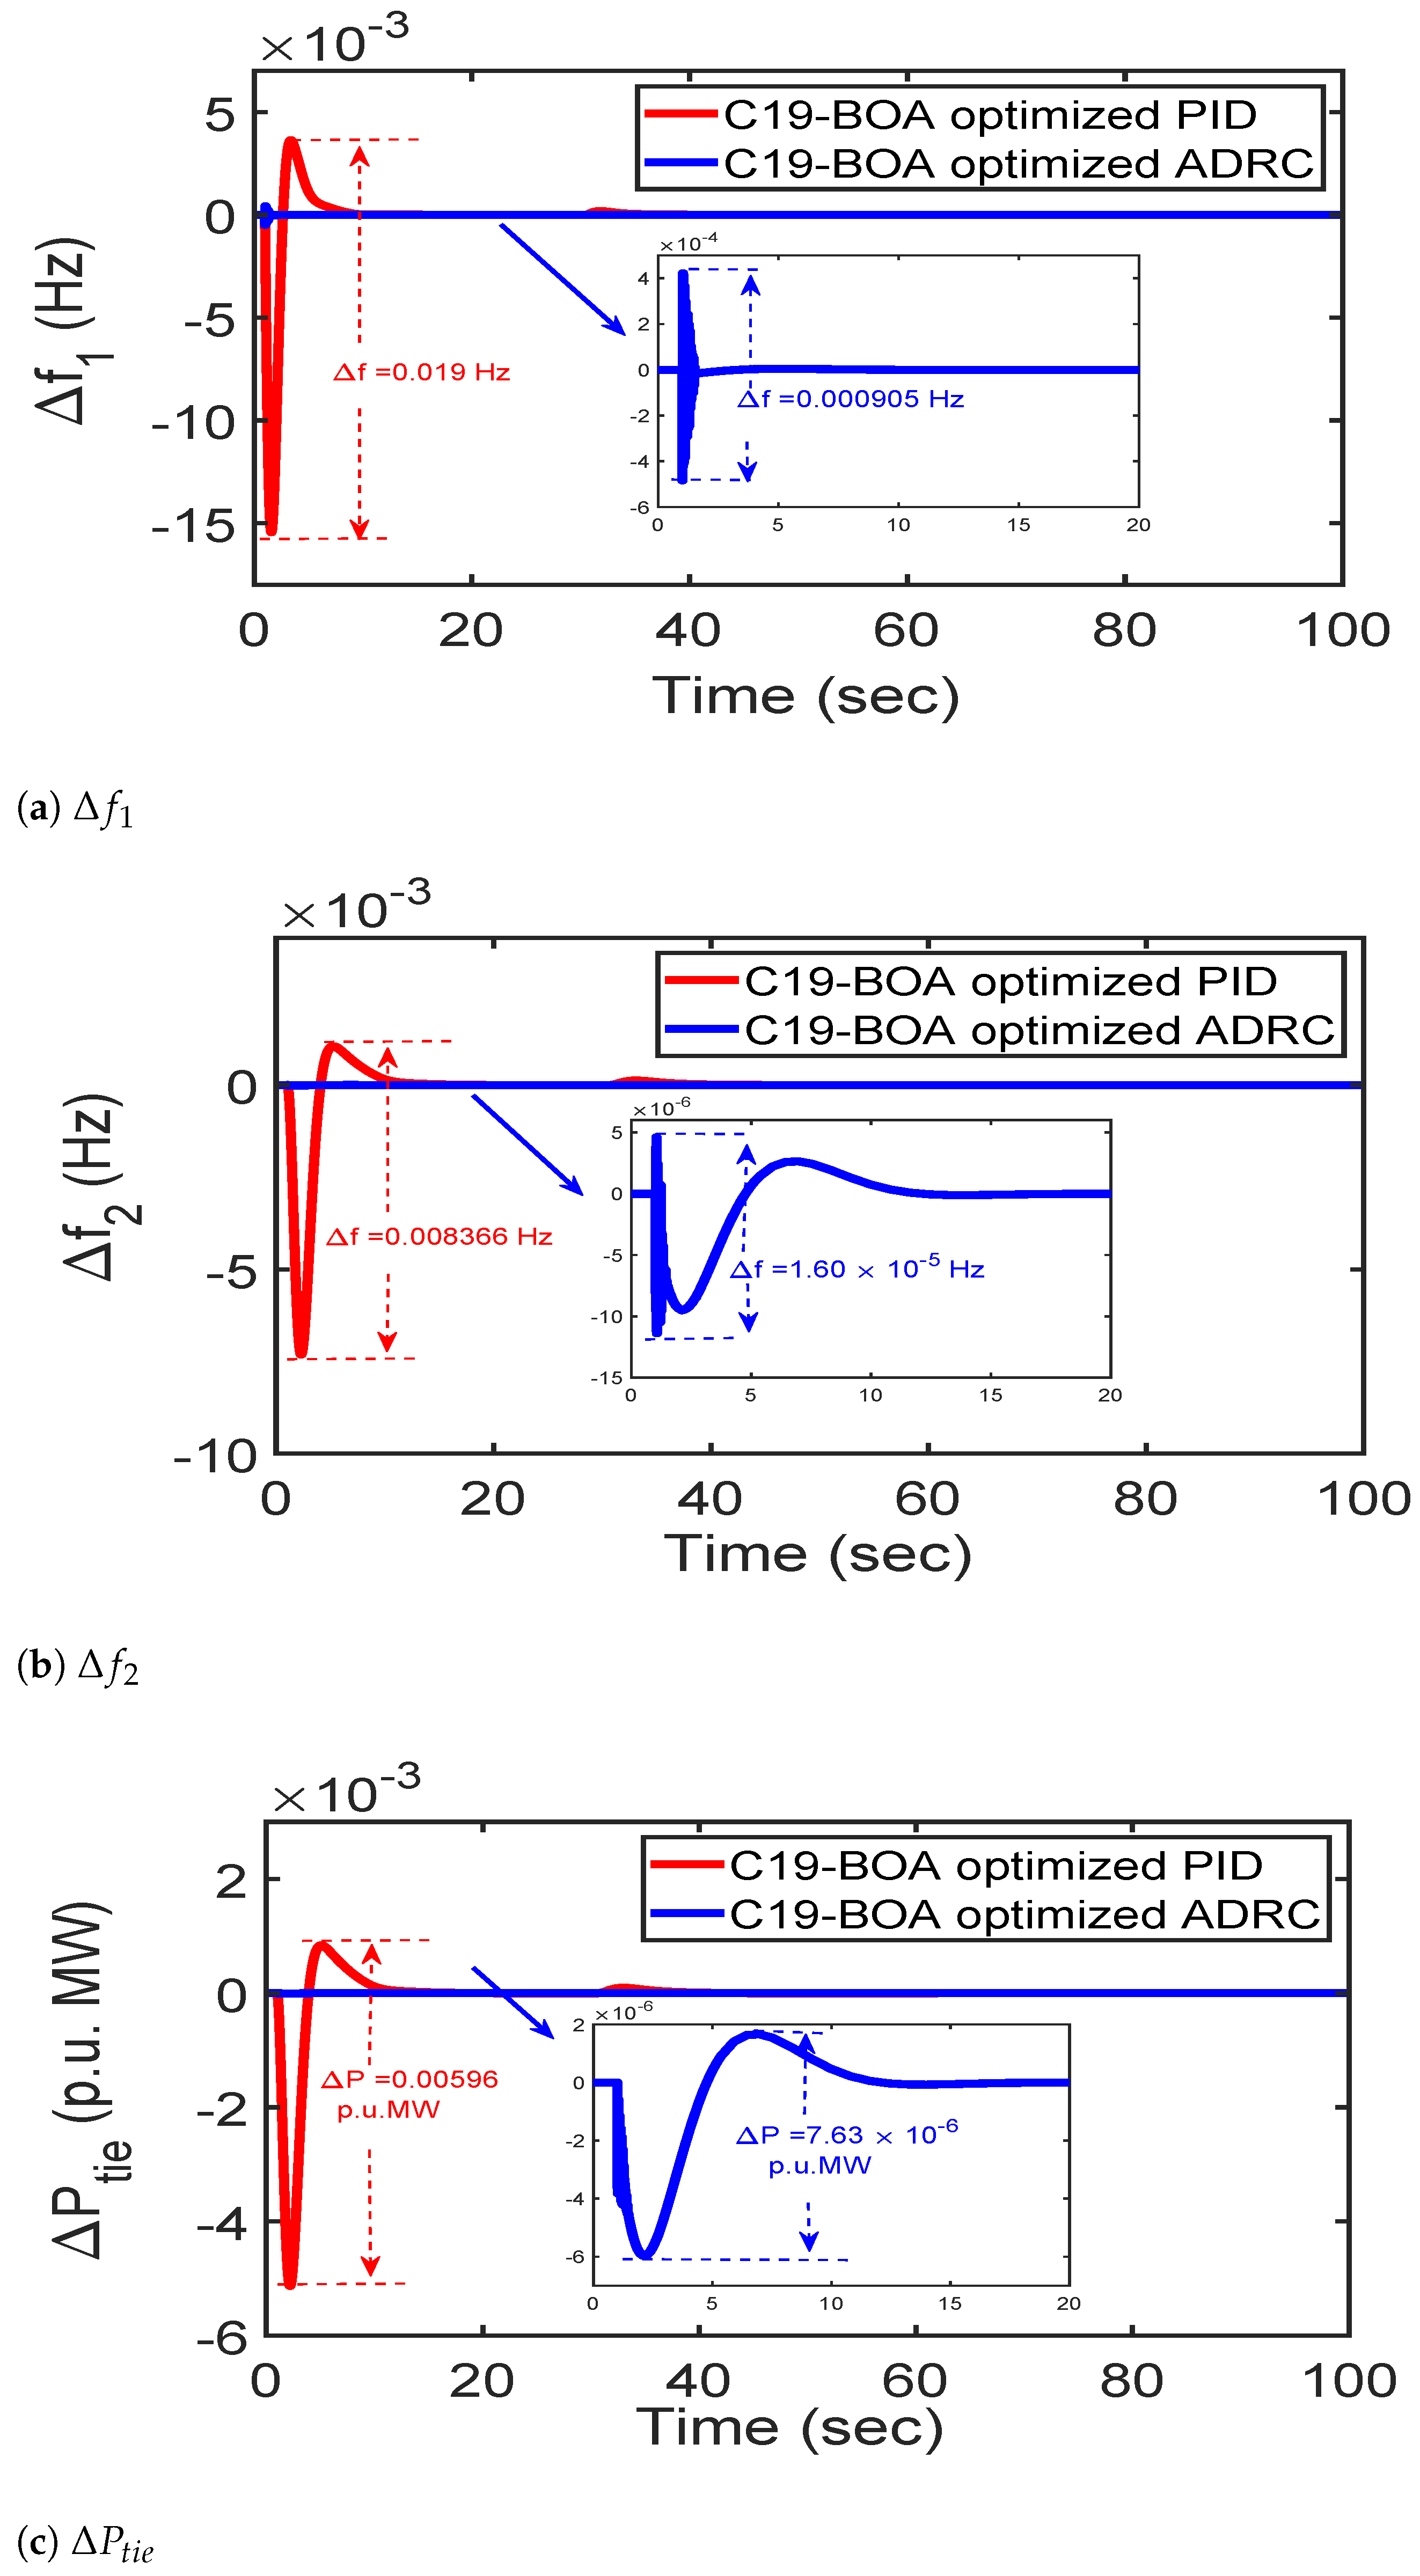
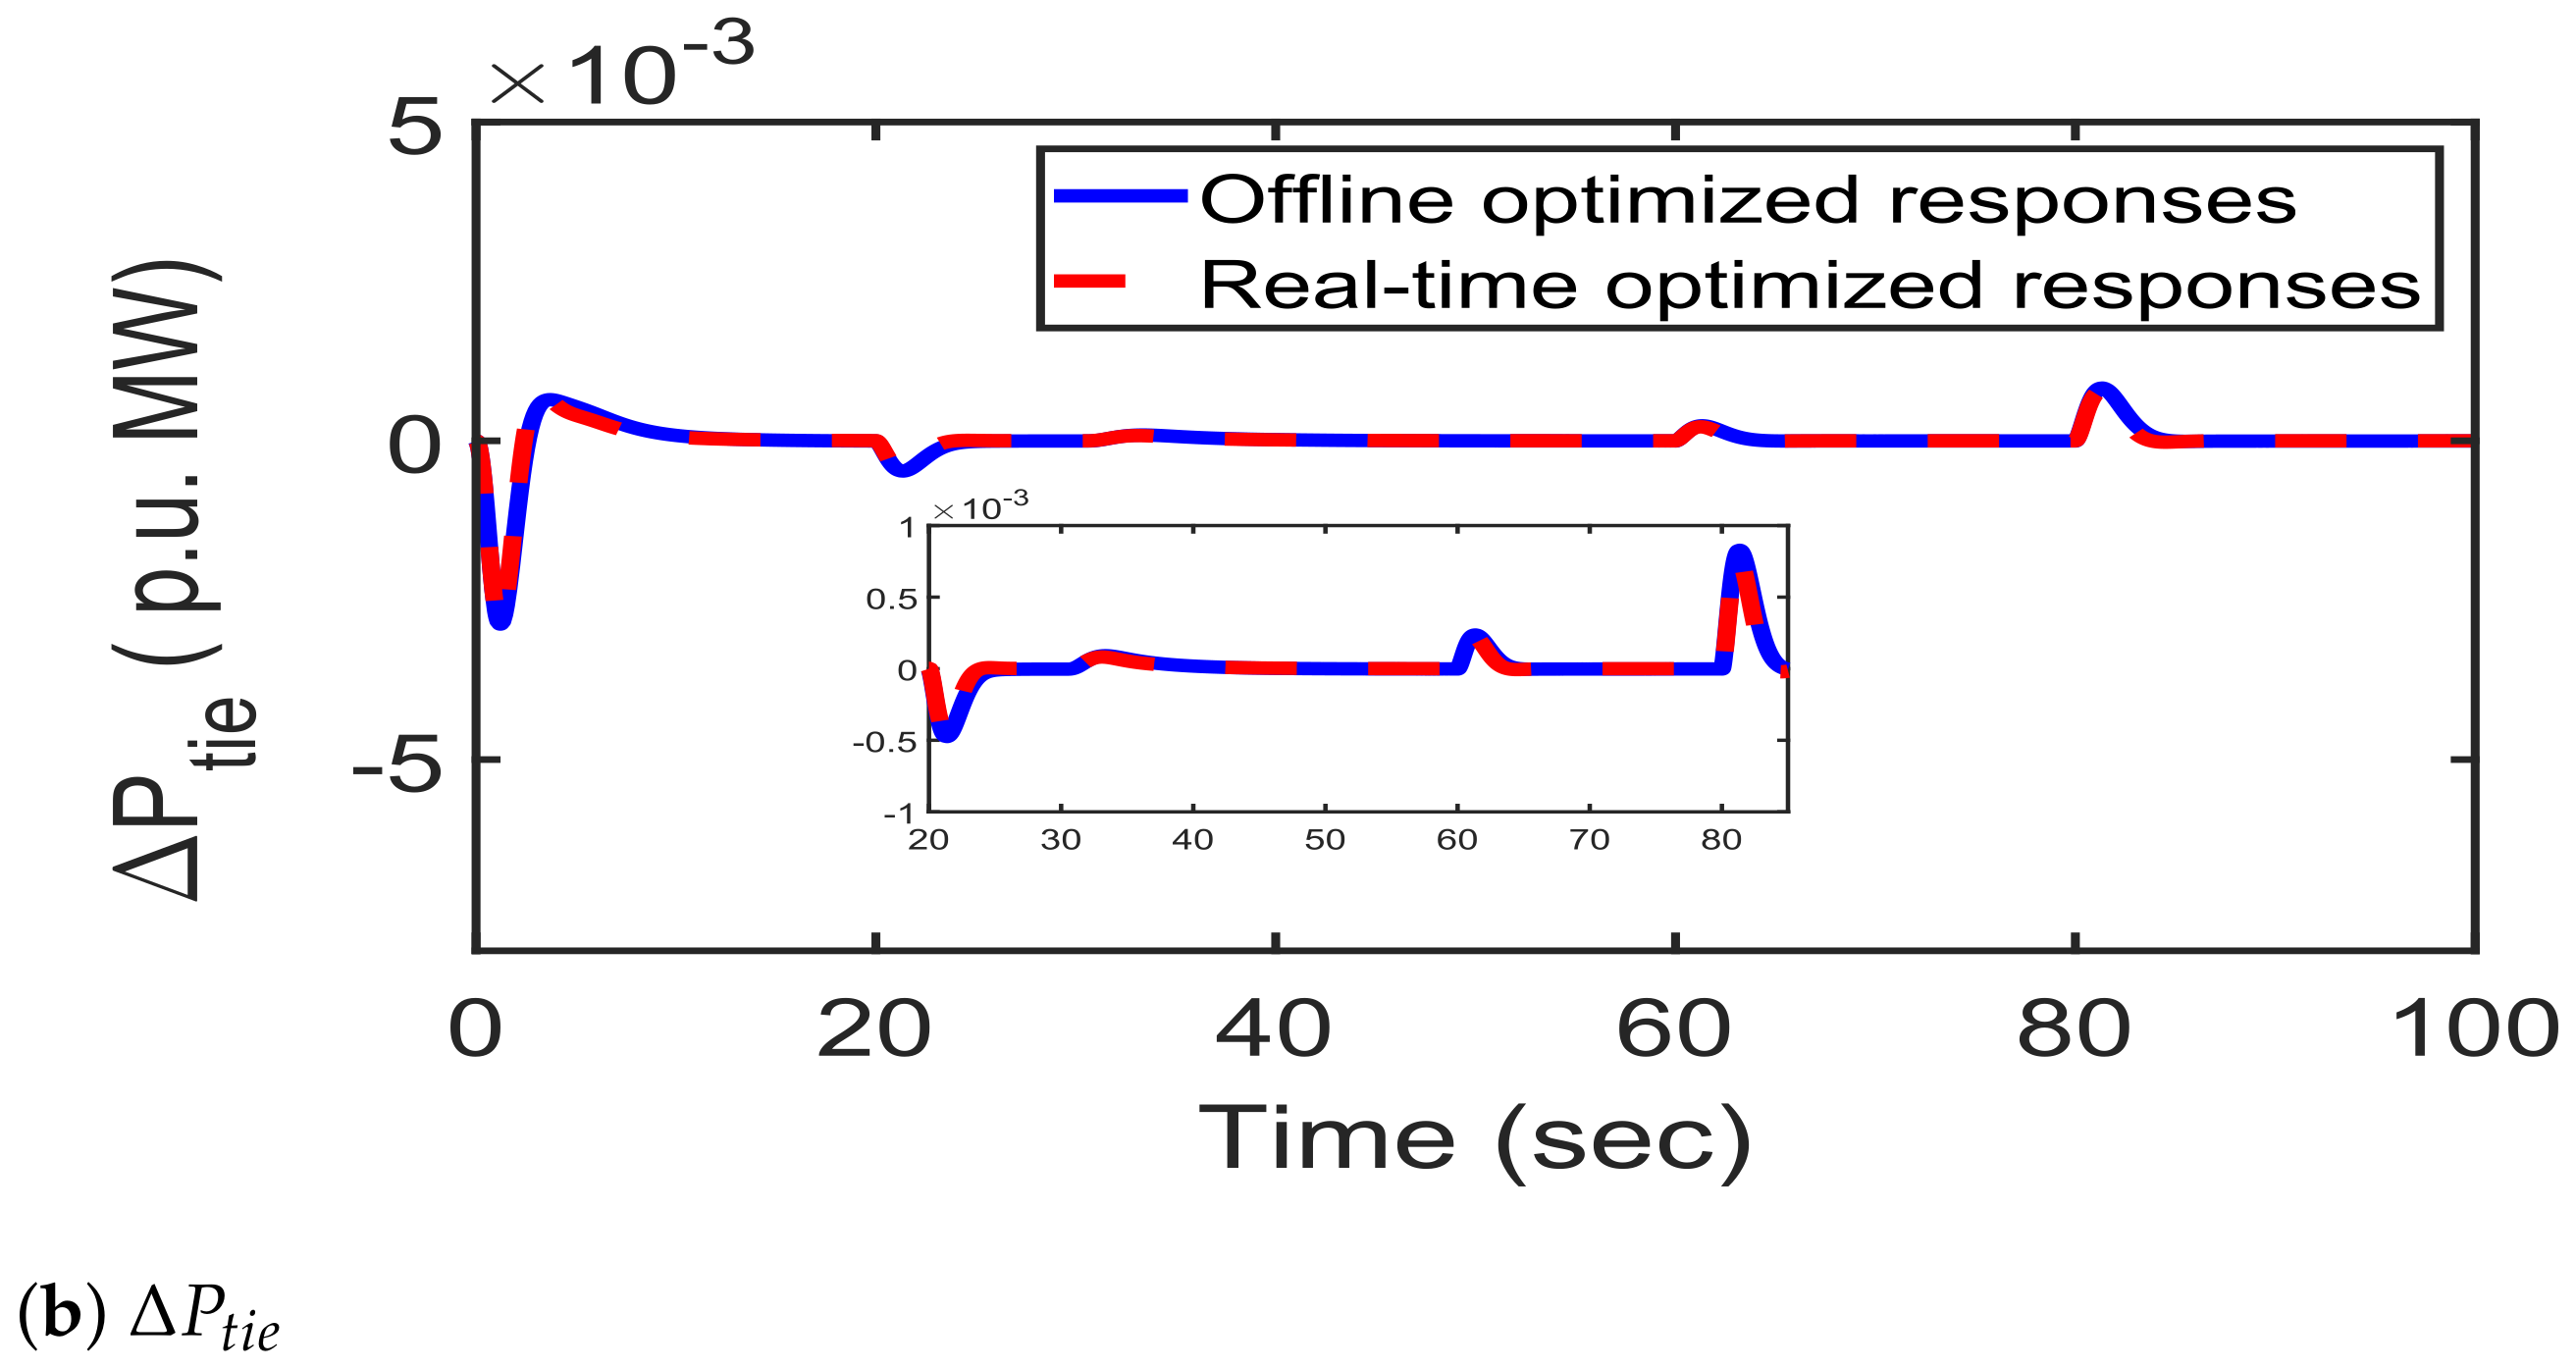
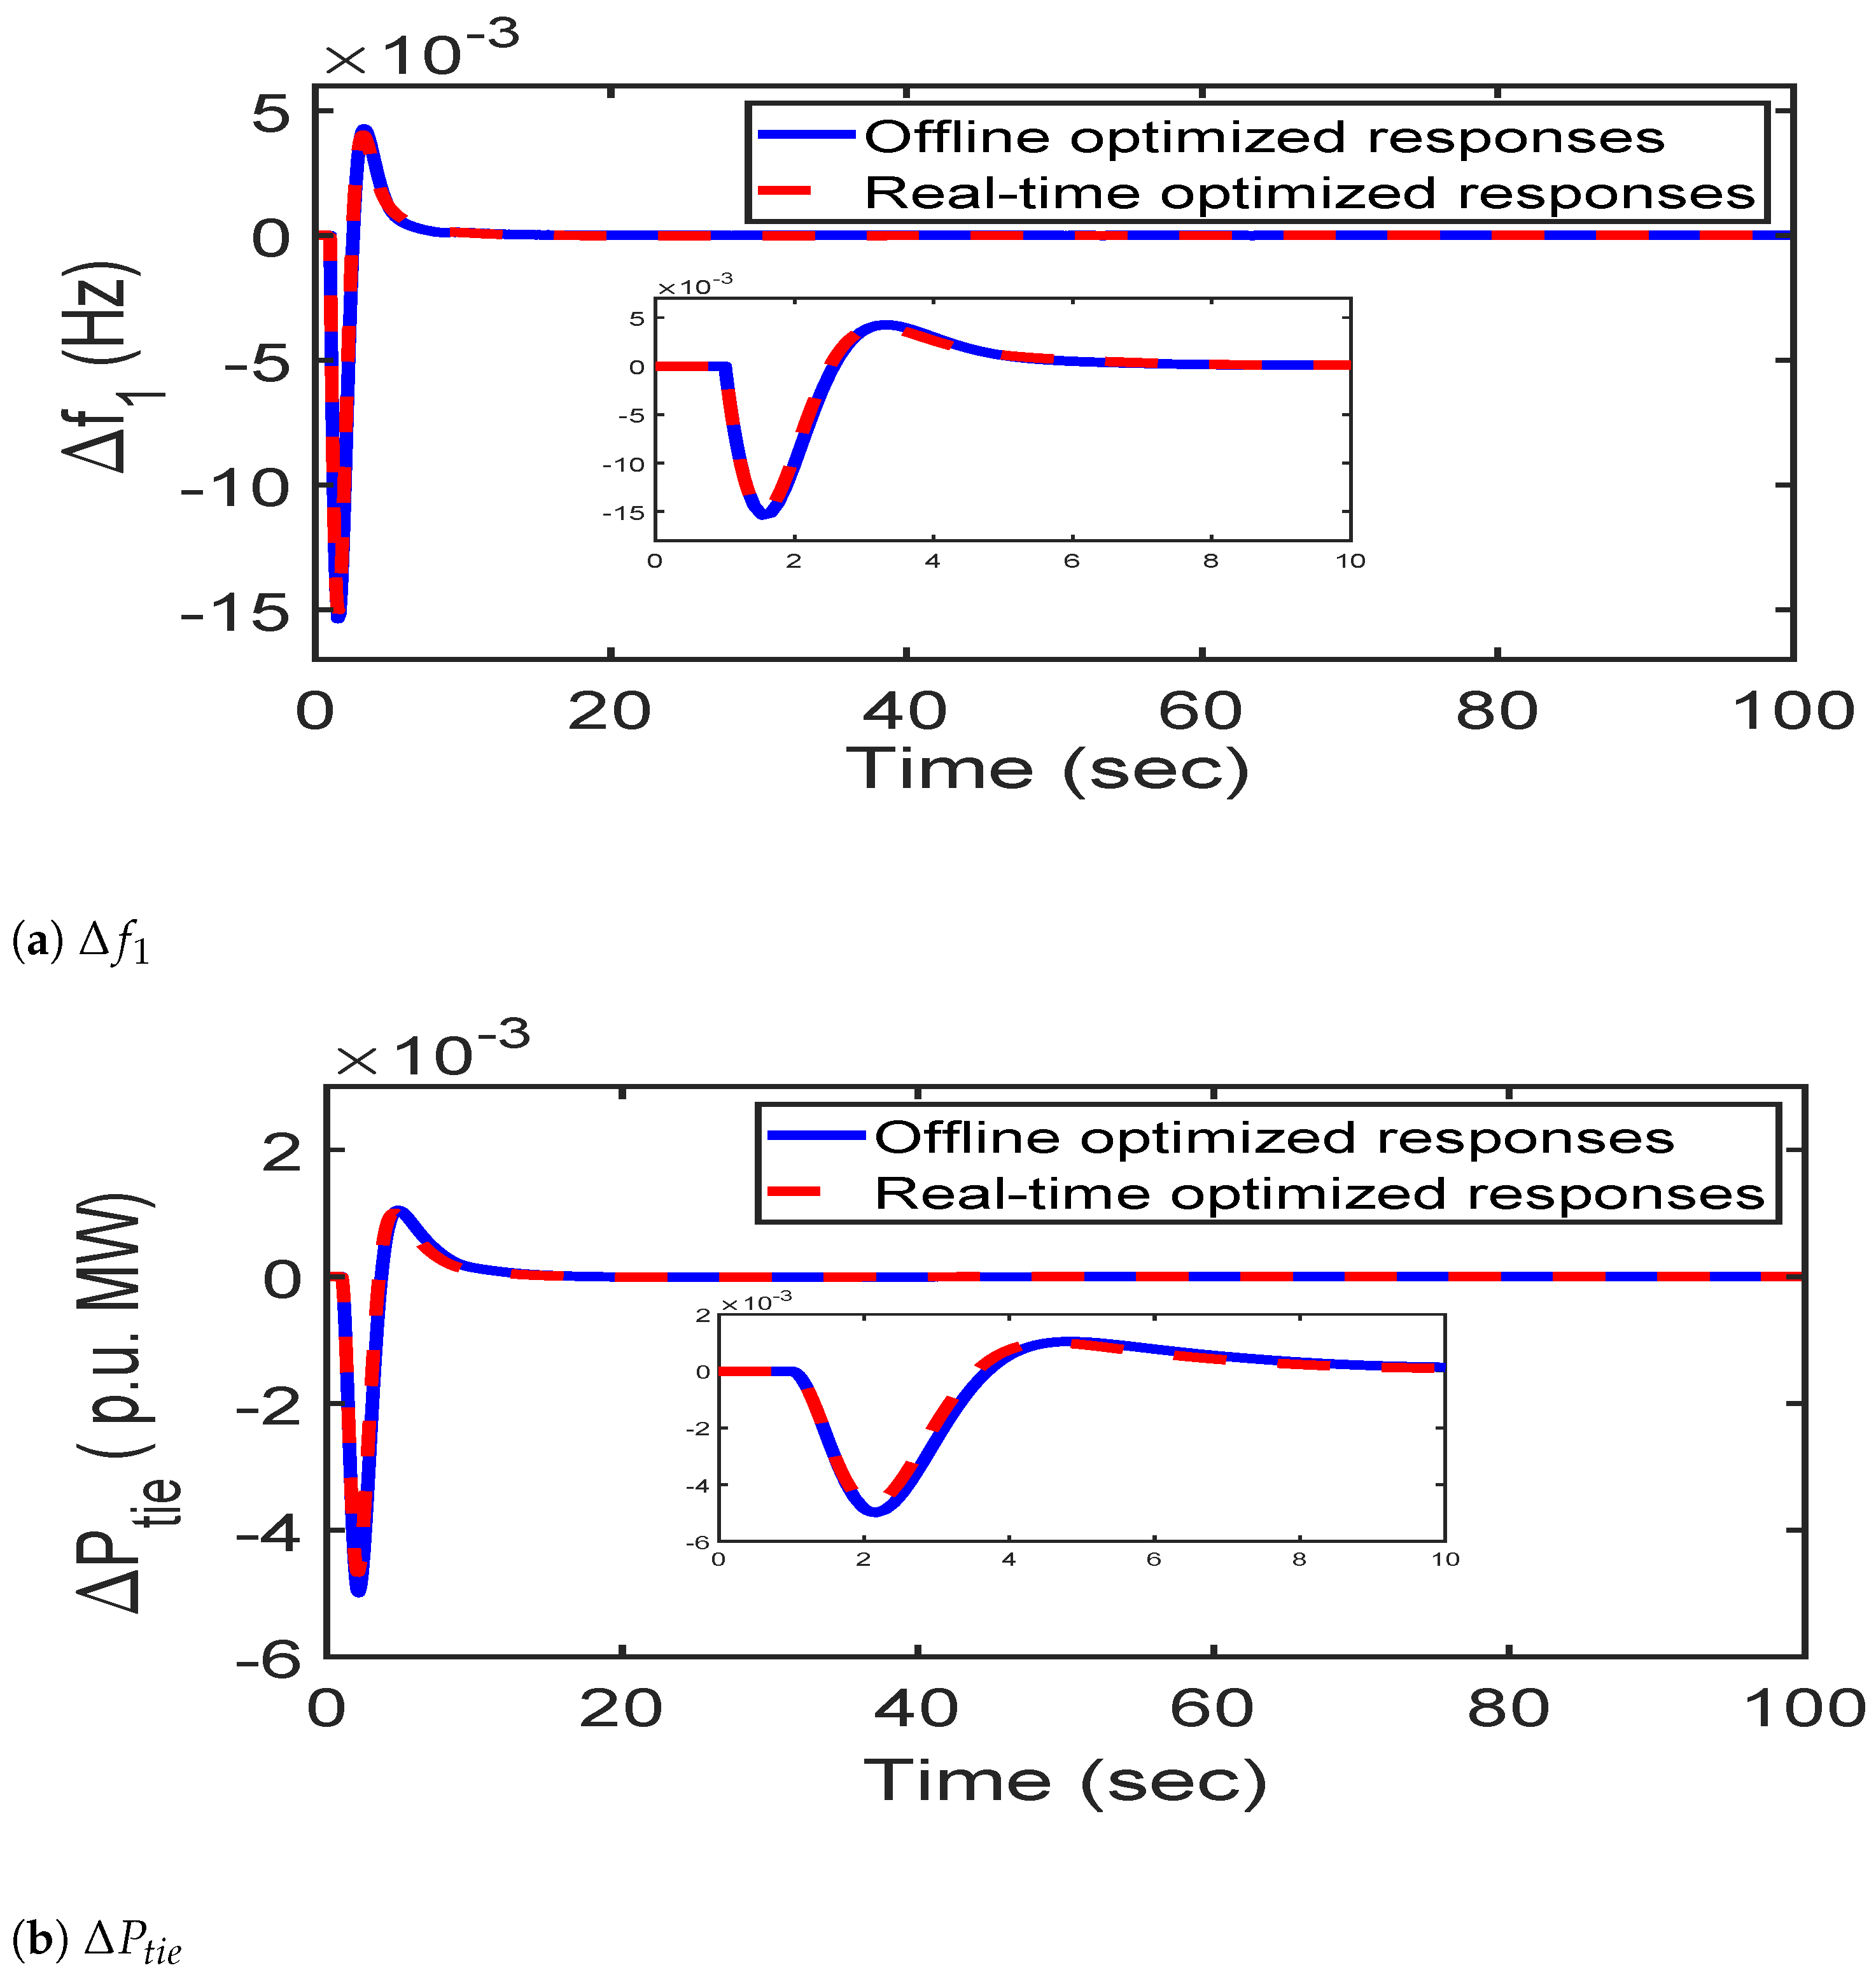
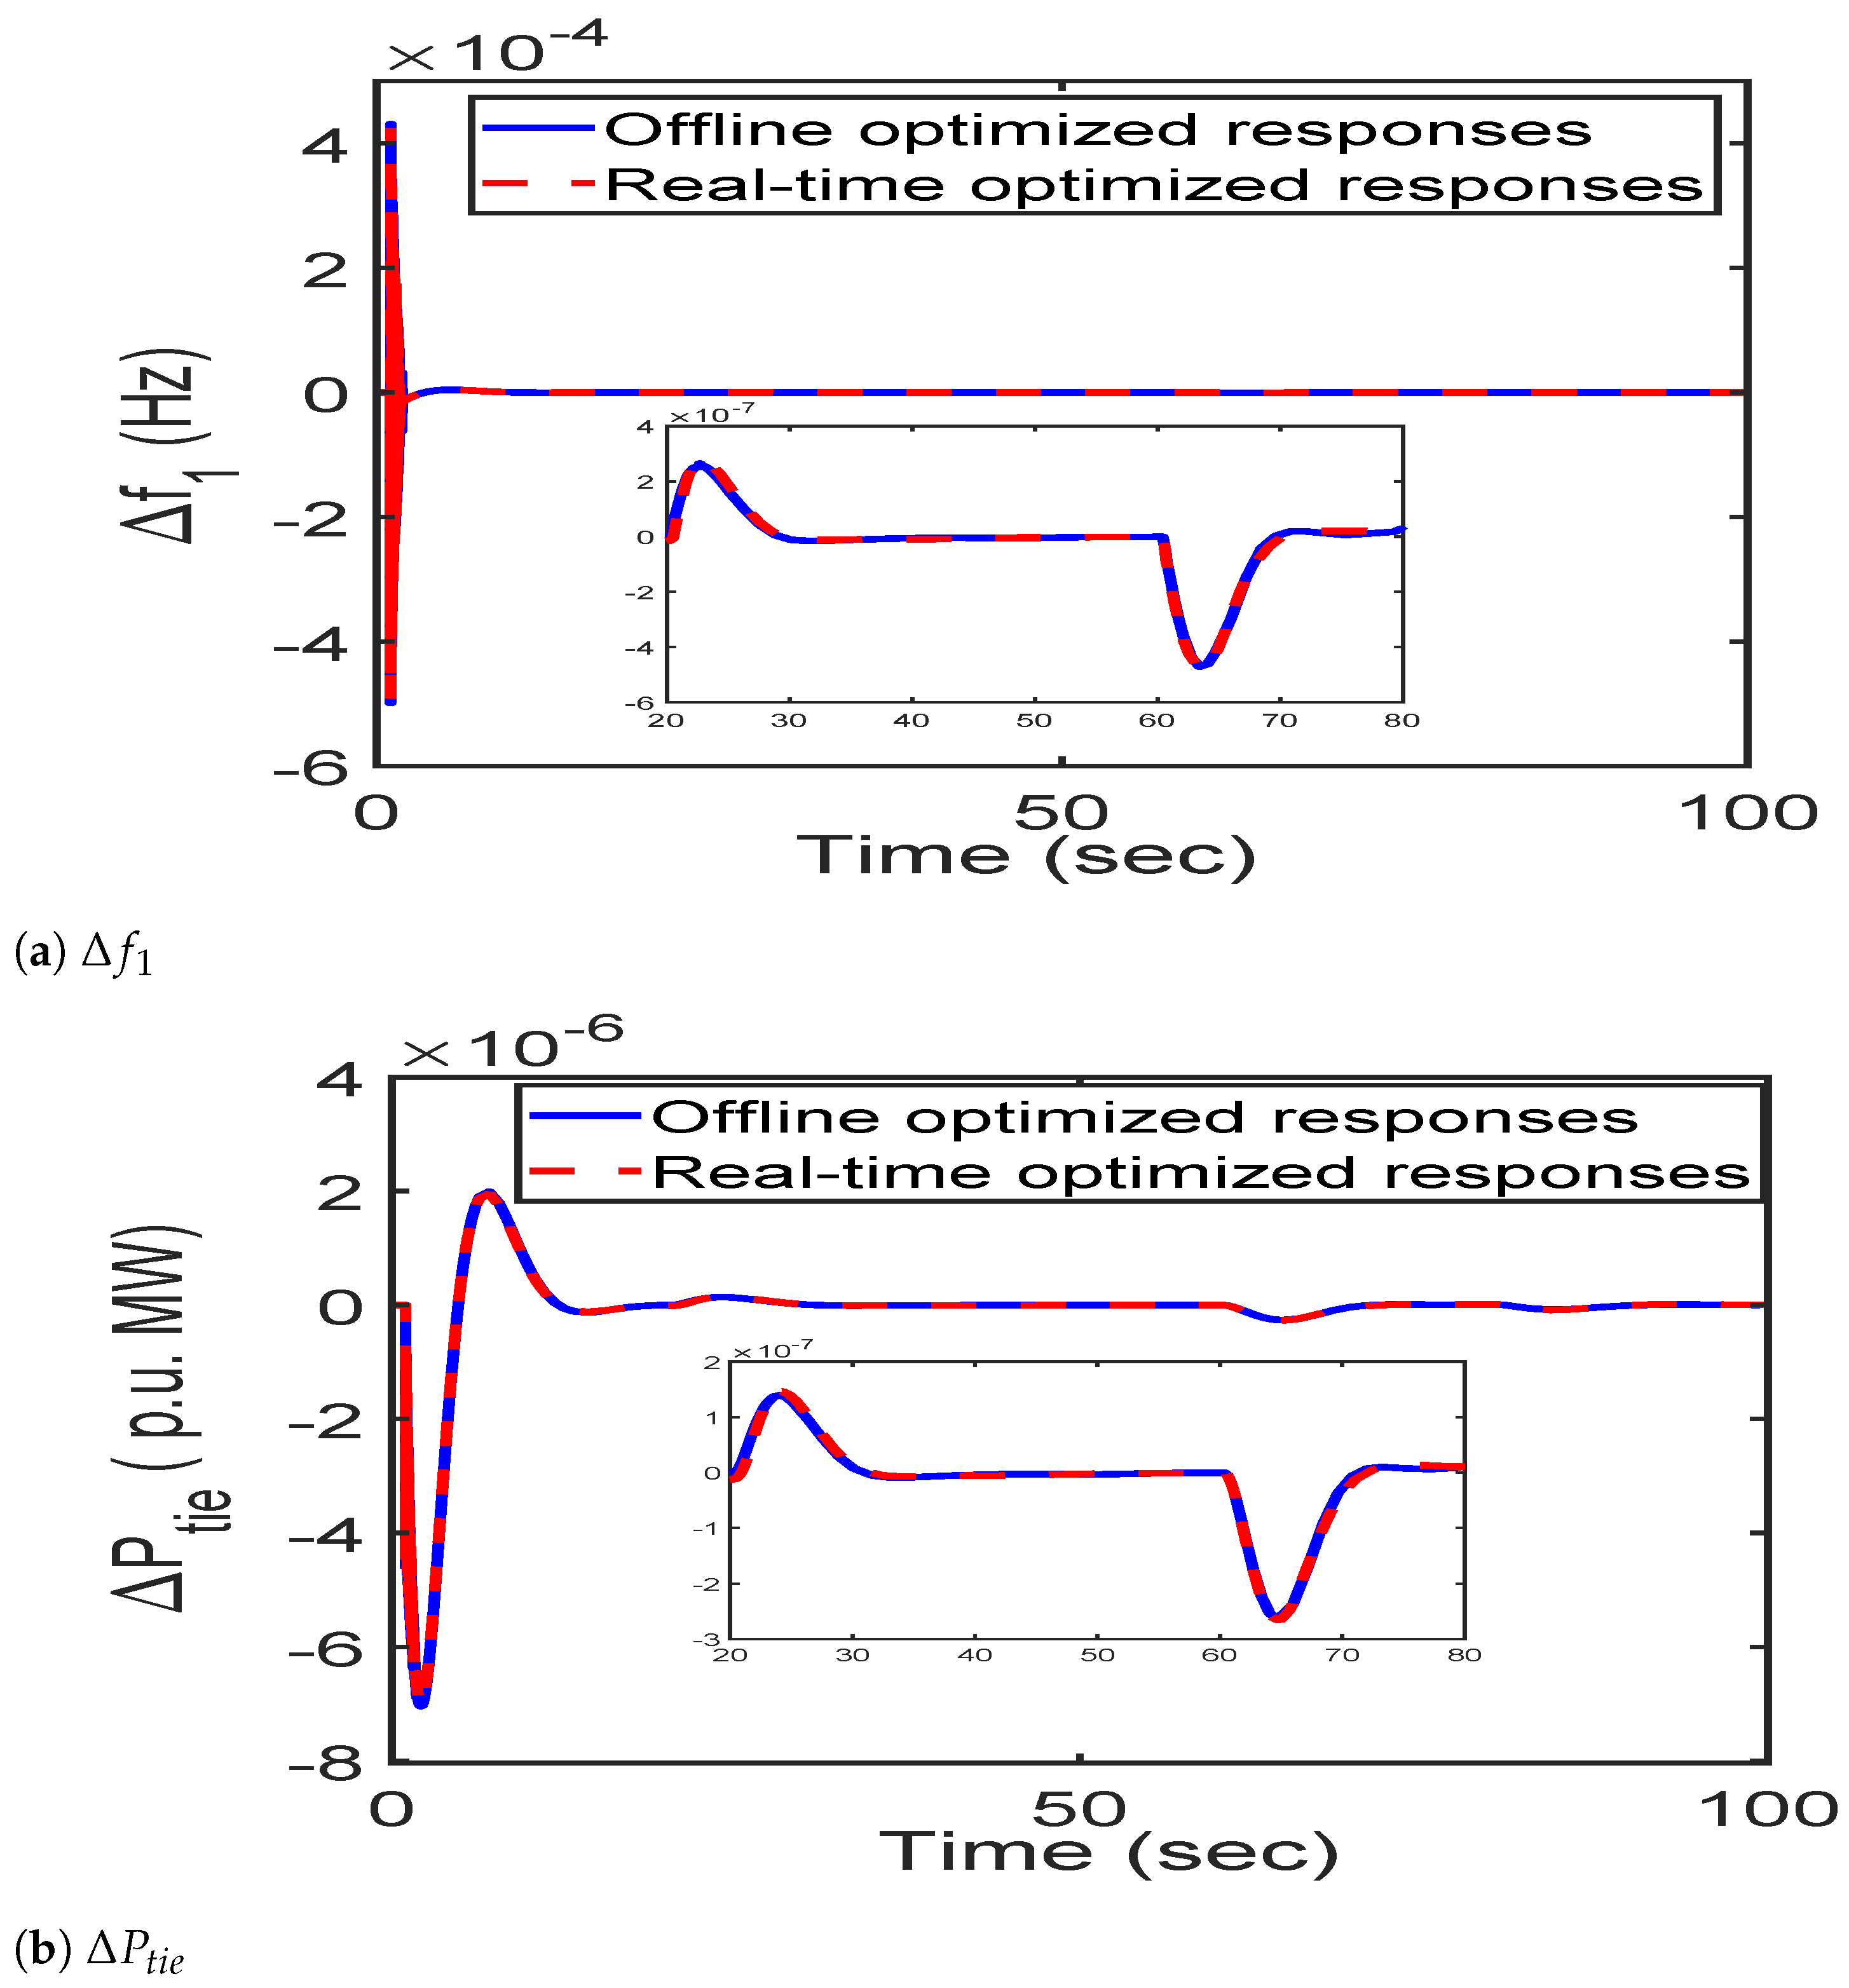
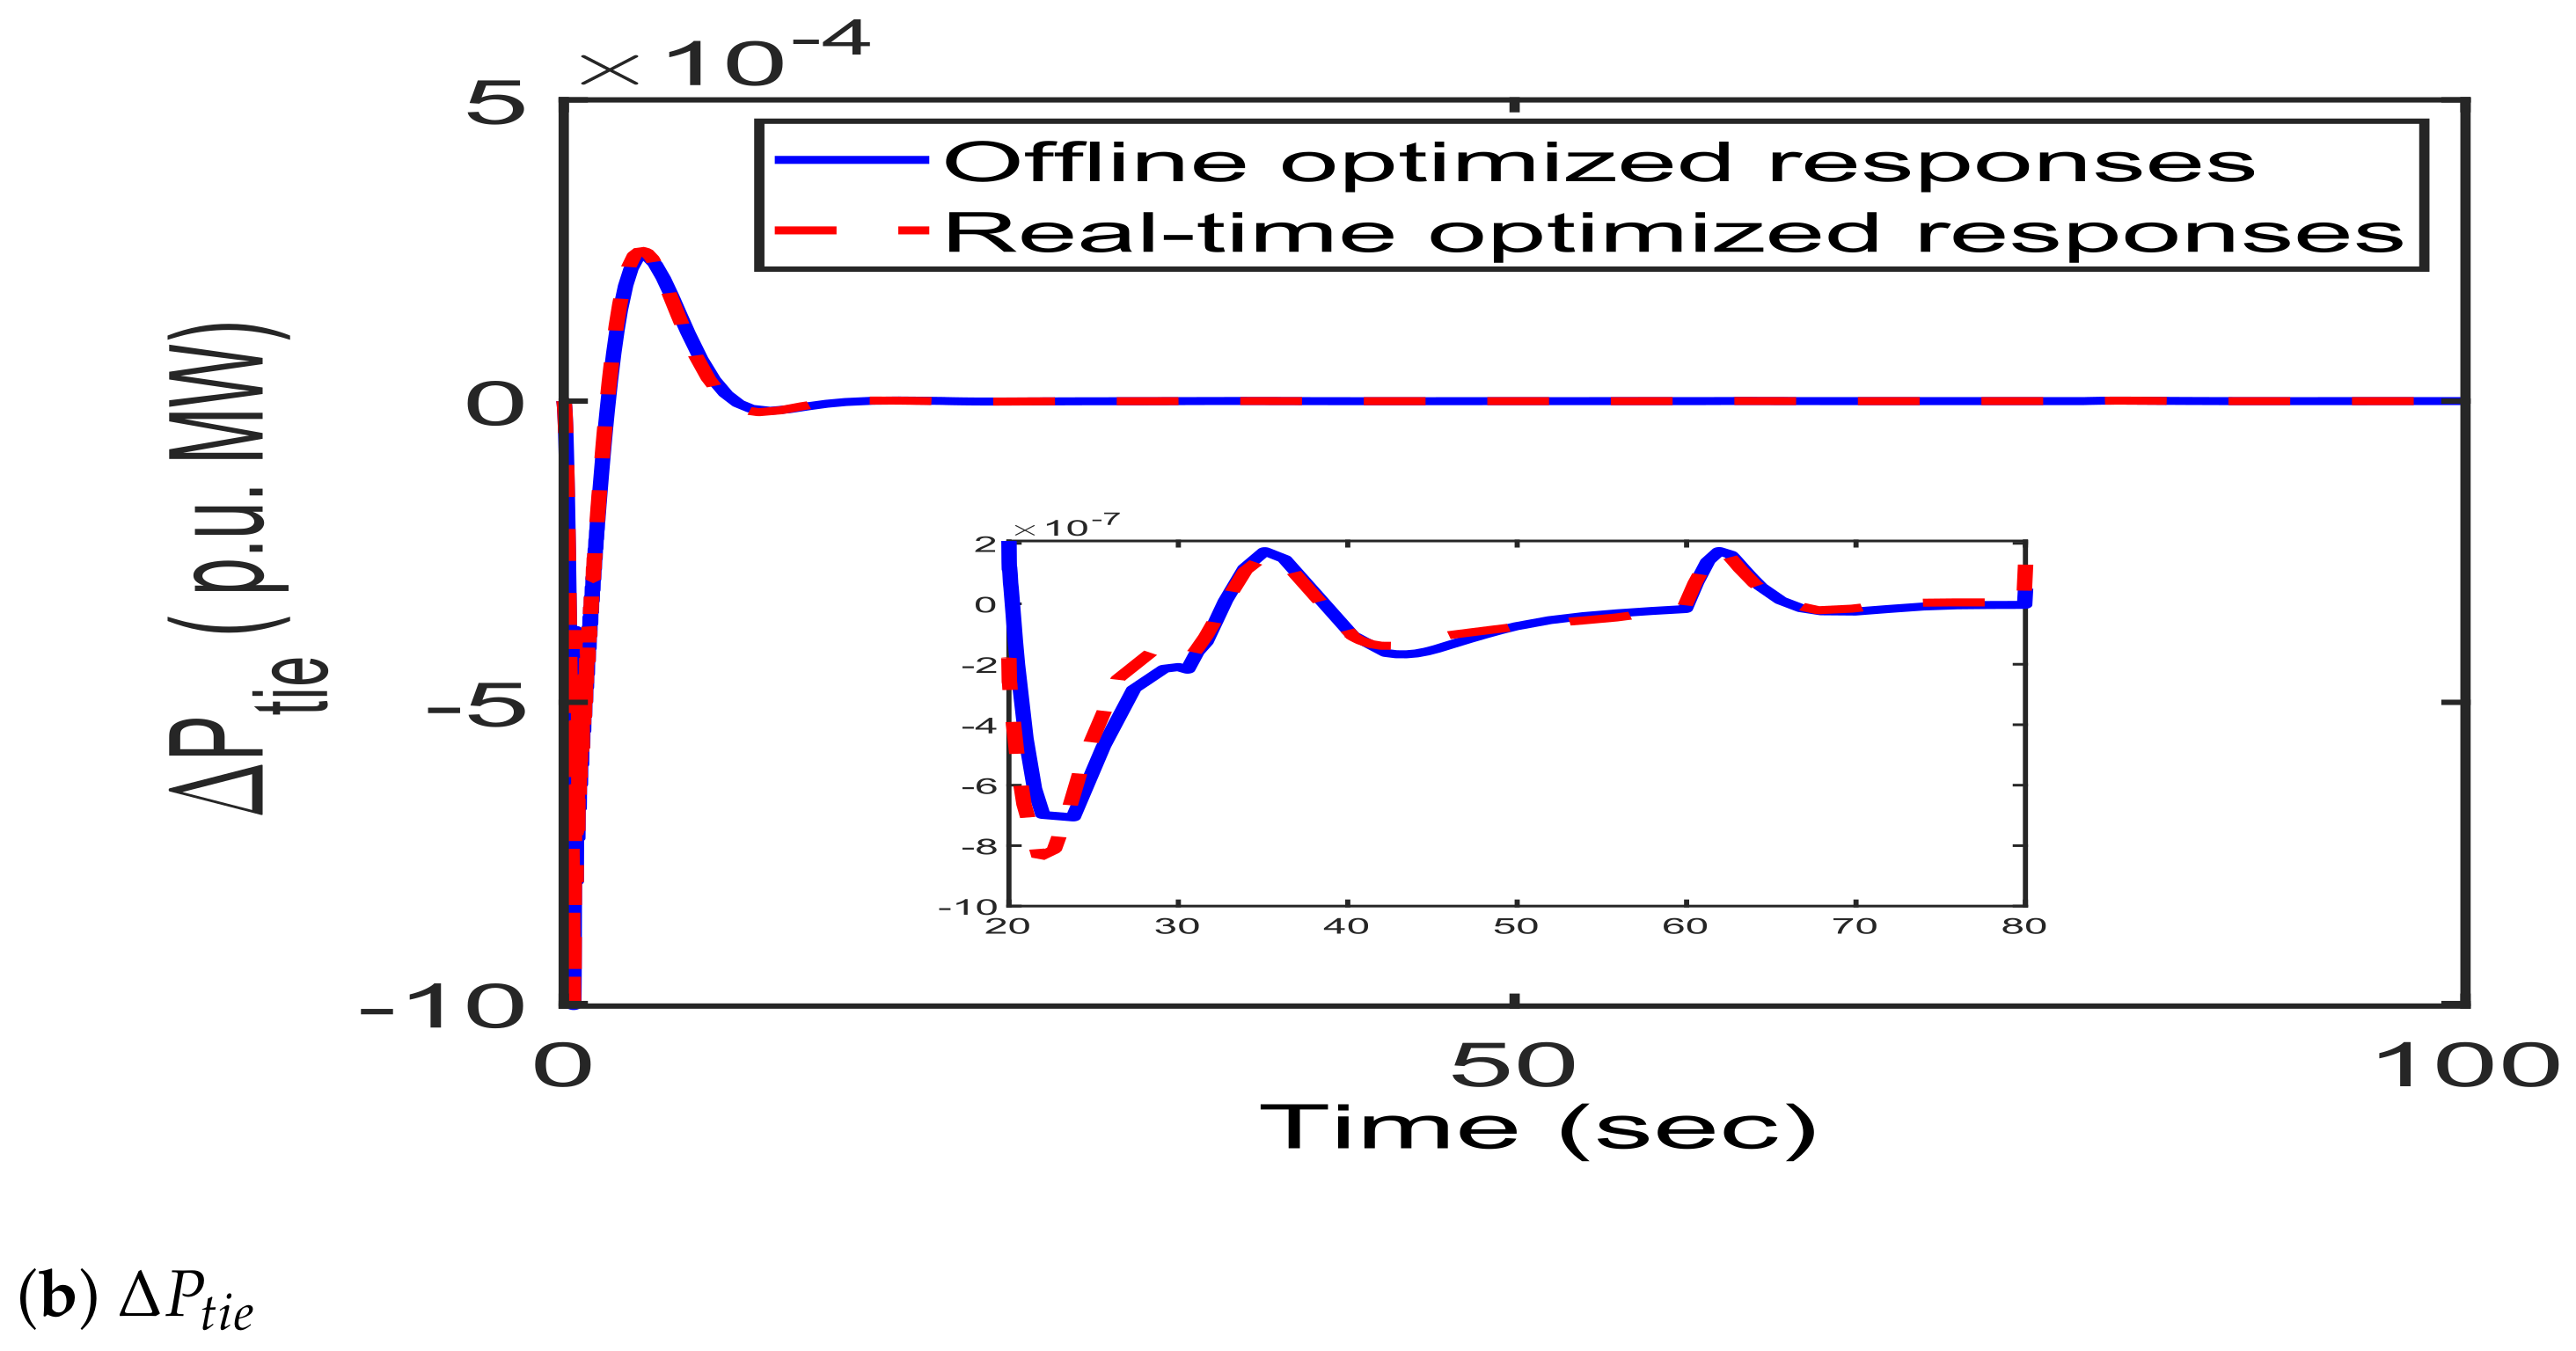
7.4. Power System Performance Comparison for C-19BOA Optimized Controller Gains of 2nd Order ADRC and PID

In this section, the hybrid power system is analyzed for performance improvement using C-19BOA optimized 2nd order ADRC. Then, the comparison of system dynamic responses achieved for the C-19BOA optimized ADRC and PID controller is made based on dynamic response overshoot, undershoot and settling-time characteristics.
The hybrid power system, presented in Section 7.1 and shown in Figure 6, is now simulated with ADRC controllers in both areas. The obtained responses for a C-19BOA optimized 2nd order ADRC controlled power system are compared with those of the PID controlled power system (obtained in Section 7.3) and shown in Figure 11. It can be seen from Figure 11 that the C-19BOA optimized 2nd order ADRC regulates the system dynamic responses more dominantly with respect to the C-19BOA optimized PID controller. Overshoots, undershoots and settling-time for the hybrid power system are very much low for the 2nd order ADRC as compared to the PID controller. The values of peak-to-peak responses are also shown in Figure 11, where the 2nd ADRC exhibits a huge reduction in such values. Hence, it can be inferred that the developed 2nd order ADRC outperforms the industrially applied PID controller for the presented hybrid power system.

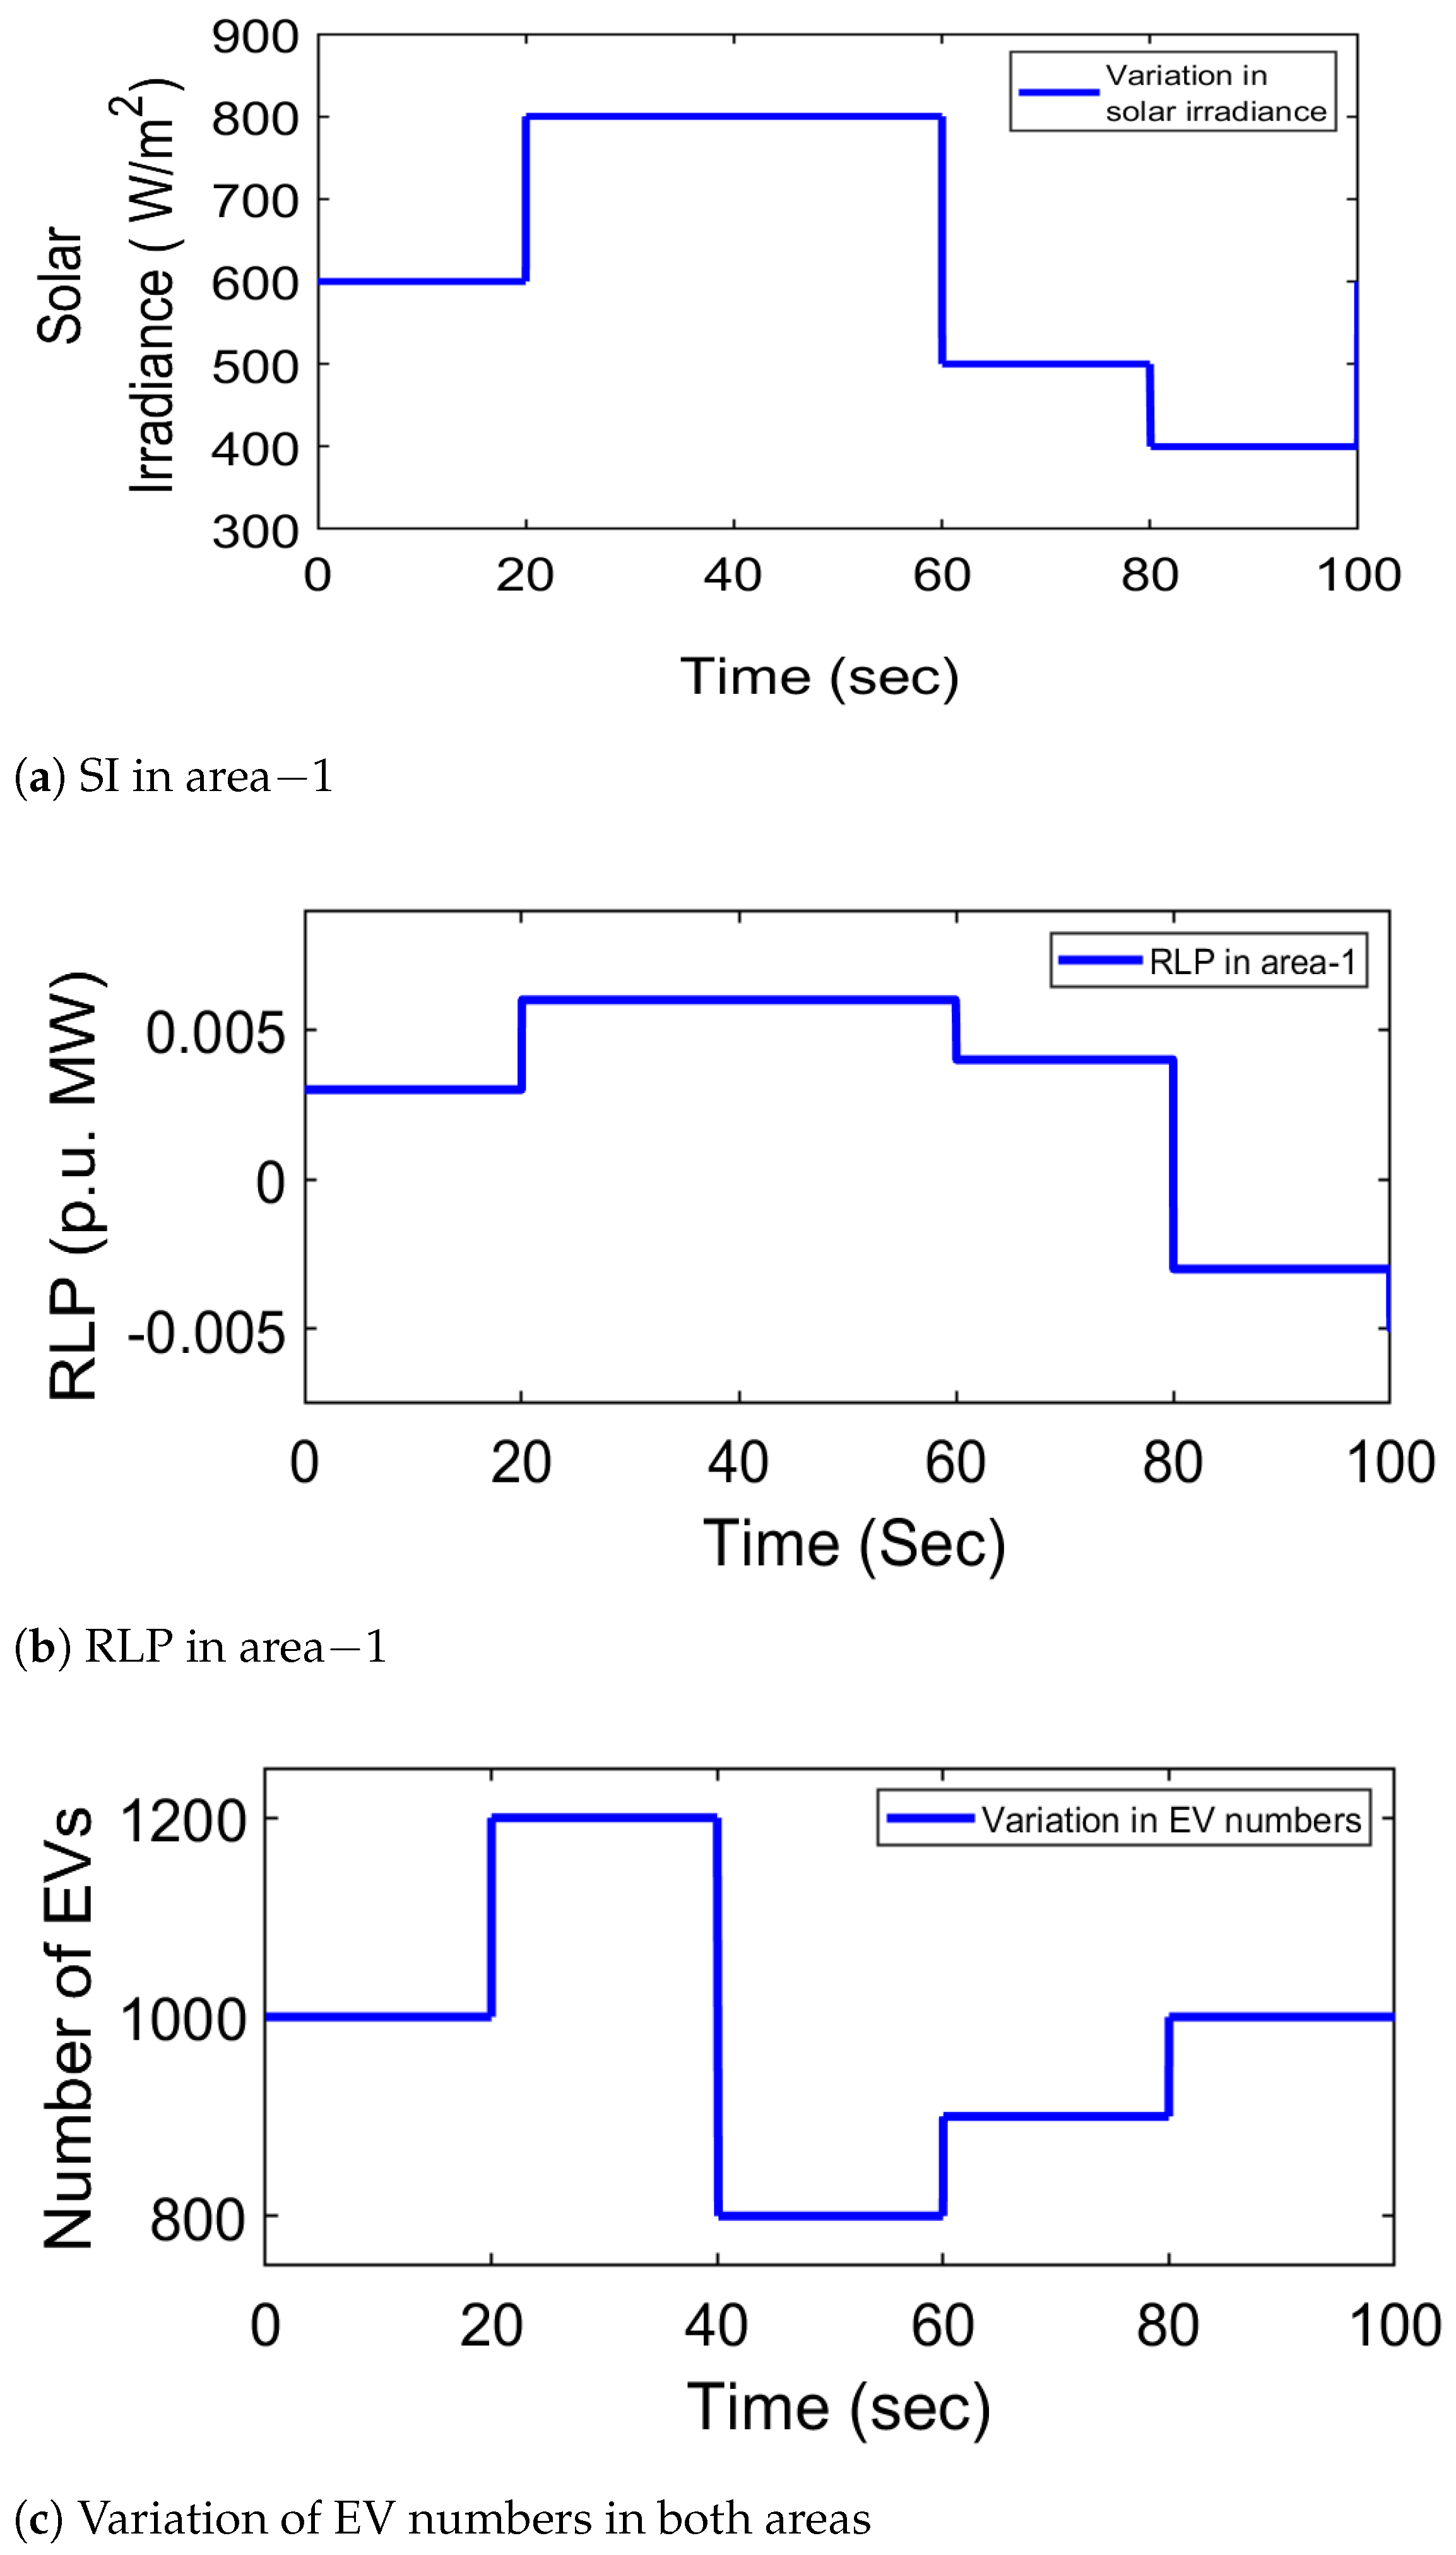
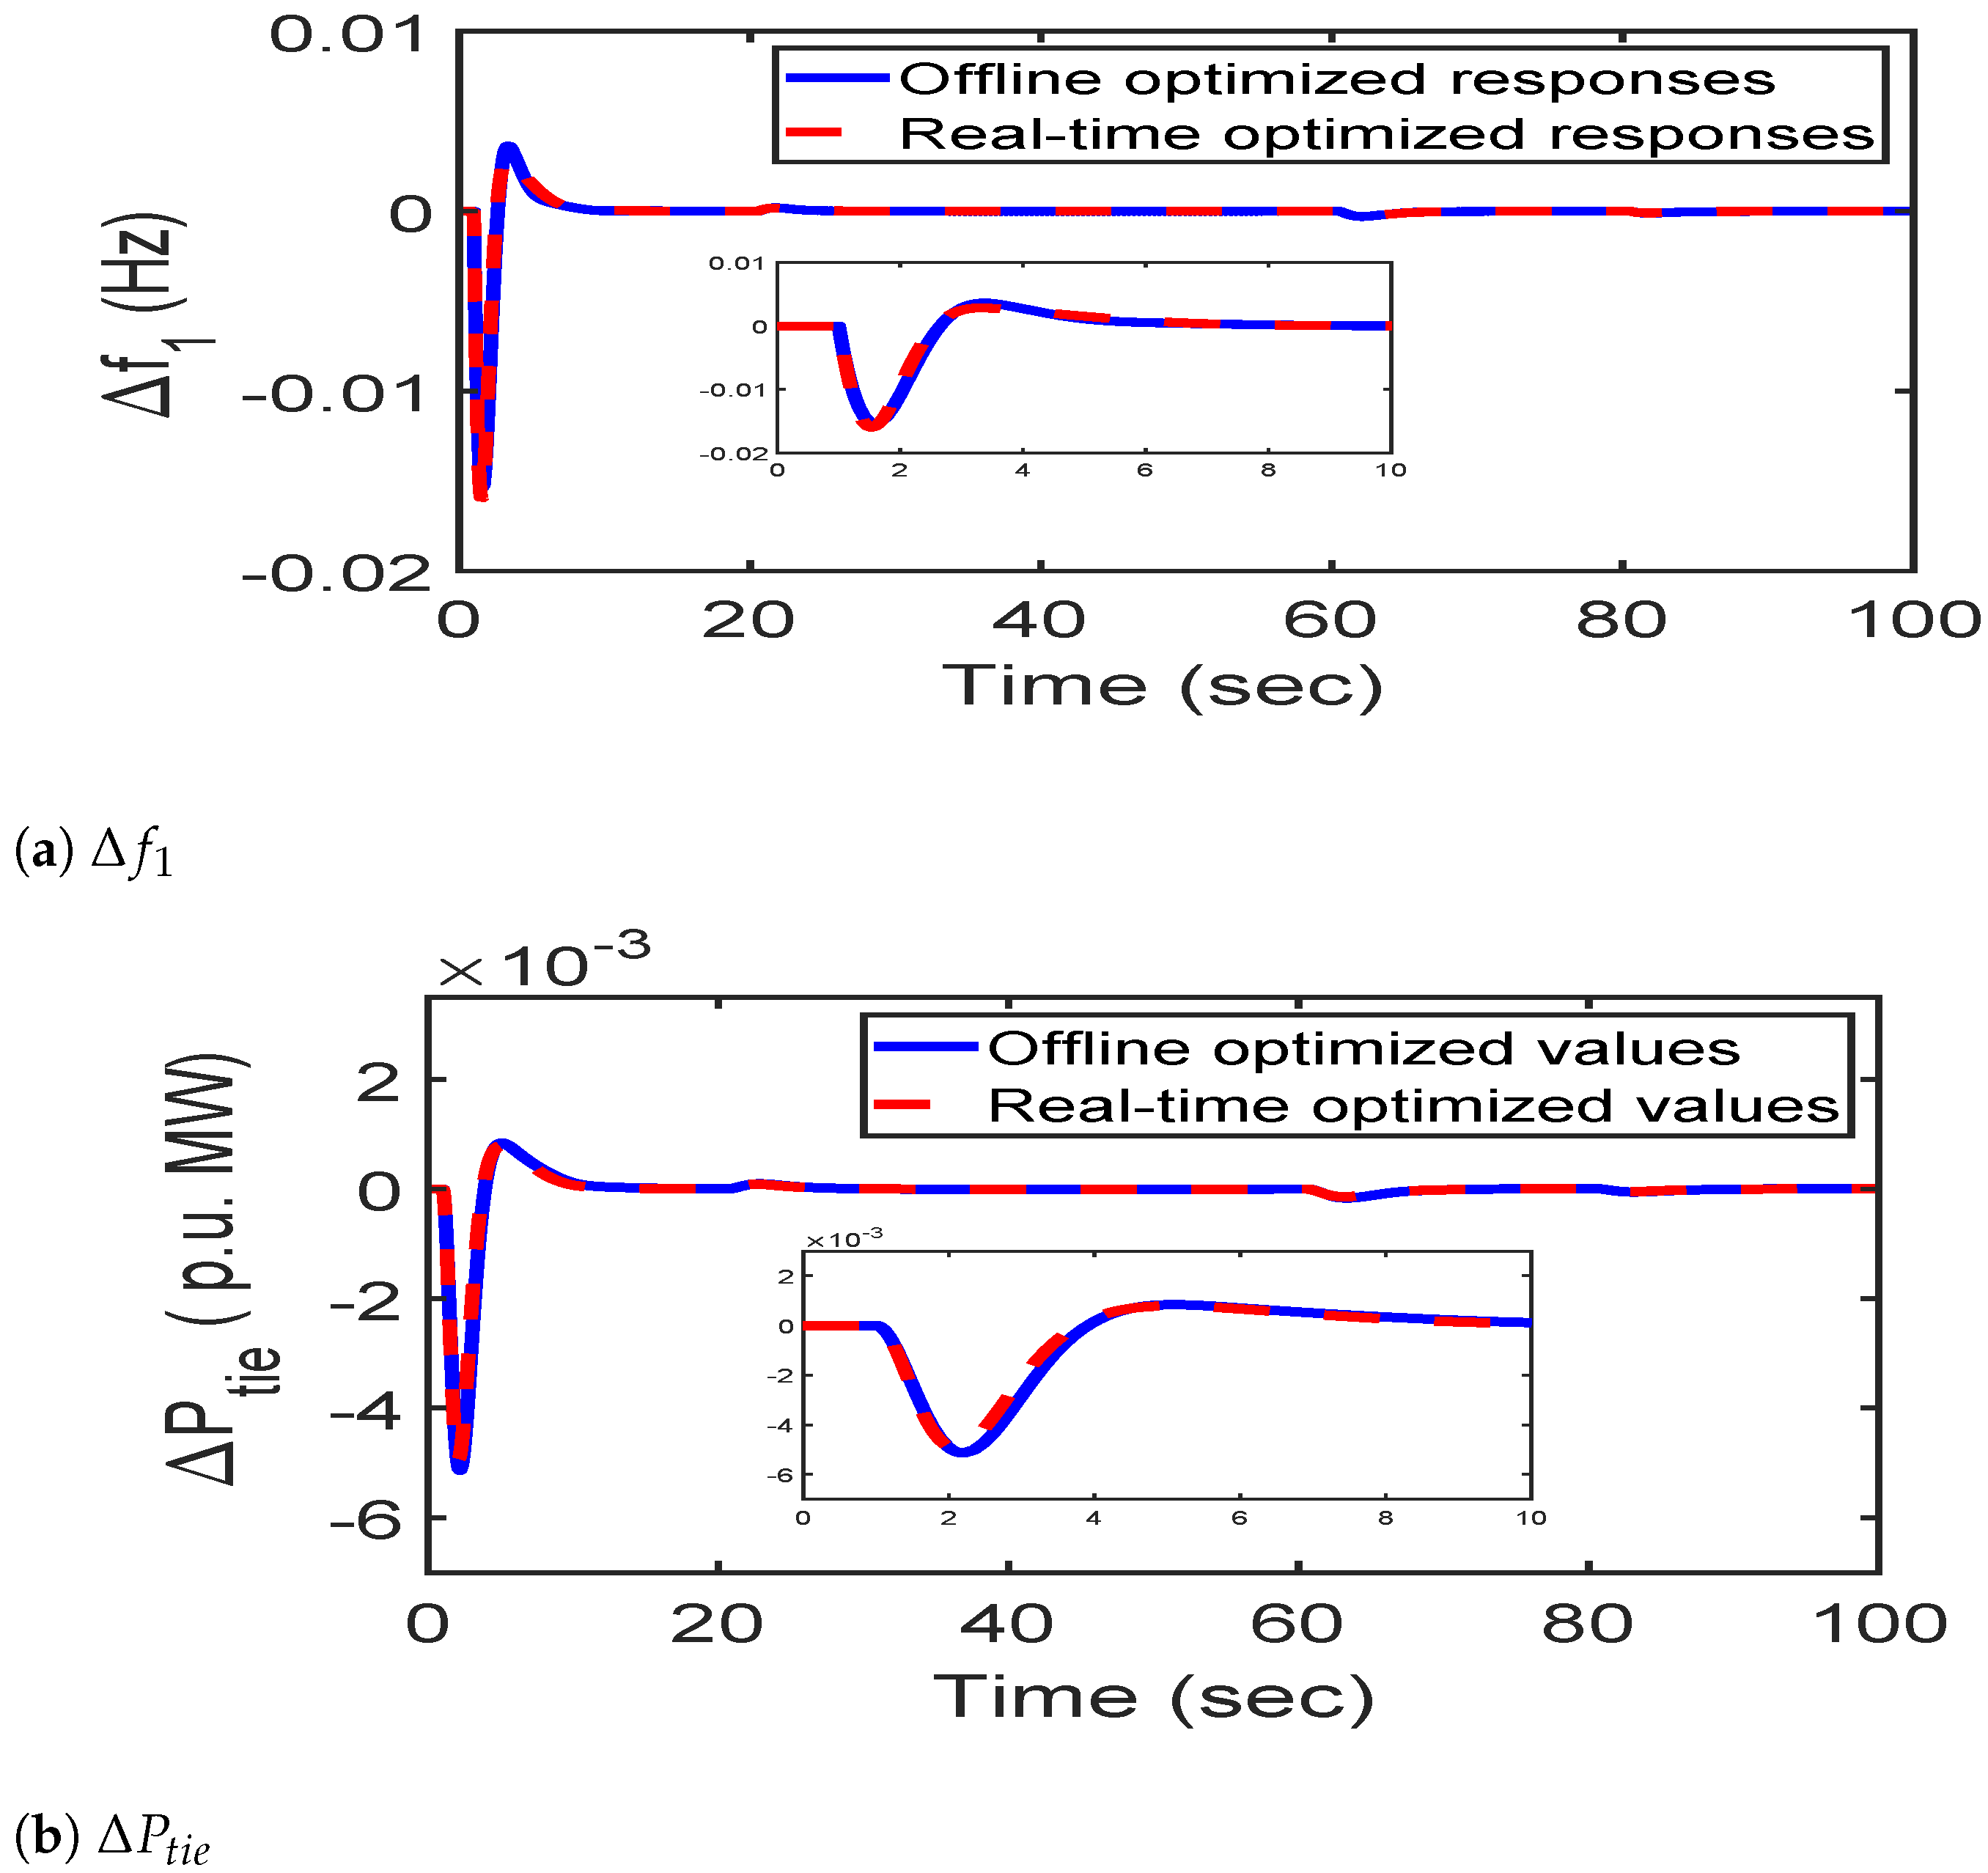
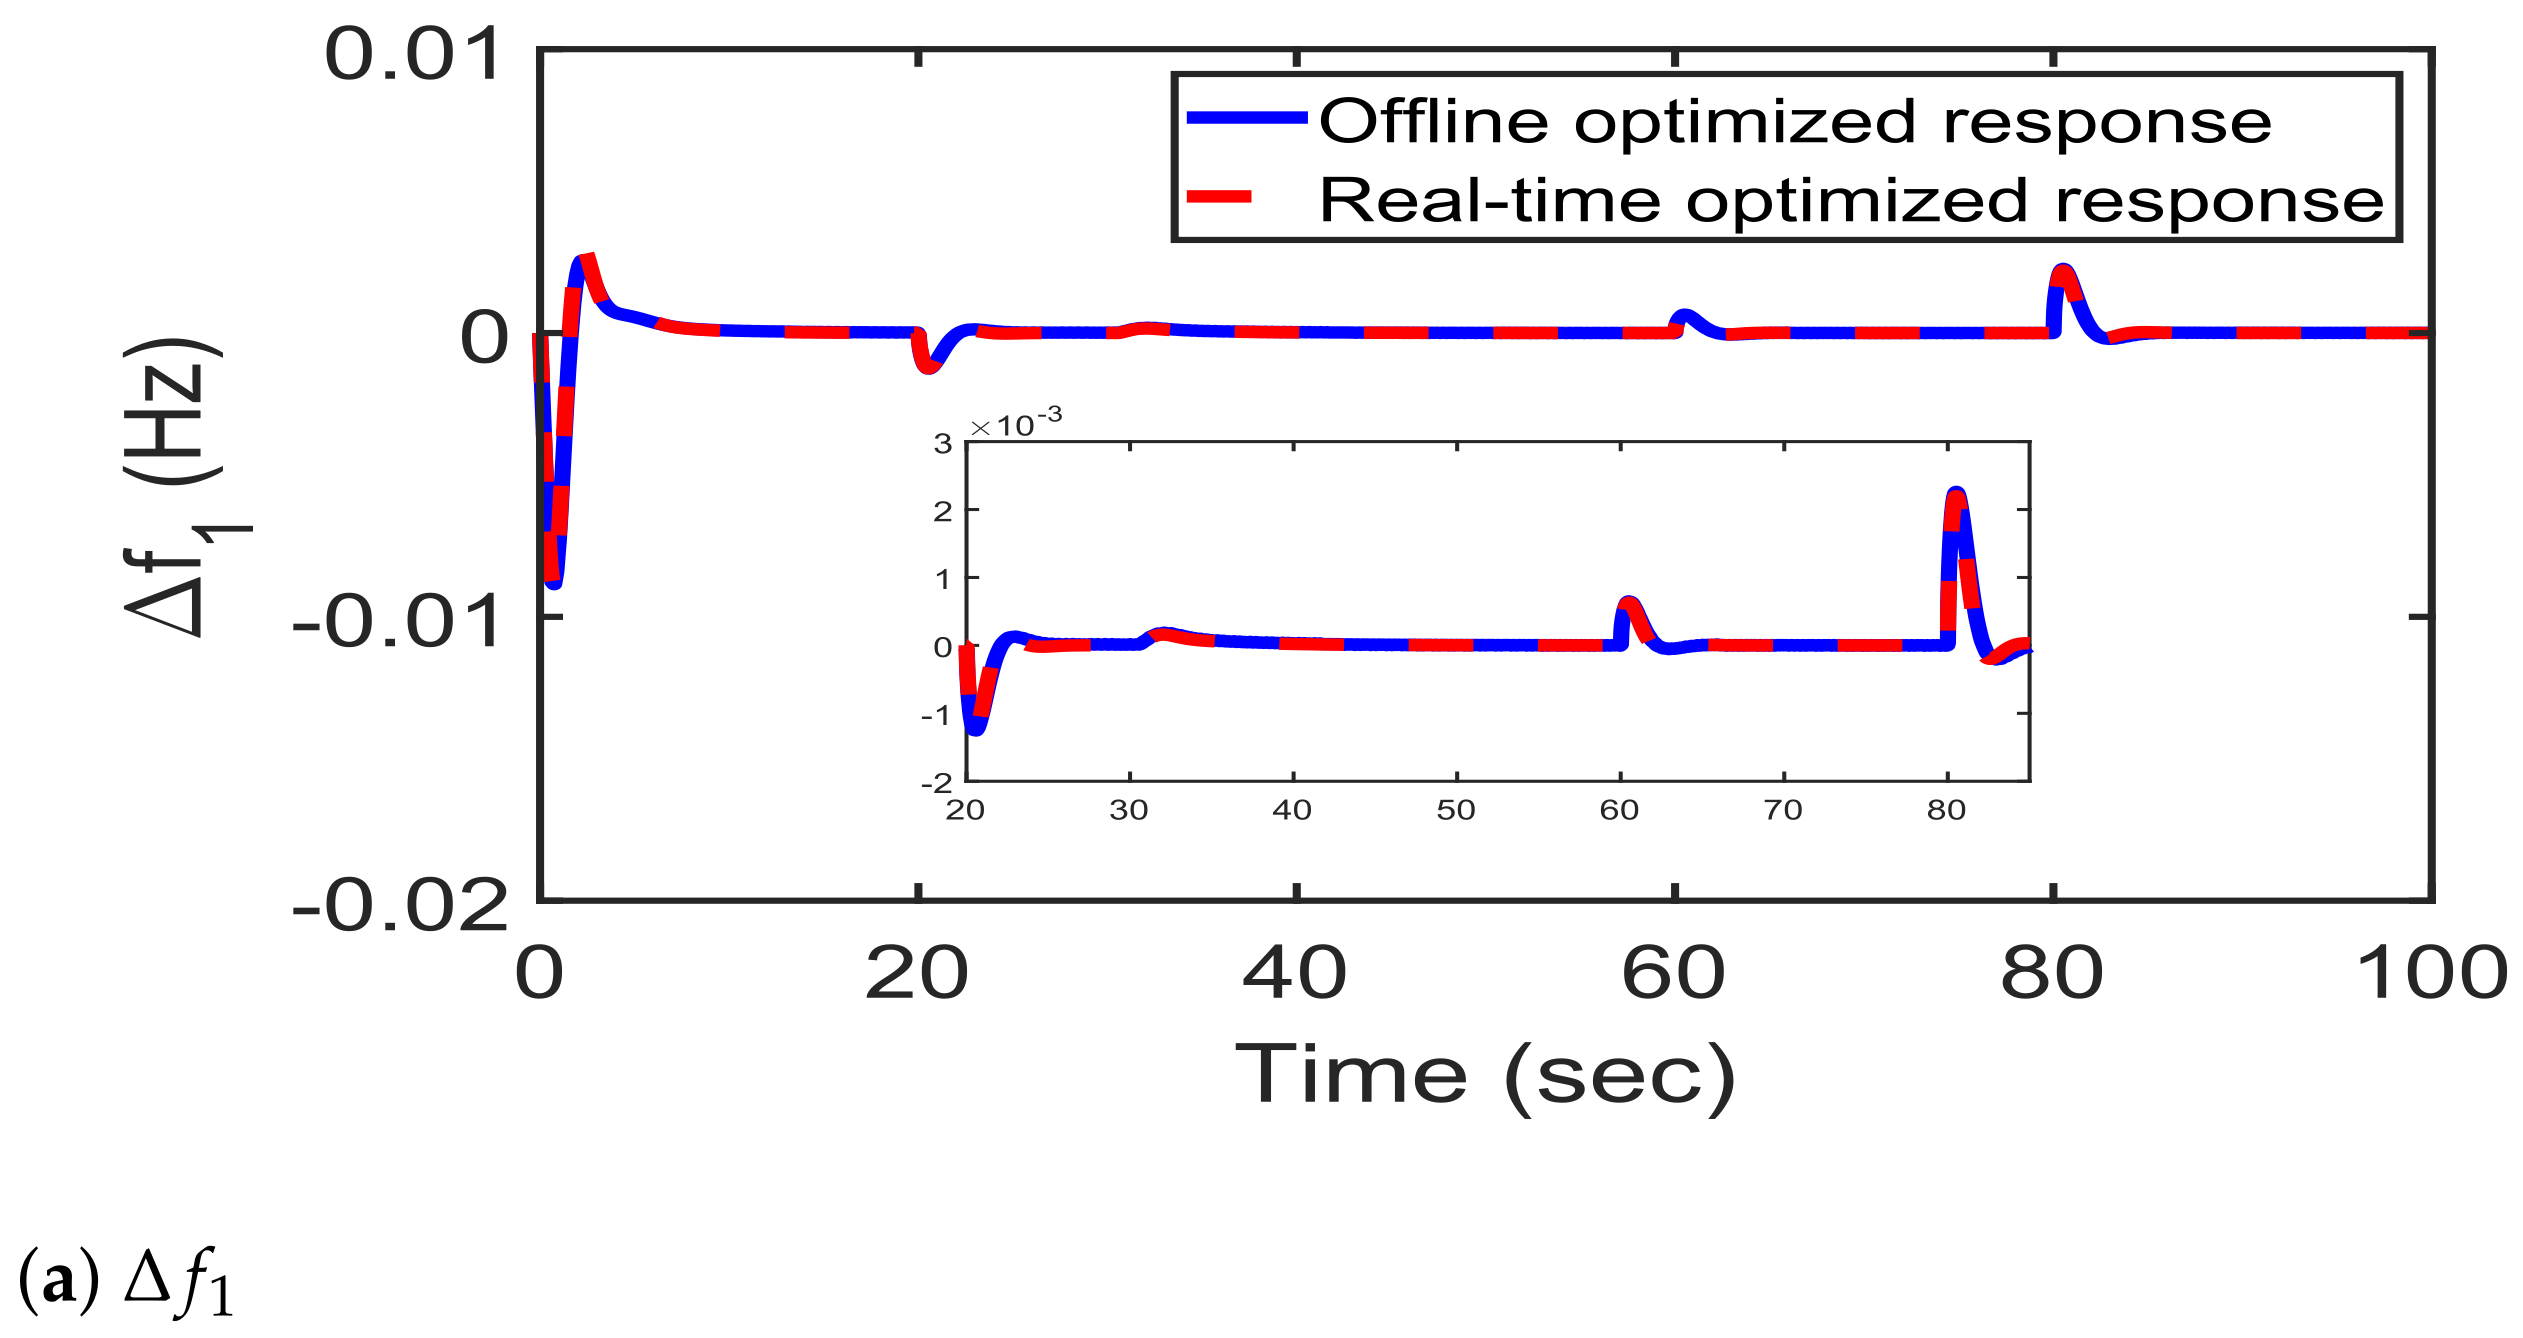
7.5. Sensitivity Test

Varying load settings and system constraints up to a quantified range guarantees the robustness of a particular control system. The controller should be robust enough to withstand any variations or uncertainties that the system is subjected to. In order to test the robustness of the proposed C-19BOA optimized controller gains, firstly, the solar irradiance of solar–thermal plant in area-1 is altered through intense variations. Figure 12a shows the solar irradiance (SI) variation pattern. Secondly, the nominal system is subjected through diverse variations in load disturbances in area-1. The pattern of random load perturbation (RLP) is shown in Figure 12b. Finally, the power system stability for C-19BOA optimized controllers is tested by varying the number of electric vehicles (EVs) connected to the grid, as shown in Figure 12c.
Initially, the robustness of C-19BOA optimized gains is tested on a PID-controlled system. In order to further validate the robustness, a sensitivity test is applied on 2nd order ADRC gains as well.
The PID controller gains optimized for the changed system conditions using C-19BOA are labeled as real-time optimized values, while the already optimized PID gains using C-19BOA under nominal system condition are labeled as offline optimized values.
The system dynamic responses for the PID controller corresponding to variation in solar irradiance are shown in Figure 13. Similarly, the responses for the PID controller corresponding to load disturbance variation, RLP, are reported in Figure 14 and that of EV number variation is shown in Figure 15. Thus, the robustness for the PID controller in the present power system is explored through Figure 13, Figure 14 and Figure 15. It can be concluded that a C-19BOA-optimized PID controller accomplishes an agreeable task in case any uncertainty is subjected to the power system, and thus, appropriate dynamic stability is attained. As in the preceding paragraph, the sensitivity test of C-19BOA optimized gains for the developed 2nd order ADRC is also completed and shown in Figure 16, Figure 17 and Figure 18. The responses in Figure 16, Figure 17 and Figure 18 clearly verify the reliability of C-19BOA optimized controller gains under nominal system conditions.
Inferences from Section 7.5: The sensitivity test carried out in Section 7.5 authenticates the fact that the optimized gains of PID and ADRC controllers are robust enough to withstand any deviations in system parameters from the nominal values. This is certainly claimed, as the variation in system parameters in the form of solar irradiance of the solar–thermal plant (shown by Figure 12a), random load perturbation (RLP) (shown in Figure 12b) and variation in the number of electric vehicles (EVs) connected to the grid (shown in Figure 12c) has very little effect on the performance of the power system. This is desired for an efficient optimization approach such that the system should be stable enough to withstand any changes. Thus, the proposed algorithm C-19BOA is efficient enough in optimizing the 2nd order ADRC and PID controller gains and need not be changed for alterations in system parameters. Hence, C-19BOA fulfills the required criteria to establish itself for applications in engineering problems.

8. Conclusions

This paper introduces a novel bio-inspired meta-heuristic optimization algorithm based on the behavior of present-day coronavirus disease (COVID-19). The spread of COVID-19 infection from one person to another through social contacts is modeled mathematically. Similarly, the infection spread control through containment factors is also modeled mathematically, and the COVID-19-based optimization algorithm (C-19BOA) is developed. Initially, the proposed C-19BOA is successfully tested on standard mathematical IEEE benchmark functions in order to check its performance in minimizing the benchmark functions. The optimized benchmark function values for C-19BOA are compared with already established bio-inspired optimization algorithms viz. GA, PSO, MBO, BBO and AOA. Performance analyses reveal the developed C-19BOA is on par with the established optimization algorithms in terms of minimization of benchmark functions and convergence to optimal values. Furthermore, the developed C-19BOA is tested for modern engineering problems for regulating the power system parameters within defined limits, optimizing the industrial applied PID controller gains and developed 2nd order ADRC gains in load frequency control operation of a two-area electrical power system. The simulation results indicate that the proposed algorithm, C-19BOA, is efficient enough to overcome the performances of GA, PSO, MBO, BBO and AOA in terms of regulating the dynamic stability of the power system. In addition, the developed 2nd order ADRC outperforms the industrially applied PID controller in improving the performance of the hybrid power system. The robustness analysis for the C-19BOA optimized PID controller and 2nd order ADRC gains to check the robustness of the developed power system in case of any contingency also validates the effectiveness of the proposed optimization algorithm. Analyses and simulation outcomes illustrate the dominance and effectiveness of the proposed C-19BOA in solving benchmark functions and modern engineering problems. Future research can be carried out on post-vaccination effects with a possible decline in virus proliferation.

Author Contributions

Conceptualization, S.S., A.R., S.A.L., S.M.S.H. and T.S.U.; methodology, S.S., A.R., S.A.L., S.M.S.H. and T.S.U.; validation, S.S., A.R. and S.A.L.; investigation, S.S., A.R., S.A.L., S.M.S.H. and T.S.U.; writing—original draft preparation, S.S., A.R. and S.A.L.; writing—review and editing, S.M.S.H. and T.S.U.; visualization, S.S. and S.A.L.; Project administration, A.R. and T.S.U.; funding acquisition, T.S.U. All authors have read and agreed to the published version of the manuscript.

Funding

This research received no external funding.

Institutional Review Board Statement

Not applicable.

Informed Consent Statement

Not applicable.

Data Availability Statement

Not applicable.

Conflicts of Interest

The authors declare no conflict of interest.

Nomenclature

LFC: Load frequency control; PZ: Patient zero; SD: Social distancing; IR: Infection rate; TD: Threshold distance; ρ S D : Social distancing probability; DPR: Disease propagation rate; ρ M : Mask use probability; AR: Antibody rate factor; ρ A R : Antibody rate probability; Δ f i : Incremental change in frequency (Hz); SLP: Incremental load change (p.u. MW); K P S : 1/ D i : Power-system gain; Δ P t i e j : Area i-j tie-line-power interchange (p.u. MW); K S o l a r : Solar–Thermal gain; T S o l a r : Solar–Thermal time-constant; T P S : 2 H i / f   ×   D i : power-system time constant; B i : bias coefficient; K E V i : Electric vehicle gain; T E V i : Electric vehicle time-constant; N E V i : No. of electric vehicles; R i j : Speed-regulation constant; T g o v : Governor time-constant; T t u r : Turbine time-constant; T r e h : Reheater time-constant; K r e h : Reheater gain; HPS: Hybrid power system.

Appendix A

System parameters:
Frequency (f): 60 Hz; H i : 5 s; R i : 2.4 Hz/p.u. MW, B i : 0.425 p.u. MW/Hz; D i : 8.33 × 10 3 p.u. MW/Hz; a 12 : −2/3; loading: 50%.
Solar plant: K S o l a r : 1; T S o l a r : 1; T S o l a r : 20 s.
Power system: T P S I : 20 s; K P S I : 120 Hz/(p.u. MW).
Electric vehicle: K E V i : 1; T E V i : 1 s; R A G i = R i ; N E V i : 1000.
Thermal unit: T r e h : 10 s; K r e h : 0.5: T g o v : 0.08 s; T t u r : 0.3 s.
Wind unit: K w : 1; T w : 1.5 s

References

  1. Coronavirus Cases. Worldometer. Available online: https://www.worldometers.info/coronavirus (accessed on 28 August 2022).
  2. Del Ser, J.; Osaba, E.; Molina, D.; Yang, X.S.; Salcedo-Sanz, S.; Camacho, D.; Das, S.; Suganthan, P.N.; Coello, C.A.C.; Herrera, F. Bio-inspired computation: Where we stand and what’s next. Swarm Evol. Comput. 2019, 48, 220–250. [Google Scholar] [CrossRef]
  3. Holland, J.H. Adaptation in Natural and Artificial Systems: An Introductory Analysis with Applications to Biology, Control, and Artificial Intelligence; MIT Press: Cambridge, MA, USA, 1992. [Google Scholar]
  4. Simon, D. Biogeography-based optimization. IEEE Trans. Evol. Comput. 2008, 12, 702–713. [Google Scholar] [CrossRef] [Green Version]
  5. Kennedy, J.; Eberhart, R. Particle swarm optimization. In Proceedings of the ICNN’95-International Conference on Neural Networks, Perth, WA, Australia, 27 November–1 December 1995; IEEE: Piscataway, NJ, USA, 1995; Volume 4, pp. 1942–1948. [Google Scholar]
  6. Karaboga, D.; Basturk, B. A powerful and efficient algorithm for numerical function optimization: Artificial bee colony (ABC) algorithm. J. Glob. Optim. 2007, 39, 459–471. [Google Scholar] [CrossRef]
  7. Yang, X.S.; Deb, S. Cuckoo search via Lévy flights. In Proceedings of the 2009 World Congress on Nature & Biologically Inspired Computing (NaBIC), Coimbatore, India, 9–11 December 2009; IEEE: Piscataway, NJ, USA, 2009; pp. 210–214. [Google Scholar]
  8. Mo, H.; Xu, L. Magnetotactic bacteria optimization algorithm for multimodal optimization. In Proceedings of the 2013 IEEE Symposium on Swarm Intelligence (SIS), Singapore, 16–19 April 2013; pp. 240–247. [Google Scholar] [CrossRef]
  9. Mirjalili, S.; Mirjalili, S.M.; Lewis, A. Grey wolf optimizer. Adv. Eng. Softw. 2014, 69, 46–61. [Google Scholar] [CrossRef] [Green Version]
  10. Hashim, F.A.; Hussain, K.; Houssein, E.H.; Mabrouk, M.S.; Al-Atabany, W. Archimedes optimization algorithm: A new metaheuristic algorithm for solving optimization problems. Appl. Intell. 2021, 51, 1531–1551. [Google Scholar] [CrossRef]
  11. Abualigah, L.; Diabat, A.; Mirjalili, S.; Abd Elaziz, M.; Gandomi, A.H. The Arithmetic Optimization Algorithm. Comput. Methods Appl. Mech. Eng. 2021, 376, 113609. [Google Scholar] [CrossRef]
  12. Mirjalili, S.; Gandomi, A.H.; Mirjalili, S.Z.; Saremi, S.; Faris, H.; Mirjalili, S.M. Salp Swarm Algorithm: A bio-inspired optimizer for engineering design problems. Adv. Eng. Softw. 2017, 114, 163–191. [Google Scholar] [CrossRef]
  13. Mirjalili, S.; Lewis, A. The whale optimization algorithm. Adv. Eng. Softw. 2016, 95, 51–67. [Google Scholar] [CrossRef]
  14. Hosseini, E. Laying chicken algorithm: A new meta-heuristic approach to solve continuous programming problems. J. Appl. Comput. Math. 2017, 6, 1–8. [Google Scholar] [CrossRef]
  15. Eghbal, H. Big bang algorithm: A new meta-heuristic approach for solving optimization problems. Asian J. Appl. Sci. 2017, 10, 134–144. [Google Scholar]
  16. Pattnaik, S.S.; Jadhav, D.G.; Devi, S.; Ratho, R.K. Swine influenza inspired optimization algorithm and its application to multimodal function optimization and noise removal. Artif. Intell. Res. 2012, 1, 18–30. [Google Scholar] [CrossRef]
  17. Liang, Y.C.; Cuevas Juarez, J.R. A novel metaheuristic for continuous optimization problems: Virus optimization algorithm. Eng. Optim. 2016, 48, 73–93. [Google Scholar] [CrossRef]
  18. Liang, Y.C.; Juarez, J.R.C. A self-adaptive virus optimization algorithm for continuous optimization problems. Soft Comput. 2020, 24, 13147–13166. [Google Scholar] [CrossRef]
  19. Martínez-Álvarez, F.; Asencio-Cortés, G.; Torres, J.; Gutiérrez-Avilés, D.; Melgar-García, L.; Pérez-Chacón, R.; Rubio-Escudero, C.; Riquelme, J.C.; Troncoso, A. Coronavirus Optimization Algorithm: A bioinspired metaheuristic based on the COVID-19 propagation model. Big Data 2020, 8, 308–322. [Google Scholar] [CrossRef]
  20. Hosseini, E.; Ghafoor, K.Z.; Sadiq, A.S.; Guizani, M.; Emrouznejad, A. Covid-19 optimizer algorithm, modeling and controlling of coronavirus distribution process. IEEE J. Biomed. Health Inf. 2020, 24, 2765–2775. [Google Scholar] [CrossRef]
  21. Al-Qaness, M.A.; Ewees, A.A.; Fan, H.; Abd El Aziz, M. Optimization method for forecasting confirmed cases of COVID-19 in China. J. Clin. Med. 2020, 9, 674. [Google Scholar] [CrossRef] [Green Version]
  22. Samui, P.; Mondal, J.; Khajanchi, S. A mathematical model for COVID-19 transmission dynamics with a case study of India. Chaos Solitons Fractals 2020, 140, 110173. [Google Scholar] [CrossRef]
  23. Srivastav, A.K.; Tiwari, P.K.; Srivastava, P.K.; Ghosh, M.; Kang, Y. A mathematical model for the impacts of face mask, hospitalization and quarantine on the dynamics of COVID-19 in India: Deterministic vs. stochastic. Math. Biosci. Eng. 2021, 18, 182–213. [Google Scholar] [CrossRef]
  24. Rafiq, D.; Suhail, S.A.; Bazaz, M.A. Evaluation and prediction of COVID-19 in India: A case study of worst hit states. Chaos Solitons Fractals 2020, 139, 110014. [Google Scholar] [CrossRef]
  25. Hakimuddin, N.; Khosla, A.; Garg, J.K. Centralized and decentralized AGC schemes in 2-area interconnected power system considering multi source power plants in each area. J. King Saud Univ. Eng. Sci. 2020, 32, 123–132. [Google Scholar] [CrossRef]
  26. Latif, A.; Hussain, S.M.S.; Das, D.C.; Ustun, T.S. Double stage controller optimization for load frequency stabilization in hybrid wind-ocean wave energy based maritime microgrid system. Applied Energy 2021, 282, 116171. [Google Scholar] [CrossRef]
  27. Jain, V.; Nsugbe, E.; Gupta, S. A GA optimized Fuzzy Logic Controller for Two Area Automatic Generation Control under dynamic behavior of Power System. In Proceedings of the 2021 Fourth International Conference on Computational Intelligence and Communication Technologies (CCICT), Sonepat, India, 3 July 2021; pp. 9–13. [Google Scholar] [CrossRef]
  28. Latif, A.; Paul, M.; Das, D.C.; Hussain, S.M.S.; Ustun, T.S. Price Based Demand Response for Optimal Frequency Stabilization in ORC Solar Thermal Based Isolated Hybrid Microgrid under Salp Swarm Technique. Electronics 2020, 9, 2209. [Google Scholar] [CrossRef]
  29. Chauhan, A.; Upadhyay, S.; Khan, M.T.; Hussain, S.M.S.; Ustun, T.S. Performance Investigation of a Solar Photovoltaic/Diesel Generator Based Hybrid System with Cycle Charging Strategy Using BBO Algorithm. Sustainability 2021, 13, 8048. [Google Scholar] [CrossRef]
  30. Rahman, A.; Saikia, L.C.; Sinha, N. Load frequency control of a hydro-thermal system under deregulated environment using biogeography-based optimised three-degree-of-freedom integral-derivative controller. IET Gener. Transm. Distrib. 2015, 9, 2284–2293. [Google Scholar] [CrossRef]
  31. Sivadanam, N.; Bhookya, N.; Maheswarapu, S. Dynamic performance enhancement of interconnected hybrid thermal power system in the presence of electric vehicles. Case Stud. Therm. Eng. 2021, 26, 101045. [Google Scholar] [CrossRef]
  32. Kumar, K.K.P.; Soren, N.; Latif, A.; Das, D.C.; Hussain, S.M.S.; Al-Durra, A.; Ustun, T.S. Day-Ahead DSM-Integrated Hybrid-Power-Management-Incorporated CEED of Solar Thermal/Wind/Wave/BESS System Using HFPSO. Sustainability 2022, 14, 1169. [Google Scholar] [CrossRef]
  33. Abdolrasol, M.G.; Hannan, M.; Hussain, S.S.; Ustun, T.S. Optimal PI controller based PSO optimization for PV inverter using SPWM techniques. Energy Reports 2022, 8, 1003–1011. [Google Scholar] [CrossRef]
  34. Ulutas, A.; Altas, I.H.; Onen, A.; Ustun, T.S. Neuro-Fuzzy-Based Model Predictive Energy Management for Grid Connected Microgrids. Electronics 2020, 9, 900. [Google Scholar] [CrossRef]
  35. Abdolrasol, M.G.M.; Hannan, M.A.; Hussain, S.M.S.; Ustun, T.S.; Sarker, M.R.; Ker, P.J. Energy Management Scheduling for Microgrids in the Virtual Power Plant System Using Artificial Neural Networks. Energies 2021, 14, 6507. [Google Scholar] [CrossRef]
  36. Singh, N.K.; Koley, C.; Gope, S.; Dawn, S.; Ustun, T.S. An Economic Risk Analysis in Wind and Pumped Hydro Energy Storage Integrated Power System Using Meta-Heuristic Algorithm. Sustainability 2021, 13, 13542. [Google Scholar]
  37. Singh, S.; Chauhan, P.; Aftab, M.A.; Ali, I.; Hussain, S.M.S.; Ustun, T.S. Cost Optimization of a Stand-Alone Hybrid Energy System with Fuel Cell and PV. Energies 2020, 13, 1295. [Google Scholar] [CrossRef] [Green Version]
  38. Latif, A.; Hussain, S.M.S.; Das, D.C.; Ustun, T.S. Optimization of Two-Stage IPD-(1+I) Controllers for Frequency Regulation of Sustainable Energy Based Hybrid Microgrid Network. Electronics 2021, 10, 919. [Google Scholar] [CrossRef]
  39. Latif, A.; Hussain, S.M.S.; Das, D.C.; Ustun, T.S. Design and Implementation of Maiden Dual-Level Controller for Ameliorating Frequency Control in a Hybrid Microgrid. Energies 2021, 14, 2418. [Google Scholar] [CrossRef]
  40. Dawn, S.; Gope, S.; Das, S.S.; Ustun, T.S. Social Welfare Maximization of Competitive Congested Power Market Considering Wind Farm and Pumped Hydroelectric Storage System. Electronics 2021, 10, 2611. [Google Scholar] [CrossRef]
  41. Geleta, D.K.; Manshahia, M.S.; Vasant, P.; Banik, A. Grey wolf optimizer for optimal sizing of hybrid wind and solar renewable energy system. Comput. Intell. 2022, 38, 1133–1162. [Google Scholar] [CrossRef]
  42. Farooq, Z.; Rahman, A.; Lone, S.A. Load frequency control of multi-source electrical power system integrated with solar-thermal and electric vehicle. Int. Trans. Electr. Energy Syst. 2021, 31, e12918. [Google Scholar] [CrossRef]
  43. Farooq, Z.; Rahman, A.; Lone, S.A. System dynamics and control of EV incorporated deregulated power system using MBO-optimized cascaded ID-PD controller. Int. Trans. Electr. Energy Syst. 2021, 31, e13100. [Google Scholar] [CrossRef]
  44. Safiullah, S.; Rahman, A.; Lone, S.A. Optimal Control of Electrical Vehicle incorporated Hybrid Power System with 2nd Order Fractional-Active Disturbance Rejection Controller. Optim. Control. Appl. Methods 2021. [Google Scholar] [CrossRef]
  45. Farooq, Z.; Rahman, A.; Lone, S.A. Power generation control of restructured hybrid power system with FACTS and energy storage devices using optimal cascaded fractional-order controller. Optim. Control. Appl. Methods 2022. [Google Scholar] [CrossRef]
  46. Safiullah, S.; Rahman, A.; Lone, S.A. State-observer based IDD controller for concurrent frequency-voltage control of a hybrid power system with electric vehicle uncertainties. Int. Trans. Electr. Energy Syst. 2021, 31, e13083. [Google Scholar] [CrossRef]
  47. Safiullah, S.; Rahman, A.; Lone, S.A.; Hussain, S.S.; Ustun, T.S. Robust frequency–voltage stabilization scheme for multi-area power systems incorporated with EVs and renewable generations using AI based modified disturbance rejection controller. Energy Rep. 2022, 8, 12186–12202. [Google Scholar] [CrossRef]
  48. Hussain, I.; Das, D.C.; Sinha, N.; Latif, A.; Hussain, S.M.S.; Ustun, T.S. Performance Assessment of an Islanded Hybrid Power System with Different Storage Combinations Using an FPA-Tuned Two-Degree-of-Freedom (2DOF) Controller. Energies 2022, 13, 5610. [Google Scholar] [CrossRef]
  49. Farooq, Z.; Rahman, A.; Hussain, S.M.S.; Ustun, T.S. Power Generation Control of Renewable Energy Based Hybrid Deregulated Power System. Energies 2022, 15, 517. [Google Scholar] [CrossRef]
  50. Latif, A.; Hussain, S.M.S.; Das, D.C.; Ustun, T.S. Optimum Synthesis of a BOA Optimized Novel Dual-Stage PI (1 + ID) Controller for Frequency Response of a Microgrid. Energies 2020, 13, 3446. [Google Scholar] [CrossRef]
  51. Das, A.; Dawn, S.; Gope, S.; Ustun, T.S. A Strategy for System Risk Mitigation Using FACTS Devices in a Wind Incorporated Competitive Power System. Sustainability 2022, 14, 8069. [Google Scholar] [CrossRef]
  52. Das, S.S.; Das, A.; Dawn, S.; Gope, S.; Ustun, T.S. A Joint Scheduling Strategy for Wind and Solar Photovoltaic Systems to Grasp Imbalance Cost in Competitive Market. Sustainability 2022, 14, 5005. [Google Scholar] [CrossRef]
  53. Multiarea Power System Performance Measurement using Optimized PID Controller. Microprocess. Microsyst. 2021, 104238. [CrossRef]
  54. Nahas, N.; Abouheaf, M.; Sharaf, A.; Gueaieb, W. A Self-Adjusting Adaptive AVR-LFC Scheme for Synchronous Generators. IEEE Trans. Power Syst. 2019, 34, 5073–5075. [Google Scholar] [CrossRef]
  55. Guha, D.; Roy, P.K.; Banerjee, S. Equilibrium optimizer-tuned cascade fractional-order 3DOF-PID controller in load frequency control of power system having renewable energy resource integrated. Int. Trans. Electr. Energy Syst. 2021, 31, e12702. [Google Scholar] [CrossRef]
  56. Sobhanam, A.P.; Mary, P.M.; Mariasiluvairaj, W.I.; Wilson, R.D. Automatic Generation Control Using an Improved Artificial Electric Field in Multi-Area Power System. IETE J. Res. 2021, 1–13. [Google Scholar] [CrossRef]
  57. Sahoo, D.K.; Sahu, R.K.; Panda, S. Fractional Order Fuzzy PID Controller for Automatic Generation Control of Power Systems. ECTI Trans. Electr. Eng. Electron. Commun. 2021, 19, 71. [Google Scholar] [CrossRef]
  58. Han, J.Q. Auto Disturbance Rejection Controller and It’s Applications. Control. Decis. 1998, 13, 19–23. [Google Scholar]
  59. Han, J. From PID to active disturbance rejection control. IEEE Trans. Ind. Electron. 2009, 56, 900–906. [Google Scholar] [CrossRef]
  60. Herbst, G. A Simulative Study on Active Disturbance Rejection Control (ADRC) as a Control Tool for Practitioners. Electronics 2013, 2, 246–279. [Google Scholar] [CrossRef]
  61. Zhou, R.; Tan, W. Analysis and tuning of general linear active disturbance rejection controllers. IEEE Trans. Ind. Electron. 2018, 66, 5497–5507. [Google Scholar] [CrossRef]
  62. Liu, F.; Li, Y.; Cao, Y.; She, J.; Wu, M. A two-layer active disturbance rejection controller design for load frequency control of interconnected power system. IEEE Trans. Power Syst. 2015, 31, 3320–3321. [Google Scholar] [CrossRef]
  63. Hernandez-Vargas, E.A.; Velasco-Hernandez, J.X. In-host mathematical modelling of covid-19 in humans. Annu. Rev. Control. 2020, 50, 448–456. [Google Scholar] [CrossRef]
  64. COVID-19: Keep On Keeping Your Distance. Available online: https://www.healthychildren.org/English/health-issues/conditions/COVID-19/Pages/Social-Distancing-Why-Keeping-Your-Distance-Helps-Keep-Others-Safe.aspx (accessed on 28 August 2022).
  65. Hernandez-Vargas, E.A.; Wilk, E.; Canini, L.; Toapanta, F.R.; Binder, S.C.; Uvarovskii, A.; Ross, T.M.; Guzmán, C.A.; Perelson, A.S.; Meyer-Hermann, M. Effects of aging on influenza virus infection dynamics. J. Virol. 2014, 88, 4123–4131. [Google Scholar] [CrossRef] [Green Version]
  66. Hancioglu, B.; Swigon, D.; Clermont, G. A dynamical model of human immune response to influenza A virus infection. J. Theor. Biol. 2007, 246, 70–86. [Google Scholar] [CrossRef]
  67. Debbarma, S.; Dutta, A. Utilizing Electric Vehicles for LFC in Restructured Power Systems Using Fractional Order Controller. IEEE Trans. Smart Grid 2017, 8, 2554–2564. [Google Scholar] [CrossRef]
  68. Hussain, I.; Das, D.C.; Latif, A.; Sinha, N.; Hussain, S.S.; Ustun, T.S. Active Power Control of Autonomous Hybrid Power System Using Two Degree of Freedom PID Controller. Energy Rep. 2022, 8, 973–981. [Google Scholar] [CrossRef]
  69. Dey, P.P.; Das, D.C.; Latif, A.; Hussain, S.M.S.; Ustun, T.S. ctive Power Management of Virtual Power Plant under Penetration of Central Receiver Solar Thermal-Wind Using Butterfly Optimization Technique. Sustainability 2020, 12, 6979. [Google Scholar] [CrossRef]
  70. Barik, A.K.; Das, D.C.; Latif, A.; Hussain, S.M.S.; Ustun, T.S. Optimal Voltage–Frequency Regu- 645 lation in Distributed Sustainable Energy-Based Hybrid Microgrids with Integrated Resource Planning.Optimal load frequency control of island microgrids via a PID controller in the presence of wind turbine and PV. Energies 2021, 14, 2735. [Google Scholar] [CrossRef]
Figure 1. Schematic showing impact of SD on IR.
Sustainability 14 14287 g001
Figure 2. Schematic showing masks’ impact in limiting disease transmission.
Sustainability 14 14287 g002
Figure 3. Schematic showing T-cells action on infected cell of human body.
Sustainability 14 14287 g003
Figure 4. Flowchart for developed algorithm C-19BOA.
Sustainability 14 14287 g004
Figure 5. Convergence characteristics for proposed C-19BOA versus GA, BBO, PSO, MBO on benchmark functions.
Sustainability 14 14287 g005
Figure 6. Transfer function model representing LFC operation of electrical hybrid power system.
Sustainability 14 14287 g006
Figure 7. TEV simulation model.
Sustainability 14 14287 g007
Figure 8. Extended state observer block diagram for ADRC.
Sustainability 14 14287 g008
Figure 9. Second order ADRC with state observer.
Sustainability 14 14287 g009
Figure 10. Dynamic response and convergence of ISE values comparison for GA, BBO, PSO, AOA, MBO and proposed C-19BOA optimized PID controller.
Sustainability 14 14287 g010
Figure 11. Dynamic response comparison for proposed C-19BOA optimized ADRC and PID controllers.
Sustainability 14 14287 g011
Figure 12. Altered parameters for sensitivity test.
Sustainability 14 14287 g012
Figure 13. Comparison of C-19BOA offline and real-time optimized PID controller responses for solar irradiance variation in area-1.
Sustainability 14 14287 g013
Figure 14. Comparison of C-19BOA offline and real-time optimized PID controller responses for RLP in area-1.
Sustainability 14 14287 g014aSustainability 14 14287 g014b
Figure 15. Comparison of C-19BOA offline and real-time optimized PID controller responses for no. of EVs variation in both areas.
Sustainability 14 14287 g015
Figure 16. Comparison of C-19BOA offline and real-time optimized ADRC controller responses for solar irradiance variation in area-1.
Sustainability 14 14287 g016
Figure 17. Comparison of C-19BOA offline and real-time optimized ADRC controller responses for RLP in area-1.
Sustainability 14 14287 g017aSustainability 14 14287 g017b
Figure 18. Comparison of C-19BOA offline and real-time optimized ADRC controller responses for no. of EVs variation in both areas.
Sustainability 14 14287 g018
Table 1. Description of different elements with their respective values.
ElementDescriptionValue
T i n f e c t i o n Time taken by PZ to infect new individual3 (User-defined)
R 0 Basic virus reproduction rate (no. of newly infected
individuals produced by an infected individual)
2.4 (Mean value for different states
or provinces reported in [63])
WVirus level proliferation0.35 (Reported in [63])
KMaximum carrying capacity of virus replication0.31 (Reported in [63])
cVirus clearance rate2.4 (Reported in [63])
Table 2. Benchmark functions used.
FunctionFormulation
Ackley f ( x ) = 20 × e x p { 0.2 1 n i = 1 n ( x i ) 2 } e x p { 1 n i = 1 n c o s ( 2 π x i ) } + 20 .
Quartic f ( x ) = i = 0 n i x i 4 + r a n d o m ( 0 , 1 ) .
Rastrigin f ( x ) = i = 1 n ( x i 2 10 c o s ( 2 π x i ) + 100 ) .
Rosenbrock f ( x ) = i = 1 d i m 1 [ 100 ( x i + 1 x i 2 ) + ( x i 1 ) 2 ] .
Schwefel 2.21 f ( x ) = x i |
Schwefel 2.22 f ( x ) = i = 0 n | x i | + i = 0 n | x i | .
Sphere f ( x ) = i = 1 n x i 2 .
Schubert f ( x ) = [ i = 1 5 i c o s ( ( i + 1 ) x 1 + i ) ] [ i = 1 5 i c o s ( ( i + 1 ) x 2 + i ) ] .
Table 3. Benchmark functions and their characteristics.
FunctionMultimodal (MM)
or Unimodal (UM)
Separable (S) or
Non-Separable (NS)
Regular (R) or
Irregular (IR)
Dimension
Range
AckleyMMNSR±30
QuarticUMSR±1.28
RastriginMMSR±5.12
RosenbrockUMNSR±2.048
Schwefel 2.21MMNSIR±100
Schwefel 2.22MMNSIR±10
SphereUMSR±5.12
SchubertMMSR±10
Table 4. Result of proposed C-19BOA versus GA, PSO, BBO, AOA, MBO on benchmark functions.
FunctionStudyGA [3]BBO [4]PSO [5]AOA [10]MBO [8]C-19BOA
AckleyMean7.54983.428702.56090.01470.2516
Std5.20271.584301.47020.07270.2663
QuarticMean−0.3417−0.1952−0.3442−0.3441−0.0129−0.3442
Std0.00540.214800.00490.06360
RastriginMean5.110622.12161.15692.17360.13285.1795
Std3.379514.18581.06761.52780.65712.0060
RosenbrockMean0.02750.127500.00140.00240
Std0.10170.150600.00750.01210
Schwefel 2.21Mean0.42670.053900.01070.00170
Std0.10440.055000.01090.00870
Schwefel 2.22Mean0.33110.29360.29260.29270.01170.2926
Std0.02940.001100.000400.05800
SphereMean0.78413.644100.08930.00200
Std0.73934.459900.13500.00990
SchubertMean−242.1090−157.0483−271.2091−222.8429−8.2987−299.63
Std16.228952.4311024.752541.06810
Table 5. Settling time for responses in Figure 10a–c.
TechniqueSettling-Time for
Δ f 1 (s)
Settling-Time for
Δ f 2 (s)
Settling-Time for
Δ P t i e (s)
GA [3]
PSO [5]
MBO [8]
BBO [4]
AOA [10]
Proposed C-19BOA
7.32
14.25
8.12
8.67
15.69
6.62
10.21
18.88
11.65
10.39
12.58
9.75
10.02
18.06
11.73
10.43
10.05
9.69
Table 6. Objective function (ISE) values for PID controller, optimized with proposed C-19BOA and other algorithms.
AlgorithmISE Values
GA [3]0.0003405
PSO [5]0.0004844
MBO [8]0.0004359
BBO [4]0.0004047
AOA [10]0.0003622
Proposed C-19BOA0.0002112
Publisher’s Note: MDPI stays neutral with regard to jurisdictional claims in published maps and institutional affiliations.

