Article

Spatial Distribution of COVID-19 Infected Cases in Kelantan, Malaysia

by
Amal Najihah Muhamad Nor
1,2,*,
Rohazaini Muhammad Jamil
1,
Hasifah Abdul Aziz
1,
Muhamad Azahar Abas
1,
Kamarul Ariffin Hambali
1,
Nor Hizami Hassin
1,
Muhammad Firdaus Abdul Karim
1,3,
Siti Aisyah Nawawi
1,
Aainaa Amir
1,
Nazahatul Anis Amaludin
1,
Norfadhilah Ibrahim
4,
Abdul Hafidz Yusoff
4,5,
Nur Hanisah Abdul Malek
6,
Nur Hairunnisa Rafaai
7,
Siti Khairiyah Mohd Hatta
8,* and
Darren Grafius
2,9
1
Faculty of Earth Science, Universiti Malaysia Kelantan, Jeli Campus, Jeli 17600, Kelantan, Malaysia
2
School of Energy, Environment and Agrifood, Cranfield University, Bedford MK43 0AL, UK
3
UMK-Tropical Rainforest Research Centre (UMK-TRaCe), Faculty of Earth Science, Pulau Banding, Gerik 33300, Perak, Malaysia
4
Faculty of Bioengineering and Technology, Universiti Malaysia Kelantan, Jeli Campus, Jeli 17600, Kelantan, Malaysia
5
Gold Rare Earth and Material Technoprenuership Centre, Faculty of Bioengineering and Technology, Universiti Malaysia Kelantan, Jeli 17600, Kelantan, Malaysia
6
Faculty of Computer and Mathematical Sciences, Universiti Teknologi Mara, Bukit Ilmu, Machang 18500, Kelantan, Malaysia
7
Institute of Environment and Development, Universiti Kebangsaan Malaysia, Bangi 43600, Selangor, Malaysia
8
Faculty of Applied Sciences, Universiti Teknologi MARA, Shah Alam 40450, Selangor, Malaysia
9
Jacobs Engineering UK Ltd., Colmore Square, Birmingham B4 6BN, UK
*
Authors to whom correspondence should be addressed.
Sustainability 2022, 14(21), 14150; https://doi.org/10.3390/su142114150
Submission received: 25 August 2022 / Revised: 18 October 2022 / Accepted: 21 October 2022 / Published: 29 October 2022
(This article belongs to the Collection Impact of COVID-19 on the Environment, Energy and Economics)

Abstract

:
Kota Bharu city in Kelantan, Malaysia was reported with the highest cases of coronavirus disease 2019 (COVID-19) among other districts. Kota Bharu is the capital city of Kelantan, which acts as the administrative, commercial, and financial areas. A large population pool may become a potential carrier for disease transmission to become an epidemic. However, the impact of population density on the COVID-19 outbreak in Malaysia is still unknown and undiscovered. Therefore, this study investigates the impact of population density on COVID-19 as a potential virus transmission carrier using linear regression models. The chances of formulating new strategies for combating COVID-19 are higher when the driver of transmission potential is identified. This study shows that the highest value of infected area density is in Kota Bharu (0.76), while the infected risk area was highest in Jeli (0.33). This study found that there is a strong relationship between COVID-19 infection cases in Kelantan and population density (R2 which is 0.845). Therefore, high population density was identified as a potential driver of transmission of COVID-19 outbreak. Understanding the potential drivers of the disease in a local setting is very important for better preparation and management. The outcome of the study can aid in the development of a new analytical model for strategic planning of Zero COVID-19 for securing the public health and wellness, both social and economic, by researchers, scientists, planners, resource managers, and decision-makers.

1. Introduction

The spreading and outbreak of the transmittable coronavirus disease 2019 (COVID-19) has affected whole countries in the world during a very critical stage. The disease has serious impacts on world health as well as on economy, education, employment, and physical and mental health of human lives [1]. The onset of symptoms of the first identified case in Wuhan city on 8 December 2019 [2] and, as of January 2020, has continued to spread extensively throughout Hubei Province and nationwide with limited transmission chains occurring in neighboring countries (Japan, South Korea, Singapore, and Malaysia), and sporadic importations elsewhere. In China, the coronavirus development showed initially a spatial asynchrony, exhibiting exponential growth during the first days of the outbreak. The unknown and uncontrollable infectious disease spread quickly, reaching its peak around January 25th (117%), followed by rather a polynomial growth pattern: January 30th (42%), February 4th (42.5%), and February 14th (37%). From 22nd February to 27th February 2020, the infected incidents dropped substantially to a growth rate below 1 percent. The COVID-19 growth pattern showed a high degree of temporal and spatial irregularity in its inception because of the spatiotemporal dynamics of the Chinese population. The Chinese New Year celebration accompanied by a three-day holiday substantially increased population mobility within and across Chinese borders changing population density in the infected from virus areas, including Wuhan city. When the Chinese authorities decided to quarantine the infected areas in late January, the number of infected incidents dropped, reaching spread growth lows in late February [3].
In Malaysia, the outbreak of COVID-19 started in January 2020 when it was discovered from China travelers. The outbreak leading to highly local cases of the largest cluster in March 2020. Malaysian health authorities stated cases began to spread to neighboring countries and Malaysia had the greatest number of cases in Southeast Asia on 11 April 2020 with an additional 184 cases of the new coronavirus, increasing the total accumulative to 4530. The latest statistics include three new fatalities, raising total deaths from the outbreak to 73. Enhanced testing showed a relatively low case mortality rate of 1.61% on 11 April 2020 in the Philippines and Indonesia, but continues to be comparatively more severe than in Singapore, Brunei, and Thailand [4].
According to recent research [5], Kelantan had 166 cases of COVID-19 detected locally as of the end of July 2020. The capital of Kota Bharu (56.6%) had the largest population density among the other 10 districts in Kelantan, where most of the cases were located. Eighty percent of the cases in Kelantan were related to the mass gathering at Masjid Seri Petaling (MSP), which occurred from 27 to 29 February 2020. The confluence produced the Seri Petaling cluster, the biggest cluster in Malaysia to date, which affected 3375 cases nationally (38.9% of all cases as of 8 July 2020) between 11 March 2020, and 8 July 2020 [4]. In this study, 54 (32.5%) cases involved gathering attendees, whereas 79 (47.6%) cases involved their close connections, whose transmission could be tracked up to the fifth generation. Furthermore, 10.8% of the additional cases were contracted while travelling to affected nations. By using active case detection, more than 57% of cases were found. Additionally, 50.0% of people were screened based on contact tracing, and 45.2% were based on risk assessment. Household connections made up around 67.4% of confirmed patients’ contacts; the remaining contacts were social. The case fatality rate for COVID-19 in Kelantan is comparable to China (2.3%) but lower than Italy (7.7%), Europe (4.2%), and Asia in general (3.8%) [6]. The incidence of COVID-19 in Kelantan is lower than the United States (316/100,000 in July) [6], and its case fatality rate is comparable to China (2.3%) [7,8].
Various protocols were then developed to facilitate systematic and rapid data collections as well as analyses across the globe to provide a better comprehension of the disease and subsequently guide the implementation of various measures [9]. The modeling research of contagious disease depends on various factors related to the infection of the disease. Several research studies have suggested that transmission of COVID-19 is associated with environmental factors such as wind speed, humidity, and temperature [1]. In the USA and India, the research found that the outbreak depended on population density, with denser regions and metropolitan cities experiencing an early spreading of the disease [1,4]. Ruiz and Koutronas [3] have found that the transmissibility potential of COVID-19 in Asia will be substantially higher compared to other parts of the world. It is plausible to expect that the population heterogeneity has a vital part in the geospatial diffusion of infectious diseases. Transmission of disease requires a minimum unaffected population pool of 250,000 as potential carriers for a disease to become an epidemic [5]. However, epidemiological studies should be cautiously interpreted as not only is the disease very dynamic but its characteristics are heavily influenced by different factors of local population and implementation of public health measures that vary from country to country [10]. Hence, it is important to understand the impact of population density as the potential driver of epidemiological features of COVID-19 at the local level towards a better understanding of the disease, to be prepared for impending outbreaks with specific countermeasures.
The geographical distribution of infectious illnesses has been evaluated using geographic information systems (GIS). The COVID-19 Panel provides updated data that are presented as graphs, tables, and maps. This data map may be used to analyze the COVID-19 outbreak and enhance healthcare. The categorization of risk regions may aid stakeholders in making decisions during the pandemic. The association between various explanatory variables and disease breakout may therefore be determined with the use of statistical tools for spatial analysis.
A risk prediction model may be created using a variety of statistical techniques, including but not limited to logistic regression, linear regression, Cox regression, and machine learning (ML). Linear regression, a linear approach for modelling the relationship between a scalar response and one or more explanatory variables, can be used to measure the probability of a disease, evaluating the disease likelihood, forecast the spread, and predict fatality. This can be done to address the uncertainties in COVID-19 diagnosis. Linear regressions have evolved into a crucial component of any data analysis pertaining to the explanation of relationship between an outcome variable and one or more predictor variables to explore the risk factors connected to COVID-19 [11,12].
However, in Malaysia, especially in the state of Kelantan, the connection between the COVID-19 outbreak and population density is yet unknown and undiscovered. The research questions in this study are is the population density impacting the total COVID-19 cases? and what is the relationship between population density and COVID-19 cases? Therefore, this study focuses on the impact of population density of people in the Kelantan state and its relationship with COVID-19 cases to provide the empirical information of the spatial distribution pattern of transmission potential of COVID-19 in Malaysia especially in Kelantan, Malaysia. Data analysis and the empirical information of outbreaks can assist in the development of effective prevention and intervention approaches.

2. Materials and Methods
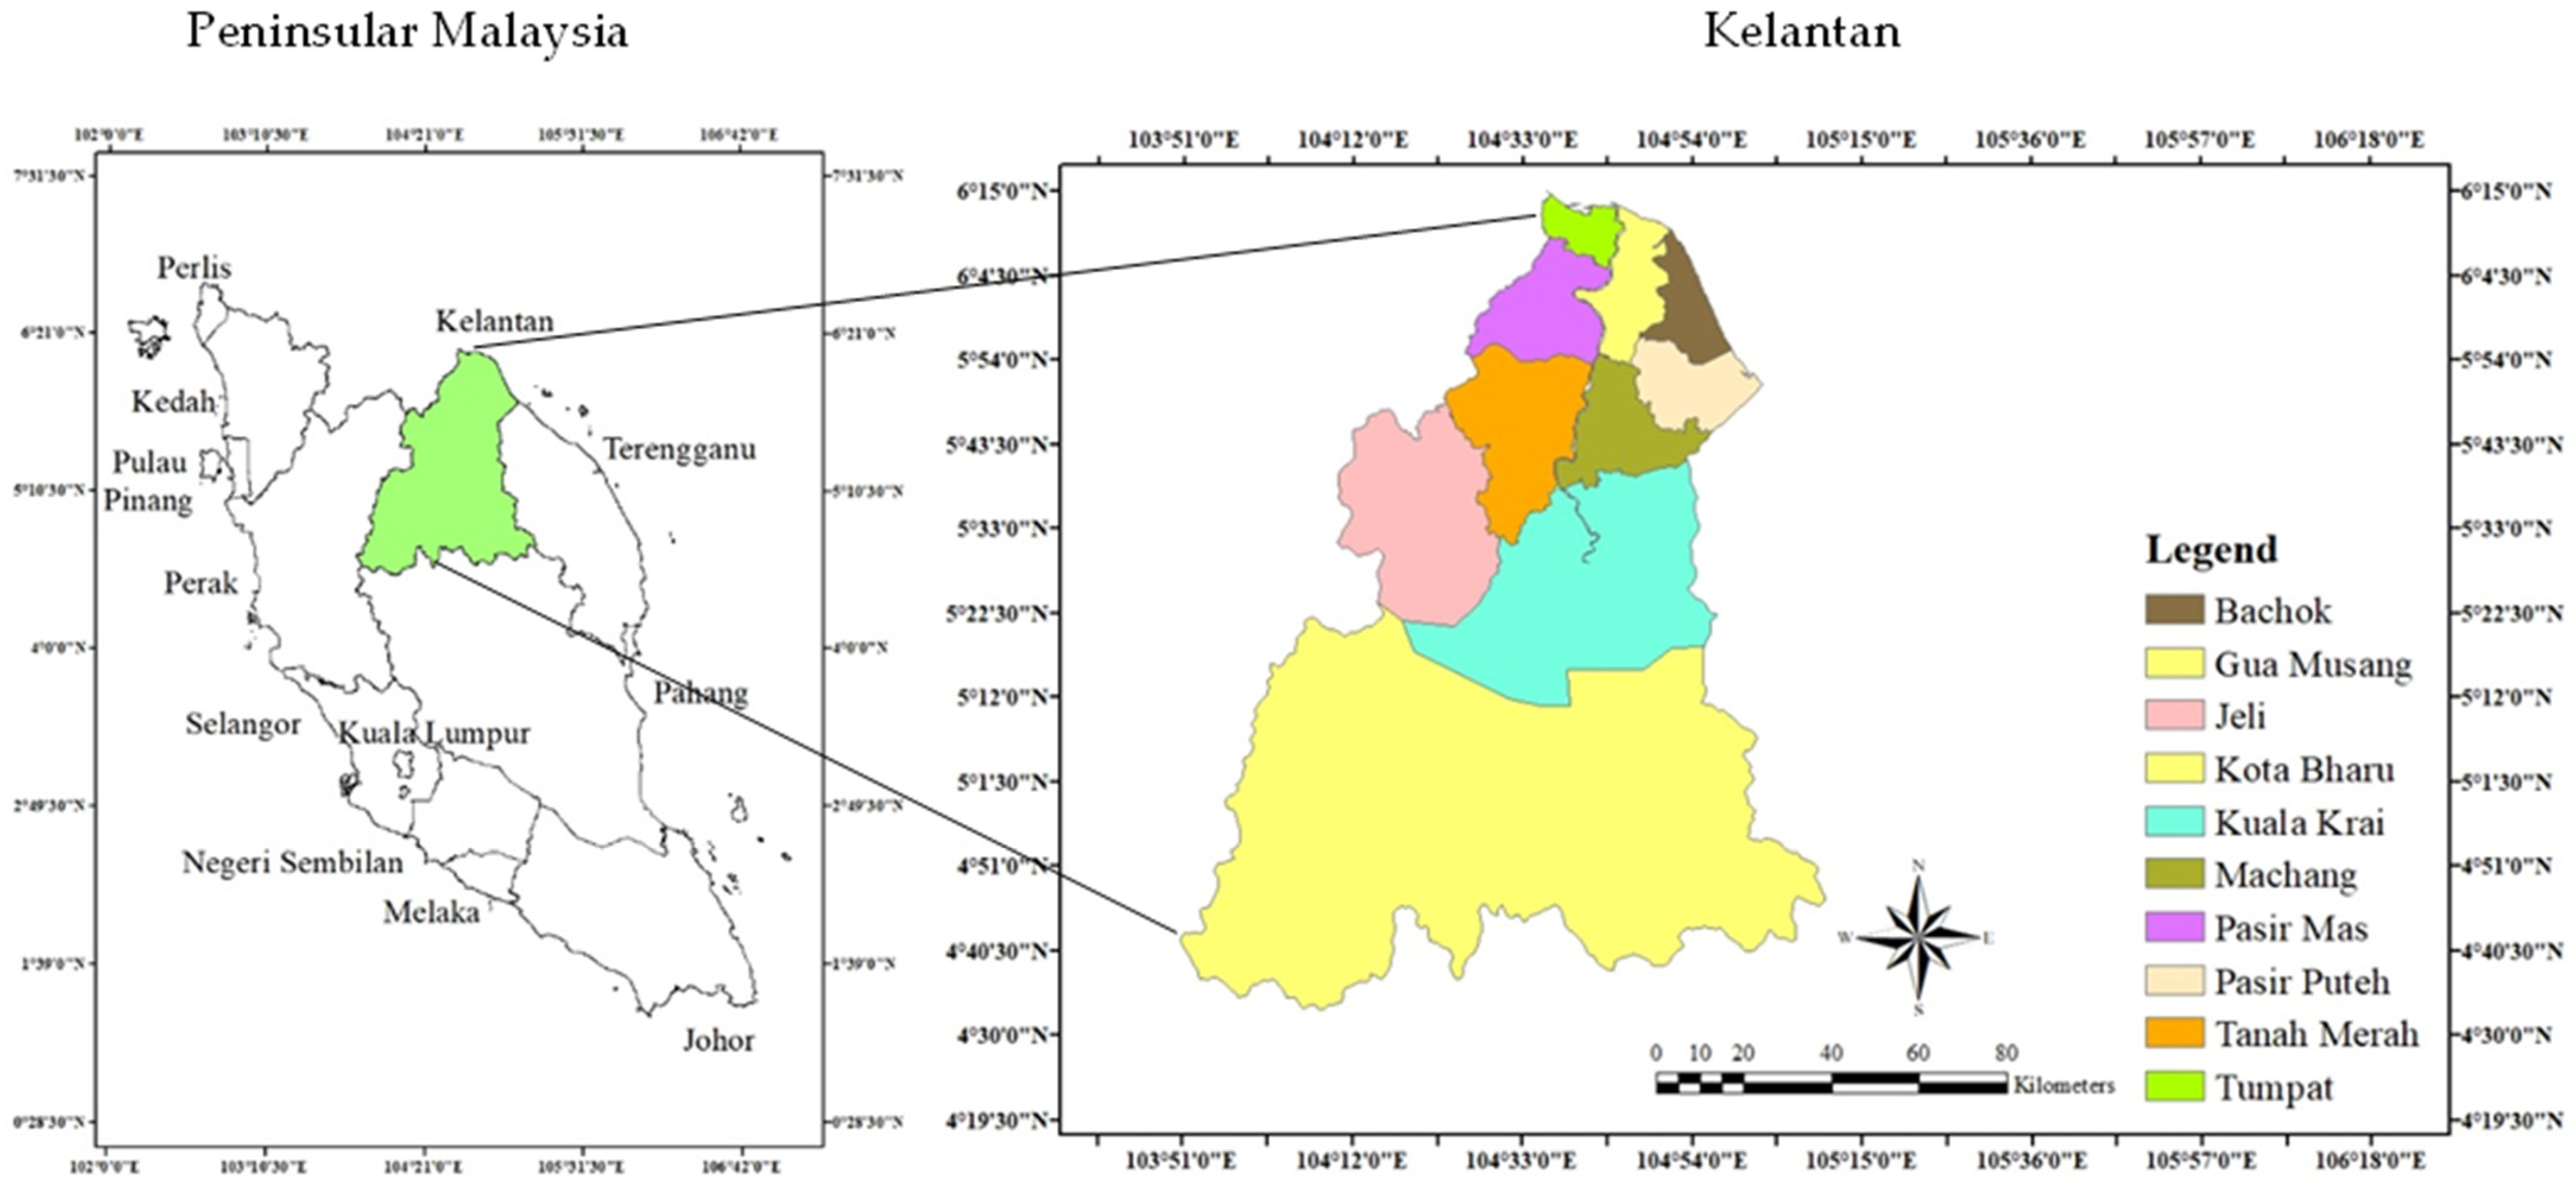
2.1. Study Area

The state of Kelantan was chosen as the case study area. The state is composed of 10 districts with an area of 1.71 million hectares, which is 2.62 percent of the total area of the state is the capital city of Kota Bharu (Figure 1). The coordinates of Kelantan are 6.1254° N, 102.2381° E and the state is surrounded by the South China Sea in the north of Pangkalan Datu River, Pengkalan Chepa river in the east, Pendek River district in the South, and Kelantan River in the west. The total population in Kelantan was 2.001 million in 2018. Kota Bharu is the most developed area compared with nine other districts and has become the main mechanism for the development of Kelantan. In Kota Bharu, the total of population was 509,600 people in the year 2010 and increased by 12% from 2010 with 1.45 million people. According to Faizalhakim et al. [13], major significant changes in climate were detected in Kelantan state, i.e., annual rainfall by 41.13 mm, annual rain days (1.58 days), temperature changes (0.07 °C), global radiation (0.17 MJm−2), atmospheric pressure (0.07 hPa), cloud cover (<0.01 oktas), annual evaporation by −0.50 mm, relative humidity (−0.25%), sunshine hour (−0.04 h), and wind speed (−0.02 m/s year−1).

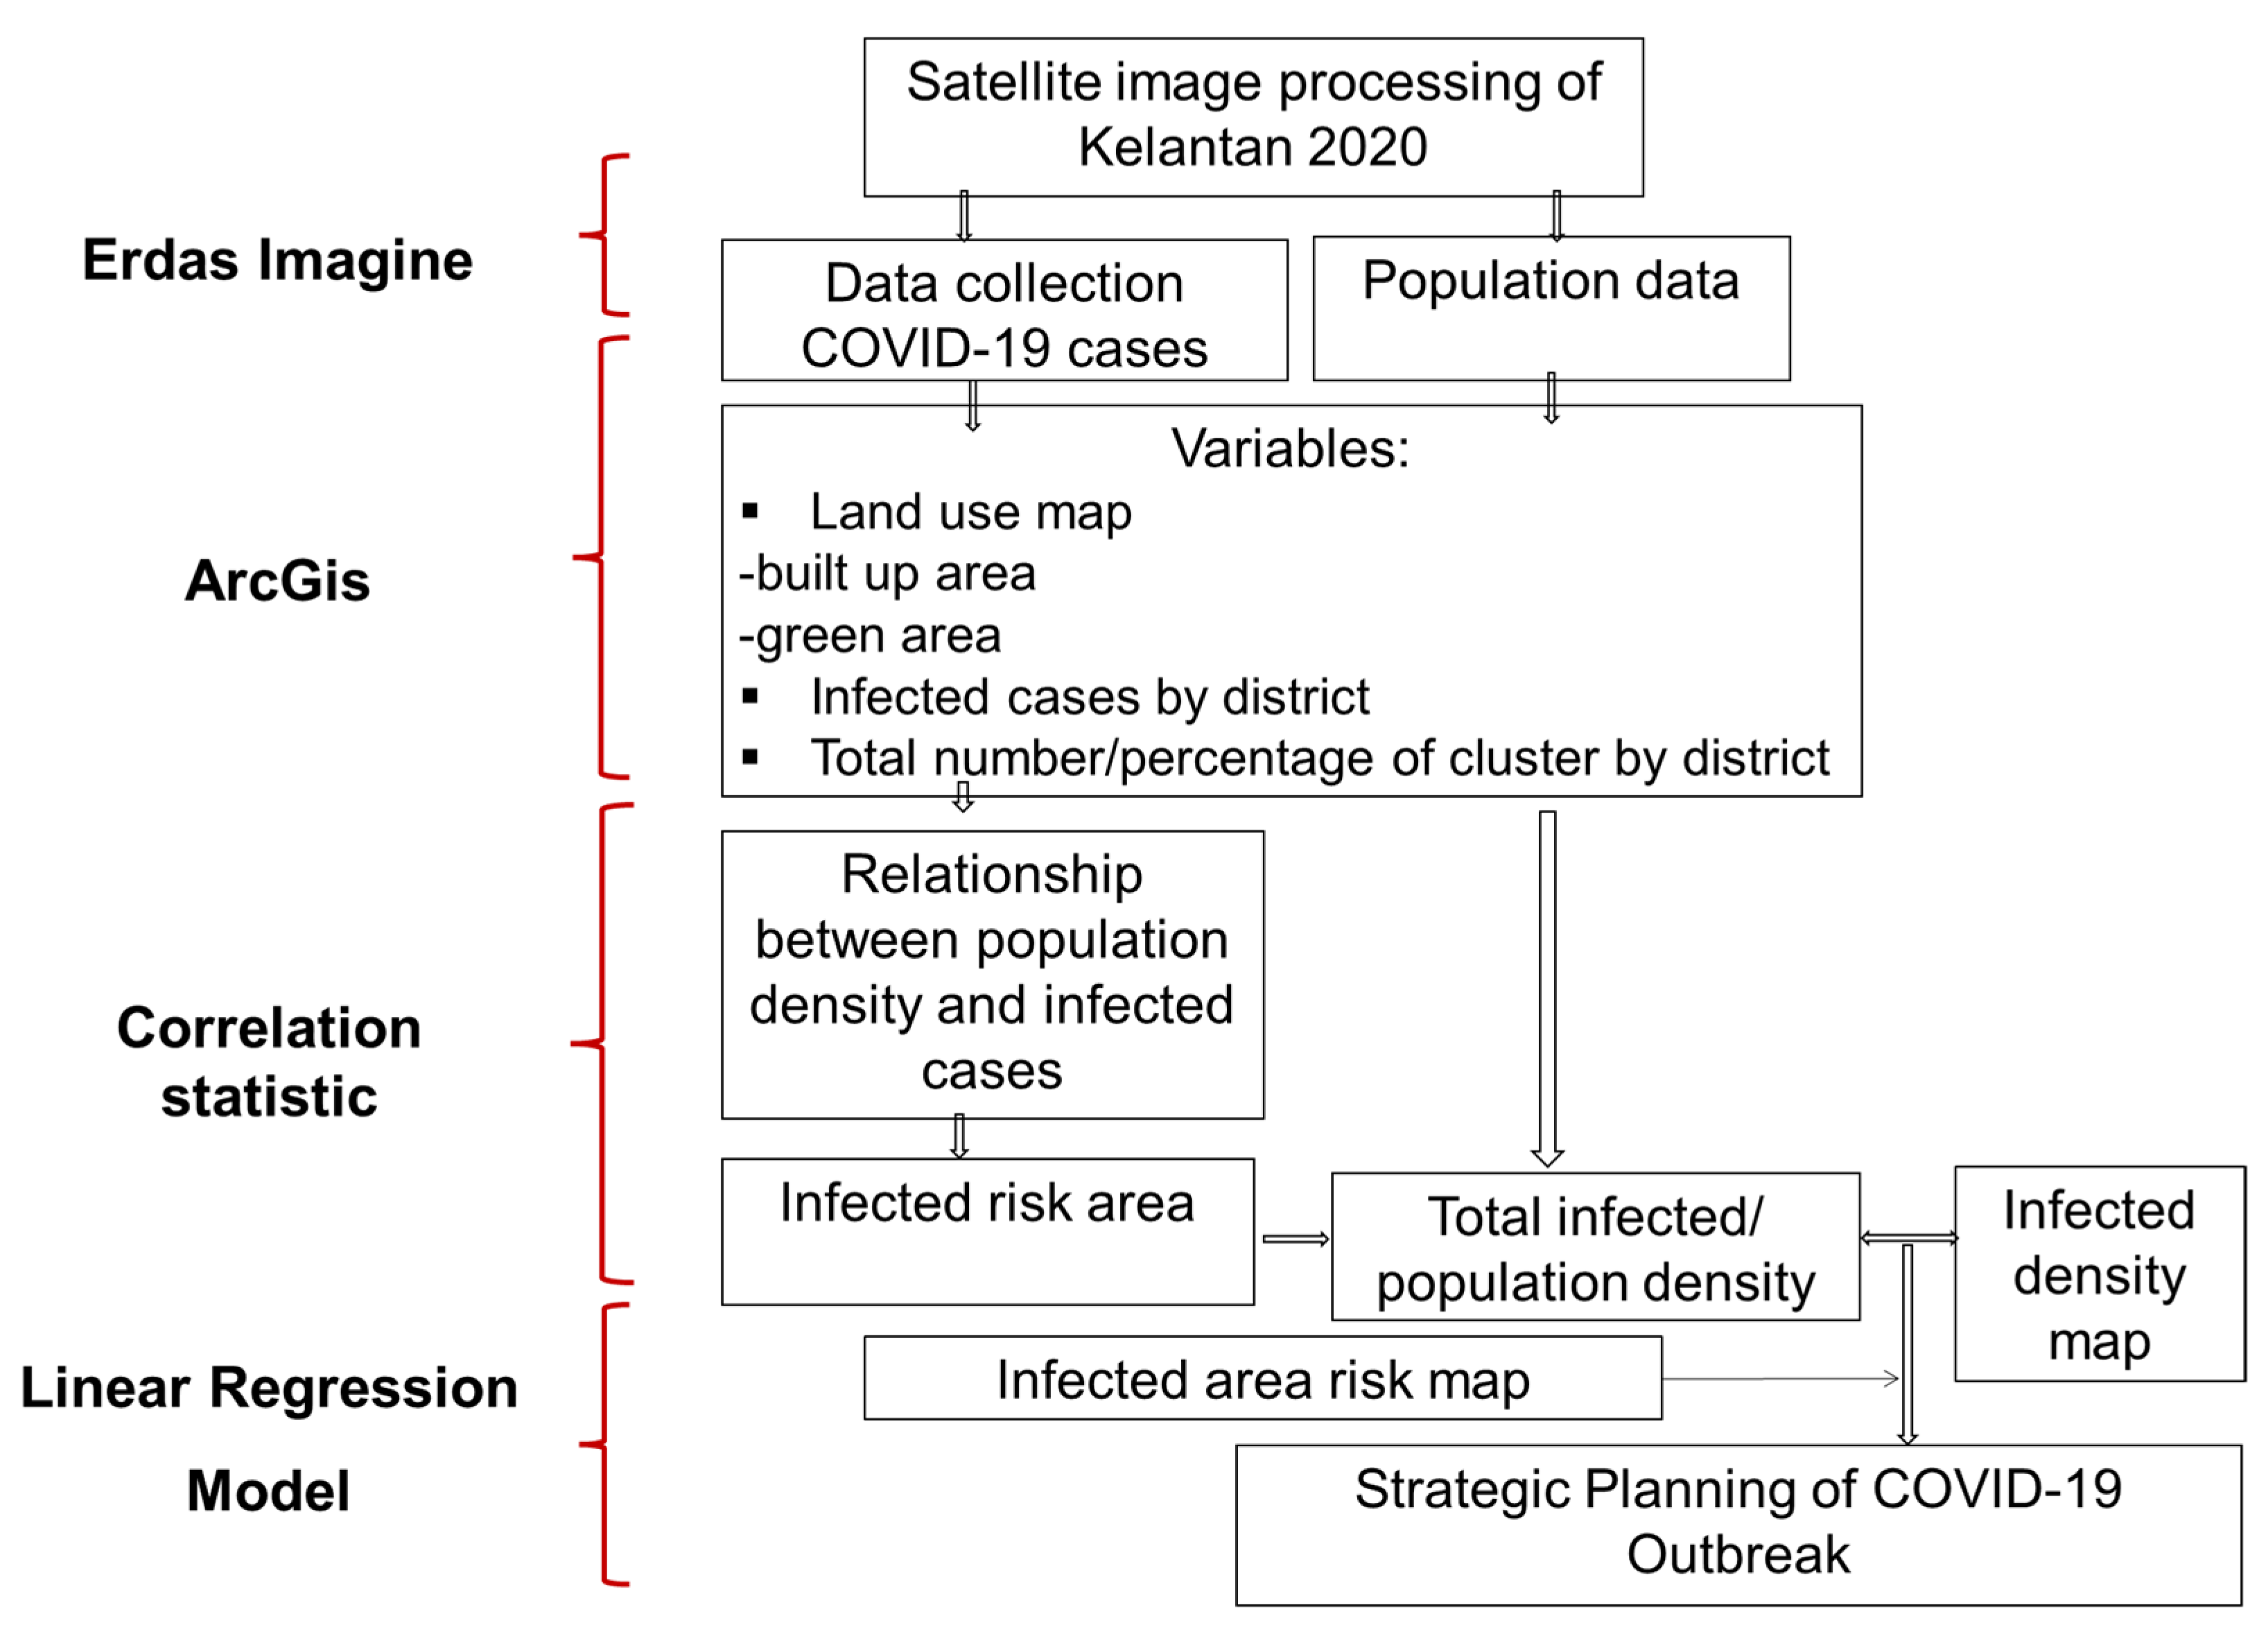
2.2. Methodological Framework

Spatial Analytical Framework for Strategic Planning has been developed using integrated approach of remote sensing, geographical information systems, correlation statistic, and linear regression model. In this study, land use/land cover (LULC) and data collection of COVID-19 cases (tested, positive, death, and discharge) of different types of population and density were modeled using Logistic Regression Model to derive the simulation maps of COVID-19. This study has assessed the evidence of the spatial effects of the landscape patterns by examining the differences between type and density of populations (Figure 2).

2.3. Data Collection

In this study, data collection of COVID-19 cases (positive) of population was modelled using Linear Regression Model to derive the relationship of population density with COVID-19 infected cases in Kelantan. The data of COVID-19 population cases were obtained from the authorities (Malaysian National Security Council and Ministry of Health). The total of infected cases was collected from Hospital Perempuan Zainab II Kota Bharu and Hospital Sultan Ismail Petra, Kuala Krai in March 2020 until December 2020. The population data statistic was derived from the Department of Statistics Malaysia for 10 districts of Kelantan (Kota Bharu, Tumpat, Jeli, Bachok, Tanah Merah, Pasir Putih, Pasir Mas, Kuala Krai and Gua Musang, Machang).

2.4. Image Processing

Satellite images with path/row 127/57 and 127/56 of Landsat 8-OLI with a 30-m resolution for the year 2020 were selected to develop a land use map of the study area. These satellite images were downloaded from www.earthexplorer.com (accessed on 20 April 2020). Firstly, GeoTIFF images of individual bands were converted into the ERDAS raster format. Then, layer stacking was used to combine separate image bands into a single multispectral image file. Two single images were geocoded and mosaicked into a single image. After that, image enhancement and band combination were carried out to obtain a better impression of the remotely sensed data. This process is important because the satellite images do not provide a clear color representation and complete information to be interpreted [14]. False color composite (FCC) was generated from the bands for visual interpretation to identify the heterogeneous patches distinctly pertaining to various land cover classes. This is because FCC is able to generate a suitable combination of bands which enables a clear interpretation to distinguish each type of land use [15,16,17]. The combination of 6-5-4 (Red-Green-Blue) was selected because this combination provides a clear image that is suitable to distinguish each land use type in the study area. Image classification is the process of assigning land cover classes to pixels. In supervised classification, we need to select representative samples for each land cover class. Effective classification of satellite image data depends upon separating land use/land cover types of interest into a set of spectral classes (signature) that represent the data in a form that is suitable to the particular algorithm used [18]. Signature files consisting of means and covariance matrices for each class are created first, before running the classification result. Signatures represent each land use/land cover type that were collected from the images. To generate a set of signature files that accurately represent the classes to be identified, samples were repeatedly selected from the images by drawing a polygon around the training area of interest (AOI). Several topographic and land use maps (scale 1:50,000) obtained from the Department of Survey and Mapping, Malaysia (JUPEM) and the Department of Agriculture, Malaysia were used as the reference in this classification process.
Supervised classification was carried out using the Maximum Likelihood algorithm technique which is based on Bayesian probability theory [19]. This classifier is the most common classification algorithm and is successful as it involves training the information classes [20,21]. This algorithm uses the statistics generated from the spectral training signature to group pixels together into classes [22]. Through this classification process, the land-use map of Kelantan was produced. To evaluate whether the classification is appropriate and reliable, an accuracy assessment was applied by referring to topographical maps, field experience and Google Earth images. The overall accuracy and Kappa coefficient were calculated to explain differences and improvements in the classification of images [23]. The overall accuracy and kappa statistic were more than 85% and 0.8, respectively (Table 1). The results indicate that the levels of accuracy were within the standard range and at an acceptable level [24]. Therefore, land use classification of the study area was reliable and acceptable.

2.5. Data Analysis

2.5.1. Linear Regression Model

Data analysis has been performed using SPSS version 26. The linear regression was conducted to analyze the relationship of population density of each district with COVID-19 cases in Kelantan [25]. Linear regression model was used in this study to determine the relationship between population density and COVID-19 cases. Ordinary Least Squares (OLS) method is a linear regression technique that is used to find the best fitted line for a dataset in which the dependent and independent variables have a linear relationship. The method relies on minimizing the sum of squared error between the actual and predicted values. Since it is simple to train and understand, it is one of the most widely used techniques for estimating an unknown parameter in a linear regression model [26].
Consequently, we formulated the variation of the total infected with population density through the following equation:
y i = a x i + b + ε
where x is the independent variable (population density) and y is the dependent variable (total infected), a is the slope, b is the intercept on the y-axis, and ε is the error with zero mean value.

2.5.2. Spatial COVID-19 Model Map

Infected area density map (total infected/population density) and infected area risk map (Infected density/population) have been developed by using spatial statistics tools and inserted linear regression value in attribute table to produce a spatial COVID-19 integrated model map.
Population density was calculated as the number of inhabitants living in an area per kilometer square (inhabitants/km2) for each district. Population density is the average number of people per unit of land area. In the U.S., the most common unit of population density is persons per square mile. The land area measurement excludes lakes and other water areas within [27].

3. Results and Discussion

Spatial COVID-19 integrated model map has been developed using spatial statistics tools by inserting linear regression value into the attribute table. Figure 3 shows the land use in Kelantan in the year 2020. We define built-up areas as the aerial units recording the full or partial presence of buildings and the space in-between buildings [28,29]. The highest built-up area is in Kota Bharu district where there is the highest population density among the districts. Spatial analysis has shown the spread of COVID-19 in areas with high population density. Infected area density map (total infected/population density) shows the highest value of infected area density in Kota Bharu (0.76) compared to Gua Musang (0) (Figure 4). It is supported by research from Urban and Nakada [30] that shows that the high population density found in informal settlements in the city of São Paulo is a determining factor influencing the spread of COVID-19, possibly because people living in socioeconomic vulnerability may not be able to adhere to social distancing measures. Rader et al. [31] found that population aggregation and heterogeneity have a significant impact on the COVID-19 epidemic’s peaking degree. As a result, epidemics in densely populated areas spread more slowly over time and have higher overall attack rates than those in less densely populated areas. The observed variations in epidemic peaking are consistent with a COVID-19 meta-population model that explicitly takes into consideration geographical hierarchies. The finding is consistent with our result that epidemics may last longer in congested cities throughout the world [32,33].
However, infected area risk map (Infected density/population) was highest in Jeli (0.33) compared to Tumpat district (0.02) (Figure 5). The linear regression value provides the prediction data on the area that could be at risk of spreading COVID-19. Therefore, the map is called an infected area risk map. We show that population density can be an important factor in transmission but only in the absence of mobility-restricting policy measures, although particularly strong policy measures may be required to mitigate the highest population densities [34]. Souch et al. [35] found that, during the pandemic, cases appeared in more rural locations and involved transportation and mobility concerns. A lot of rural places turned into national hubs for prevalence and transmission. COVID-19 was transported along the route of interstates. Quantitative findings showed that COVID-19’s anticipated arrival times varied across rural and urban areas. COVID-19 arrived in counties that are crossed by interstates before counties that are not. The biggest arrival time discrepancy was seen in the most rural counties, which suggests that road traffic is a factor in the spread of disease into rural areas. Road travel enabled human mobility, bringing COVID-19 to more rural areas. Interstate and road traffic limitations would have aided more effective mitigation efforts during the early COVID-19 epidemic stages and decreased transmission. This study supported our finding that the rural area, Jeli district could be at risk of infected cases because of population mobility. These observations can provide insights for how social gatherings and communal events might enable rural communities, while having a lower population density, to become hotspots similar to their urban counterparts. Therefore, rural areas as the infected risk areas require an effective strategy and should also protected from the spread of COVID-19.
This study focused on the linear regression model to study prevention of COVID-19. In this research, we found that the number of COVID-19 cases is highly connected with the population density. Based on the scatter plot of total infected cases against population density (Figure 6), it is found that the total infected cases have a positive relationship with population density. When population density increases, infection cases also increase.
This logistic regression model is part of epidemiological models that can be an effective tool to assist in policy development of animal health, disease control, and prevention. The epidemiological models can vary from simple mathematical models through to complex spatial simulations and decision support systems. The method used will vary depending on the understanding of the epidemiology of a disease, the objective of the study, and the quality and number of data available. Epidemiological models can be categorized into several categories depending on their variability, chance, and uncertainty, time, space (spatial or non-spatial), and the composition and type of the population [36].
Subsequently, this study estimates the correlation coefficients considering the total infected cases as the dependent variable and population density as the independent variable. This study found that the correlation coefficient is 0.919, as shown in Table 2, which indicates a very strong positive correlation between the two variables. For the significance test, the p value is 0.000 which is less than any sensible level of significance; therefore, the null hypothesis (no correlation) is rejected.
Based on table below, the least-square fitting gives a = 0.52 and b = 43.244 (Table 3).
The high value of R2, which is 0.845 for the relationship between total infected cases and population density, implies that most of the total infected cases due to COVID-19 can be explained in terms of population density (Table 4). However, how COVID-19 spreads in a district may depend on various other factors such as prevailing health conditions, the average age of the residents of the districts, health infrastructure, testing numbers, policies adopted by the regulating authorities, economic conditions, geographical features, and others.
Determination of possible connections between population density and the spreading and extent of epidemics have so far proved uncertain. A lack of focus on appropriate density intervals and the fact that the variable of population density must be distributed uniformly are possible sources of uncertainty in this study. The assumption that most of the population is susceptible holds only for new strains of diseases [37]. The finding in this study could be the kickstart for other researchers to focus on areas of towns and cities where most of the population is concentrated with high density of population.
In Kelantan, Malaysia, the spread of COVID-19 cases is affected by population density. Our results are consistent with the impact of population density on COVID-19 cases reported by Bhadra et al. [1]. Population density has been proven to be a determining variable influencing the spread of COVID-19, corroborating data presented by Ganasegera et al., 2021. However, the risk of infected cases map shows that Jeli district (the lowest population density among the district) might have a higher risk of infection by COVID-19, possibly due to connection and interaction with other districts. This study could have important public health implications and, therefore, strategic planning should be undertaken by the decision makers and health care workers in order to decrease the COVID-19 cases and spread of other diseases.
Other factors of different scopes can be further studied to find the difference between various factors and potential drivers that influence the spread of pandemic. Prior to using nontherapeutic interventions in the fight to control the epidemic, it would be desirable to create standard operating procedures that take population density into account as a risk factor for COVID-19 spread and assess them geographically. Thus, this study is essential to improve our understanding of the impact of population density of COVID-19 cases, and develop more focused and effective strategies to combat pandemic diseases. Further studies exploring different factors associated with increase of COVID-19 cases would be beneficial in determining the effective strategic planning for the Zero COVID-19 policy and other similar kinds of disease.

4. Conclusions

In this study, we have used spatial modelling to assess the spread of COVID-19 in 10 districts in the state of Kelantan, Malaysia. This research provides the model of COVID-19 infection cases and population density using linear regression. Linear regression model, using OLS, has proven to represent the correlation of population density and infected cases at the district level. The results found that there is a strong relationship between COVID-19 infected cases in Kelantan and population density. When population density increases, infection cases also increase. More importantly, our study has revealed a significant correlation between COVID-19 cases and population density (R2 = 0.845). Our findings have shown that the high population density found in Kota Bharu is a determining factor influencing the spread of COVID-19, possibly because people living in socioeconomic vulnerability may not be able to adhere to social distancing measures. Our study corroborates reports from recent literature, pointing to the need for special attention in high population density and also low population density areas. Therefore, decision makers and stakeholders can plan the intervention and strategic planning such as lockdown or vaccination programs at the specific location of high population density to combat COVID-19.

Author Contributions

Conceptualization, methodology, software, validation, formal analysis, investigation, resources, and data curation: A.N.M.N., R.M.J., H.A.A., M.A.A., N.H.H., M.F.A.K., S.A.N., A.A., N.A.A., N.I., N.H.A.M., N.H.R., S.K.M.H. and D.G.; writing—original draft preparation, A.N.M.N.; writing—review and editing, K.A.H. and D.G.; visualization and supervision, A.N.M.N. and D.G.; project administration, A.N.M.N. and A.H.Y.; funding acquisition, A.N.M.N. and S.K.M.H. All authors have read and agreed to the published version of the manuscript.

Funding

This research is supported by the Pembiayaan Yuran Penerbitan Artikel (PYPA), Universiti Teknologi MARA, a short-term grant UMK COVID-19 Special Grant UMK-C19SG (R/C19/A0800/00793A/003/2020/00779), UMK Rising Star 2021 (R/STA/A0800/00793A/004/2021/00939), R/STA/A0800/00793A/005/2022/01065, UMK Entrepreneurship Fund (R/GRT/A1300/01684A/008/2021/00969), UMK Grant (R/FUND/A0800/01745A/001/2020/00814), (R/FUND/A0800/00131A/0032020/00811) and (R/COM/A0800/01598A/002/2021/00998).

Institutional Review Board Statement

Not applicable.

Informed Consent Statement

Not applicable.

Data Availability Statement

Not applicable.

Acknowledgments

Special thanks to Universiti Malaysia Kelantan and Universiti Teknologi MARA for providing grants, facilities, and support for this research.

Conflicts of Interest

The authors declare no conflict of interest.

References

  1. Bhadra, A.; Mukherjee, A.; Sarkar, K. Impact of population density on COVID-19 infected and mortality rate in India. Model. Earth Syst. Environ. 2021, 7, 623–629. [Google Scholar] [CrossRef] [PubMed]
  2. WHO. Coronavirus Disease 2019 (COVID-19). 2020. Available online: https://www.who.int/docs/defaultsource/coronaviruse/situationreports/20200226-sitrep-37-covid-19.pdf (accessed on 1 April 2020).
  3. Ruiz, E.M.A.; Koutronas, E. The Networks Infection Contagious Diseases Positioning System (NICDP-System): The Case of Wuhan-COVID-19 SSRN 3548413. 2020. Available online: https://ssrn.com/abstract=3548413 (accessed on 5 April 2020).
  4. Ministry of Health. 2020. Available online: http://www.moh.gov.my/index.php (accessed on 10 April 2020).
  5. Hatta, H.M.; Fuzi, N.M.H.M.; Zin, N.D.M.; Rahim, A.I.A.; Zakria, N.M.; Sulaiman, S.; Muhammad, A.H.; Hussin, Z. An Epidemiological Analysis of COVID-19 cases from Jan to July 2020 in Kelantan, Malaysia. Ulum Islamiyyah. 2021, 33, 149–165. [Google Scholar] [CrossRef]
  6. Boehmer, T.K.; DeVies, J.; Caruso, E.; van Santen, K.L.; Tang, S.; Black, C.L.; Hartnett, K.P.; Kite-Powell, A.; Dietz, S.; Lozier, M.; et al. Changing age distribution of the COVID-19 pandemic—United States, May–August 2020. Morb. Mortal. Wkly. Rep. 2020, 69, 1404. [Google Scholar] [CrossRef] [PubMed]
  7. Wu, Z.; McGoogan, J.M. Characteristics of and important lessons from the coronavirus disease 2019 (COVID-19) outbreak in China: Summary of a report of 72 314 cases from the Chinese Center for Disease Control and Prevention. JAMA 2020, 323, 1239–1242. [Google Scholar] [CrossRef] [PubMed]
  8. Bhagavathula, A.S.; Aldhaleei, W.A.; Rahmani, J.; Mahabadi, M.A.; Bandari, D.K. Novel coronavirus (COVID-19) knowledge and perceptions: A survey of healthcare workers. MedRxiv 2020, 6, e19160. [Google Scholar]
  9. WHO. Coronavirus Disease (COVID-19) Pandemic. 2020. Available online: https://www.who.int/emergencies/diseases/novel-coronavirus-2019 (accessed on 10 September 2022).
  10. Lai, C.C.; Shih, T.P.; Ko, W.C.; Tang, H.J.; Hsueh, P.R. Severe acute respiratory syndrome coronavirus 2 (SARS-CoV-2) and coronavirus disease-2019 (COVID-19): The epidemic and the challenges. Int. J. Antimicrob. Agents 2020, 55, 105924. [Google Scholar] [CrossRef] [PubMed]
  11. Almeshal, A.M.; Almazrouee, A.I.; Alenizi, M.R.; Alhajeri, S.N. Forecasting the spread of COVID-19 in Kuwait using compartmental and logistic regression models. Appl. Sci. 2020, 10, 3402. [Google Scholar] [CrossRef]
  12. Nopour, R.; Shanbehzadeh, M.; Kazemi-Arpanahi, H. Using logistic regression to develop a diagnostic model for COVID-19: A single-center study. J. Educ. Health Promot. 2022, 11, 153. [Google Scholar]
  13. Faizalhakim, A.S.; Nurhidayu, S.; Norizah, K.; Shamsuddin, I.; Hakeem, K.R.; Ismail, A. Climate variability in relation with land use changes over a 30-year period in Kelantan River Basin. Malays. For. 2017, 80, 12–30. [Google Scholar]
  14. Chapa, F.; Hariharan, S.; Hack, J. A new approach to high-resolution urban land use classification using open access software and true color satellite images. Sustainability 2019, 11, 5266. [Google Scholar] [CrossRef] [Green Version]
  15. Jensen, J.R. Introductory Digital Image Processing: A Remote Sensing Perspective, 2nd ed.; Prentice-Hall Inc.: Hoboken, NJ, USA, 1996. [Google Scholar]
  16. Kariyawasam, C.S.; Kumar, L.; Kogo, B.K.; Ratnayake, S.S. Long-term changes of aquatic invasive plants and implications for future distribution: A case study using a tank cascade system in Sri Lanka. Climate 2021, 9, 31. [Google Scholar] [CrossRef]
  17. Yang, D.; Meng, R.; Morrison, B.D.; McMahon, A.; Hantson, W.; Hayes, D.J.; Serbin, S. A multi-sensor unoccupied aerial system improves characterization of vegetation composition and canopy properties in the Arctic tundra. Remote Sens. 2020, 12, 2638. [Google Scholar] [CrossRef]
  18. Manandhar, R.; Odeh, I.O.; Ancev, T. Improving the accuracy of land use and land cover classification of Landsat data using post-classification enhancement. Remote Sens. 2009, 1, 330–344. [Google Scholar] [CrossRef]
  19. Pouncey, R.; Swanson, K.; Hart, K. ERDAS Field Guide; ERDAS Inc.: Reston, CA, USA, 1999. [Google Scholar]
  20. Rawat, J.S.; Biswas, V.; Kumar, M. Changes in land use/cover using geospatial techniques: A case study of Ramnagar town area, district Nainital, Uttarakhand, India. Egypt. J. Remote Sens. Space Sci. 2013, 16, 111–117. [Google Scholar] [CrossRef] [Green Version]
  21. Li, C.; Wang, J.; Wang, L.; Hu, L.; Gong, P. Comparison of classification algorithms and training sample sizes in urban land classification with Landsat thematic mapper imagery. Remote Sens. 2014, 6, 964–983. [Google Scholar] [CrossRef] [Green Version]
  22. Bachri, I.; Hakdaoui, M.; Raji, M.; Teodoro, A.C.; Benbouziane, A. Machine learning algorithms for automatic lithological mapping using remote sensing data: A case study from Souk Arbaa Sahel, Sidi Ifni Inlier, Western Anti-Atlas, Morocco. ISPRS Int. J. Geo-Inf. 2019, 8, 248. [Google Scholar] [CrossRef] [Green Version]
  23. Rozenstein, O.; Karnieli, A. Comparison of methods for land-use classification incorporating remote sensing and GIS inputs. Appl. Geogr. 2011, 31, 533–544. [Google Scholar] [CrossRef]
  24. Jensen, K.; McDonald, K.; Podest, E.; Rodriguez-Alvarez, N.; Horna, V.; Steiner, N. Assessing L-band GNSS-reflectometry and imaging radar for detecting sub-canopy inundation dynamics in a tropical wetlands complex. Remote Sens. 2018, 10, 1431. [Google Scholar] [CrossRef] [Green Version]
  25. Griffith, D.A.; Wong, D.W. Modeling population density across major US cities: A polycentric spatial regression approach. J. Geogr. Syst. 2007, 9, 53–75. [Google Scholar] [CrossRef]
  26. Dismuke, C.; Lindrooth, R. Ordinary least squares. Methods Des. Outcomes Res. 2006, 93, 93–104. [Google Scholar]
  27. Ganasegeran, K.; Jamil, M.F.A.; Ch’ng, A.S.H.; Looi, I.; Peariasamy, K.M. Influence of population density for COVID-19 spread in Malaysia: An ecological study. Int. J. Environ. Res. Public Health 2021, 18, 9866. [Google Scholar] [CrossRef]
  28. Tenerelli, P.; Ehrlich, D. Analysis of built-up spatial pattern at different scales: Can scattering affect map accuracy? Int. J. Digit. Earth 2011, 4, 107–116. [Google Scholar] [CrossRef]
  29. Sabo, F.; Corbane, C.; Florczyk, A.J.; Ferri, S.; Pesaresi, M.; Kemper, T. Comparison of built-up area maps produced within the global human settlement framework. Trans. GIS 2018, 22, 1406–1436. [Google Scholar] [CrossRef]
  30. Urban, R.C.; Nakada, L.Y.K. GIS-based spatial modelling of COVID-19 death incidence in São Paulo, Brazil. Environ. Urban. 2021, 33, 229–238. [Google Scholar] [CrossRef]
  31. Rader, B.; Scarpino, S.V.; Nande, A.; Hill, A.L.; Adlam, B.; Reiner, R.C.; Pigott, D.M.; Gutierrez, B.; Zarebski, A.E.; Shrestha, M.; et al. Crowding and the shape of COVID-19 epidemics. Nat. Med. 2020, 26, 1829–1834. [Google Scholar] [CrossRef]
  32. Rader, B.; Nande, A.; Adlam, B.; Hill, A.L.; Reiner, R.C.; Pigott, D.M.; Bernardo, G. Crowding and the epidemic intensity of COVID-19 transmission. MedRxiv 2020, 26, 1829–1834. [Google Scholar]
  33. Şahin, M. Impact of weather on COVID-19 pandemic in Turkey. Sci. Total Environ. 2020, 728, 138810. [Google Scholar] [CrossRef]
  34. Smith, T.P.; Flaxman, S.; Gallinat, A.S.; Kinosian, S.P.; Stemkovski, M.; Unwin, H.J.T.; Watson, O.J.; Whittaker, C.; Cattarino, L.; Dorigatti, I.; et al. Temperature and population density influence SARS-CoV-2 transmission in the absence of nonpharmaceutical interventions. Proc. Natl. Acad. Sci. USA 2021, 118, e2019284118. [Google Scholar] [CrossRef]
  35. Souch, J.M.; Cossman, J.S.; Hayward, M.D. Interstates of Infection: Preliminary Investigations of Human Mobility Patterns in the COVID-19 Pandemic. J. Rural. Health 2021, 37, 266–271. [Google Scholar] [CrossRef]
  36. Garner, M.G.; Hamilton, S.A. Principles of epidemiological modelling. Rev. Sci. Tech.-OIE 2011, 30, 407. [Google Scholar] [CrossRef]
  37. Ruiqi, L.; Richmond, P.; Roehner, B.M. Effect of population density on epidemics. Phys. A Stat. Mech. Appl. 2018, 510, 713–724. [Google Scholar]
Figure 1. The map of Kota Bharu, Kelantan.
Sustainability 14 14150 g001
Figure 2. Spatial Analytical Framework.
Sustainability 14 14150 g002
Figure 3. Land use/land cover in Kelantan year 2020.
Sustainability 14 14150 g003
Figure 4. Infected area density map (total infected/population density).
Sustainability 14 14150 g004
Figure 5. Infected area risk map (infected density/population).
Sustainability 14 14150 g005
Figure 6. Relationship of population density and COVID-19 cases.
Sustainability 14 14150 g006
Table 1. The overall accuracy and Kappa coefficient of land use types.
NameTotalsTotalsCorrectAccuracyAccuracy
ClassReferenceClassifiedNumberProducersUsers
Built-up area24231979.17%82.61%
Cloud93333.33%100.00%
Commercial agriculture49504591.84%90.00%
Forest1001189898.00%83.05%
Others agriculture32332887.50%84.85%
Paddy16141487.50%100.00%
Swamp forest159960.00%100.00%
Waterbody116654.55%100.00%
Total256256222
Overall Classification Accuracy = 86.72%
Table 2. Pearson correlation between population density and total infected COVID-19.
Correlations
Population_DensityTotal_Infected
Population_DensityPearson Correlation10.919 **
Sig. (2-tailed) 0.000
N1010
Total_InfectedPearson Correlation0.919 **1
Sig. (2-tailed)0.000
N1010
**. Correlation is significant at the 0.01 level (two-tailed).
Table 3. Significant value of relationship between population density and total infected COVID-19.
Coefficients a
ModelUnstandardized CoefficientsStandardized CoefficientstSig.
BStd. ErrorBeta
1(Constant)−43.24419.003 −2.2760.052
Population_Density0.5200.0790.9196.6100.000
a Dependent Variable: Total_Infected.
Table 4. R2 value of relationship between population density and total infected COVID-19.
Model Summary
ModelRR SquareAdjusted R SquareStd. Error of the Estimate
10.919 a0.8450.82636.40054
a Predictors: (Constant), Population Density.
Publisher’s Note: MDPI stays neutral with regard to jurisdictional claims in published maps and institutional affiliations.

