
Data-Driven Low-Carbon Control Method of Machining Process—Taking Axle as an Example

Abstract
:1. Introduction
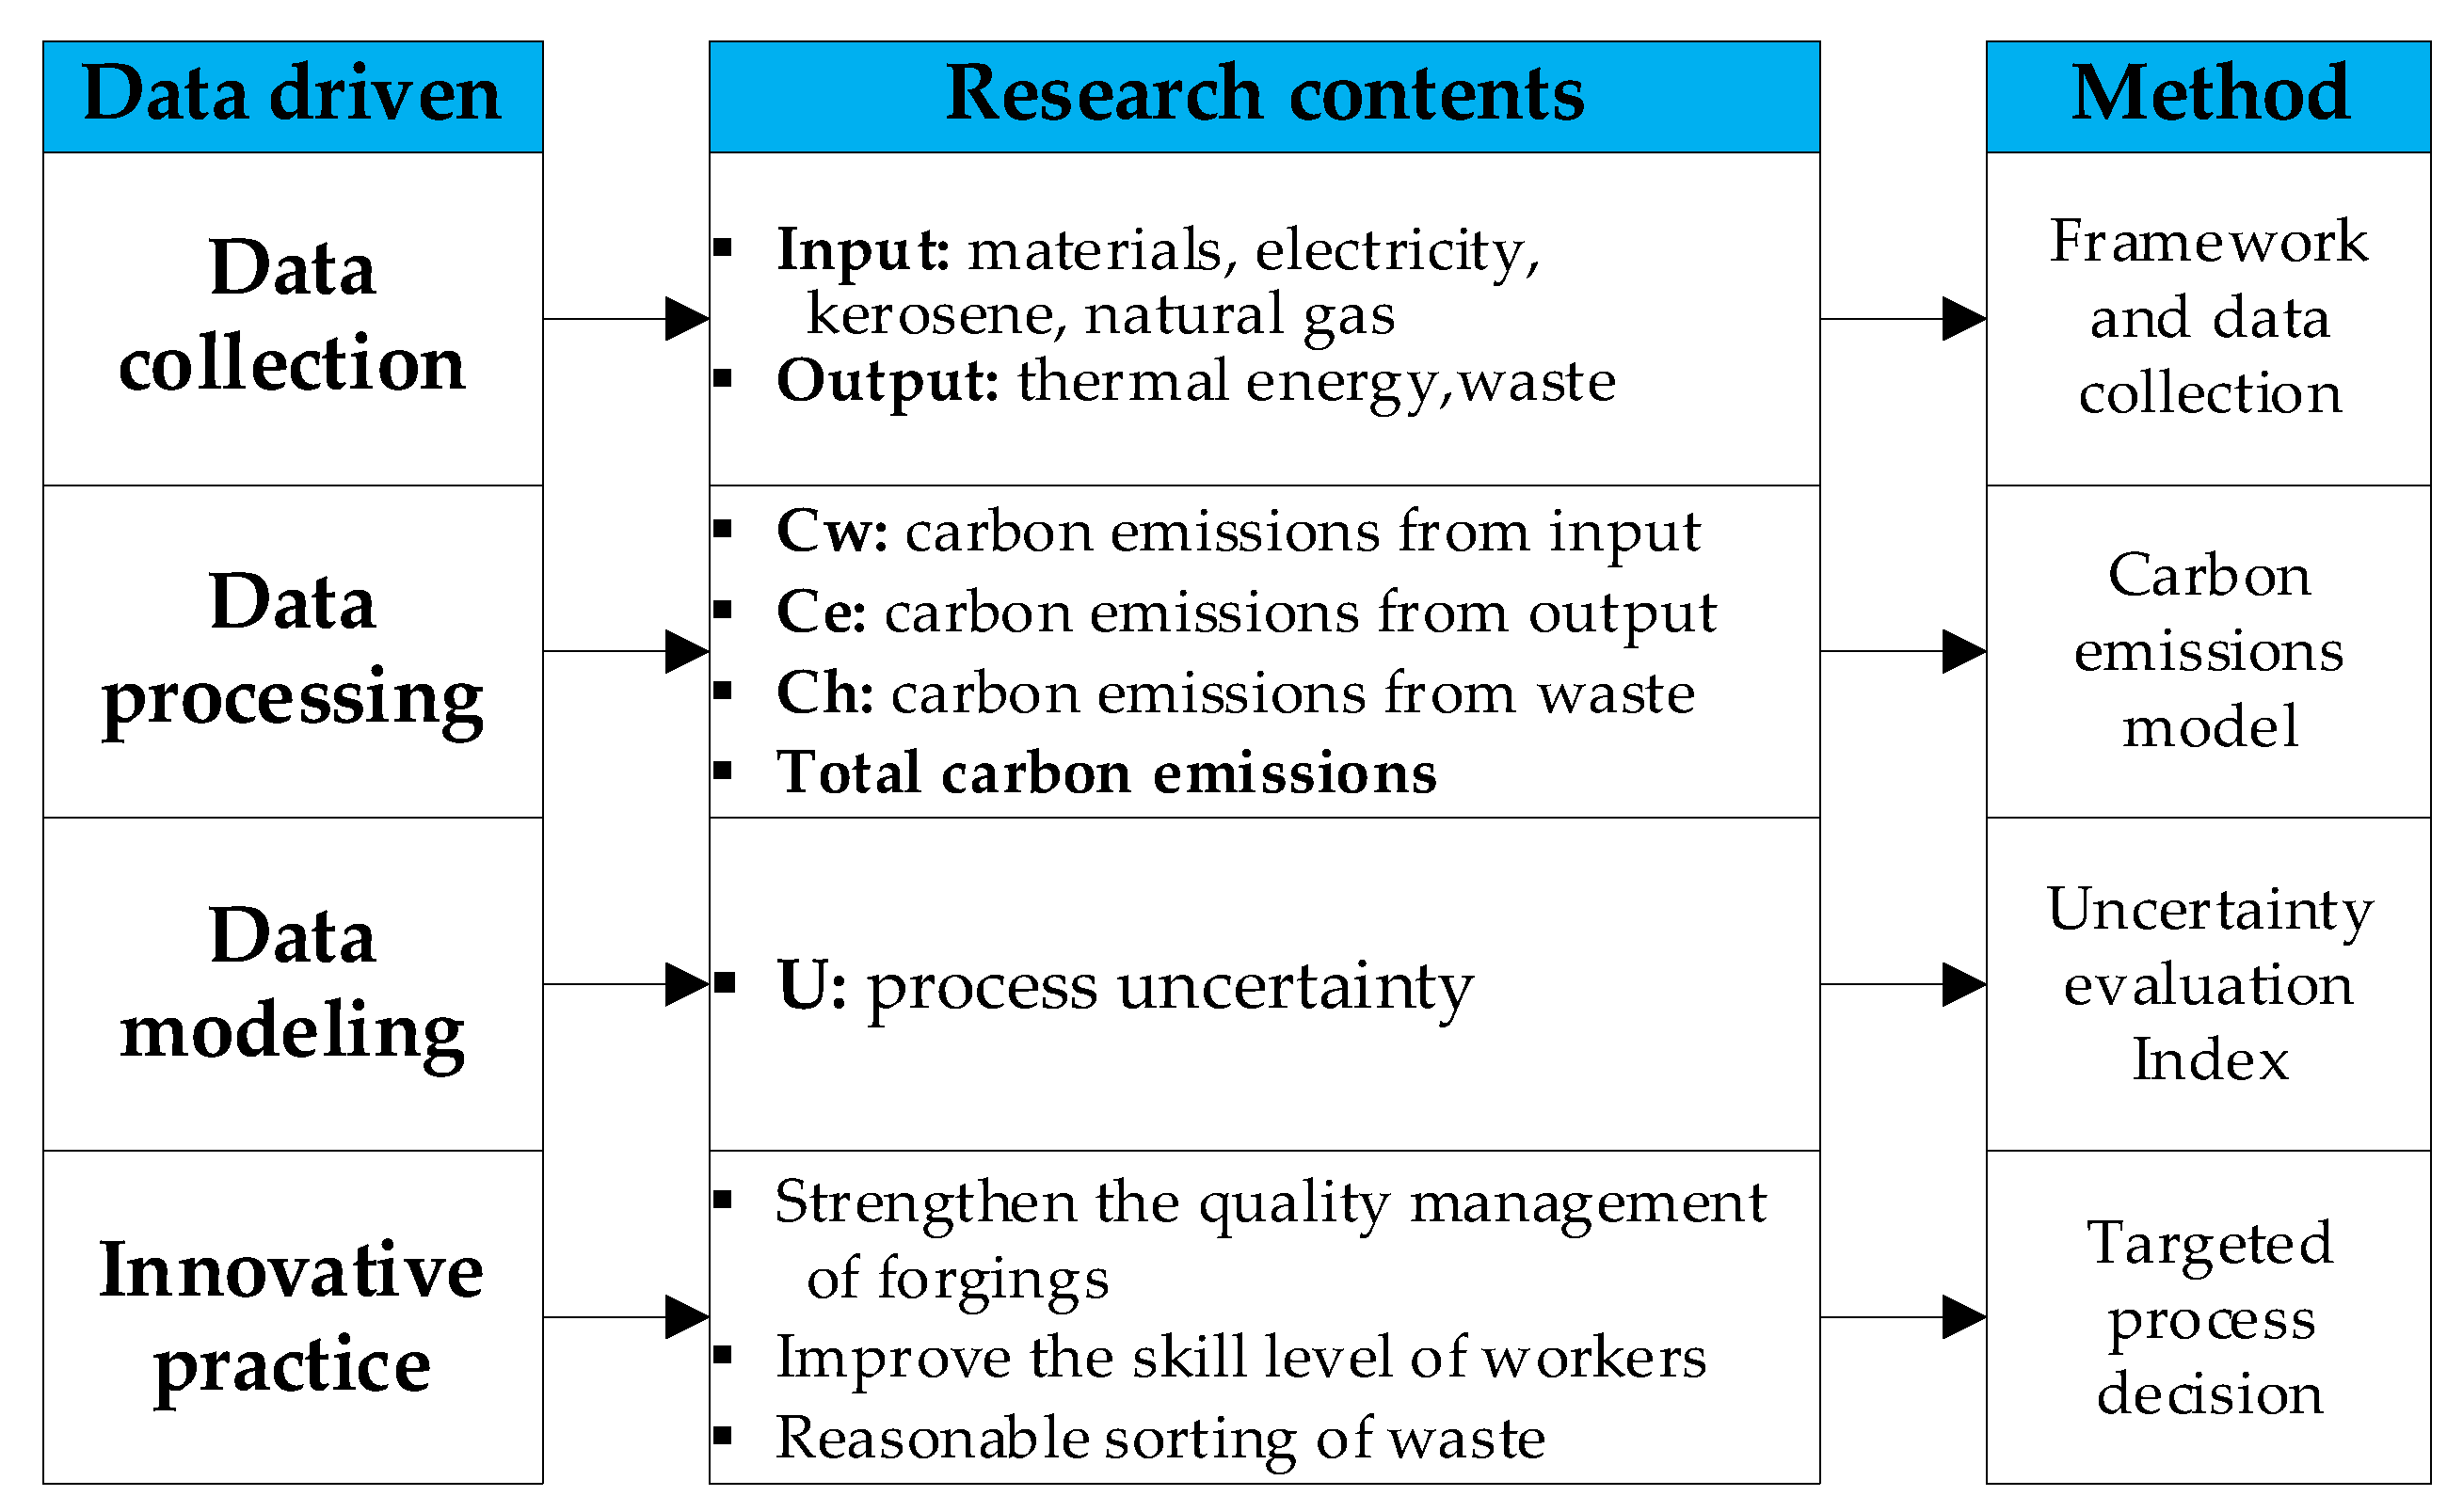
2. Method
2.1. Framework
2.2. Data Collection
2.3. Carbon Emission Model
- (1)
- Calculation of carbon emissions from material
- (2)
- Calculation of carbon emissions from energy
- (3)
- Calculation of carbon emission calculation from waste
2.4. Evaluation Index of Carbon Emission Uncertainty
- (1)
- Calculation of the sample mean
- (2)
- Calculation of the sample standard deviation
- (3)
- Calculation of the step uncertainty range
- (4)
- Calculation of the uncertainty range of the process
2.5. Decision on Low-Carbon Optimization Path for Manufacturing
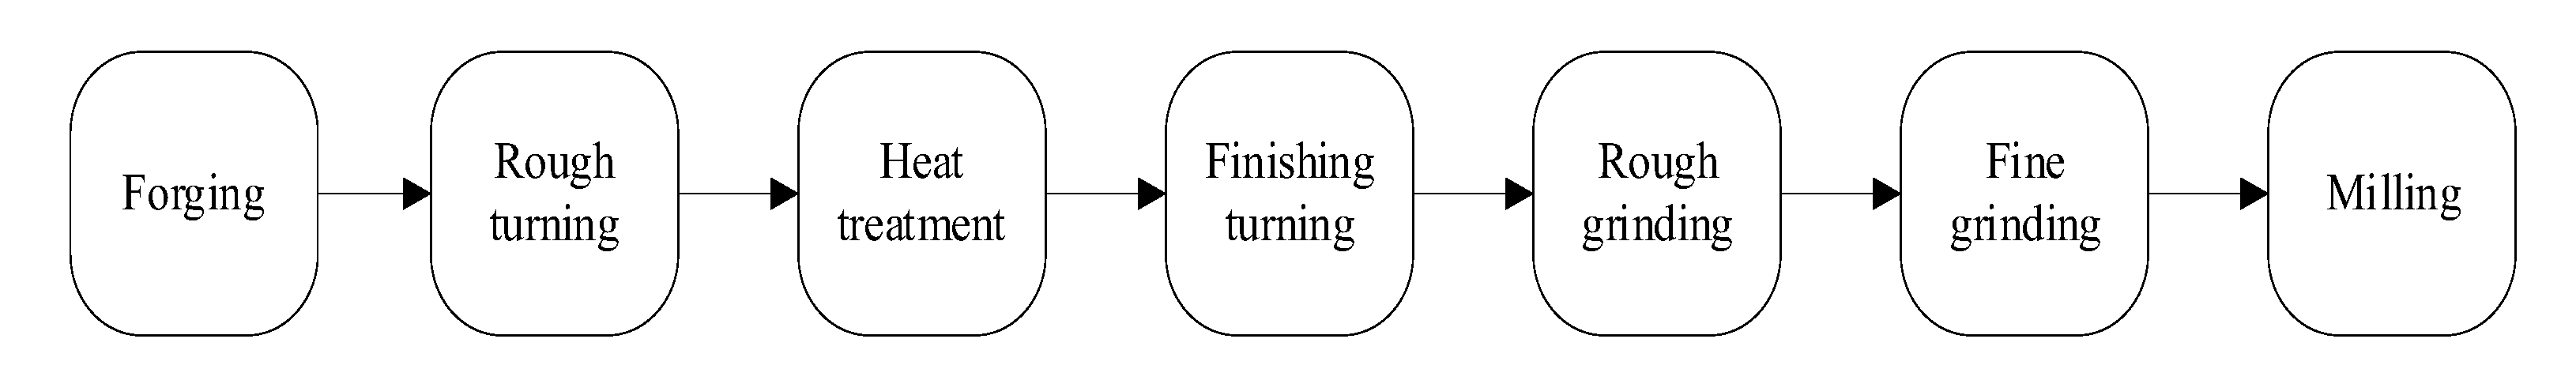
3. Case Study
3.1. Axle Machining System
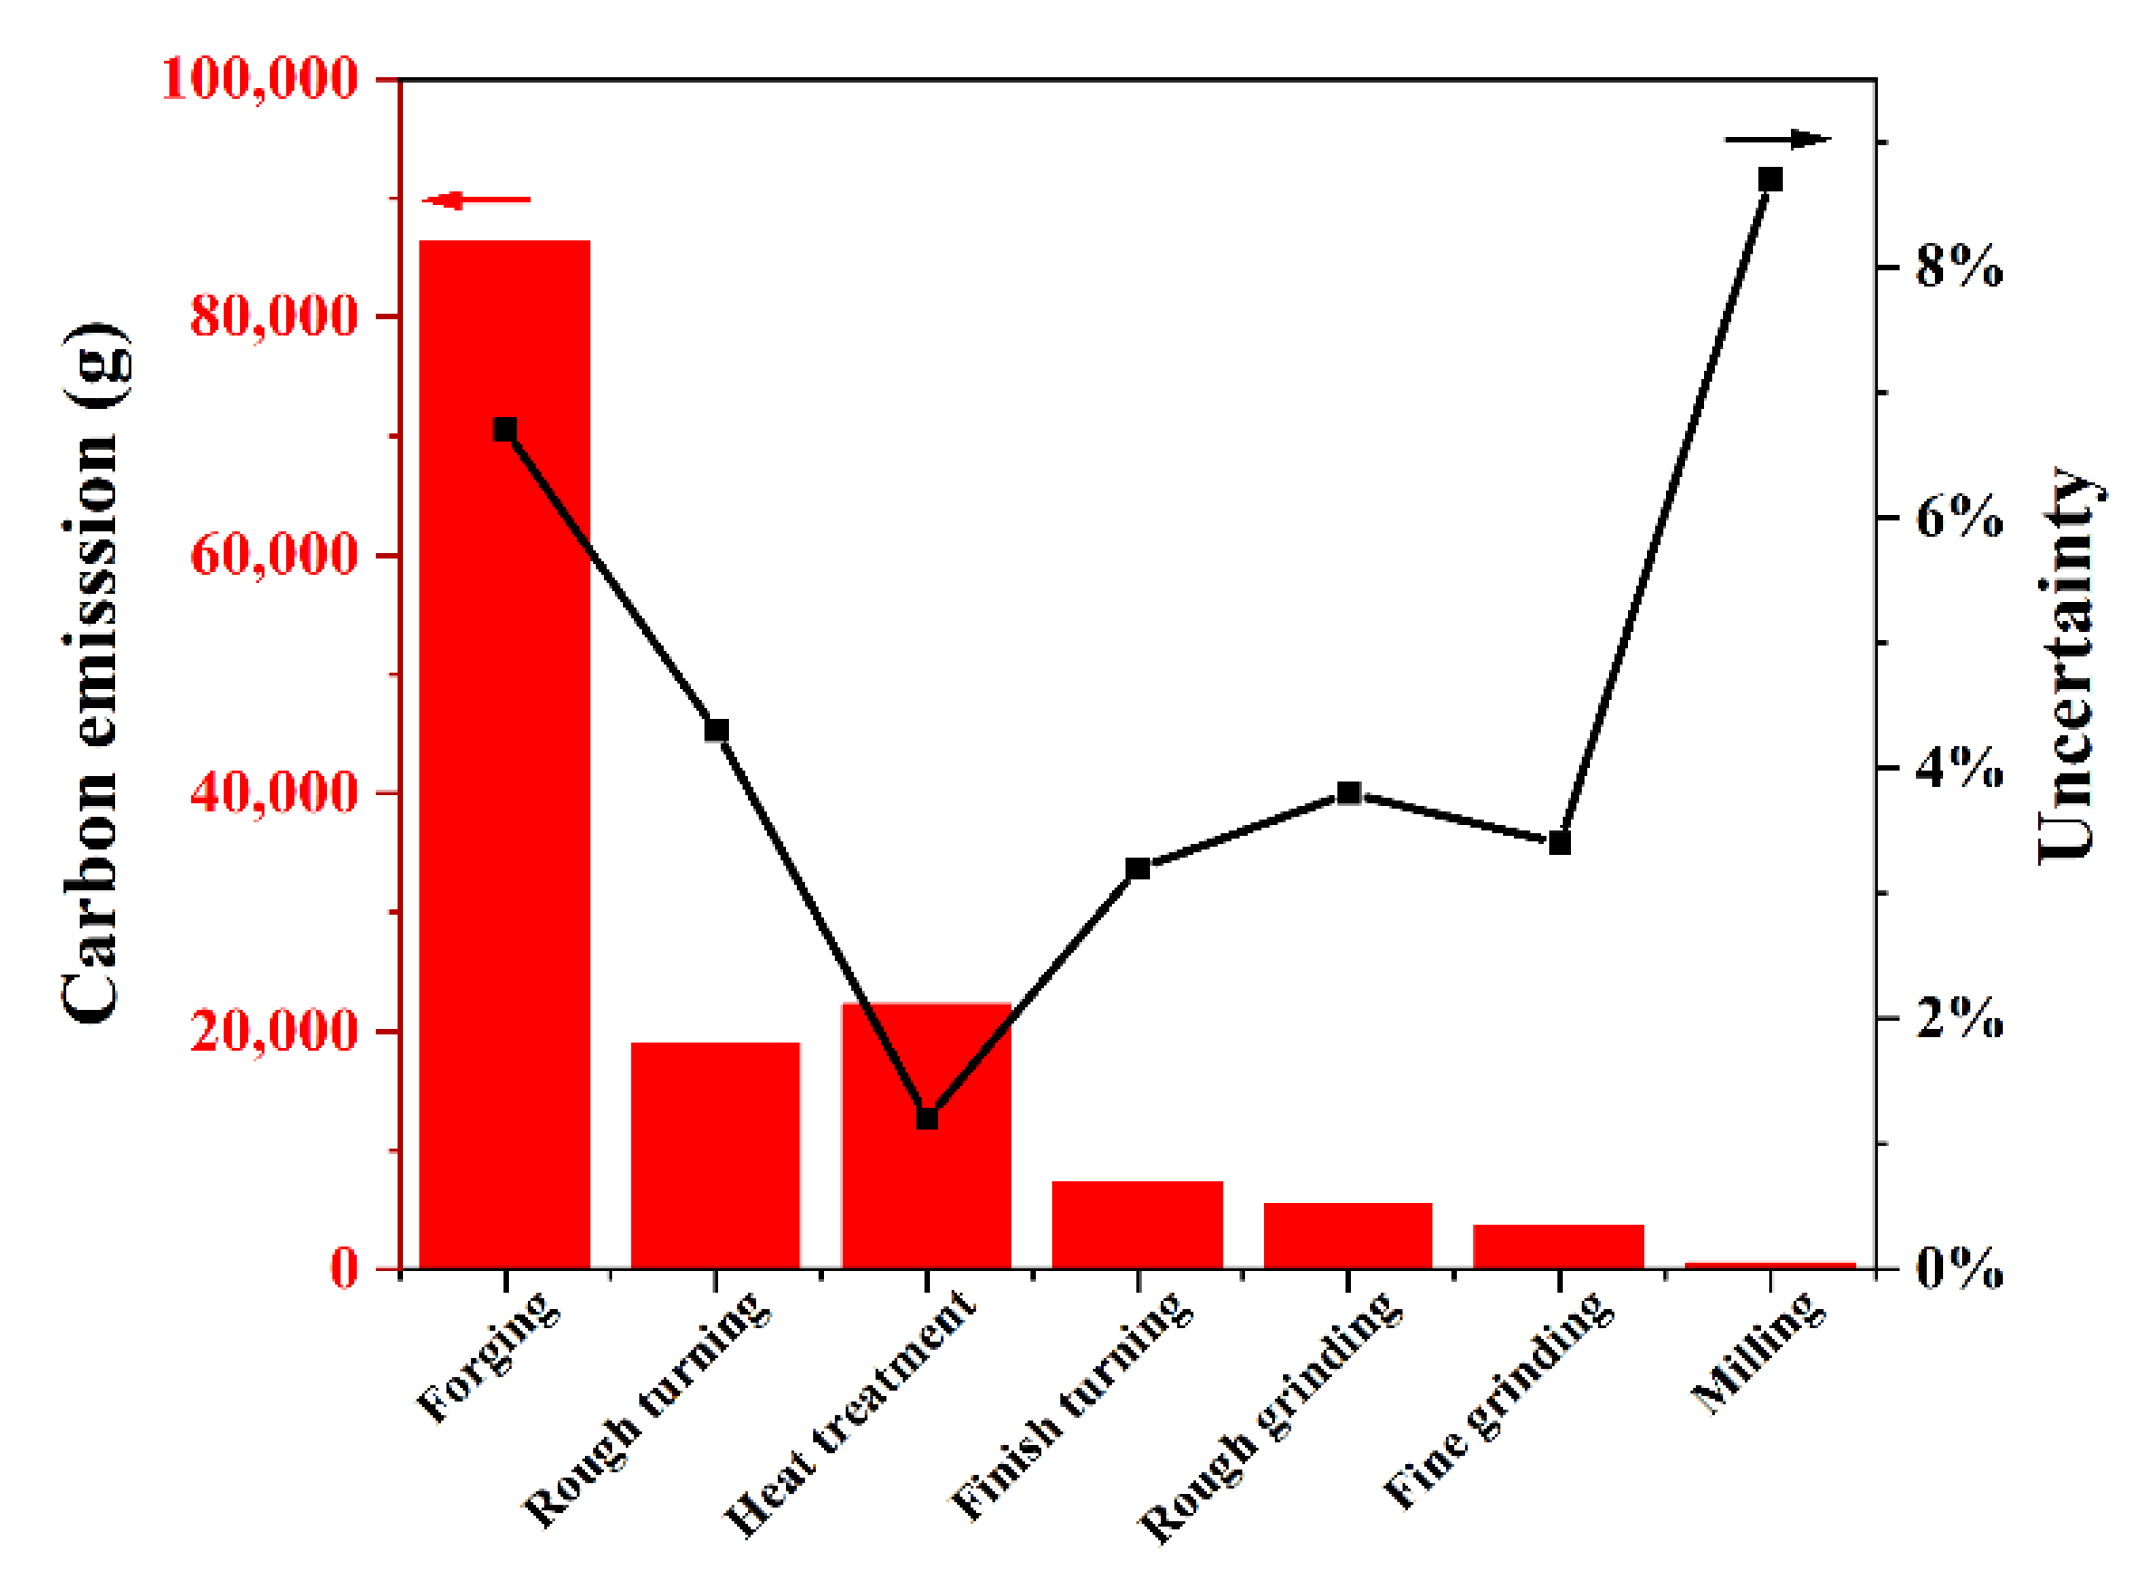
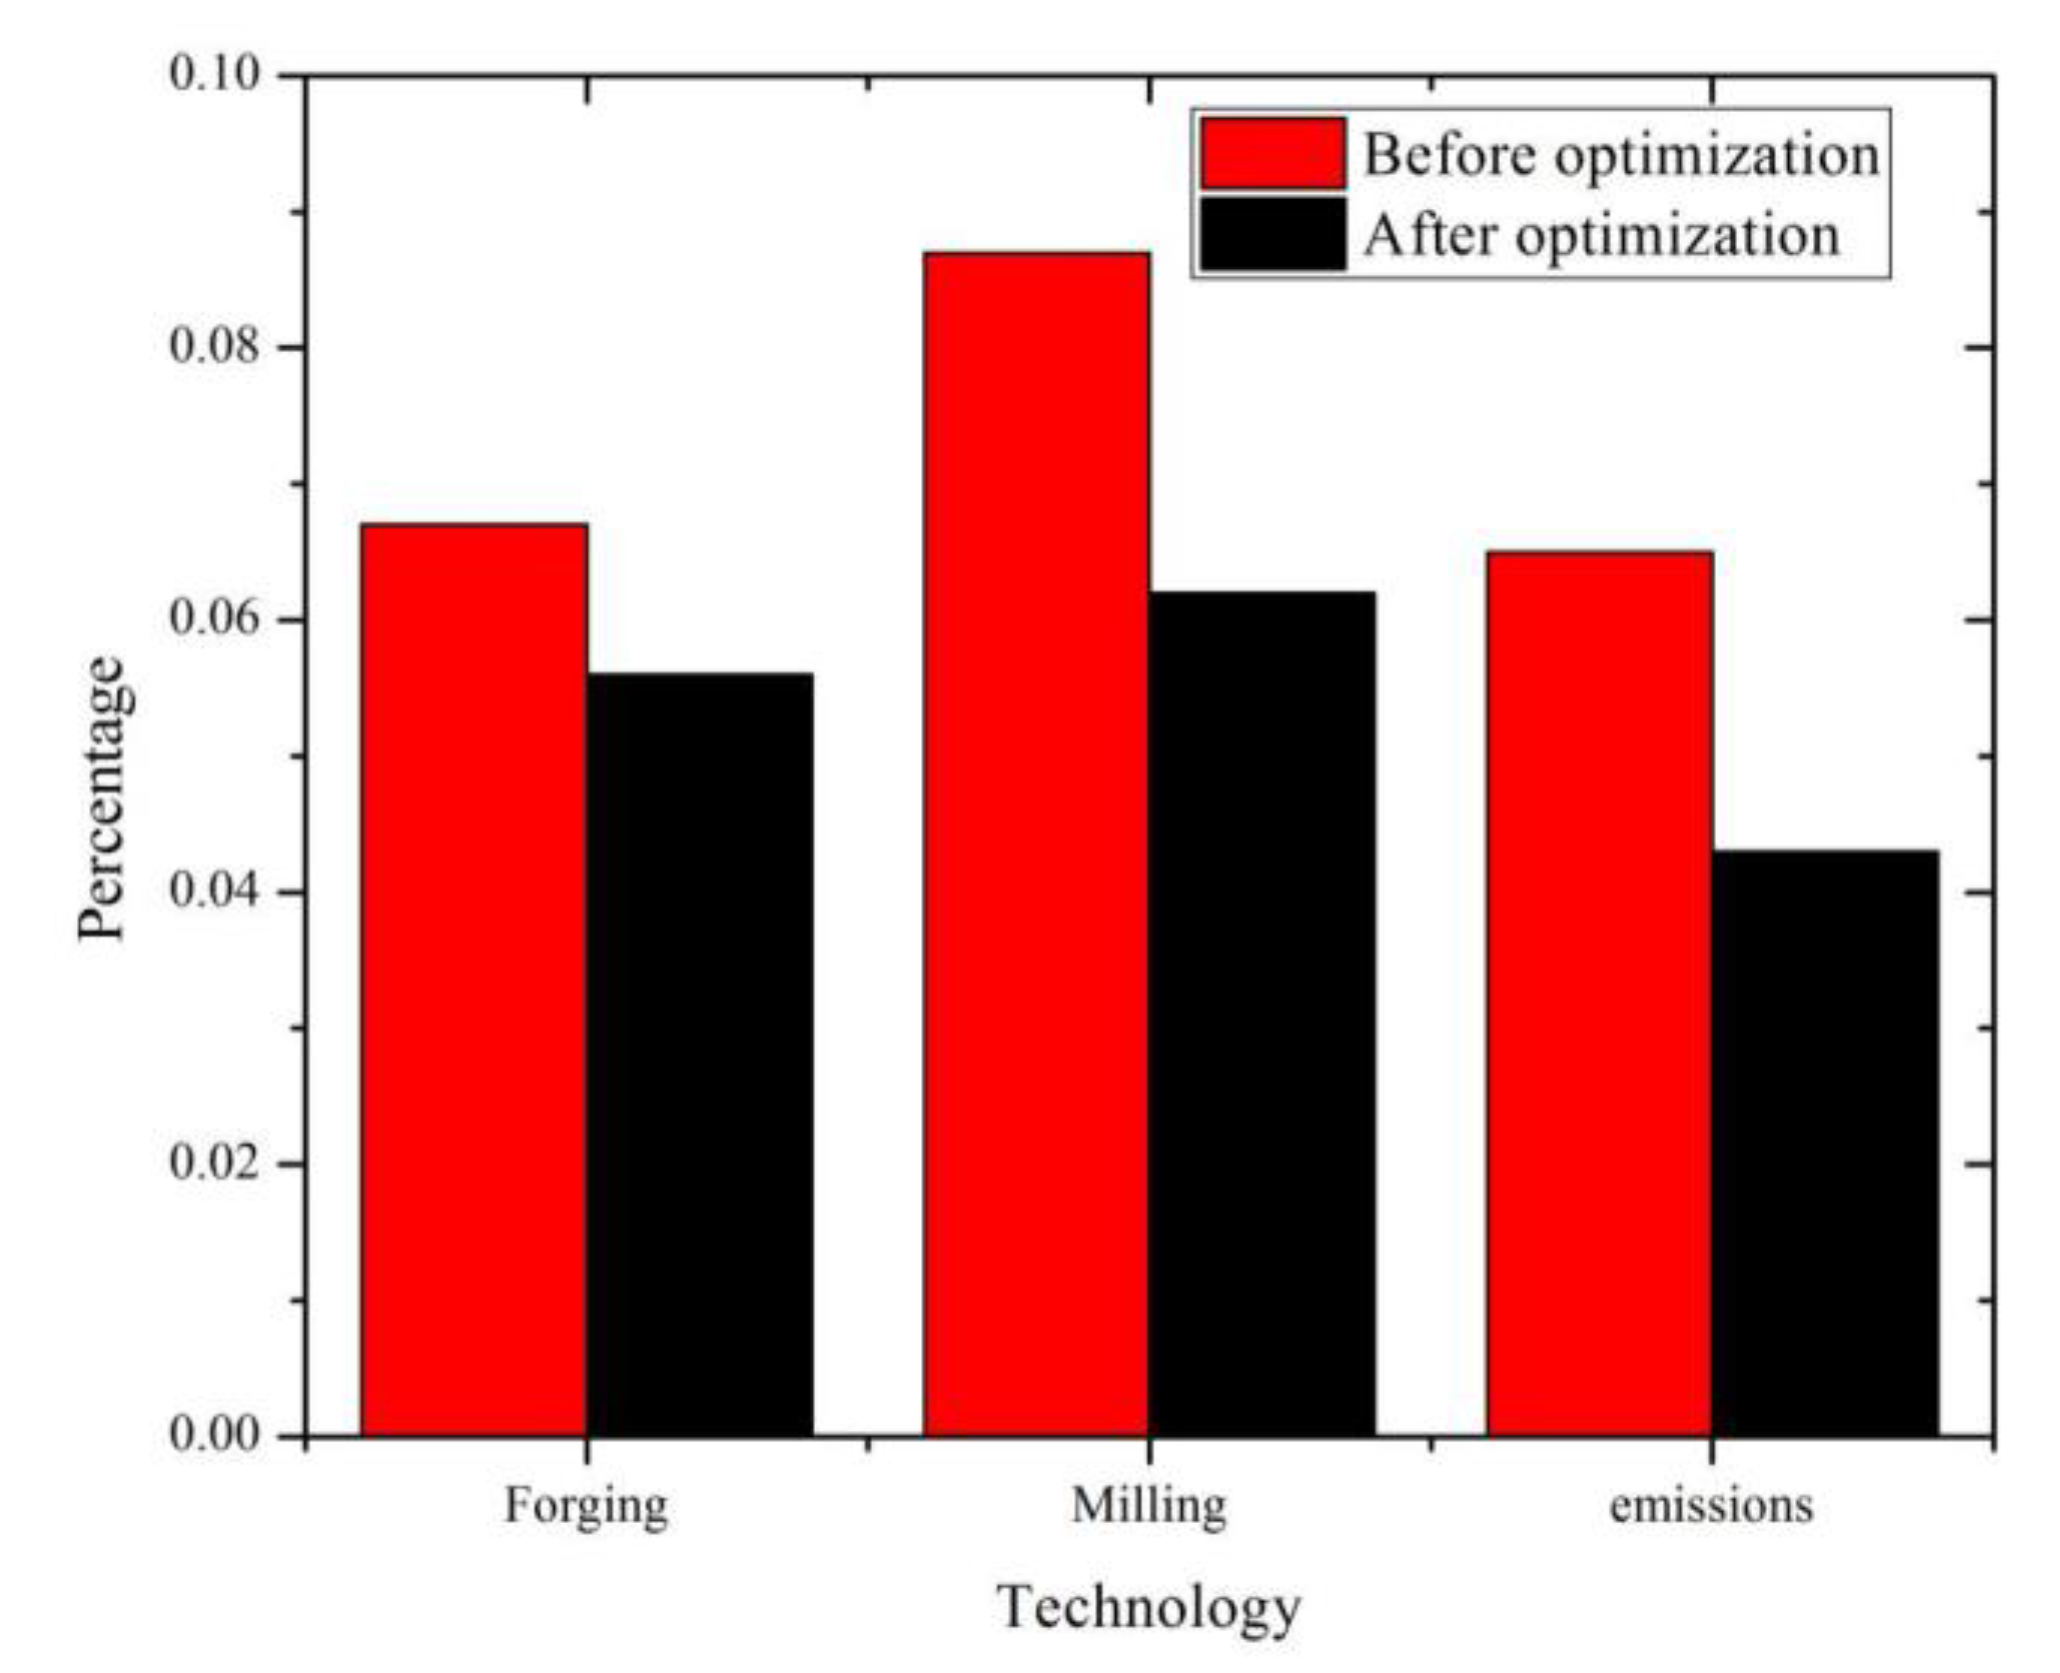
3.2. Result
3.3. Discussion
- (1)
- This method analyzes the input and output of the part manufacturing process from the perspective of carbon emissions, and establishes the uncertainty model of carbon emissions based on data-driven methodologies.
- (2)
- It can provide support for the low-carbon transformation and upgrading path of the production system of manufacturing enterprises; meanwhile, it can help policymakers strengthen quality management, improve the skills of workers, properly manage emissions, and reduce the uncertainty of carbon emissions in manufacturing systems. It is the basis of the low-carbon production management of enterprises.
- (3)
- Compared with energy benchmarking method applicable to high-end enterprises [15,16], this method is easy to understand, implement, and provides decision-making reference for managers in small enterprises; meanwhile, it can improve the comprehensive level of low-carbon, green and clean manufacturing systems, condense and enhance the core competitiveness of enterprises, and provide practical help for manufacturing enterprises.
- (4)
- Furthermore, in this study, we only focus on one part without considering the whole manufacturing system, in view of the advantages of a digital-twin drive, we will introduce the a digital-twin-driven intelligent manufacturing method into the field of carbon emission statistics in the whole manufacturing system [30,31,32].
4. Conclusions
Author Contributions
Funding
Institutional Review Board Statement
Informed Consent Statement
Data Availability Statement
Conflicts of Interest
References
- Carr, P.H. What is climate change doing to us and for us? Zygon® 2018, 53, 443–461. [Google Scholar] [CrossRef]
- Hossain, E.; Rej, S.; Saha, S.M.; Onwe, J.C.; Nwulu, N.; Bekun, F.V.; Taha, A. Can energy efficiency help in achieving carbon-neutrality pledges? A developing country perspective using dynamic ARDL simulations. Sustainability 2022, 14, 7537. [Google Scholar] [CrossRef]
- Moshood, T.D.; Nawanir, G.; Mahmud, F.; Sorooshian, S.; Adeleke, A. Green and low carbon matters: A systematic review of the past, today, and future on sustainability supply chain management practices among manufacturing industry. Clean. Eng. Technol. 2021, 4, 100144. [Google Scholar] [CrossRef]
- Brown, E.; Campbell, B.; Cloke, J.; To, L.S.; Turner, B.; Wray, A. Low carbon energy and international development: From research impact to policymaking. Contemp. Soc. Sci. 2018, 13, 112–127. [Google Scholar] [CrossRef] [Green Version]
- Andreotta, C. Visioneering futures: A way to boost regional awareness of the low-carbon future. Reg. Stud. Reg. Sci. 2018, 5, 117–124. [Google Scholar] [CrossRef] [Green Version]
- Gao, M.; Wang, Q.; Wang, N.; Ma, Z.; Li, L. Application of Green Design and Manufacturing in Mechanical Engineering: Education, Scientific Research, and Practice. Sustainability 2021, 14, 237. [Google Scholar] [CrossRef]
- Ghobakhloo, M. Industry 4.0, digitization, and opportunities for sustainability. J. Clean. Prod. 2020, 252, 119869. [Google Scholar] [CrossRef]
- Xie, K.-C. Low Carbon Economy and Energy Technologies for a Low Carbon Future. Energy Sour. Part A Recover. Util. Environ. Eff. 2009, 31, 1593–1597. [Google Scholar]
- Cao, H.; Li, H. A carbon efficiency approach for life-cycle carbon emission characteristics of machine tools. J. Clean. Prod. 2012, 37, 19–28. [Google Scholar] [CrossRef]
- Gao, M.; Huang, H.; Li, X.; Liu, Z. Carbon emission analysis and reduction for stamping process chain. Int. J. Adv. Manuf. Technol. 2017, 91, 667–678. [Google Scholar] [CrossRef]
- Xiao, Y.; Yan, W.; Wang, R.; Jiang, Z.; Liu, Y. Research on blank optimization design based on low-carbon and low-cost blank process route optimization model. Sustainability 2021, 13, 1929. [Google Scholar] [CrossRef]
- Jeswiet, J.; Kara, S. Carbon emissions and CES™ in manufacturing. CIRP Ann. 2008, 57, 17–20. [Google Scholar] [CrossRef]
- Narita, H.; Kawamura, H.; Chen, L.-Y.; Fujimoto, H.; Norihisa, T.; Hasebe, T. Development of Prediction System of Environmental Burden for Machine Tool Operation (2nd Report, Proposal of evaluation indicator for eco-efficiency). J. Environ. Eng. 2008, 3, 307–315. [Google Scholar] [CrossRef] [Green Version]
- Zhang, Q.; Jia, G. Carbon Flow Analysis and CO2 Emission Reduction Strategies of Iron Making System in Steel Enterprise. J. North. Univ. (Nat. Sci.) 2013, 34, 392. [Google Scholar]
- Cai, W.; Liu, F.; Xie, J.; Liu, P.; Tuo, J. A tool for assessing the energy demand and efficiency of machining systems: Energy benchmarking. Energy 2017, 138, 332–347. [Google Scholar] [CrossRef]
- Cai, W.; Li, L.; Jia, S.; Liu, C.; Xie, J.; Hu, L. Task-oriented energy benchmark of machining systems for energy-efficient production. Int. J. Precis. Eng. Manuf.-Green Technol. 2020, 7, 205–218. [Google Scholar] [CrossRef]
- Liu, F.; Cui, L. Multi-objective optimization model of machining process route for high efficiency and low carbon. J. Mech. Eng. 2014, 50, 133–141. [Google Scholar] [CrossRef]
- Li, C.; Cui, L. Multi-objective optimization model of CNC machining parameters for high efficiency and low carbon. Chin. J. Mech. Eng. 2013, 49, 87–96. [Google Scholar] [CrossRef]
- Zheng, J.; Tang, R.Z.; Hu, L.K. Carbon emission modeling of sand casting based on process carbon sources. Jisuanji Jicheng Zhizao Xitong/Comput. Integr. Manuf. Syst. Cims 2014, 20, 898–908. [Google Scholar]
- Deng, Z.; Lv, L.; Huang, W.; Shi, Y. A high efficiency and low carbon oriented machining process route optimization model and its application. Int. J. Precis. Eng. Manuf.-Green Technol. 2019, 6, 23–41. [Google Scholar] [CrossRef]
- Cuixia, Z.; Conghu LI, U.; Xi, Z. Optimization control method for carbon footprint of machining process. Int. J. Adv. Manuf. Technol. 2017, 92, 1601–1607. [Google Scholar] [CrossRef]
- Di Capaci, R.B.; Pannocchia, G.; Pozzo, A.D.; Antonioni, G.; Cozzani, V. Data-driven models for advanced control of acid gas treatment in waste-to-energy plants. IFAC-PapersOnLine 2022, 55, 869–874. [Google Scholar] [CrossRef]
- Leng, J.; Liu, Q.; Ye, S.; Jing, J.; Wang, Y.; Zhang, C.; Zhang, D.; Chen, X. Digital twin-driven rapid reconfiguration of the automated manufacturing system via an open architecture model. Robot. Computer-Integr. Manuf. 2020, 63, 101895. [Google Scholar] [CrossRef]
- Leng, J.; Zhou, M.; Xiao, Y.; Zhang, H.; Liu, Q.; Shen, W.; Su, Q.; Li, L. Digital twins-based remote semi-physical commissioning of flow-type smart manufacturing systems. J. Clean. Prod. 2021, 306, 127278. [Google Scholar] [CrossRef]
- Zhang, C.; Ji, W. Digital twin-driven carbon emission prediction and low-carbon control of intelligent manufacturing job-shop. Procedia CIRP 2019, 83, 624–629. [Google Scholar] [CrossRef]
- Vaccari, M.; Pannocchia, G.; Tognotti, L.; Paci, M.; Bonciani, R. A rigorous simulation model of geothermal power plants for emission control. Appl. Energy 2020, 263, 114563. [Google Scholar] [CrossRef]
- Li, Z.; Shao, S.; Shi, X.; Sun, Y.; Zhang, X. Structural transformation of manufacturing, natural resource dependence, and carbon emissions reduction: Evidence of a threshold effect from China. J. Clean. Prod. 2019, 206, 920–927. [Google Scholar] [CrossRef]
- Cao, Y.; Wang, Q.; Zhou, D. Does air pollution inhibit manufacturing productivity in Yangtze River Delta, China? Moderating effects of temperature. J. Environ. Manag. 2022, 306, 114492. [Google Scholar] [CrossRef]
- Eggleston, S.; Buendia, L.; Miwa, K.; Ngara, T.; Tanabe, K. 2006 IPCC Guidelines for National Greenhouse Gas Inventories. 2006. Available online: https://www.ipcc.ch/report/2006-ipcc-guidelines-for-national-greenhouse-gas-inventories/ (accessed on 14 August 2022).
- Leng, J.; Wang, D.; Shen, W.; Li, X.; Liu, Q.; Chen, X. Digital twins-based smart manufacturing system design in Industry 4.0: A review. J. Manuf. Syst. 2021, 60, 119–137. [Google Scholar] [CrossRef]
- Leng, J.; Yan, D.; Liu, Q.; Zhang, H.; Zhao, G.; Wei, L.; Chen, X. Digital twin-driven joint optimisation of packing and storage assignment in large-scale automated high-rise warehouse product-service system. Int. J. Comput. Integr. Manuf. 2021, 34, 783–800. [Google Scholar] [CrossRef]
- Leng, J.; Chen, Z.; Sha, W.; Lin, Z.; Lin, J.; Liu, Q. Digital twins-based flexible operating of open architecture production line for individualized manufacturing. Adv. Eng. Inform. 2022, 53, 101676. [Google Scholar] [CrossRef]


| Common Materials | Unit | Carbon Emission Factors | References |
|---|---|---|---|
| Steel | Kg/kg | 2.69 | [29] |
| Cutting fluid | Kg/L | 2.85 | [29] |
| Grinding fluid | Kg/L | 0.978 | [29] |
| Cutter | Kg/kg | 29.6 | [29] |
| Electricity | Kg/KW·h | 0.7125 | [29] |
| Scrap steel | Kg/kg | 0.361 | [29] |
| Waste cutting fluid | Kg/L | 0.21 | [29] |
| Finishing Turning | Remove Material (g) | Carbon Emissions (g) | Us | Uc | |
|---|---|---|---|---|---|
| Input | Turning plane | 170.82 | 459.58 | 1.5% (1.2–1.8%) | 3.2% (2.4–4.1%) |
| Turning cone | 680.5 | 1830.55 | 6.8% (5.7–8.6%) | ||
| Chamfering | 988.4 | 2658.79 | 7.5% (6.4–9.8%) | ||
| Threading | 61.3 | 164.89 | 5.6% (4.3–7.5%) | ||
| Drill | 54.7 | 147.14 | 1.6% (0.3–2.4%) | ||
| Cutter | 2.72 | 80.51 | 1.4% (0.8–3.1%) | ||
| Cutting fluid | 0 | 0 | 0% | ||
| Electric energy (kW·h) | |||||
| No-load Electric energy | 0.0144 | 10.29 | 0.5% (0.2–1.6%) | ||
| Processing Electric energy | 1.791 | 1280.92 | 2.6% (1.2–3.4%) | ||
| Output | Waste | 1955.72 | 706.01 | 6.5% (4.8–7.2%) |
Publisher’s Note: MDPI stays neutral with regard to jurisdictional claims in published maps and institutional affiliations. |
© 2022 by the authors. Licensee MDPI, Basel, Switzerland. This article is an open access article distributed under the terms and conditions of the Creative Commons Attribution (CC BY) license (https://creativecommons.org/licenses/by/4.0/).
Share and Cite
Wang, N.; Yang, Q.; Zhang, C. Data-Driven Low-Carbon Control Method of Machining Process—Taking Axle as an Example. Sustainability 2022, 14, 14133. https://doi.org/10.3390/su142114133
Wang N, Yang Q, Zhang C. Data-Driven Low-Carbon Control Method of Machining Process—Taking Axle as an Example. Sustainability. 2022; 14(21):14133. https://doi.org/10.3390/su142114133
Chicago/Turabian StyleWang, Nan, Quan Yang, and Cuixia Zhang. 2022. "Data-Driven Low-Carbon Control Method of Machining Process—Taking Axle as an Example" Sustainability 14, no. 21: 14133. https://doi.org/10.3390/su142114133