Article

New Perspectives of Earth Surface Remote Detection for Hydro-Geomorphological Monitoring of Rivers

Department of Earth and Geoenvironmental Sciences, University of Bari “Aldo Moro”, 70125 Bari, Italy
*
Author to whom correspondence should be addressed.
Sustainability 2022, 14(21), 14093; https://doi.org/10.3390/su142114093
Submission received: 20 September 2022 / Revised: 19 October 2022 / Accepted: 25 October 2022 / Published: 28 October 2022
(This article belongs to the Special Issue Geomorphological Mapping for the Geoheritage Resources Sustainability)

Abstract

:
In the current scenery of climate change and its relatively increasing visible effects seen over the world, the monitoring of geomorphological processes and flood dynamics becomes more and more necessary for disaster risk reduction. During recent decades, the advantages offered by remote sensing for Earth surface observations have been widely exploited, producing images, digital elevation models (DEM), maps, and other tools useful for hydro-geomorphological parameters detection, flood extent monitoring, and forecasting. However, today, advanced technologies and integrated methodologies do not yet enable one to completely provide near-real-time (NRT) and very-high-resolution (VHR) observations of a river, which is needed for risk evaluation and correct operational strategy identification. This work presents an advanced remote detection analysis system (ARDAS) based on the combination of multiple technologies, such as Unmanned Aerial Vehicle (UAV) systems, Structure from Motion (SfM) techniques, and cloud computing environment. The system allows to obtain VHR products, such as ortho-photomosaics and DEM, for deep observation of the river conditions, morphological modifications, and evolution trend. The test of ARDAS in the Basento river catchment area (Basilicata, South Italy) showed that the innovative system (i) proves to be advantageous in river monitoring due to its high accuracy, quickness, and data flexibility; (ii) could represent a NRT solution for timely support of flood hazard assessments; and (iii) can be further developed by integrating other technologies for direct application in land planning and safeguard activities by contributing to the value chain of the new space economy and sustainable development.

1. Introduction

Climate change and its relative effects are causing natural disasters all over the world, harmfully impacting human lives, facilities, and economic activities. In particular, flood events occur with increasing intensity and frequency, making the monitoring of the geomorphological processes and flood dynamics more and more necessary for risk mitigation, damage minimization, loss prevention, and natural landscape conservation [1,2,3]. According to several studies, river evolution analysis and extreme events observations are fundamental to improve river behavior understanding and flood hazard estimation [4,5]. The correlation between the hydrological and geomorphological processes in a fluvial basin imposes an integrated investigation of the phenomena that affect a catchment, such as flood events. In fact, modifications in the morphology of a river channel are generally influenced by, and in turn influence, the alluvial dynamics [6,7,8]. Thus, a description of the river conditions, by detecting the hydro-geomorphological parameters over time, and an analysis of the flood event’s effects (geomorphic effects, water extent, etc.) collectively contribute in evaluating a flood hazard and induced flood hazard [9,10,11,12,13]. During the last decades, remote sensing (RS) played a fundamental role in Earth surface observation and in the investigation of flood phenomenon in various geomorphic frameworks. Advanced technologies, new techniques, and innovative data fusion methodologies were developed for river process monitoring by exploiting the main potentialities of RS, such as a high spatial resolution, providing synoptic information over wide areas—even in sites with poor on-the-ground accessibility conditions—and supporting multi-temporal observations [14,15]. Furthermore, the growing availability and different nature of RS data opened new research avenues that helped explore various new detection platforms (drones, planes and satellites), tools (multispectral-hyperspectral optical and Synthetic Aperture Radar (SAR) sensors, laser scanners, etc.), techniques (image acquisition, Light Detection and Ranging (LiDAR), etc.), analytical methods (visual inspection, image processing, photogrammetry, interferometry, etc.), and products (images, ortho-photomosaic, digital elevation models (DEM), and others), thus supporting all different aims and scales of investigation [16,17,18,19]. RS data also have been applied to (1) extract parameters and variables for river characterization [20,21] and channel variation detection [22,23,24,25]; and (2) support flood extent mapping [26,27,28,29] and flood forecast through data assimilation in hydraulic modelling [30,31,32,33,34,35].
(1) Table 1 shows some of the hydro-geomorphological parameters and the potential remote acquisition techniques to obtain them. In particular, the table provides a synthetic overview that shows the wide applicative context of RS data for the detection of geomorphometric parameters and flood indicators through methods and modalities, known from the literature or here proposed. It should be noted that the table is not to be considered an exhaustive collection, rather an input instrument to display the contribution and continuous advancement of RS in geomorphological analysis and flood monitoring. One or more elements that compose the parameters can be identified and measured by applying different RS techniques in the direct or indirect modality, where “direct” indicates the automatic access to RS information through processing algorithms, and “indirect” indicates the interpretation of RS information through visual image interpretation. For example, the detection of river channel boundaries, needed to measure various geomorphic parameters such as bank length, channel width, or river axis, can be obtained through the manual digitalization of channel morphology [8,21,36] or through the direct extraction of the channel boundaries by applying image processing with algorithms for spatial filtering, segmentation, and pattern recognition [37,38,39]. Obviously, surface conditions (e.g., smoothness, roughness, size and orientation of objects, etc.) and the characteristics of the different RS sensors (e.g., spatial and spectral resolution, wavelength, polarization, etc.) define the applicability of the RS data and techniques and affect the accuracy of the resulting products (see Figure 1 for examples). A smooth water surface makes a river body detectable by processing the texture of a SAR image (Panels 1a–c in Figure 1), the vegetation contributes to improve the identification of the channel boundaries through the computation of the normalized difference vegetation index (NDVI) using a multispectral image (Panels 2a–c in Figure 1), and the very-high spatial resolution of an ortho-photomosaic derived from drone images (see below) allows distinguishing the channel, bars, and vegetation by applying algorithms for edge detection and unsupervised clustering (Panels 3a–c in Figure 1). Then, merging of the multi-source and multi-temporal RS data and combining this with other methodologies become necessary in order to improve the quantity and quality of the extracted information.
(2) In addition to the hydro-geomorphological analysis, the application of an integrated approach has been amply demonstrated in many research on flood mapping [40,41,42] (Figure 2). The coupling of optical and SAR satellite images has proven to be helpful to observe the spatial evolution of flood event (Left Panel in Figure 2); the integration of multi-frequency, multi-polarization, and multi-temporal SAR data was successfully used to derive a flood map in areas characterized by various vegetation cover types (Right Panel in Figure 2); and the combined application of the hydro-geomorphological parameter—the sediment connectivity index—and the RS data enhanced the exploration of the processes’ connection in flood dynamics (Below Panel in Figure 2). Furthermore, the integration of different information sources, such as RS and hydrodynamic models, has made a generally substantial contribution to the assessment of the hydrology information, the calibration of the variables and parameters, and the assimilation of data for flood extent monitoring and forecasting [33,43,44].
The described scenario highlights that the detection of river catchment phenomena is strongly supported by the wide application of RS and the development of integrated methodologies in river evolution analysis, flood mapping, and management of exposure to natural disasters. However, today, this scenario does not seem to fully satisfy the needs of river monitoring for flood hazard assessment, such as near-real-time (NRT) access to very-high-resolution (VHR) observation of the hydro-geomorphological river conditions. We introduce a new perspective of remote detection and hydro-geomorphological monitoring of rivers by presenting an advanced remote detection analysis system (ARDAS) based on the combination of multiple technologies such as Unmanned Aerial Vehicle (UAV) systems, Structure from Motion (SfM) techniques, and the cloud computing environment. This system aims to detect Earth’s surface along rivers and to obtain NRT VHR products, such as ortho-photomosaics and DEMs, which are fundamental to apply a hydro-geomorphological analysis. The experimentation of ARDAS in the Basento river catchment area (Basilicata, South Italy) allows us to explore the potential of this innovative system in observations of channel dynamics, morphological modifications, and evolution trends. The proposed future development of ARDAS could further improve the applicability of RS data and techniques to the monitoring of Earth surface processes and to the assessment of natural hazards, by helping to understand how RS can contribute to the sustainability of environmental systems.

2. Methods

2.1. ARDAS Description

ARDAS was developed following the experimentation of integrated methodologies of RS and data processing [45]. The multi-technologies system applies a sequential step-by-step procedure (Figure 3):
  • Remote detection of the Earth’s surface through UAV systems. This surveying technique overcomes the intrinsic limitations of satellite- and airborne-based optical imagery and in situ traditional surveys. In fact, it ensures the acquisition of very-high-resolution spatial data with a high temporal frequency in the most dynamic environments (as the fluvial one), even by using a cheap consumer-grade digital camera [46]. These capabilities prove critical for identifying and monitoring active phenomena that drive topographic changes, ensuring, for example, detailed mapping of riverine landscapes, for flood and disaster relief [47,48].
  • NRT processing of data acquired from UAVs in the cloud environment through a massive operational data-center that provides great computing power and storage capacity through cluster computers that automatically process large datasets of high-resolution UAV images by applying a parallel computing photogrammetric workflow. High computing and data storage resources are needed to perform the computing task so that the results can be obtained in reasonable time, a key aspect especially in emergency scenarios. Thus, the concept of NRT is intended as minimizing the processing time of UAV images, uploaded by the user to the cloud environment, by taking advantage of the nearly unlimited computational resources made available [49]. In fact, mapping wide areas of the Earth’s surface by using UAV-based photogrammetry (low-altitude flight and low range coverage) can result in thousands or ten-thousands of high-resolution images (gigabyte or even terabyte), which need this type of solution to avoid limits in the photogrammetric processing [50].
  • Data processing through the application of a photogrammetric workflow based on SfM techniques [51]. The sequential acquisition of images at different angles and the following overlap define the 3D position of the image descriptors in order to determine the three-dimensional structure of the surface [52]. SfM processing leads to the generation of several outputs (point cloud, ortho-photomosaic, DEM, textured mesh) through the achievement of a sequence of steps: (i) detection of key features and tie points of the images by applying the scale-invariant feature transform (SIFT) algorithm [53]; (ii) estimation of the calibration parameters and camera position and orientation by applying bundle adjustment [54]; (iii) dense correlation by applying a clustering view for the multi-view stereo algorithm (CVMVS) [55]; and (iv) orthorectification. The processing is executed through a parallel open-source photogrammetric workflow exploiting the nodes that compose a computing cluster to distribute the most computationally demanding steps.
  • Generation and post-processing of VHR products: ortho-photomosaic and DEM (minimum achievable spatial resolution of 1 cm) obtained by multi-temporal UAV surveys. The outputs are used to monitor river evolution by applying methods of hydro-geomorphological analysis, such as change detection and parameter extraction. In fact, the application of ARDAS over time allows comparing output by computing the DEM of Difference (DoD) and hydro-geomorphological parameters. ARDAS is structured to partly automate data processing in order to avail in a very short time the necessary products for the assessment of river conditions and the connected risks.
As shown, the automated system relates single technologies and techniques in order to avoid the possible limitations arising from their individually application, such as long processing times or lowering of the resolution of the output. Through this combined methodology, ARDAS becomes suitable also for supporting emergency sceneries.

2.2. ARDAS Application

ARDAS was applied experimentally in the Basento River catchment area (Basilicata, Southern Italy) along the main reach (Figure 4a,b), which was affected by morphological modifications that conditioned the fluvial and alluvial dynamics and caused damage and failure, determining it hydro-geomorphologically as high risk [12]. The experiment was conducted during the period 2019–2021 in order to monitor the river reach evolution and evaluate the induced flood hazard. Flight missions were executed by using a quadcopter DJI Inspire 2 equipped with an optical sensor, DJI Zenmuse X5S (20.8 MP, DJI MFT 15 mm/1.7 ASPH, sensor CMOS 4/3′’, FOV 72°, image resolution 5280 × 3956 pixels; produced by DJI, Shenzhen, China, https://www.dji.com/it/zenmuse-x5s/info). The set of images acquired was processed using the computing clusters hosted by the ReCaS-Bari data center and by implementing a specific open-source photogrammetric workflow [45]. The photogrammetric workflow applies the principles of SfM (see Section 2.1) and distributes the most computationally demanding steps through parallel computing over the nodes that compose the ReCaS-Bari cluster. Parallel computing was carried out through a “divide and conquer” approach and for specific steps of the workflow (generation of tie points, orthophotos, and depth maps DEM), greatly minimizing the processing time (see Step 3 in Figure 3).

3. Results

The application of ARDAS along the reach of the Basento River led to acquiring a photogrammetric dataset composed of about 3000 optical images with a 1.09 cm/pixel resolution, which was were processed using the parallel open-source photogrammetric workflow.
A VHR ortho-photomosaic (1.23 cm/pixel resolution) and DEM (6 cm resolution) were generated (Figure 4c,d). These outputs describe the river channel with a very-high spatial resolution that allows to observe detailed morphological characteristics and to extract the hydro-geomorphological parameters and their components (see the example of the river extraction in Figure 1).
The comparison of the output obtained during the period 2019 and 2021 produced (i) a DoD, which detected the change in elevation, showing channel deposition and erosion (Figure 5); and (ii) a map of the channel displacement, which detected the change in channel location, modifying the sinuosity index (Figure 6).
These analyses improved the deep observation of the evolutionary trend. In fact, through DoD analysis, it was possible to detect significant morphological changes, in this case erosional and depositional processes up to a minimum level of detection (mLOD) of 14 cm (see legend in Figure 5a), and to identify the river reach exposed to favorable conditions for further potential bank collapses (red patches in Figure 5a) with solid deposition in the riverbed and consequent reduction in the river flood discharge areas (greatly increasing the flooding hazard). As shown by multi-temporal cross-section comparison (see Figure 5b), there was significant variation in the topographic profile, which involved a reduction in the flood discharge area (A, identified by considering the river bank in full) of about 70 m2. Through the change detection analyses, it also was possible to identify the alterations in the main river channel (in some sectors, displacements of more than 90 m were recorded, as stated also by the different values of the sinuosity index reported in Figure 6), and thus the conditions affecting the river and the related risks. These results confirm the high value of the ARDAS system, which identifies the changes in the river channel morphology and potential induced flooding factors over short time ranges, for the effective management of the alluvial environments and the suitable assessment of future instability scenarios.

4. Discussion

An understanding of river dynamics given the predicted climate and human-induced changes represents an important challenge, stimulating environmental scientists to engage in developing solutions for the monitoring, assessment, and mitigation of hydro-geomorphological risks. As known, there is an interrelation between the hydrological and geomorphological process conditions and catchment phenomena, such as flood events. Thus, the investigation of extreme river events supposes an integrated analysis that ensures a holistic approach able to detect the interaction of the processes and connected risks by considering the appropriate scale, resolution, and time period. The great advantages offered by RS constitute a fundamental resource for supporting the observation and monitoring of the processes that occur on the Earth’s surface, and in fluvial basins in particular, all made possible through the constant development of methodologies, techniques, and tools. ARDAS fits into this framework by combining technologies of RS and data processing to apply to hydro-geomorphological monitoring of rivers. The system observes and analyses the evolution of river morphology at a very-high resolution, detecting in short times any modification that could expose a river to geomorphological and flood risks. The results obtained in the Basento catchment demonstrated the capacity of ARDAS to reproduce the quantitatively topographic and morphological features of the investigated river reach and to identify changes in channel morphology (Figure 4, Figure 5 and Figure 6). Numerically characterizing the channel morphology, deposition, and erosion trend along the reach means to monitor the evolution of the river processes, effectively inspecting modifications in channel cross-sectional area and directly controlling flood susceptibility [11,12]. Considering the new methodologies of river hydro-geomorphological monitoring [10,56,57], ARDAS provides effective support to obtain highly accurate, quick, and flexible information by satisfying the main requirements of river monitoring and flood hazard assessment. In fact, the almost immediate availability of VHR products favors fast risk evaluation for correct operational strategy identification. Earth surface detection at a very-high spatial resolution implies the acquisition of a large data set of VHR images that needs high-performance hardware, large data-storage capacity, and long processing times. Therefore, very accurate information often has very long processing times; also, rapid information necessarily results in being less accurate. ARDAS represents a novelty in view of other monitoring systems by overcoming these limits through the application of an integrated system. In fact, the comparison of ARDAS with a classic photogrammetric process (CPP, applied by a commercial software) reveals (1) unaffected output accuracy and (2) a substantial reduction in the processing time, of about 60%, as also demonstrated by tests executed in other analyses [45]. The Root Mean Square Error (RMSE) of the difference between the ground control points (GCPs, extracted from technical regional cartography, with an accuracy of 1 m), assumed as the ground truth and checkpoints identified in the outputs from ARDAS and from other CPP, was computed, and is shown in Table 2. The processing time of the outputs from both systems was measured and is shown in Table 2. This comparison allows us to assess Step 3 in ARDAS (see Panel 3 in Figure 3), which is the most representative and influencing sequence of the system.
This evaluation highlights the efficiency of ARDAS and the high value of the automation and the combination of multiple technologies that could be further integrated into a future perspective. In fact, further development of ARDAS may potentially enhance the system by (i) extending the monitoring of a single river reach to the entire river course; (ii) commuting NRT in real-time RT data transfer; and (iii) automating the application of the hydro-geomorphological analysis. In order to achieve these improvement objectives, other sequences would be added in ARDAS in a step-by-step procedure (orange circles in Figure 7):
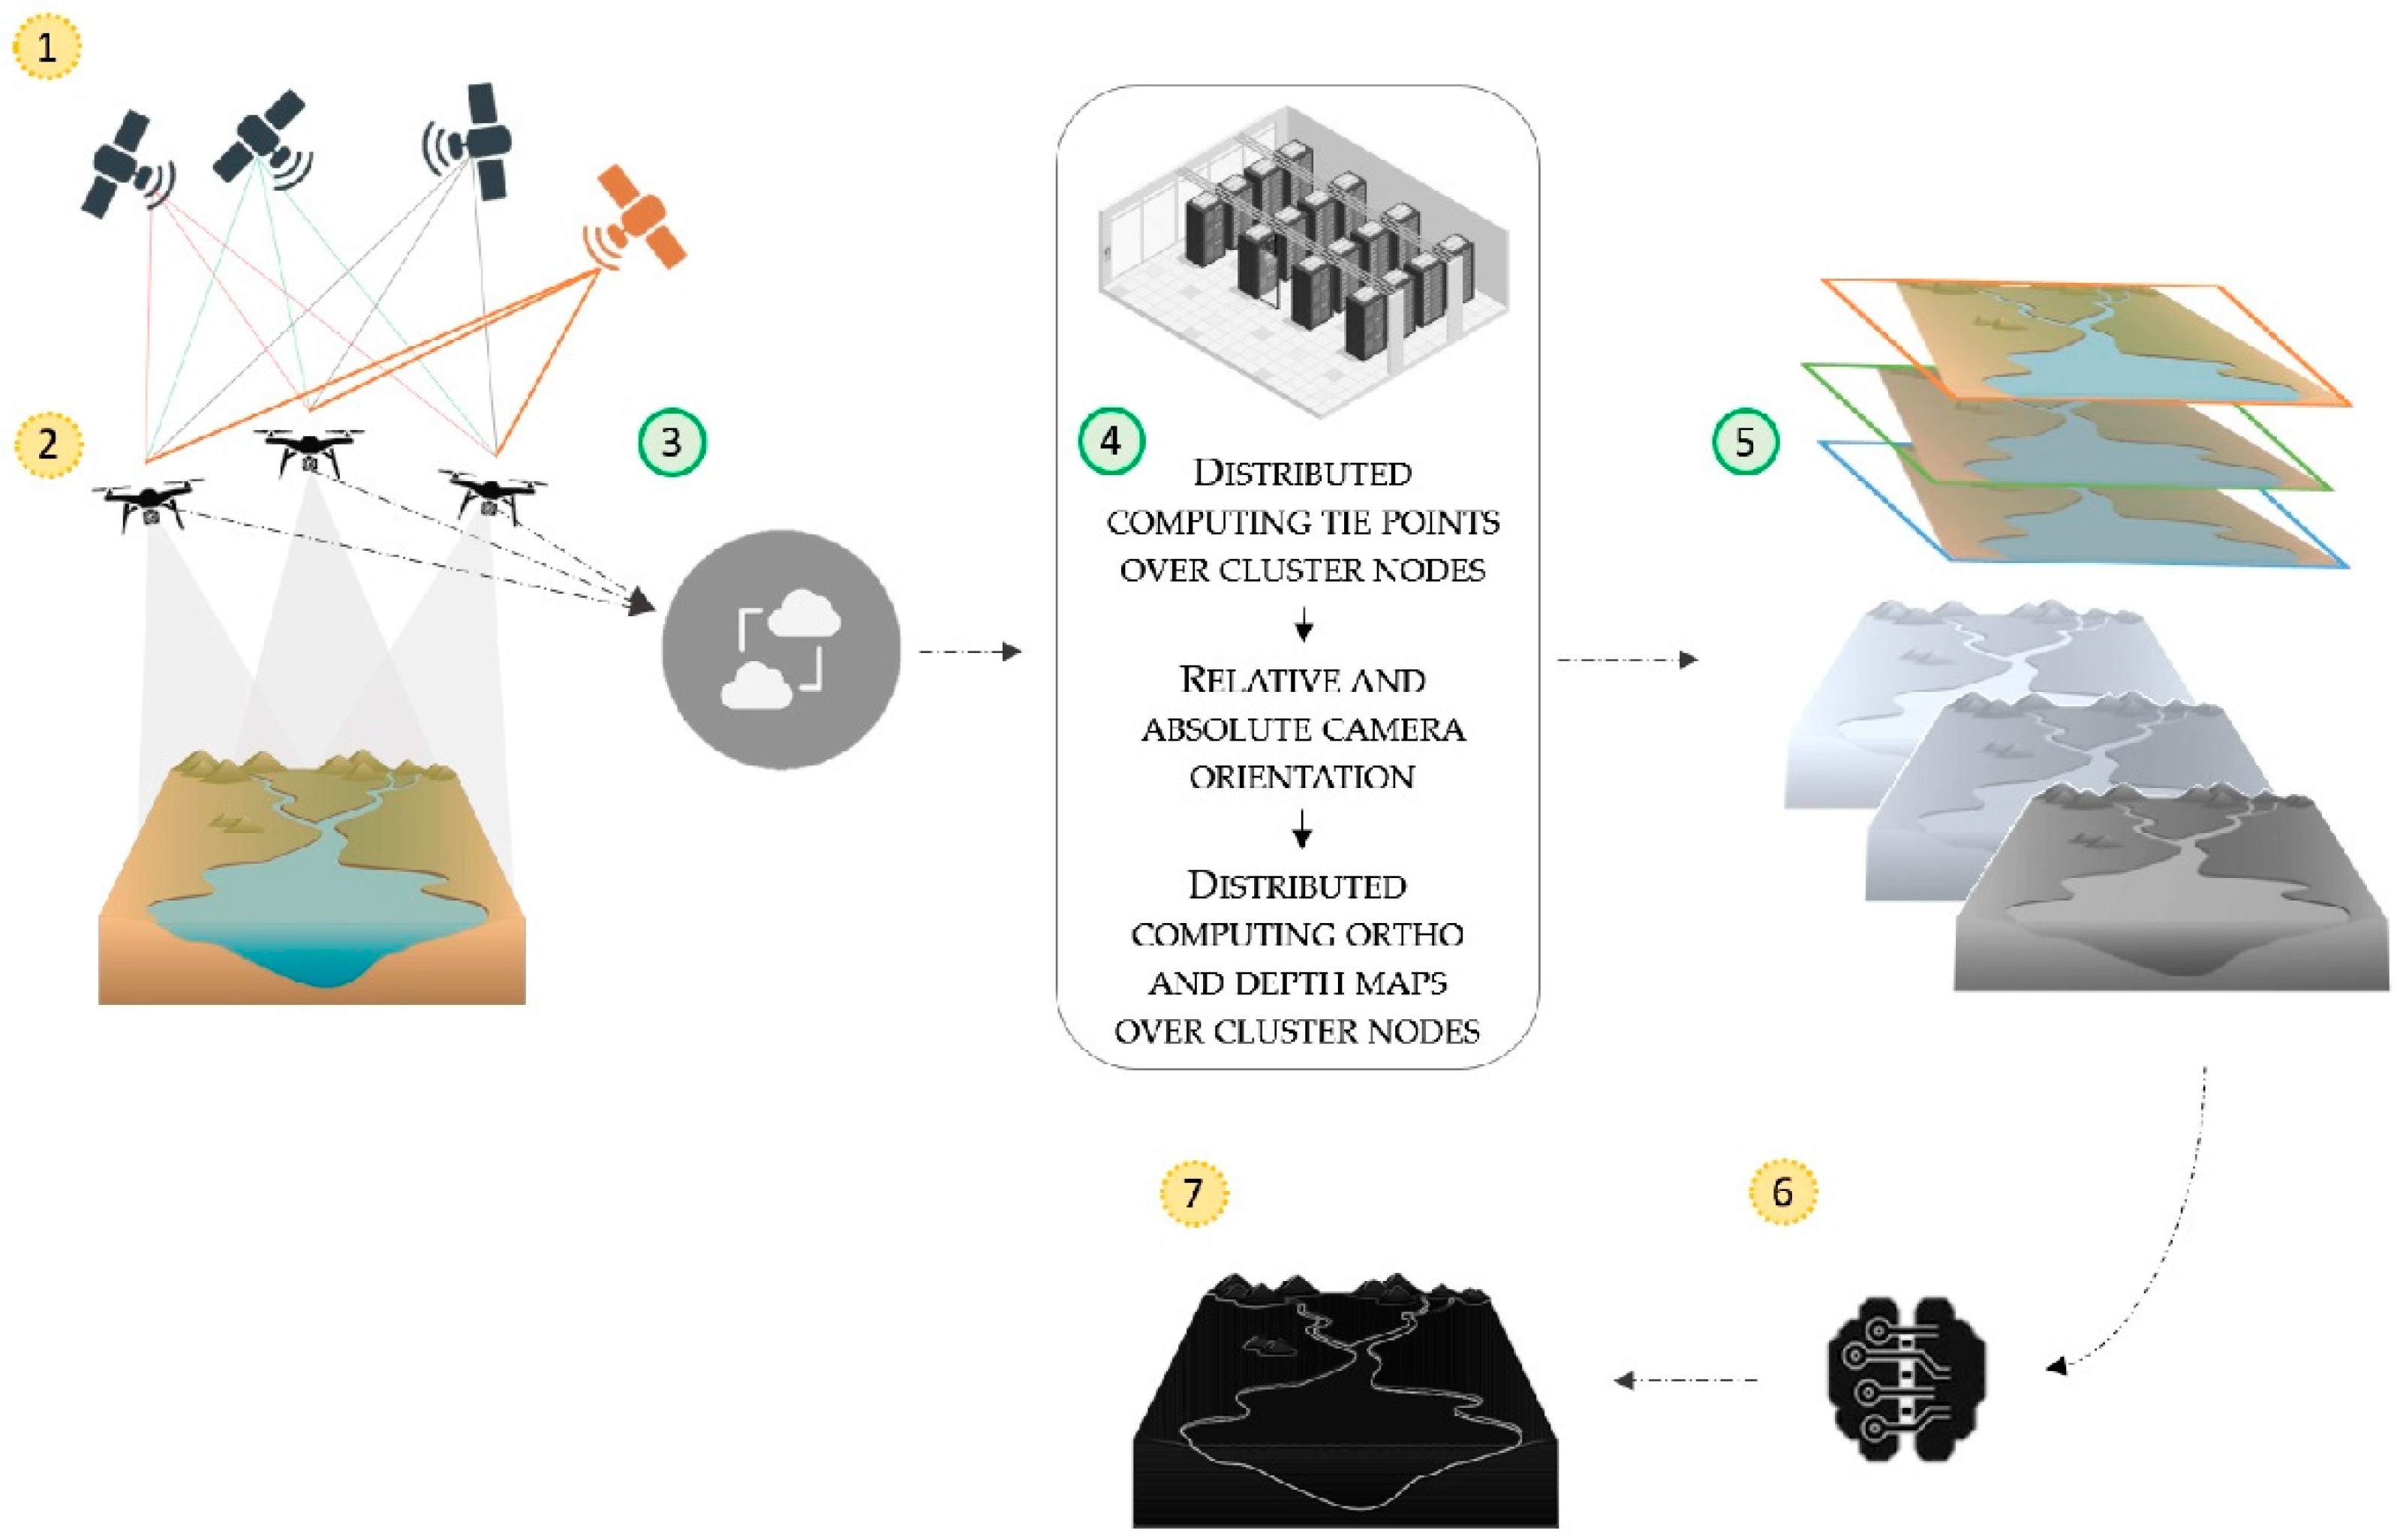
  • High-accuracy positioning of the UAV fleet by the European navigation satellite systems of Galileo and EGNOS (Panels 1 and 2 in Figure 7). Each UAV belonging to the fleet would integrate GNSS receivers (Galileo and GPS; [58]) so that it is able to get signals from the highest number of dual-frequency satellites, i.e., two GNSS signals at different frequencies from a satellite, providing increased reliability in challenging environments. In addition, leveraging the EGNOS system, a real-time augmentation of the original GNSS signals received from each UAV is applied with differential correction from stations developed across Europe. This very high accurate positioning system improves the accuracy, reliability, safety, and continuity of the correct GNSS positioning information for each UAV, determining a favorable condition for Beyond Visual Line Of Sight (BVLOS) automatic flight missions of the fleet. The BVLOS operation modality of multiple UAVs is suitable to detect a large area of the Earth’s surface, such as the course of the river in a catchment. However, it requires the accurate positioning of each individual UAV in action in order to avoid multipath interference errors and to ensure the complete mapping of the area, even in poorly accessible conditions, such as mountainous and/or dense vegetated areas, buildings, and other potential obstacles. This remote sensing system makes the simultaneous photogrammetry flight missions of multiple UAVs highly accurate.
  • A real-time data transmission system from each UAV to the cloud environment. Potential implementation of a connection network with data informatization that can ensure the real-time transfer of data acquired by each UAV into the cloud environment, by exploiting the potential of these tools to connect to the Internet and to generate and transmit data streams through the IoT (Internet of Things) paradigm. The real-time concept translates into optimizing the time of output generation by processing the data at the same moment of acquisition or at least within a very short subsequent time interval, with a continuous Input → Processing → Output chain.
  • Application of automation algorithms for the extrapolation of hydro-geomorphological features and parameters from VHR products (Panels 6 and 7 in Figure 7). The algorithms would implement an analytical procedure that executes the river geomorphological characterization and change detection in a flexible mode. Depending on the scale and phase of the investigation, the workflow could apply (i) river segmentation by executing pixel-based classification through image-processing techniques; (ii) detection of potential morphological modifications by applying DoD with a continuous and automatic update of consecutive UAV surveys; (iii) individuation of critical sections along river reaches identified by the previous step and extraction of relative profiles from the DEM through the interpolation of elevation points; and (iv) measurement and examination of the hydrological and morphological variables that control the fluvial processes by trying to automatically compute components of the indices listed in Table 1 (for example, the confinement index could be computed by using vector lines of channel width and floodplain derived from the first (i) step). Although this proposed implementation could be a challenge, the automation of the procedure would reduce the investigation timing without limiting the spatial extension of the observation area.
ARDAS, in the current and future potential version, could be applied in different fluvial environments by representing a useful solution for all subjects involved in river monitoring, land planning, and safeguarding activities. Moreover, ARDAS is a modular system that could be widely used also in other application scopes concerning the observation and monitoring of surface-occurring phenomena, such as environmental risk monitoring, ecosystems evolution analysis, archaeological landscapes investigation, engineering and building design, and others. The proposed remote detection and analysis system tries to provide knowledge and expertise for the exploitation and fusion of new technologies in order to translate the science exploration into a strategy task for an operational support to society. This approach follows the new trend of a space economy, the cross-technologic and multi-sectors frontier that aims to generate economic growth through business opportunities, providing value and benefits to humanity and concretely solving complex problems on a global scale through sustainable development [59]. Discovering how RS technologies can support an understanding of Earth systems represents the beginning of the space economy, and combining RS and digital technologies to make our world more sustainable is the main objective of this new space economy. An ARDAS enhancement perspective joins this virtuous system, triggering innovative ideas for Earth surface monitoring that can contribute to achieve the Sustainable Development Goals, adopted globally to actively take action in protecting the planet.

5. Conclusions

The effects of climate change imposed the development of solutions for river monitoring and flood hazard assessment. Hydro-geomorphological analysis helps to investigate river process interactions and induced flood hazards. RS offers fundamental support in Earth observation and surface dynamics monitoring.
Here, the proposed ARDAS system combines multiple technologies to apply hydro-geomorphological monitoring of rivers. The main findings are as follows:
  • Generation of NRT VHR outputs, i.e., an ortho-photomosaic and DEM, is useful for multi-temporal hydro-geomorphological analysis.
  • The very short time of data processing is crucial for risk assessment and management of monitoring and emergency activities.
  • The main advantage of ARDAS is satisfying the need to rapidly access highly accurate information.
  • The potential limits of ARDAS, such as detection of only some river reaches and the need to move manually from one sequence to another in the system, would be overcome in future development of the system.
As it is designed, ARDAS can be placed in the value chain of the new space economy and sustainable development.

Author Contributions

Conceptualization, M.Z., M.L.S. and D.C.; methodology, M.Z., M.L.S.; validation, M.L.S.; formal analysis, M.Z., M.L.S. and D.C.; investigation, M.Z. and M.L.S.; data curation, M.Z. and M.L.S.; writing—original draft preparation, M.Z., M.L.S. and D.C.; writing—review and editing, M.Z., M.L.S. and D.C.; supervision, D.C.; project administration, M.Z., M.L.S. and D.C. All authors have read and agreed to the published version of the manuscript.

Funding

The present work was supported also by the contribution of the “Bruno e Nuccia Radina” award assigned to M.Z. for the best Geoscience Ph.D. thesis of the University of Bari, Italy.

Data Availability Statement

Data are available from the authors upon request.

Acknowledgments

The present work was supported also by the contribution of the “Bruno e Nuccia Radina” award assigned to M.Z. for the best Geoscience Ph.D. thesis of the University of Bari, Italy. M.L.S. and M.Z. were awarded as part of the European contest “Geomatics on the Move” organized by the European Union Agency for the Space Programme (EUSPA) for the presentation of the ARDAS idea. The computational work was executed on the IT resources of the ReCaS-Bari data center, which have been made available by two projects financed by the MIUR (Italian Ministry for Education, University and Re-search) in the “PON Ricerca e Competitività 2007-2013” Program: ReCaS (Azione I—Interventi di rafforzamento strutturale, PONa3_00052, Avviso 254/Ric) and PRISMA (Asse II—Sostegno all’innovazione, PON04a2_A).

Conflicts of Interest

The authors declare no conflict of interest.

References

  1. Baker, V.R. Geomorphological Understanding of Floods. In Geomorphology and Natural Hazards; Elsevier: Amsterdam, The Netherlands, 1994; pp. 139–156. ISBN 978-0-444-82012-9. [Google Scholar]
  2. Howard, A.J. Managing Global Heritage in the Face of Future Climate Change: The Importance of Understanding Geological and Geomorphological Processes and Hazards. Int. J. Herit. Stud. 2013, 19, 632–658. [Google Scholar] [CrossRef]
  3. Zingaro, M. Advanced Analysis and Integration of Remote Sensing and in Situ Data for Flood Monitoring. Rendiconti Online Della Soc. Geol. Ital. 2021, 54, 41–47. [Google Scholar] [CrossRef]
  4. Merz, B.; Aerts, J.; Arnbjerg-Nielsen, K.; Baldi, M.; Becker, A.; Bichet, A.; Blöschl, G.; Bouwer, L.M.; Brauer, A.; Cioffi, F.; et al. Floods and Climate: Emerging Perspectives for Flood Risk Assessment and Management. Nat. Hazards Earth Syst. Sci. 2014, 14, 1921–1942. [Google Scholar] [CrossRef] [Green Version]
  5. Wohl, E.E. Rivers in the Landscape; John Wiley & Sons Inc.: Hoboken, NJ, USA, 2014; ISBN 978-1-118-41483-5. [Google Scholar]
  6. Rinaldi, M.; Amponsah, W.; Benvenuti, M.; Borga, M.; Comiti, F.; Lucía, A.; Marchi, L.; Nardi, L.; Righini, M.; Surian, N. An Integrated Approach for Investigating Geomorphic Response to Extreme Events: Methodological Framework and Application to the October 2011 Flood in the Magra River Catchment, Italy: Integrated Approach for Investigating Geomorphic Response to Floods. Earth Surf. Process. Landf. 2016, 41, 835–846. [Google Scholar] [CrossRef]
  7. Righini, M.; Surian, N. Remote Sensing as a Tool for Analysing Channel Dynamics and Geomorphic Effects of Floods. In Flood Monitoring through Remote Sensing; Springer International Publishing: Berlin/Heidelberg, Germany, 2018; pp. 27–59. [Google Scholar]
  8. de Musso, N.M.; Capolongo, D.; Caldara, M.; Surian, N.; Pennetta, L. Channel Changes and Controlling Factors over the Past 150 Years in the Basento River (Southern Italy). Water 2020, 12, 307. [Google Scholar] [CrossRef] [Green Version]
  9. Buraas, E.M.; Renshaw, C.E.; Magilligan, F.J.; Dade, W.B. Impact of Reach Geometry on Stream Channel Sensitivity to Extreme Floods: Impact of Reach Geometry on Stream Channel Sensitivity to Floods. Earth Surf. Process. Landf. 2014, 39, 1778–1789. [Google Scholar] [CrossRef]
  10. Rinaldi, M.; Belletti, B.; Bussettini, M.; Comiti, F.; Golfieri, B.; Lastoria, B.; Marchese, E.; Nardi, L.; Surian, N. New Tools for the Hydromorphological Assessment and Monitoring of European Streams. J. Environ. Manage. 2017, 202, 363–378. [Google Scholar] [CrossRef] [PubMed]
  11. Zingaro, M.; Refice, A.; D’Addabbo, A.; Hostache, R.; Chini, M.; Capolongo, D. Experimental Application of Sediment Flow Connectivity Index (SCI) in Flood Monitoring. Water 2020, 12, 1857. [Google Scholar] [CrossRef]
  12. La Salandra, M.; Roseto, R.; Mele, D.; Dellino, P.; Capolongo, D. Probabilistic Hydro-Geomorphological Hazard Assessment Based on UAV-Derived High-Resolution Topographic Data: The Case of Basento River (Southern Italy). Sci. Total Environ. 2022, 842, 156736. [Google Scholar] [CrossRef]
  13. Wang, J.; Shi, B.; Yuan, Q.; Zhao, E.; Bai, T.; Yang, S. Hydro-Geomorphological Regime of the Lower Yellow River and Delta in Response to the Water–Sediment Regulation Scheme: Process, Mechanism and Implication. CATENA 2022, 219, 106646. [Google Scholar] [CrossRef]
  14. Pierdicca, N.; Pulvirenti, L.; Chini, M.; Boni, G.; Squicciarino, G.; Candela, L. Flood Mapping by SAR: Possible Approaches to Mitigate Errors Due to Ambiguous Radar Signatures. In Proceedings of the 2014 IEEE Geoscience and Remote Sensing Symposium, Quebec City, QC, Canada, 13–18 July 2014; pp. 3850–3853. [Google Scholar]
  15. Refice, A.; D’Addabbo, A.; Capolongo, D. Methods, Techniques and Sensors for Precision Flood Monitoring through Remote Sensing. In Flood Monitoring through Remote Sensing; Springer International Publishing: Berlin/Heidelberg, Germany, 2018; pp. 1–25. [Google Scholar]
  16. Schumann, G.; Bates, P.D.; Horritt, M.S.; Matgen, P.; Pappenberger, F. Progress in Integration of Remote Sensing–Derived Flood Extent and Stage Data and Hydraulic Models. Rev. Geophys. 2009, 47, RG4001. [Google Scholar] [CrossRef]
  17. Grimaldi, S.; Li, Y.; Pauwels, V.R.N.; Walker, J.P. Remote Sensing-Derived Water Extent and Level to Constrain Hydraulic Flood Forecasting Models: Opportunities and Challenges. Surv. Geophys. 2016, 37, 977–1034. [Google Scholar] [CrossRef]
  18. Ahamed, A.; Bolten, J.; Doyle, C.; Fayne, J. Near Real-Time Flood Monitoring and Impact Assessment Systems. In Remote Sensing of Hydrological Extremes; Lakshmi, V., Ed.; Springer Remote Sensing/Photogrammetry; Springer International Publishing: Cham, Switzerland, 2017; pp. 105–118. ISBN 978-3-319-43743-9. [Google Scholar]
  19. Zingaro, M.; La Salandra, M.; Colacicco, R.; Roseto, R.; Petio, P.; Capolongo, D. Suitability Assessment of Global, Continental and National Digital Elevation Models for Geomorphological Analyses in Italy. Trans. GIS 2021, 25, 2283–2308. [Google Scholar] [CrossRef]
  20. Krapesch, G.; Hauer, C.; Habersack, H. Scale Orientated Analysis of River Width Changes Due to Extreme Flood Hazards. Nat. Hazards Earth Syst. Sci. 2011, 11, 2137–2147. [Google Scholar] [CrossRef] [Green Version]
  21. Rigon, E.; Moretto, J.; Delai, F.; Picco, L.; Ravazzolo, D.; Rainato, R.; Lenzi, M.A. Application of the New Morphological Quality Index in the Cordevole River (BL, Italy). J. Agric. Eng. 2013, 44. [Google Scholar] [CrossRef]
  22. Bryant, R.G.; Gilvear, D.J. Quantifying Geomorphic and Riparian Land Cover Changes Either Side of a Large Flood Event Using Airborne Remote Sensing: River Tay, Scotland. Geomorphology 1999, 29, 307–321. [Google Scholar] [CrossRef]
  23. Kumar, R.; Kamal, V.; Kumar Singh, R. Geomorphic Effects of 2011 Floods on Channel Belt Parameters of Rapti River: A Remote Sensing and GIS Approach. Corona J. Sci. Technol. 2013, 4–12. [Google Scholar]
  24. Surian, N.; Righini, M.; Lucía, A.; Nardi, L.; Amponsah, W.; Benvenuti, M.; Borga, M.; Cavalli, M.; Comiti, F.; Marchi, L.; et al. Channel Response to Extreme Floods: Insights on Controlling Factors from Six Mountain Rivers in Northern Apennines, Italy. Geomorphology 2016, 272, 78–91. [Google Scholar] [CrossRef]
  25. Hemmelder, S.; Marra, W.; Markies, H.; De Jong, S.M. Monitoring River Morphology & Bank Erosion Using UAV Imagery—A Case Study of the River Buëch, Hautes-Alpes, France. Int. J. Appl. Earth Obs. Geoinf. 2018, 73, 428–437. [Google Scholar] [CrossRef]
  26. Brivio, P.; Colombo, R.; Maggi, M.; Tomasoni, R. Integration of Remote Sensing Data and GIS for Accurate Mapping of Flooded Areas. Int. J. Remote Sens. 2002, 23, 429–441. [Google Scholar] [CrossRef]
  27. de Musso, N.M.; Capolongo, D.; Refice, A.; Lovergine, F.P.; D’Addabbo, A.; Pennetta, L. Spatial Evolution of the December 2013 Metaponto Plain (Basilicata, Italy) Flood Event Using Multi-Source and High-Resolution Remotely Sensed Data. J. Maps 2018, 14, 219–229. [Google Scholar] [CrossRef]
  28. Refice, A.; Zingaro, M.; D’Addabbo, A.; Chini, M. Integrating C- and L-Band SAR Imagery for Detailed Flood Monitoring of Remote Vegetated Areas. Water 2020, 12, 2745. [Google Scholar] [CrossRef]
  29. Albertini, C.; Gioia, A.; Iacobellis, V.; Manfreda, S. Surface Water Detection and Flood Mapping Using Optical Remote Sensing and Water-Related Spectral Indices; Copernicus Meetings: Göttingen, Germany, 2022. [Google Scholar]
  30. Manfreda, S.; Sole, A.; Di Leo, M. Detection of Flood-Prone Areas Using Digital Elevation Models. J. Hydrol. Eng. 2011, 16, 781–790. [Google Scholar] [CrossRef]
  31. Alfieri, L.; Salamon, P.; Bianchi, A.; Neal, J.; Bates, P.; Feyen, L. Advances in Pan-European Flood Hazard Mapping. Hydrol. Process. 2014, 28, 4067–4077. [Google Scholar] [CrossRef]
  32. Revilla-Romero, B.; Wanders, N.; Burek, P.; Salamon, P.; de Roo, A. Integrating Remotely Sensed Surface Water Extent into Continental Scale Hydrology. J. Hydrol. 2016, 543, 659–670. [Google Scholar] [CrossRef] [PubMed]
  33. Hostache, R.; Chini, M.; Giustarini, L.; Neal, J.; Kavetski, D.; Wood, M.; Corato, G.; Pelich, R.; Matgen, P. Near-Real-Time Assimilation of SAR-Derived Flood Maps for Improving Flood Forecasts. Water Resour. Res. 2018, 54, 5516–5535. [Google Scholar] [CrossRef]
  34. Manfreda, S. Use of Unmanned Aerial Systems for Hydrological Monitoring; Copernicus Meetings: Göttingen, Germany, 2020. [Google Scholar]
  35. Di Mauro, C.; Hostache, R.; Matgen, P.; Pelich, R.; Chini, M.; van Leeuwen, P.J.; Nichols, N.; Blöschl, G. A Tempered Particle Filter to Enhance the Assimilation of SAR-Derived Flood Extent Maps into Flood Forecasting Models. Water Resour. Res. 2022, 58, e2022WR031940. [Google Scholar] [CrossRef]
  36. Langat, P.K.; Kumar, L.; Koech, R. Monitoring River Channel Dynamics Using Remote Sensing and GIS Techniques. Geomorphology 2019, 325, 92–102. [Google Scholar] [CrossRef]
  37. Nath, R.K.; Deb, S.K. Water-Body Area Extraction from High Resolution Satellite Images-An Introduction, Review, and Comparison. Int. J. Image Processing (IJIP) 2010, 3, 265–384. [Google Scholar]
  38. Sghaier, M.O.; Foucher, S.; Lepage, R.; Dahmane, M. Combination of Texture and Shape Analysis for a Rapid Rivers Extraction from High Resolution SAR Images. In Proceedings of the 2016 IEEE International Geoscience and Remote Sensing Symposium (IGARSS), Beijing, China, 10–15 July 2016; IEEE: Manhattan, NY, USA, 2016. [Google Scholar] [CrossRef]
  39. Li, D.; Wang, G.; Qin, C.; Wu, B. River Extraction under Bankfull Discharge Conditions Based on Sentinel-2 Imagery and DEM Data. Remote Sens. 2021, 13, 2650. [Google Scholar] [CrossRef]
  40. Capolongo, D.; Refice, A.; Bocchiola, D.; D’Addabbo, A.; Vouvalidis, K.; Soncini, A.; Zingaro, M.; Bovenga, F.; Stamatopoulos, L. Coupling Multitemporal Remote Sensing with Geomorphology and Hydrological Modeling for Post Flood Recovery in the Strymonas Dammed River Basin (Greece). Sci. Total Environ. 2019, 651, 1958–1968. [Google Scholar] [CrossRef] [PubMed]
  41. Samela, C.; Troy, T.J.; Manfreda, S. Geomorphic Classifiers for Flood-Prone Areas Delineation for Data-Scarce Environments. Adv. Water Resour. 2017, 102, 13. [Google Scholar] [CrossRef]
  42. Totaro, V.; Peschechera, G.; Gioia, A.; Iacobellis, V.; Fratino, U. Comparison of Satellite and Geomorphic Indices for Flooded Areas Detection in a Mediterranean River Basin. In Proceedings of the Computational Science and Its Applications—ICCSA 2019; Misra, S., Gervasi, O., Murgante, B., Stankova, E., Korkhov, V., Torre, C., Rocha, A.M.A.C., Taniar, D., Apduhan, B.O., Tarantino, E., Eds.; Springer International Publishing: Cham, Switzerland, 2019; pp. 173–185. [Google Scholar]
  43. Matgen, P.; Giustarini, L.; Chini, M.; Hostache, R.; Wood, M.; Schlaffer, S. Creating a Water Depth Map from SAR Flood Extent and Topography Data. In Proceedings of the 2016 IEEE International Geoscience and Remote Sensing Symposium (IGARSS), Beijing, China, 10–15 July 2016; pp. 7635–7638. [Google Scholar]
  44. Wood, M.; Hostache, R.; Neal, J.; Wagener, T.; Giustarini, L.; Chini, M.; Corato, G.; Matgen, P.; Bates, P. Calibration of Channel Depth and Friction Parameters in the LISFLOOD-FP Hydraulic Model Using Medium-Resolution SAR Data and Identifiability Techniques. Hydrol. Earth Syst. Sci. 2016, 20, 4983–4997. [Google Scholar] [CrossRef] [Green Version]
  45. La Salandra, M.; Miniello, G.; Nicotri, S.; Italiano, A.; Donvito, G.; Maggi, G.; Dellino, P.; Capolongo, D. Generating UAV High-Resolution Topographic Data within a FOSS Photogrammetric Workflow Using High-Performance Computing Clusters. Int. J. Appl. Earth Obs. Geoinf. 2021, 105, 102600. [Google Scholar] [CrossRef]
  46. Westoby, M.J.; Brasington, J.; Glasser, N.F.; Hambrey, M.J.; Reynolds, J.M. ‘Structure-from-Motion’ Photogrammetry: A Low-Cost, Effective Tool for Geoscience Applications. Geomorphology 2012, 179, 300–314. [Google Scholar] [CrossRef] [Green Version]
  47. Tamminga, A.D.; Eaton, B.C.; Hugenholtz, C.H. UAS-Based Remote Sensing of Fluvial Change Following an Extreme Flood Event: UAS REMOTE SENSING OF FLOOD EFFECTS. Earth Surf. Process. Landf. 2015, 40, 1464–1476. [Google Scholar] [CrossRef]
  48. Karamuz, E.; Romanowicz, R.J.; Doroszkiewicz, J. The Use of Unmanned Aerial Vehicles in Flood Hazard Assessment. J. Flood Risk Manag. 2020, 13, e12622. [Google Scholar] [CrossRef]
  49. Lee, J.; Wang, J.; Crandall, D.; Sabanovic, S.; Fox, G. Real-Time, Cloud-Based Object Detection for Unmanned Aerial Vehicles. In Proceedings of the 2017 First IEEE International Conference on Robotic Computing (IRC), Taichung, Taiwan, 10–12 April 2017; pp. 36–43. [Google Scholar]
  50. la Salandra, M.; Capolongo, D.; Pennella, V.; Nicotri, S.; Donvito, G. Application of Uav System and Sfm Techniques to Develop High-Resolution Terrain Models. In River Flow; CRC Press: Boca Raton, FL, USA, 2020; pp. 855–861. [Google Scholar]
  51. Eltner, A.; Sofia, G. Structure from Motion Photogrammetric Technique. In Developments in Earth Surface Processes; Elsevier: Amsterdam, The Netherlands, 2020; Volume 23, pp. 1–24. ISBN 978-0-444-64177-9. [Google Scholar]
  52. Snavely, N.; Seitz, S.M.; Szeliski, R. Modeling the World from Internet Photo Collections. Int. J. Comput. Vis. 2008, 80, 189–210. [Google Scholar] [CrossRef] [Green Version]
  53. Lowe, D.G. Distinctive Image Features from Scale-Invariant Keypoints. Int. J. Comput. Vis. 2004, 60, 91–110. [Google Scholar] [CrossRef]
  54. Triggs, B.; McLauchlan, P.F.; Hartley, R.I.; Fitzgibbon, A.W. Bundle Adjustment—A Modern Synthesis. In Vision Algorithms: Theory and Practice; Triggs, B., Zisserman, A., Szeliski, R., Eds.; Lecture Notes in Computer Science; Springer: Berlin/Heidelberg, Germany, 2000; Volume 1883, pp. 298–372. ISBN 978-3-540-67973-8. [Google Scholar]
  55. Furukawa, Y.; Curless, B.; Seitz, S.M.; Szeliski, R. Towards Internet-Scale Multi-View Stereo. In Proceedings of the 2010 IEEE Computer Society Conference on Computer Vision and Pattern Recognition, San Francisco, CA, USA, 13–18 June 2010; pp. 1434–1441. [Google Scholar]
  56. Belletti, B.; Rinaldi, M.; Buijse, A.D.; Gurnell, A.M.; Mosselman, E. A Review of Assessment Methods for River Hydromorphology. Environ. Earth Sci. 2015, 73, 2079–2100. [Google Scholar] [CrossRef]
  57. Gurnell, A.M.; Rinaldi, M.; Belletti, B.; Bizzi, S.; Blamauer, B.; Braca, G.; Buijse, A.D.; Bussettini, M.; Camenen, B.; Comiti, F.; et al. A Multi-Scale Hierarchical Framework for Developing Understanding of River Behaviour to Support River Management. Aquat. Sci. 2016, 78, 1–16. [Google Scholar] [CrossRef]
  58. Hein, G.W. From GPS and GLONASS via EGNOS to Galileo—Positioning and Navigation in the Third Millennium. GPS Solut. 2000, 3, 39–47. [Google Scholar] [CrossRef]
  59. OECD. OECD Handbook on Measuring the Space Economy; OECD: Paris, France, 2012; ISBN 978-92-64-12180-5. [Google Scholar]
Figure 1. Examples of river boundary extraction from RS data through different image-processing algorithms. (1) River extraction along the Zambezi reach (Mozambique) from a Sentinel−1 SAR image acquired on 15 July 2015 (a), by applying texture analysis through pixel-based homogeneity computation (b) and the threshold operator of the resulting values into the set region boundaries (c). (2) River extraction along the Zambezi reach (Mozambique) from a Sentinel−2 multispectral image acquired on 28 September 2016 (a), by applying the normalized difference vegetation index (NDVI) (b) and the threshold operator of the resulting values into the set region boundaries (c). (3) River extraction along the Basento reach (Italy) from a very-high spatial resolution (1 cm) ortho-photomosaic derived from drone images (a) (through the ARDAS system, see below), by applying algorithms of edge detection through a Sobel filter (b) and unsupervised k-means clustering (c) that distinguish the bars in the channel.
Sustainability 14 14093 g001
Figure 2. Examples of RS data integration in flood monitoring. (1) Photographs of flood event effects (ad) in the historical site of Metaponto (Basilicata, Italy) and maps of the inundated area (A), with the different water extents detected by optical and SAR images (BD). Figure from [27]. (2) Flood map deriving from the integration of multi-frequency SAR data. Figure from [28]. (3) Map of the sediment flow connectivity index of an area of the Severn River catchment (UK), overlaid with the water extent borders (blue line) of the flood event (left) and a comparison with aerial photography (right), showing the flooded areas (top, red box) corresponding to high sediment connectivity areas (in red) and non-flooded areas (bottom, yellow box) corresponding to low sediment connectivity areas (in green). Figure from [11].
Sustainability 14 14093 g002
Figure 3. Detection and processing sequences of the ARDAS system: (1) acquisition of UAV data; (2) NRT processing in the cloud environment; (3) application of the photogrammetric workflow through SfM techniques; (4) processing of the multi-temporal VHR ortho-photomosaic and DEM for hydro-geomorphological analysis.
Sustainability 14 14093 g003
Figure 4. Output generated by the ARDAS application in Basilicata (Southern Italy) (a) along a reach of the Basento River catchment (respectively, the red spots and green borders in (b)): ortho-photomosaic (c) and DEM (d).
Sustainability 14 14093 g004
Figure 5. (a) DEM of Difference between 2019 and 2021, showing channel deposition (blue) and erosion (red) along the reach. The black segment indicates the trace of the cross−section shown below. Basemap: Google Satellite. (b) Multi−temporal river cross-section comparison (2019–2021) and flood discharge area estimation (A) for each river cross-section (2019 and 2021).
Sustainability 14 14093 g005
Figure 6. Map of the channel displacement with the extraction and overlap of channel location relative to 2019 (green) and 2021 (light blue) and the indication of the corresponding sinuosity index. Basemap: Google Satellite.
Sustainability 14 14093 g006
Figure 7. Future development of the ARDAS system with integration of some sequences (indicated by orange circles): (1) Galileo and EGNOS systems; (2) acquisition of the UAVs’ fleet data; (3) RT transmission into the cloud environment (see Section 2.1); (4) application of the photogrammetric workflow through SfM techniques (see Section 2.1); (5) processing of the multi-temporal VHR ortho-photomosaic and DEM (see Section 2.1); (6) automation algorithms for extrapolation and analysis of the hydro-geomorphological features and parameters (7).
Sustainability 14 14093 g007
Table 1. Synthetic list of hydro-geomorphological parameters with their corresponding definitions and components, potential remote detection techniques, and RS data. DEM = digital elevation model. O = optical sensor. S = SAR sensor. UAV = unmanned aerial vehicle. InSAR = interferometric SAR. LiDAR = light detection and ranging. VHR = very-high resolution. NDVI = normalized difference vegetation index. PolSAR = polarimetric SAR. PSI = permanent scatterer indicators.
HYDRO-GEOMORPHOLOGICAL PARAMETERSREMOTE DETECTION TECHNIQUESREMOTE SENSING DATA
DefinitionComponentsIndirect ModalityDirect Modality
Confinement Degree *
length of the banks;
length of the confined banks
Channel boundary digitalization and measurementChannel boundary extraction (spatial filtering, segmentation, pattern recognition)DEM, satellite (O, S), aerial and UAV imagery
Confinement Index *
width of the channel;
width of the floodplain
Channel and floodplain boundary digitalization and measurementChannel boundary extraction:
channel area/reach length from river axis (average width)
DEM, satellite (O, S), aerial and UAV imagery
Planimetric Channel Index * (sinuosity, anabranching, etc.)
length of the river axis;
length of the orientation axis
number of channels in riverbed
Channel boundary digitalization and measurementChannel boundary extractionSatellite (O, S), aerial and UAV imagery
Discontinuity of riverbed slope *
longitudinal profile
-Longitudinal profile extraction from InSAR and LiDAR derived DEMDEM
Hydrological Discontinuity *,†
tributaries along the reach
Tributaries detection-VHR satellite (O), aerial and UAV imagery, DEM
Artificiality (human-induced elements)
embankments, dams, bridles etc. in the reach
Elements detection-VHR satellite (O), aerial and UAV imagery
Sediment Connectivity Index
structural components (slope, land cover, surface roughness, etc.);
functional components (soil stability, water storage capacity etc.)
-Slope from InSAR-LiDAR derived DEM;
Land cover recognition (supervised algorithms);
Surface roughness detection through the measurement of Haralik features
DEM, satellite (O, S), aerial and UAV imagery
Section Variability
presence of river bars, vegetation and/or boulders in riverbed etc.
Elements detection-VHR satellite (O), aerial and UAV imagery
Banks Erodibility
types of banks;
retreat rate;
presence of embankments etc.
Only for banks retreat: multi-temporal analysis of imagesOnly for banks retreat:
measurement of the shift derived from the multi-temporal comparison of channel
VHR satellite (O, S), aerial and UAV imagery
Presence of Large Wood Material
transport of wood material;
density of wood material
Large wood detection-VHR satellite (O), aerial and UAV imagery
Width and Extent of Vegetation Band *,†
width of riparian vegetation band;
extent of riparian vegetation band
Vegetation band detection (mapping)Vegetation band extraction (segmentation and pattern recognition; NDVI index and other ones; InSAR and PolSAR)Satellite (O, S), aerial and UAV imagery
Slopes Instability
density and frequency of landslides along the reach;
solid flux in the reach
Only for the landslides:
slopes and channel observations
Only for the landslides:
multi-temporal InSAR (PSI)
Satellite (O, S), aerial and UAV imagery
* Parameter detectable only remotely; thus, without the integration of in situ data. † Parameter directly connected to flood hazard valuation.
Table 2. Quantitative comparison of ARDAS with CPP.
ARDASCPP
RMSE (m)X0.860.92
Y1.110.96
Z1.301.57
TIME (min)9002400
Publisher’s Note: MDPI stays neutral with regard to jurisdictional claims in published maps and institutional affiliations.

