Article

Evolution of Ecological Patterns of Poyang Lake Wetland Landscape over the Last One Hundred Years Based on Historical Topographic Maps and Landsat Images

1
Department of History, Jinan University, Guangzhou 510632, China
2
School of Geography and Environmental Engineering, Gannan Normal University, Ganzhou 341000, China
*
Author to whom correspondence should be addressed.
Sustainability 2022, 14(13), 7868; https://doi.org/10.3390/su14137868
Submission received: 4 May 2022 / Revised: 21 June 2022 / Accepted: 22 June 2022 / Published: 28 June 2022
(This article belongs to the Special Issue Geomorphological Mapping for the Geoheritage Resources Sustainability)

Abstract

:
Ecological pattern evolution of Poyang Lake wetland, the largest freshwater lake in China, is critical for regional ecological protection and sustainable development of migratory bird habitats; however, this information is still not fully explored. In this study, we quantitatively reconstructed the spatial distribution and landscape ecological pattern of Poyang Lake wetlands in three periods in the past 100 years based on the military topographic map in the 1930s and the Landsat satellite remote sensing image data in 1979 and 2021. Further, use the Fragstats software to analyze the ecological pattern index of wetland reconstruction results. The results show that the wetland area in the Poyang Lake region has experienced a continuous reduction process over the past 100 years, and it decreased from 3857 km2 in the 1930s to 3673 km2 in the 1970s, and then to 3624 km2 in the 2020s. The current wetland area has decreased by about 6.04% compared with the 1930s. The general trend of changes in the spatial pattern of Poyang Lake wetlands is that the surface water decreases and the open land increases. Nevertheless, the trend has certain spatial differences as a large area of wetlands disappeared in the southwest and west of Poyang Lake and the areas with enlarged wetland density values mainly appeared in the northeastern and northern parts of the study area. The NP (number of patches) in the wetlands of Poyang Lake over the past 100 years showed a downward trend during the 1930s–1970s, and an increasing trend during the 1970s–2010s. Due to the increases of constructed wetlands, the number and density of patches also increased, and PD (patch density) reached a maximum value of 0.142 in 2020s. The LPI (largest patch index) has shown a gradual downward trend in the past 100 years. Compared with the 1930s, the wetlands in 2020s dropped by about 26.64%, and the wetlands further showed a trend of fragmentation. The AI index, which indicates the concentration of wetland patches, reached the maximum value in 2020s, but the LSI (landscape shape index) showed a downward trend in general, indicating that the shape of wetland patches has been simplified over the past 100 years. The research results can provide basic data and decision-making basis for Poyang Lake wetland protection, construction of migratory bird reserve and regional sustainable development.

1. Introduction

Wetland is a special ecosystem between land and water, with rich animal and plant resources and biodiversity [1,2,3]. Changes in the ecological pattern of wetland landscapes have a significant impact on ecosystem functions [4,5], such as system resilience, biodiversity, and protection of important wildlife habitats [6,7]. Studies have shown that with the increasing intensity of urbanization and human disturbance, the ecological pattern of wetland landscapes at a global scale has undergone divergent changes [8,9]. High-intensified human activities may cause irreparable damage to wetlands [10,11]. According to a survey by the World Organization for Economic Cooperation and Development, about half of the world’s natural wetlands have disappeared since the beginning of the 20th century. Especially in the surrounding areas of cities, the disappearance of various natural wetlands, the reduction of wetland patches and the sharp decline in connectivity between wetlands make the rational assessment of wetland ecological functions become one of the hotspots of current research [12]. Studies in East Asia also show that climate change has played a leading role in the changes of natural wetlands in the Yellow River Delta [13,14], Baiyangdian Lake [15], Dongting Lake [16] and other regions under the superimposed effect of human socioeconomic development and other factors. At the same time, the large-scale development of agriculture has also had an important impact on the reduction of natural wetlands in the Northeast Sanjiang Plain [17].
In the context of rising global temperatures, wetlands are often at risk of degradation and shrinkage. Affected by climate change, the North American prairie [18], the Ogun River basin wetland in Nigeria [19], the Tuz Lake wetland in Turkey [20], the swamp wetland in Sweden [21], and the wetland in Canada [22] etc., there has been a relatively serious trend of wetland area reduction and the risk of changing the ecological security pattern. On the other hand, due to the impact of global environmental changes, the hydrological connectivity of lake wetlands has also been largely destroyed. Studies in the Amazon Basin show that in the past 30 years [23], the hydrological connectivity of the region has been affected by various factors such as natural and human, and a large number of lakes and wetlands have been blocked or destroyed due to dam construction. Studies have also shown that changes in the lake and wetland environment in many plains will lead to the deterioration of the habitat ecological environment of animals and plants, and further affect ecological security [24,25].
Wetland affect the ecological environment through different mechanisms [26], among which the ecological environment effect of wetlands at the scale of landscape pattern is particularly important. The wetland landscape pattern reveals the ecological effects of different shapes and geometric spatial arrangements [27,28,29]. Such a landscape pattern not only is the result of the evolution of different processes of the ecological environment, but also has an impact on the later change process of the ecological environment [30]. In order to better study the evolution of wetland landscape ecological pattern and its response to environmental changes in long-term series, the wetland range in different years is usually extracted from satellite remote sensing images in different periods [31,32,33]. Then, the ecological effects and change laws of wetland changes were quantified based on the change of the landscape ecological pattern index [34,35]. Therefore, it is of great significance to reconstruct the long-term wetland landscape pattern change sequence for improving the prediction accuracy of future change trends and the effectiveness of simulations.
Due to the limitation of data sources, and considering that satellite remote sensing data can only be traced back to about 1970s, it is critical to explore new data sources to study the pattern of changes in typical regional wetland landscapes in the past century [36,37,38]. Many researchers have begun to use land use data (e.g., local chronicles and archives) to carry out long-term land use and lake reconstruction. However, this method is generally more suitable for large-scale regional wetland reconstruction, as these data cannot describe the specific land use change process in the detailed space, and it is difficult to provide the specific wetland and lake change process at the patch scale. In recent years, a batch of high-precision measured military topographic map data during the Republic of China has been excavated one after another, which has had a great impact on the research fields of land use reconstruction, urbanization level, and lake evolution in the past century [39,40,41,42]. The relevant research shows that the error range of the 1:50,000 topographic map in the Republic of China is about 1/4000~1/1000 [43]. Therefore, this batch of historical data can be used to greatly extend the evolution sequence of wetland landscape ecological pattern, and based on this, we can discuss the change pattern of wetlands on the scale of nearly a hundred years, and provide a basic boundary for the simulation and prediction of regional wetland pattern [44].
Poyang Lake is the largest freshwater lake in China. It is located at the hub of the world’s major migratory bird migration routes. Every winter, a large number of migratory birds spend the winter and multiply in the Poyang Lake wetland area. Furthermore, it is an important wetland of global ecological significance. However, most the existed studies about the ecological pattern evolution of Poyang Lake wetland landscape is derived from short-term satellite image materials. In this study, we analyzed the landscape ecological pattern change process of Poyang Lake wetland over the past 100 years, and explored the driving factors of the change based on the historical topographic map and Landsat remote sensing image data.

2. Materials and Methods

2.1. Overview of the Study Area

This paper takes Poyang Lake, the largest freshwater lake in China, as an example, and selects the main lake area of Poyang Lake, where the wetland distribution is relatively concentrated. The spatial range of the study area is 115°45′ E~116°45′ E, 28°20′ N~29°45′ N (Figure 1). According to the relevant research results and the topographical features of Poyang Lake, the entire lake area is divided into three regions: the north, the middle and the south part. Poyang Lake, as an important river-connecting lake and migratory bird habitat in the middle reaches of the Yangtze River, has important ecological significance. Poyang Lake is a huff and puff type, seasonal lake, and the water level varies greatly during the year. When the water level is high, there will be “a flood”, and when the water level is low, there will be “one line of water”. Rivers such as Ganjiang River, Fuhe River, and Xinjiang River flow into Poyang Lake from south to north, and form a large area of shoals and wetlands [45]. Since the population and major industries and agriculture of Jiangxi Province are concentrated in the Poyang Lake Plain and its surrounding areas, as well as Nanchang, the capital city of Jiangxi Province, is less than 100 km away from the main lake area of Poyang Lake. In general, the Poyang Lake region is faced with relatively prominent problems such as conflicts between economic development and ecological protection. This study uses military topographic maps in the 1930s and Landsat satellite remote sensing image data in 1979 and 2021 to study the evolution of wetland area and landscape ecological pattern in the Poyang Lake in the past 100 years. The research results can provide basic data and decision-making basis for Poyang Lake wetland protection, construction of migratory bird reserve and regional sustainable development.

2.2. Historical Topographic Map Data

The reconstruction of the wetlands in the Poyang Lake in the 1930s was mainly carried out by using the military topographic maps of various provinces and regions in China that were drawn by the Japanese invaders in the 1930s, mainly including topographic map data of 1:100,000 and 1:50,000 [46]. In recent years, these military topographic maps have been digitized and spatialized by many scholars [47] and the Institute of Modern History of the Academia Sinica [48,49], which is available from https://map.rchss.sinica.edu.tw/cgi-bin/gs32/gsweb.cgi (accessed on 19 January 2022). In this study, the map related to Poyang Lake in this set of topographic maps were digitized and spatially registered on the ArcGIS 10.2 platform (Figure 2). Since the topographic map of 1:50,000 is more detailed than 1:100,000, the military topographic maps covering the Poyang Lake area are all 1:50,000 measured topographic maps, a total of 26 pieces. According to the chronology of the topographic map, most of the maps were made between 1927 and 1937, and the specific surveying and mapping time should be earlier than the plate making time, which can represent the distribution pattern of lakes and wetlands in the Poyang Lake area from 1920s to 1930s. In order to ensure the accuracy of registration, it is repeatedly fine-tuned using the relevant topographic maps of the 1950s and landmark locations such as peaks and landforms in modern remote sensing images. For topographic maps without latitude and longitude, we generally find more than four landmarks and perform geo-referencing with topographic maps or remote sensing images with spatial information to ensure the spatial accuracy of topographic maps. After completing the spatial registration of the topographic map, the Polygon tool in ArcGIS was used to reconstruct and measure the area of the Poyang Lake wetlands in the 1930s, and finally restore the spatial pattern of wetland distribution.

2.3. Landsat Remote Sensing Data

We used the Landsat satellite remote sensing image data to reconstruct the wetlands in Poyang Lake in the 1970s and 2020s. The download address is http://www.landcover.org/data/landsat/ (accessed on 21 January 2022). The specific selection criteria are as follows: the image resolution is higher than 60 m; the images in the Poyang Lake area are relatively clear, and various types of beaches and wetlands are clearly displayed; the cloudiness in the lake area is less than 10%. Finally, this study selected the remote sensing images of the lake area on 2 July 1979 and 8 August 2021 as the basic data on the spatial distribution pattern of wetlands in Poyang Lake in the 1970s and 2020s. Visual interpretation was performed based on ENVI 5.3 software to extract various water surface and wetland ranges.

2.4. Long-Term Wetland Reconstruction Analysis Process

Using ArcGIS 10.2 platform (Redlands, CA, USA, Available online: https://desktop.arcgis.com/es/ (accessed on 2 January 2022)), based on the Poyang Lake wetland range in the 1930s and the wetland range in the 1970s and 2020s, the proportion of wetlands was calculated on the basis of 1′ × 1′ grid division. The spatial distribution of wetland ratios in the entire study area was obtained by interpolation using the kriging spatial analysis method. Finally, the raster map of the spatial distribution of wetland ratios in three periods was used to calculate the changes in different periods, and the changes in the spatial pattern of wetlands in the three time periods of 1930s~1970s, 1970s~2020s, and 1930s~2020s were obtained.
Fragstats 4.2 software [50,51] was used to process the spatial distribution grids of wetlands in three periods, and various landscape pattern indexes of wetlands in Poyang Lake in three periods were obtained. These index including (Table 1): total area of patches (TA), number of patches (NP), patch density (PD), largest patch index (LPI), total edge (TE), average edge density (ED), landscape shape index (LSI), perimeter-area fractal dimension (PAFRAC), contagion (CONTAG), splitting index (SPLIT), patch richness (PR), patch richness density (PRD), Shannon’s diversity index (SHDI), Shannon’s evenness index (SHEI), and aggregation index (AI), etc. [52,53,54,55].

3. Results and analysis

3.1. Reconstruction of Wetland Morphology

The reconstruction results are shown in Figure 3. In the 1930s, the Poyang Lake area and wetlands were widely distributed except for the southeastern part of the study area, where there were few wetlands and water patches. Beginning in the 1970s, large-scale wetland patches began to decrease in the western and southern parts of the study area, while wetlands and small areas of water became large areas of water in the eastern part of the study area, and some scattered wetlands began to merge. The reason for this phenomenon is likely to be that the eastern part of the study area is close to major cities such as Nanchang. Under the driving force of urbanization, substantial wetlands and water areas have been converted into urban construction land. The eastern part of the study area may be due to the construction of artificial waters and other factors, the small water surface gradually merged into a large area of water.
The northern part of the study area is relatively narrow compared to the main lake area. From 1930s to 1970s, it experienced shrinkage and reduction of surrounding wetlands. From 1970s to 2020s, the lake surface widened, but the fjord-like wetlands on both sides of the lake area reappeared. The reconstruction results in the 2020s show that the small wetlands in the southern part of the study area have largely disappeared, and the main lake area of Poyang Lake has also been divided into several sub-regions. In the southeast of the study area, there are a large number of independent water areas with small sizes, and the reason may be related to the construction of water conservancy in the Gan-Fu Plain and the construction of various reservoirs in this area. From the perspective of changes in wetland area, the Poyang Lake has experienced a continuous decline, that is, from 3857 km2 in the 1930s to 3673 km2 in the 1970s, and then to 3624 km2 in the 2020s. Overall, the current wetland area is approximately 233 km2 less than the maximum in the 1930s.

3.2. Reconstruction of Wetland Density

The study area was divided into 1′ × 1′ grids, and the wetland area density in each grid was calculated, and the spatial distribution pattern of wetland density in Poyang Lake was obtained by using the kriging interpolation method (Figure 4). We can find that the central part of the study area belongs to the area with high wetland density, and the general ratio is more than 90%, which is also the main lake area of Poyang Lake. Other areas with higher wetland density are mainly distributed in the east and west of the study area, and the density values are in the range of 20–70%. The areas with a density value below 10% are mainly distributed in the southeastern part of the study area. From the topographical point of view, this area mainly belongs to the hilly area, and there are few types of waters. The changes of wetland density in different periods are mainly reflected in the decrease of the density value in the west and southwest of the study area, and the increase in the density in the east.

3.3. Evolution of Wetland Density

In order to further quantitatively discuss the change process of wetland pattern in Poyang Lake in three periods over the past 100 years, we used Poyang Lake wetland density in the 1930s, 1970s, and 2020s to conduct grid operations to obtain wetland change values in the three periods: 1970s–1930s, 2020s–1970s and 2020s–1930s (Figure 5). The blue area with a value of 1 is the area that becomes water in the corresponding period, and the area with a value of −1 is the area that becomes land. Therefore, it can be seen from Figure 5a that during the period from 1930s to 1970s, many areas in the study area were transformed into waters and wetlands, and the western part of this period belonged to the expansion period of wetland area. During the period from 1970s to 2010s (Figure 5b), the area of wetlands decreased greatly, while the areas converted from wetlands to land increased significantly. Figure 5c shows that during the nearly 100-year scale from 1930s to 2010s, the overall trend of changes in the spatial pattern of wetlands in Poyang Lake was that the water surface decreased and the land increased. The wetland changes in the study area have certain spatial differences, that is, a large area of wetland disappears in the central and western parts of the study area; areas with increased wetland density values mainly appear in the eastern and northern parts of the study area.

3.4. Reconstruction of Wetland Landscape Ecological Pattern

Based on Fragstats 4.2 software (Amherst, MA, USA, Available online: http://www.umass.edu/landeco/research/fragstats/fragstats.html (accessed on 1 June 2021)), various landscape ecological pattern indices of Poyang Lake wetland in three periods over the past 100 years were calculated. The percentage change results of each index are shown in Figure 6. The change of TA (total patch area) value over the past 100 years is a continuous decrease, which is consistent with the change of wetland area value calculated by ArcGIS 10.2 platform. NP (patch number) showed a downward trend from 455 to 393 during 1930s~1970s, indicating that the larger area of water patches was increasing during this period, and with the decrease of the number of patches, the total wetland area was also decreased. The NP value increased to 516 from 1970s to 2010s, mainly due to the increase of constructed wetland patches in some areas. PD (patch density) also showed a pattern of high at two ends and low in the middle, especially in 2020s, the patch density reached a maximum of 0.142, indicating that although the total area of wetlands was low during this period. Due to the increase of constructed wetlands, the number and density of patches also increased. On the other hand, the LPI (largest patch index) showed a trend of first decreasing and then increasing in the past 100 years. Compared with the 1930s, the 1970s decreased by about 42.7%. This also shows that the Poyang Lake wetlands further showed a trend of fragmentation during the period from 1930s to 1970s. From 1970s to 2020s, the LPI began to rise, from 16.06 to 20.57, indicating that small-scale wetland patches were decreasing. The AI (aggregation index) has been on an upward trend in the past 100 years and reached a maximum value in the 2020s, indicating that wetland patches were most concentrated during this period. The LSI (landscape shape index) generally showed a downward trend, with a maximum value of 21.72 in the 1930s, indicating that the shape of wetland patches has tended to simplify in the past century, mainly because the boundaries of natural water bodies are more complex than artificial water bodies. The PAFRAC (perimeter-area fractal dimension index) decreased from 1.415 in 1930s to 1.319 in 2020s, indicating that the complexity of Poyang Lake wetlands has been decreasing in the past century, and the wetlands have shown a simplification trend in morphology. The CONTAG (contagion) index generally showed a downward trend, while the SPLIT (splitting index) showed an upward trend, which also showed that the connectivity of Poyang Lake wetlands decreased and the degree of segmentation increased. The PR (patch richness) and PRD (patch richness density) showed a trend of first decreasing and then increasing over the past 100 years, indicating that human activities have an important impact on the landscape pattern of wetlands. From the 1930s to the 1970s, several patches in Poyang Lake Wetland were greatly reduced and simplified due to human activities, especially the reclamation of the lake by humans. The increase in the relevant index from the 1970s to the 2020s was mainly due to the implementation of protection measures such as lake management and water conservancy project development, which reversed this trend. The SHDI (Shannon’s diversity index) and SHEI (Shannon’s evenness index) have generally shown an upward trend in the past century, indicating that the large-area patch water in the Poyang Lake wetland has decreased and the wetland patch diversity has increased. This is also in line with the general trend of land development in the Lake District.

3.5. Heterogeneity of Wetland Landscape Ecological Pattern

Judging from the changes in the spatial distribution pattern of wetlands in the three sub-regions of North, Central and South, there are certain differences in the landscape pattern during the period from 1930s to 2020s. The changes in the northern region are relatively small, while the central and southern regions have more obvious changes. There were significant changes in wetland area, patch number and patch complexity.

4. Discussion

4.1. Consistency of Wetland Reconstruction over Long Time Scales

Historical map data can greatly extend the time series of changes in ecological landscape patterns, and become an important supplement to remote sensing image data. In recent years, many researchers at home and abroad have begun to use map data with modern surveying and mapping information to reconstruct historical land use [56,57]. However, in terms of how to use historical surveying and mapping maps reasonably, special attention should be paid to the verification of surveying and mapping accuracy. According to Pan et al. [43] on the military map of Shanghai during the Republic of China, the error is mainly formed by small triangulation, and it is generally believed that the range is between 1/4000 and 1/1000. At the same time, our previous research also found that the error of the surveying and mapping military topographic map of the Republic of China in Jiangxi in the 1930s was less than 10% in terms of urban area value [47], so this batch of historical maps can be used for related research. The results of this paper also show that the 1930s military topographic map can be used for reconstruction of historical waters after spatial registration and fine-tuning of landmarks, and the results match well with the aerial topographic map before and after the 1950s. Nonetheless, adequate comparisons should be made when using historical topographic maps, and interpretations of results should be validated against other sources.

4.2. Driving Factors for Changes in Wetland Landscape Ecological Pattern

The past 100 years have been a period when human activities have significantly affected land use change. This study used historical map information to extend the long-term change sequence of wetlands in Poyang Lake from 1930s to 2020s, and revealed the process of land use change under the influence of different factors. Previous studies have shown that there are large differences in the pattern of land use change between the agriculturalization stage and the industrialization stage [58]. The wetland change in the Poyang Lake area also reflects the difference in the pattern change in different historical stages. During the period from 1930s to 1970s, agricultural development can be considered as the main driving force of wetland changes in this region. From Figure 5a, it can be seen that the wetlands in the west bank of Poyang Lake, which are densely populated, have decreased more, which is directly related to the reclamation activities in this time period. Moreover, the NP (patch number) value dropped from 455 to 393, indicating that a large number of small wetlands were converted to other land covers. The increase in wetland area during this period was mainly by the implementation of water conservancy projects such as river and lake improvement in the eastern and southern regions of Poyang Lake. The period from 1970s to 2010s can be considered as the development stage of industrialization, especially urbanization, during which, the wetland area decreased from 3673 km2 to 3624 km2, and the LPI (largest patch index) decreased from 16.06 to 20.57. This shows that the wetland patches in this period showed a trend of further fragmentation, large areas of lakes and wetlands were converted to other types, and the impact of human activities, especially urbanization, on wetlands gradually increased. Fragmentation also showed that the NP (patch number) of the wetland increased significantly during this period. On the one hand, the main lake area of Poyang Lake was cut by polders, and on the other hand, various artificial wetlands appeared in non-main lake areas such as the southeast of the study area due to agricultural and urbanization. A large number of related studies have shown that [44,59], since the 1980s, natural wetlands have decreased in cities and their surrounding areas, artificial wetlands have increased, patches are fragmented, and the connectivity between water bodies has decreased. In addition, the main drivers of this change are population growth and rapid urban development.

4.3. Long-Term Trend of Vegetation Change in Poyang Lake Area

The vegetation status of wetland areas reflects the ecosystem security and function of wetlands. Therefore, understanding the vegetation status of the Poyang Lake region on a long-term scale is helpful for regional ecological security pattern planning. Relevant studies have shown that the Normalized difference vegetation index (NDVI) can better reflect the regional vegetation status [60,61,62]. Based on the annual NDVI dataset of the National Ecosystem Research Network of China [63], we used the ArcGIS platform to extract the annual NDVI mean raster dataset in the Poyang Lake area with a resolution of 1 km and a time range of 2001–2021 (Figure 7). Based on this, we conducted a univariate linear regression trend analysis on the NDVI time series of each grid in the Poyang Lake area for the 22 years from 2001 to 2021, and the results are shown in Figure 8.
Since 2001, the NDVI changes of vegetation in the Poyang Lake area have shown large regional differences. In terms of the significance of trend analysis, the p values of univariate linear regression for most of the pixels (64.1%) passed the α < 0.05 test. In addition, 27.5% of the pixels passed the significance test at the α = 0.1 level. The areas where the NDVI value increases, that is, the vegetation condition becomes better, are mainly in the central and western regions. This may be related to less destruction of wetlands and good growth of aquatic vegetation in this area. The areas with reduced NDVI are mainly distributed in the southwest and west of the study area, which may be related to the impact of urban development and agricultural activities on wetlands in this area.

4.4. Implications of Wetland Long-Term Changes to Management

In the past 100 years, the wetland area in the study area has decreased from 3857 km2 in 1930s to 3624 km2 in 2020s, and the long-term loss rate has reached 6.04%. According to the reconstruction results, the loss of wetlands in the Poyang Lake area is mainly due to the development of cities and agricultural reclamation. On the other hand, due to the influence of natural and human factors, the connectivity and diversity of wetlands in the study area have been destroyed, and the value of wetlands in many ecological protection and safety functions has been reduced. Research by Zhang et al. [64] in Hubei Province also showed that the large-scale shrinkage of lakes and wetlands in the middle reaches of the Yangtze River in the past century was mainly driven by high-intensity human activities and agricultural development. The Poyang Lake region, located in the middle and lower reaches of the Yangtze River, has certain similarities in natural and cultural conditions with the region in the middle and lower reaches of the Yangtze River. Since the 1970s, there have been large-scale lake reclamation projects in the Poyang Lake area. Many small lakes and wetlands have been isolated from the main lake area, forming many small and medium-sized settlements and farmland concentration areas in the lake area.
This study also found that NP and LPI in the study area have declined to a certain extent in the past 100 years, while PD has increased, which indicates that the original open lake area has experienced lake fragmentation and decreased connectivity caused by reclamation. In the future, in the process of returning farmland to lakes and lake area governance, it is necessary to improve the connectivity of lakes, reduce the density of patches, and increase the area of open water. From the perspective of farmers’ livelihood in the lake area, it is difficult to completely relocate the farmers in the lake area outside the scope of the lake area. According to the practical experience of ecological restoration and management of Dongting Lake [65], which is also in the Yangtze River region, we can try to guide farmers in the lake area to change their occupational methods and restore the previously reclaimed lake area to water surface and wetlands. The livelihood of farmers mainly depends on economic activities such as fish farming and bird watching or tourism in the lake area.
From the perspective of flood regulation, Poyang Lake wetland is the main flood storage area in Jiangxi Province, and it is of great significance to undertake the flood season of the Ganjiang River, the main tributary of the Yangtze River. The reduction of wetland area in Poyang Lake and the increase of wetland fragmentation in the past 100 years will lead to increased flood risk in the study area. In order to reduce the flood risk in the downstream area and improve the flood accumulation capacity of the wetland, the lake and wetland area in the study area can be further increased in the future, the connectivity of the lake area can be strengthened, and the ability to cope with flood risk can be improved.

5. Conclusions

Based on historical surveying and mapping data and modern satellite remote sensing data, this study quantitatively reconstructed the spatial pattern of wetlands in Poyang Lake since the 1930s using historical maps and Landsat image data. The evolution process of wetland landscape ecological pattern, the main conclusions are as follows:
(1)
In the past 100 years, the overall wetland area in Poyang Lake has experienced a process of first increasing and then decreasing, that is, from 3857 km2 in the 1930s to 3673 km2 in the 1970s, and then to 3624 km2 in the 2020s. The current wetland area is about 6.04% less than in the 1930s.
(2)
The change of wetland density in the past 100 years is mainly reflected in the decrease of the density value in the west of the study area and the increase in the density in the east of the study area. At the same time, due to the increase of artificial water bodies, the southeastern part of the study area was almost all land from the 1930s, and the wetland density value in some areas in the 2020s was about 10%.
(3)
The general trend of changes in the spatial pattern of Poyang Lake wetlands in the past 100 years is that the water surface decreases and the land increases. At the same time, the changes have certain spatial differences, that is, a large area of wetlands disappeared in the southwest and west of the study area; the areas with enlarged wetland density values mainly appeared in the northeastern and northern parts of the study area.
(4)
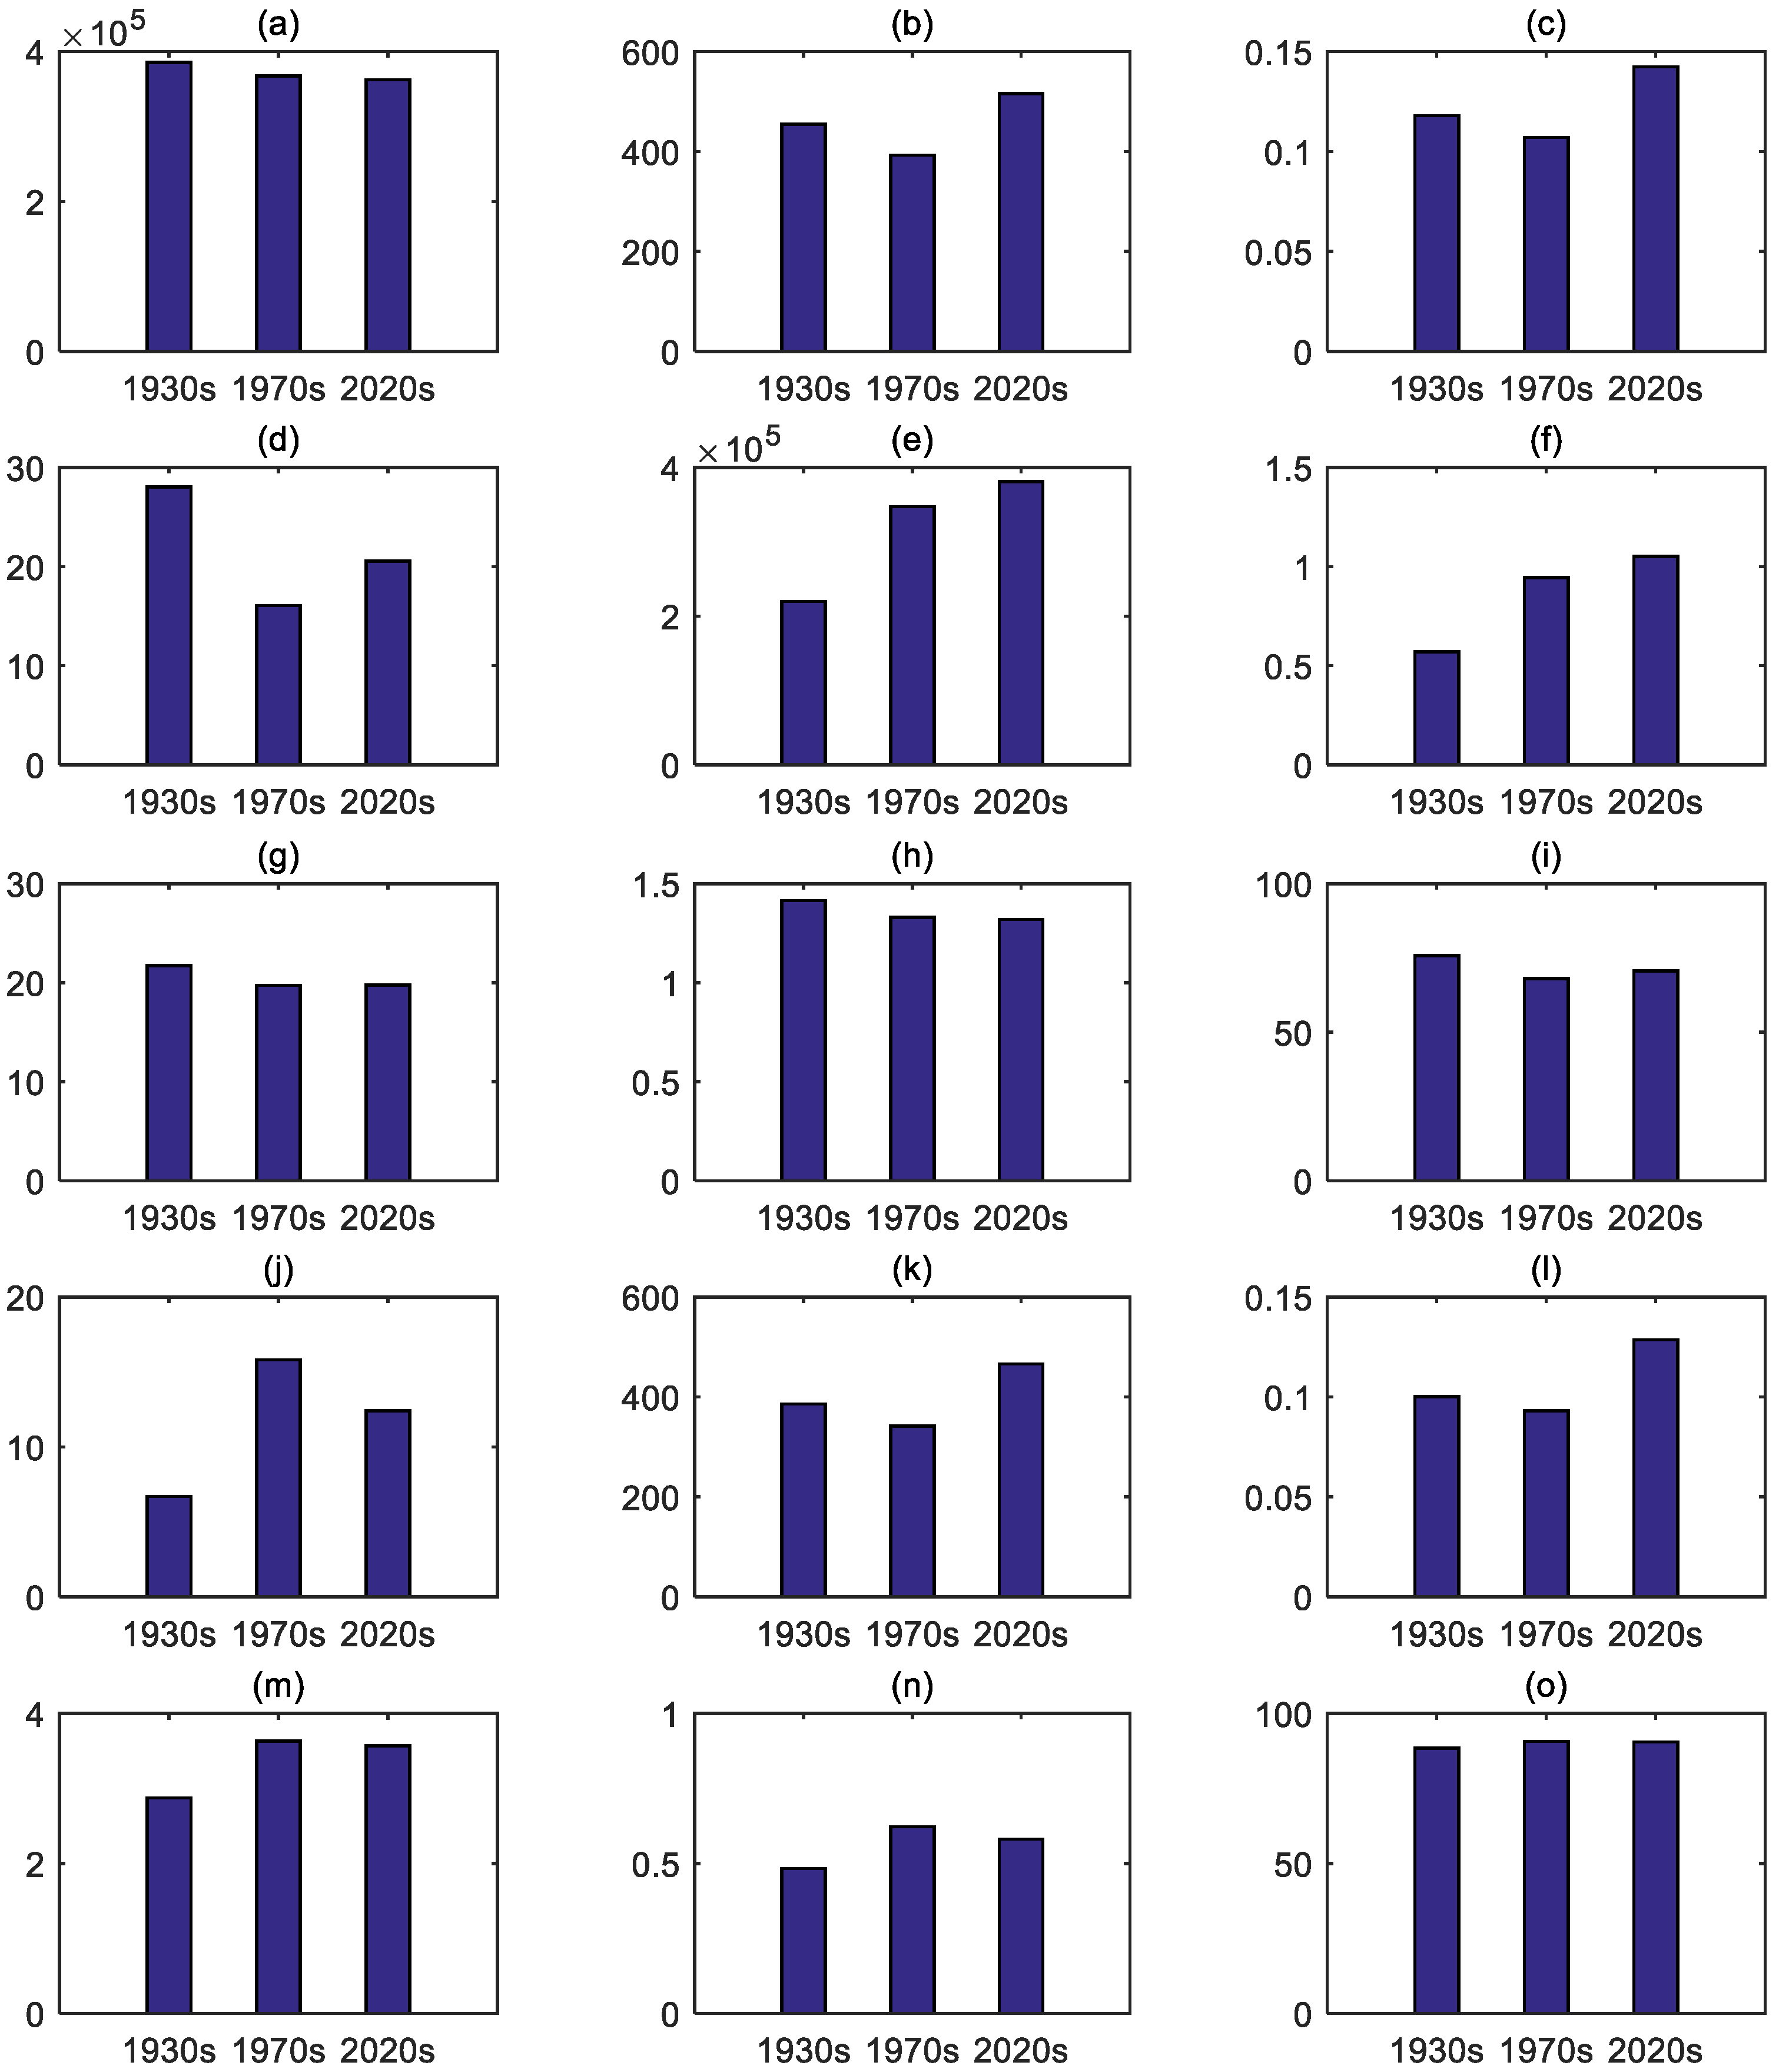
The NP (number of patches) in the wetlands of Poyang Lake in the past 100 years showed a downward trend during the 1930s–1970s, and an increasing trend during the 1970s–2010s. Due to the increase of constructed wetlands, the number and density of patches also increased, and PD (patch density) reached a maximum value of 0.142 in 2020s. The LPI (largest patch index) has shown a gradual downward trend in the past 100 years. Compared with the 1930s, the 2020s dropped by about 26.64%, and the wetlands further showed a trend of fragmentation. The AI index, which indicates the concentration of wetland patches, reached the maximum value in 2020s, but the LSI (landscape shape index) showed a downward trend in general, indicating that the shape of wetland patches has been simplified in the past 100 years.

Author Contributions

Conceptualization, Z.W. and H.W.; methodology, Z.W.; software, H.W.; validation, Z.W.; formal analysis, H.W.; investigation, Z.W.; resources, Z.W.; data curation, Z.W.; writing—original draft preparation, Z.W.; writing—review and editing, H.W.; visualization, Z.W.; supervision, H.W.; project administration, H.W.; funding acquisition, H.W. All authors have read and agreed to the published version of the manuscript.

Funding

This research was funded by National Social Science Fund of China (20VJXT004).

Institutional Review Board Statement

This study did not involve human or animals.

Informed Consent Statement

Informed consent was obtained from all subjects involved in the study.

Data Availability Statement

Not available.

Acknowledgments

Thanks to Xinxin Wang for his suggestions for revision of the paper. Thanks to anonymous reviewers for their constructive suggestions.

Conflicts of Interest

The authors declare no conflict of interest.

References

  1. Mahdavi, S.; Salehi, B.; Granger, J.; Amani, M.; Brisco, B.; Huang, W. Remote sensing for wetland classification: A comprehensive review. Gisci. Remote Sens. 2018, 55, 623–658. [Google Scholar] [CrossRef]
  2. Shen, G.; Yang, X.; Jin, Y.; Xu, B.; Zhou, Q. Remote sensing and evaluation of the wetland ecological degradation process of the Zoige Plateau Wetland in China. Ecol. Indic. 2019, 104, 48–58. [Google Scholar] [CrossRef]
  3. Cheng, F.Y.; Van Meter, K.J.; Byrnes, D.K.; Basu, N.B. Maximizing US nitrate removal through wetland protection and restoration. Nature 2020, 588, 625–630. [Google Scholar] [CrossRef] [PubMed]
  4. Zang, Z.; Zou, X.; Zuo, P.; Song, Q.; Wang, C.; Wang, J. Impact of landscape patterns on ecological vulnerability and ecosystem service values: An empirical analysis of Yancheng Nature Reserve in China. Ecol. Indic. 2017, 72, 142–152. [Google Scholar] [CrossRef]
  5. Rahimi, L.; Malekmohammadi, B.; Yavari, A.R. Assessing and modeling the impacts of wetland land cover changes on water provision and habitat quality ecosystem services. Nat. Resour. Res. 2020, 29, 3701–3718. [Google Scholar] [CrossRef]
  6. Cantonati, M.; Poikane, S.; Pringle, C.M.; Stevens, L.E.; Turak, E.; Heino, J.; Richardson, J.S.; Bolpagni, R.; Borrini, A.; Cid, N. Characteristics, main impacts, and stewardship of natural and artificial freshwater environments: Consequences for biodiversity conservation. Water 2020, 12, 260. [Google Scholar] [CrossRef] [Green Version]
  7. Lyu, H.; Xu, Y.; Cheng, W.; Arulrajah, A. Flooding Hazards across Southern China and Prospective Sustainability Measures. Sustainability 2018, 10, 1682. [Google Scholar] [CrossRef] [Green Version]
  8. Bertrab, A.; Zambrano, L. Participatory monitoring and evaluation of a Mexico City wetland restoration effort. Ecol. Restor. 2010, 28, 343–353. [Google Scholar] [CrossRef]
  9. Céréghino, R.; Boix, D.; Cauchie, H.; Martens, K.; Oertli, B. The ecological role of ponds in a changing world. Hydrobiologia 2014, 723, 1–6. [Google Scholar] [CrossRef] [Green Version]
  10. Meng, B.; Liu, J.L.; Bao, K.; Sun, B. Methodologies and management framework for restoration of wetland hydrologic connectivity: A synthesis. Integr. Environ. Asses 2020, 16, 438–451. [Google Scholar] [CrossRef]
  11. Dang, Y.; He, H.; Zhao, D.; Sunde, M.; Du, H. Quantifying the relative importance of climate change and human activities on selected wetland ecosystems in China. Sustainability 2020, 12, 912. [Google Scholar] [CrossRef] [Green Version]
  12. Zhao, H.; Wang, X.; Cai, Y.; Liu, W. Wetland transitions and protection under rapid urban expansion: A case study of Pearl River estuary, China. Sustainability 2016, 8, 471. [Google Scholar] [CrossRef] [Green Version]
  13. Chen, L.; Ren, C.; Wang, C.; Yao, C. Dynamic of Coastal Wetlands of the Yellow River Delta for 6 Periods. Wetl. Sci. 2017, 15, 179–186. [Google Scholar]
  14. Cong, P.; Chen, K.; Qu, L.; Han, J. Dynamic changes in the wetland landscape pattern of the Yellow River Delta from 1976 to 2016 based on satellite data. Chin. Geogr. Sci. 2019, 29, 372–381. [Google Scholar] [CrossRef] [Green Version]
  15. Zhao, C.; Gong, J.; Zeng, Q.; Yang, M.; Wang, Y. Landscape Pattern Evolution Processes and the Driving Forces in the Wetlands of Lake Baiyangdian. Sustainability 2021, 13, 9747. [Google Scholar] [CrossRef]
  16. Hu, Y.; Huang, J.; Du, Y.; Han, P.; Huang, W. Monitoring spatial and temporal dynamics of flood regimes and their relation to wetland landscape patterns in Dongting Lake from MODIS time-series imagery. Remote Sens. 2015, 7, 7494–7520. [Google Scholar] [CrossRef] [Green Version]
  17. Xu, Y.M.; Li, Y.; Ouyang, W.; Hao, F.H.; Ding, Z.L.; Wang, D.L. The impact of long-term agricultural development on the wetlands landscape pattern in Sanjiang Plain. Procedia Environ. Sci. 2012, 13, 1922–1932. [Google Scholar] [CrossRef] [Green Version]
  18. Werner, B.A.; Johnson, W.C.; Guntenspergen, G.R. Evidence for 20th century climate warming and wetland drying in the N orth A merican P rairie P othole R egion. Ecol. Evol. 2013, 3, 3471–3482. [Google Scholar]
  19. Awoniran, D.R.; Adewole, M.B.; Salami, A.T. Wetland conversion and fragmentation pattern with its impacts on soil in the Lower Ogun River Basin. Ife Res. Publ. Geogr. 2011, 10, 125–133. [Google Scholar]
  20. Aydin, F.; Erlat, E.; Türkeş, M. Impact of climate variability on the surface of Lake Tuz (Turkey), 1985–2016. Reg. Environ. Chang. 2020, 20, 68. [Google Scholar] [CrossRef]
  21. Schoning, K.; Charman, D.J.; Wastegoard, S. Reconstructed water tables from two ombrotrophic mires in eastern central Sweden compared with instrumental meteorological data. Holocene 2005, 15, 111–118. [Google Scholar] [CrossRef]
  22. Larson, D.L. Effects of climate on numbers of northern prairie wetlands. Clim. Chang. 1995, 30, 169–180. [Google Scholar] [CrossRef] [Green Version]
  23. Latrubesse, E.M.; Arima, E.Y.; Dunne, T.; Park, E.; Baker, V.R.; Horta, F.M.; Wight, C.; Wittmann, F.; Zuanon, J.; Baker, P.A. Damming the rivers of the Amazon basin. Nature 2017, 546, 363–369. [Google Scholar] [CrossRef]
  24. Van Geest, G.J.; Coops, H.; Roijackers, R.; Buijse, A.D.; Scheffer, M. Succession of aquatic vegetation driven by reduced water-level fluctuations in floodplain lakes. J. Appl. Ecol. 2005, 42, 251–260. [Google Scholar] [CrossRef]
  25. Hurd, L.E.; Sousa, R.G.; Siqueira-Souza, F.K.; Cooper, G.J.; Kahn, J.R.; Freitas, C.E. Amazon floodplain fish communities: Habitat connectivity and conservation in a rapidly deteriorating environment. Biol. Conserv. 2016, 195, 118–127. [Google Scholar] [CrossRef]
  26. Kumar, J.; Zhao, Y.Q. A review on numerous modeling approaches for effective, economical and ecological treatment wetlands. J. Environ. Manag. 2011, 92, 400–406. [Google Scholar] [CrossRef] [PubMed] [Green Version]
  27. Yang, M.; Gong, J.; Zhao, Y.; Wang, H.; Zhao, C.; Yang, Q.; Yin, Y.; Wang, Y.; Tian, B. Landscape pattern evolution processes of wetlands and their driving factors in the Xiong’an new area of China. Int. J. Env. Res. Pub. He 2021, 18, 4403. [Google Scholar] [CrossRef]
  28. Turner, M.G. Landscape ecology: The effect of pattern on process. Annu. Rev. Ecol. Syst. 1989, 20, 171–197. [Google Scholar] [CrossRef]
  29. Peng, J.; Xie, P.; Liu, Y.; Ma, J. Urban thermal environment dynamics and associated landscape pattern factors: A case study in the Beijing metropolitan region. Remote Sens. Environ. 2016, 173, 145–155. [Google Scholar] [CrossRef]
  30. Yuan, J.; Cohen, M.J.; Kaplan, D.A.; Acharya, S.; Larsen, L.G.; Nungesser, M.K. Linking metrics of landscape pattern to hydrological process in a lotic wetland. Landsc. Ecol. 2015, 30, 1893–1912. [Google Scholar] [CrossRef]
  31. Zhang, M.; Lin, H.; Long, X.; Cai, Y. Analyzing the spatiotemporal pattern and driving factors of wetland vegetation changes using 2000–2019 time-series Landsat data. Sci. Total Environ. 2021, 780, 146615. [Google Scholar] [CrossRef] [PubMed]
  32. Erwin, K.L. Wetlands and global climate change: The role of wetland restoration in a changing world. Wetl. Ecol. Manag. 2009, 17, 71–84. [Google Scholar] [CrossRef]
  33. Tappeiner, U.; Leitinger, G.; Zariņa, A.; Bürgi, M. How to consider history in landscape ecology: Patterns, processes, and pathways. Landsc. Ecol. 2021, 36, 2317–2328. [Google Scholar] [CrossRef]
  34. Song, C.; Ke, L.; Pan, H.; Zhan, S.; Liu, K.; Ma, R. Long-term surface water changes and driving cause in Xiong’an, China: From dense Landsat time series images and synthetic analysis. Sci. Bull. 2018, 63, 708–716. [Google Scholar] [CrossRef] [Green Version]
  35. Li, Y.; Zhu, X.; Sun, X.; Wang, F. Landscape effects of environmental impact on bay-area wetlands under rapid urban expansion and development policy: A case study of Lianyungang, China. Landsc. Urban. Plan 2010, 94, 218–227. [Google Scholar] [CrossRef]
  36. Wang, X.; Ning, L.; Yu, J.; Xiao, R.; Li, T. Changes of urban wetland landscape pattern and impacts of urbanization on wetland in Wuhan City. Chin. Geogr. Sci. 2008, 18, 47–53. [Google Scholar] [CrossRef] [Green Version]
  37. Römer, H.; Willroth, P.; Kaiser, G.; Vafeidis, A.T.; Ludwig, R.; Sterr, H.; Revilla Diez, J. Potential of remote sensing techniques for tsunami hazard and vulnerability analysis–a case study from Phang-Nga province, Thailand. Nat. Hazard. Earth Syst. 2012, 12, 2103–2126. [Google Scholar] [CrossRef] [Green Version]
  38. Anderson, L.O.; Malhi, Y.; Ladle, R.J.; Aragao, L.E.O.; Shimabukuro, Y.; Phillips, O.L.; Baker, T.; Costa, A.; Espejo, J.S.; Higuchi, N. Influence of landscape heterogeneity on spatial patterns of wood productivity, wood specific density and above ground biomass in Amazonia. Biogeosciences 2009, 6, 1883–1902. [Google Scholar] [CrossRef] [Green Version]
  39. Xie, J.; Jin, X.; Lin, Y.; Cheng, Y.; Yang, X.; Bai, Q.; Zhou, Y. Quantitative estimation and spatial reconstruction of urban and rural construction land in Jiangsu Province, 1820–1985. J. Geogr. Sci. 2017, 27, 1185–1208. [Google Scholar] [CrossRef]
  40. Yang, X.; Jin, X.; Du, X.; Xiang, X.; Han, J.; Shan, W.; Fan, Y.; Zhou, Y. Multi-agent model-based historical cropland spatial pattern reconstruction for 1661–1952, Shandong Province, China. Glob. Planet. Chang. 2016, 143, 175–188. [Google Scholar] [CrossRef] [Green Version]
  41. Yang, X.; Guo, B.; Jin, X.; Long, Y.; Zhou, Y. Reconstructing spatial distribution of historical cropland in China’s traditional cultivated region: Methods and case study. Chin. Geogr. Sci. 2015, 25, 629–643. [Google Scholar] [CrossRef] [Green Version]
  42. Hu, S.; Fan, Y.; Zhang, T. Assessing the Effect of Land Use Change on Surface Runoff in a Rapidly Urbanized City: A Case Study of the Central Area of Beijing. Land 2020, 9, 17. [Google Scholar] [CrossRef] [Green Version]
  43. Pan, W.; Man, Z. The grid methods of drainage density data reconstruction in big river delta: Based on the case of Qingpu, Shanghai, 1918–1978. J. Chin. Hist. Geogr. 2010, 25, 5–14. [Google Scholar]
  44. Chen, L.; Ren, C.; Zhang, B.; Li, L.; Wang, Z.; Song, K. Spatiotemporal dynamics of coastal wetlands and reclamation in the Yangtze Estuary during past 50 years (1960s–2015). Chin. Geogr. Sci. 2018, 28, 386–399. [Google Scholar] [CrossRef] [Green Version]
  45. You, H.; Fan, H.; Xu, L.; Wu, Y.; Wang, X.; Liu, L.; Yao, Z.; Yan, B. Effects of water regime on spring wetland landscape evolution in Poyang Lake between 2000 and 2010. Water 2017, 9, 467. [Google Scholar] [CrossRef] [Green Version]
  46. Chen, L.; Wang, Y. The profile of some military topographic map before 1949. Hubei Arch. 1999, 13, 31–32. [Google Scholar]
  47. Wan, Z.; Jia, Y.; Jiang, M.; Liu, Y.; Hong, Y.; Lu, C. Reconstruction of urban land use and urbanization level in Jiangxi Province during the Republic of China period. Acta Geogr. Sin. 2018, 73, 550–561. [Google Scholar]
  48. Jiang, W. Research on urban population of Jiangnan in the Republic of China based on GIS and the data of topographic maps. Res. Chin. Econ. Hist. 2015, 9, 39–56. [Google Scholar]
  49. Jiang, W. The urban form of traditional mid-small cities: Focus on cadastral maps of Jurong county town in the Republic China. J. Chin. Hist. Geogr. 2014, 29, 33–45. [Google Scholar]
  50. McGarigal, K.; Marks, B.J. FRAGSTATS: Spatial Pattern Analysis Program for Quantifying Landscape Structure; U.S. Department of Agriculture, Forest Service, Pacific Northwest Research Station: Portland, OR, USA, 1995; p. 122. [Google Scholar]
  51. McGarigal, K.; Cushman, S.A.; Neel, M.C.; Ene, E. FRAGSTATS: Spatial Pattern Analysis Program for Categorical Maps. Available online: https://www.umass.edu/landeco/ (accessed on 20 June 2022).
  52. Tappeiner, U.; Tasser, E.; Leitinger, G.; Cernusca, A.; Tappeiner, G. Effects of historical and likely future scenarios of land use on above-and belowground vegetation carbon stocks of an alpine valley. Ecosystems 2008, 11, 1383–1400. [Google Scholar] [CrossRef]
  53. Canedoli, C.; Ficetola, G.F.; Corengia, D.; Tognini, P.; Ferrario, A.; Padoa-Schioppa, E. Integrating landscape ecology and the assessment of ecosystem services in the study of karst areas. Landsc. Ecol. 2022, 37, 347–365. [Google Scholar] [CrossRef]
  54. Velastegui-Montoya, A.; Lima, A.D.; Adami, M. Multitemporal analysis of deforestation in response to the construction of the Tucuruí Dam. Isprs. Int. J. Geo. Inf. 2020, 9, 583. [Google Scholar] [CrossRef]
  55. Xu, X.; Xie, Y.; Qi, K.; Luo, Z.; Wang, X. Detecting the response of bird communities and biodiversity to habitat loss and fragmentation due to urbanization. Sci. Total Environ. 2018, 624, 1561–1576. [Google Scholar] [CrossRef] [PubMed]
  56. Goldewijk, K.K. Estimating global land use change over the past 300 years: The HYDE database. Glob. Biogeochem. Cycles 2001, 15, 417–433. [Google Scholar] [CrossRef]
  57. Pan, W. Study on the Morphology of Wei River Jing River Estuary Tongguan Based on the Fractal Geometry, 1915–2000 AD. Acta Sedimentol. Sin. 2011, 29, 946–952. [Google Scholar]
  58. Wei, S.; Chen, J. A comparative research on built-land changes between Fujian and Taiwan provinces. J. Geogr. Sci. 2007, 17, 245–256. [Google Scholar] [CrossRef]
  59. Li, Q.; Zhou, Y.; Xu, T.; Wang, L.; Zuo, Q.; Liu, J.; Su, X.; He, N.; Wu, Z. Trade-offs/synergies in land-use function changes in central China from 2000 to 2015. Chin. Geogr. Sci. 2021, 31, 711–726. [Google Scholar] [CrossRef]
  60. Gaglio, M.; Bresciani, M.; Ghirardi, N.; Muresan, A.N.; Lanzoni, M.; Vincenzi, F.; Castaldelli, G.; Fano, E.A. Aquatic Vegetation Loss and Its Implication on Climate Regulation in a Protected Freshwater Wetland of Po River Delta Park (Italy). Water 2022, 14, 117. [Google Scholar] [CrossRef]
  61. Cihlar, J.; Laurent, L.; Dyer, J.A. Relation between the normalized difference vegetation index and ecological variables. Remote Sens. Environ. 1991, 35, 279–298. [Google Scholar] [CrossRef]
  62. Guha, S.; Govil, H. An assessment on the relationship between land surface temperature and normalized difference vegetation index. Environ. Dev. Sustain. 2021, 23, 1944–1963. [Google Scholar] [CrossRef]
  63. Yang, J.; Dong, J.; Xiao, X.; Dai, J.; Wu, C.; Xia, J.; Zhao, G.; Zhao, M.; Li, Z.; Zhang, Y. Divergent shifts in peak photosynthesis timing of temperate and alpine grasslands in China. Remote Sens. Environ. 2019, 233, 111395. [Google Scholar] [CrossRef]
  64. Zhang, Y.; Kung, H.T.; Deng, H.B.; Kong, C.F.; Li, W.J. Change characteristic of lakes in Hubei province in the past 100 years. Wetl. Sci. 2010, 8, 15–20. [Google Scholar]
  65. Wang, L.; Li, Z.; Wang, D.; Chen, J.; Liu, Y.; Nie, X.; Zhang, Y.; Ning, K.; Hu, X. Unbalanced social-ecological development within the Dongting Lake basin: Inspiration from evaluation of ecological restoration projects. J. Clean. Prod. 2021, 315, 128161. [Google Scholar] [CrossRef]
Figure 1. Geographical location map of the study area: (a) administrative division of the study area, (b) subregional division of the study area, (c) topographic map of Poyang Lake Basin, (d) Poyang Lake area.
Sustainability 14 07868 g001
Figure 2. Military topographic map of 1:50,000 in 1930s. This map is a series of topographic maps of the Poyang Lake area in Jiangxi Province. The area shown in the map is the lake surface near Duchang County of Poyang Lake, and the main landform types are lakeside dunes and paddy fields.
Sustainability 14 07868 g002
Figure 3. Evolution process of Poyang Lake wetland from 1930s to 2020s. (a) 1930s, (b) 1970s, (c) 1930s.
Sustainability 14 07868 g003
Figure 4. Spatial distribution of wetland density in Poyang Lake. (a) 1930s, (b) 1970s, (c) 1930s.
Sustainability 14 07868 g004
Figure 5. Wetland changes in the three periods of (a) 1970s–1930s, (b) 2020s–1970s and (c) 2020s–1930s.
Sustainability 14 07868 g005
Figure 6. Landscape ecological pattern index of Poyang Lake wetland in 1930s, 1970s and 2020s: (ao) represent indices respectively such as TA, NP, PD, LPI, TE, ED, LSI, PAFRAC, CONTAG, SPLIT, PR, PRD, SHDI, SHEI and AI.
Sustainability 14 07868 g006
Figure 7. NDVI of Poyang Lake wetland: (af) represent 2001, 2005, 2009, 2013, 2017 and 2021.
Sustainability 14 07868 g007
Figure 8. NDVI time series of each grid in the Poyang Lake area: (a) slope value of change trend, (b) p value for univariate linear regression.
Sustainability 14 07868 g008
Table 1. Indices and meaning of landscape pattern.
IndexFormulaVariable DescriptionImplication
Total area of patches (TA)TA = A(1/10,000)A: total landscape area (m2)total area of the landscape
Number of patches (NP)NP = nini: number of patches in i classnumber of patches of the corresponding type
Patch density (PD)PD = ni/Adittothe number of patches of the corresponding patch type divided by total landscape area
Largest patch index (LPI)LPI = max(aij)/Aaij: area of patch ij.a simple measure of dominance
Total edge (TE)TE = ∑eikeik: total length of edge in landscapeabsolute measure of total edge length of a particular patch type
Average edge density (ED)ED = (E/A) (10,000)dittoindicates the density of patch side lengths.
Landscape shape index (LSI)LSI = 0.25E/√Adittoprovides a standardized measure of total edge or edge density that adjusts for the size of the landscape
Perimeter-area fractal dimension (PAFRAC) 2 [ N ( ln p ln a ) ] [ ( ln p ) ( ln a ) ] ( N ( ln p 2 ) ) ( ( ln p ) ) 2 pij = perimeter of patch ijIndicates the complexity of the patch
Contagion (CONTAG) 1 { P ln P } 2 ln ( m ) P: area weighted probability value
m: Number of patch types
Measure the proportion of a single type to the total area
Splitting index (SPLIT)SPLIT = A2/∑aij2dittoIndicates the degree of division of the landscape
Patch richness (PR)PR = mm: number of patch types present in the landscapethe simplest measure of landscape composition
Patch richness density (PRD)PRD = m/Adittostandardizes richness to a per area basis
Shannon’s diversity index (SHDI)SHDI = −∑(Pi ∗ lnPi)Pi: proportion of the landscape occupied by patchmeasure of diversity in community ecology
Shannon’s evenness index (SHEI)SHEI = −∑(Pi ∗ lnPi)/ln(m)dittoan even distribution of area among patch types results in maximum evenness
Aggregation index (AI)AI = [gii/(max->gii)]gii: number of like adjacencies (joins) between pixels of patch type (class) i based on the single-count methodthe frequency with which different pairs of patch types appear side-by-side on the map
Publisher’s Note: MDPI stays neutral with regard to jurisdictional claims in published maps and institutional affiliations.

