Article

Visualizing Status, Hotspots, and Future Trends in Mathematical Literacy Research via Knowledge Graph

1
School of Mathematics and Statistics, Qiannan Normal University for Nationalities, Duyun 558000, China
2
School of Computer and Information, Institute of Big Data Application and Artificial Intelligence, Qiannan Normal University for Nationalities, Duyun 558000, China
3
Key Laboratory of Complex Systems and Intelligent Optimization of Guizhou Province, Duyun 558000, China
4
Key Laboratory of Complex Systems and Intelligent Optimization of Qiannan, Duyun 558000, China
*
Author to whom correspondence should be addressed.
Sustainability 2022, 14(21), 13842; https://doi.org/10.3390/su142113842
Submission received: 14 September 2022 / Revised: 19 October 2022 / Accepted: 21 October 2022 / Published: 25 October 2022

Abstract

:
The goal of education for sustainable development is to prepare future citizens to make informed decisions and take responsible action to solve problems. The purpose of mathematical literacy is to ensure that all learners develop an understanding of mathematics, and how to relate mathematics to the world and use mathematical knowledge to make valuable decisions in their lives, work, and society. It can be seen that the purpose of mathematical literacy coincides with the goal of education for sustainable development. In addition, math literacy is closely related to self-regulated learning (SRL), which is the key to meaningful learning and sustainable development. In educational research, it is an essential task to cultivate learners’ mathematical literacy and promote their sustainable development. With the rapid growth of emerging technologies, the emergence of big data has brought numerous challenges to various research fields. In the age of big data, educational research that can identify research perspectives and hotspots and summarize research evolution rules from a large body of literature can assist us in deepening subsequent analysis. As a result, in this study, we used CiteSpace and HistCite knowledge map visualization and exploration technology to examine mathematical literacy research trends, major research countries and regions, major research institutions, significant researchers, highly cited papers, research hotspots, and evolution trends on a global scale. Through this study, we found that the earliest literature on mathematical literacy appeared in 1957, and the research on mathematical literacy can be divided into three germination stages (1957–2001), a slow development stage (2001–2011), and a prosperous development stage (2011–2022). Most studies come from developed countries such as the US, the UK, Germany, and Australia. The Universities of Utrecht and Purdue University were the most published institutions, and scholars at Purpura published the most articles. The research object of highly cited literature is mainly children, and the research is primarily carried out through the measurement of students’ mathematical ability and achievement and the analysis of related influencing factors, which provides a direction for how to improve students’ mathematical literacy. The research on mathematical literacy mainly includes four research hotspots: working memory and mathematical literacy; brain science and mathematical literacy; mathematical achievement and mathematical literacy; and the generation strategy of mathematical literacy. The research field of mathematics literacy mainly includes working memory, parietal cortex, math performance, mathematics education, early childhood, parental belief, fractions, cognitive development, and student learning. There are 10 clusters. Different clusters have different evolutionary trends. With the evolution of time, working memory, mathematical education, fractions, and precinct beliefs clustered, gradually expanding from the concentrated research direction to the subdivision field. The clusters of parietal cortex, math performance, early childhood, cognitive development, and students do not show large keyword nodes during the research period. With time, it has gradually expanded from the centralized research direction to the subdivision field. The parietal cortex, math performance, early childhood, cognitive development, and students clusters did not show large keyword nodes during the whole study period.

1. Introduction

Skills education in the 21st century has inspired researchers to develop competencies that can promote talent development [1]. Among these abilities, mathematical ability plays an essential role in education, and mathematical ability is often referred to as mathematical literacy. Mathematical literacy, as defined by the OECD, is an individual’s ability to form, use, and interpret mathematics in various contexts, which helps an innovative, active, and reflective citizen understand the role of mathematics in the world, and make sound judgments [2]. Mathematical literacy is closely related to educational success, career achievement, and national economic growth [3]. It plays an essential role in the discussion courses of mathematics education objectives and has become the core vocabulary of mathematics education in recent years [4]. In the information age, any educational research plan should consider the current and future needs for math skills [5].
Many countries and organizations emphasize students’ mathematical literacy formation and development. The most apparent embodiment is the constructing of the curriculum system generated by mathematical literacy. For example, in 1959, the British Department for Education published the Crowther Report on the Education of 15–18-year-olds, in which mathematical literacy was creatively proposed for the first time [6]. In 1982, Wilfred Cockcroft, an expert in mathematics education, published the famous “Cockcroft Report”, which pointed out that learning mathematics should help acquire not only knowledge and skills, but also develop mathematical literacy [7]. The national literacy strategy was launched in 1996, and in 1999, it started in September [8]. The British Ministry of Education issued the new “National Curriculum” (Mathematics), pointing out that the development of students’ mathematics literacy is still an essential goal of the mathematics curriculum, and “mathematical literacy and mathematics” and “language and reading literacy” are essential to the development of the national curriculum [9]. This is a programmatic document for mathematics curriculum reform in British primary and secondary schools in the 21st century. Since the introduction of mathematical literacy in the UK, other countries have also made mathematical literacy an essential goal of the mathematics curriculum. For example, in 1989, the National Council of Teachers of Mathematics (NCTM) issued the Standards for the Curriculum and Evaluation of Mathematics in Schools. The purpose of this document was to guide significant reforms in the teaching of mathematics [10]. In 1998, a discussion draft of the new NCTM standards included mathematical literacy as a social need [11]. In 2001, the Mathematics Learning Research Committee under the National Research Council set mathematical proficiency as the target for learning mathematics in Adding It Up: Helping Children Learn Mathematics [12].
The plan proposed applying knowledge questions to develop problem-solving skills, and the ability to use mathematical language and tools, of two groups. They sought to measure the mathematical skills of students via their mathematics achievements [13]. Developing countries also pay attention to the cultivation of students’ mathematical literacy. For example, South Africa released the “High School Mathematics Literacy Curriculum and Evaluation Standards” in January 2012, which focuses on teaching students both basic and applied math skills [14].
Since then, China’s Ministry of Education has promulgated “ordinary high school mathematics curriculum standards (2017 edition) and the compulsory education stage mathematics curriculum standards (2022 edition)”. These course standards emphasize that math is a modern social norm and that everyone should have the essential skill, and they regard it as one of their objectives. In 2016, the Ministry of Education of China issued the Core Quality of Chinese Students’ Development. Subsequently, the Ministry of Education of China issued the Mathematics Curriculum Standard for Ordinary High Schools (2017 Edition) and the Mathematics Curriculum Standard for Compulsory Education (2022 Edition). Both curriculum standards point out that mathematics literacy is the essential quality that every person in modern society should have, and regard it as one of the goals of mathematics curriculum learning. As a programmatic document guiding mathematics curriculum teaching, the curriculum mathematics standard is essential to mathematics curriculum reform. It puts mathematics core literacy in the curriculum standard. It takes it as one of the objectives of mathematics curriculum teaching. The Chinese Mathematics Curriculum places a lot of emphasis on teaching students how to understand and use math.
Furthermore, many of the more critical international assessments also focus on mathematical literacy. For instance, since 2000, the Organization for Economic Cooperation and Development has carried out a round of the Program for International Students for 15-year-old students every three years (PISA). Each game of the test involves the assessment of reading literacy, mathematical literacy, and scientific literacy. Only one form of literacy is selected for the preliminary examination in each round, among which the PISA2003 [15], PISA2012 [2], and PISA2022 are the main tests of mathematical literacy. The Trends in International Mathematics and Science Study (TIMSS) 2015 also include the assessment of mathematical literacy [16]. Many scholars have also researched mathematical literacy. For example, Altun et al. revealed the difficulties Turkish students encounter in solving mathematical literacy problems through investigation [17]. Bolstad et al. pointed out that students’ mathematical literacy is related to mathematical topics and contexts in their personal and professional life [18]. Gatabi et al. found that Iranian ninth grade math textbooks contained significantly fewer questions related to math literacy, diversity of content, and opportunities for students to participate in mathematical modeling than those in Australia [19]. Yasemin et al. believe that teachers’ effective use of mathematical language and their enrichment of visual materials in the curriculum can help improve middle school students’ mathematical literacy and visual mathematical literacy self-efficacy, and there is a high degree of positive correlation between mathematical literacy and visual mathematical literacy [20]. Guzel et al. found a significant positive correlation between math literacy and math self-efficacy, and a substantial relationship between the interest in, enjoyment of, anxiety about math, and the subject climate of mathematics courses [21]. Kaur et al. found that reading metacognitive learning strategies (comprehension, memory, and summary) is positively correlated with adolescents’ mathematical literacy. In contrast, two self-regulated learning strategies of reading (memory and refinement) were found to be negatively correlated with adolescents’ mathematical literacy [22]. Kemal found that there was no significant difference in the level of self-efficacy belief among students with different learning styles [23]. Gabriel et al. found that math anxiety was negatively correlated with math literacy, and self-efficacy, self-assessment, perseverance, and motivation were positively correlated with math literacy [24]. Geary et al. found that boys and girls had more similarities than differences in terms of the development of mathematical ability [25]. Canbazoglu et al. found that cooperative learning positively impacted pre-service primary school teachers’ mathematical literacy achievement and awareness [26]. Kramarsk et al. found that students who received metacognitive instruction had higher levels of self-regulation (SRL) and mathematical literacy [27]. Due to space limitations, only some of the research results on mathematical literacy are listed in this study. There are also many publications on mathematical literacy worldwide, indicating the availability of fruitful research results on mathematical literacy worldwide. So, based on the global literature on mathematical literacy research, it is essential to show the overall situation, research hotspots, and evolution rules of mathematical literacy. This will give researchers and policymakers new ideas and perspectives to guide future research and policy.
Goffman et al. argue that, in some areas, fundamental discoveries can be predicted by mathematical models and algorithms [28]. Senturk et al. designed a new classification algorithm based on SLCD to help humans make the most accurate judgments in a given condition [29]. In addition, diagrams are useful for visual reasoning, helping humans make judgments in given conditions [30]. Based on algorithms and mathematical modeling, Eugene Garfield designed the HistCite software system, which can generate a chronological history highlighting the most cited works in the retrieved collection [31]. In addition, the CiteSpace designed by Chen, Chaomei et al. based on Java can use algorithms and mathematical models to draw knowledge maps and visualize literature in a certain research field, thus revealing research hotspots and evolution trends [32]. Thus, the HistCite software system and CiteSpace can reveal a certain research field’s overall situation and help humans make accurate judgments. In recent years, some scholars have conducted literature reviews and qualitative analyses on mathematical literacy research from a single perspective, such as sorting out the definition of mathematical literacy [33], classifying articles on mathematical literacy [34], and sorting out the literature on mathematical literacy by induction [35]. However, these studies lack large-scale literature analysis and the use of big data to analyze mathematical literacy research, and systematically reveal the research hotspots and evolution rules in the area of mathematical literacy research. Of course, these literature findings are beneficial in helping researchers to understand the development of mathematical literacy. Still, they mainly rely on qualitative methods to analyze the contents and topics of the existing literature. However, more information can be collected through the comprehensive application of quantitative and qualitative analyses, making the research results conform to both subjective experience and objective data, which is more scientific and accurate. The overall situation, research hotspots, and evolution trends of mathematical literacy research are revealed from the five dimensions of publication trends, countries/regions, research institutions, researchers, and keywords in the field of mathematical literacy. This study can partially cover what other studies have not. Its main contributions are the following four points:
(1) Using big data to determine the publication trend of mathematical literacy research;
(2) Finding out which countries, regions, research institutions, and scholars have the most influence on mathematical literacy research based on big data, and how they work together;
(3) Identifying research hotspots in mathematical literacy research using big data;
(4) Determining the evolution trend of the mathematical literacy research field using big data.
The rest of this study is organized as follows: In the Section 2, we describe the research tools, methods, and data sources. In the third part, we reveal the overall situation of mathematical literacy research from five aspects—publication trend, countries/regions, research institutions, author distribution, and highly cited literature. In the fourth part, we conduct a co-occurrence analysis and cluster analysis of keywords to reveal the research hotspots and evolving trends in mathematical literacy research. In the fifth part, we detail the main conclusions of this study and future work.

2. Sources and Research Methods

2.1. Data Sources and Screening

To increase the representativeness and accessibility of data, we used the core databases of the Web of Science (SCI-Expanded and SSCI), the authoritative global scientific literature platform, as the data source to reveal the research hotspots and evolution rules in the field of mathematical literacy research. There are different expressions of mathematical literacy around the world; for example, the UK, Australia, Canada, and New Zealand use numeracy, and the OECD/PISA use mathematical literacy. In the USA, mathematical proficiency and quantitative literacy are used; in Denmark and Finland, mathematical competencies are used. To eliminate false checks and missing information in the search process, on 22 July 2022, based on the classical literature and the views of some professors, with TS = numeracy OR TS = “Mathematical literacy” OR TS = “Mathematical literacy” OR TS = “quantitative literacy” OR TS = “Mathematical competences”, and through the Web of Science category refining feature, we excluded mechanics, ecology, management, pediatrics, and other unrelated fields. Then, we manually checked the titles and abstracts of the remaining literature, deleted irrelevant literature, and finally got 536 pieces of literature, which were used as the primary data of our study.

2.2. Research Method

In 1969, Pritchard proposed bibliometric analysis [36], which uses statistical and mathematical methods to study the distribution structure and the change rules of information [37]. It is a mature, quantitative analysis method. HistCite, developed by Garfield et al., is a software package for bibliometric analysis and information visualization that can be used to calculate the Local Citation Sore (LCS) and Global Citation Sore (GCS) [31]. GCS represents the number of times other documents in the local database cited the paper, and LCS represents the number of times the article is cited by other documents in the WOS paper database. CiteSpace is a powerful social network analysis software developed by Professor Chen Chaomei from Drexel University based on the Java language, which can draw knowledge graphs [38]. With the advent of the era of big science and big data, social network analysis has become a widely used framework in bibliometric analysis. Social networks are made up of nodes and the connections between them. They are based on graph theory and are often used to measure structural and social patterns [39].
In the era of big data, to objectively and comprehensively analyze the overall situation in the field of mathematical literacy research, HistCite and CiteSpace (5.8.R3) visualization software were used to mine the hidden information in the literature. To explore the number of publications on mathematical literacy, the academic influences of authors, research institutions and countries, and the cooperation between them, as well as the research hotspots and evolution trends of mathematical literacy, modularity and silhouette are two critical indicators of CiteSpace. A modularity value (Q value) is an evaluation index of network modularity, and its calculation formula is
Q = 1 2 m ( a i j p i j ) σ ( C i , C j ) ,
A = a i j is the adjacency matrix in the actual network. p i j is the expected value of the number of lines between nodes in the null model. C i and C j represent the community that node i and node j belong to in the network. If i and j belong to the same club, then σ = 1 . Otherwise σ = 0 . Q ranges from 0 to 1, where Q > 0.3 means a significant clustering structure. The silhouette value is an illustration proposed by Kaufman and Rousseeuw to evaluate the clustering effect [40], and its calculation formula is
S i = { 1 a ( i ) b ( i ) ,     a ( i ) < b ( i )                     0 ,   a ( i ) = b ( i ) b ( i ) a ( i ) 1 , a ( i ) > b ( i ) ,
a is the average distance between point i and other points in the class, and b is the average distance between point i and all points in the class of the nearest point i . The range of S is [ 0 ,   1 ] , where S > 0.5 means reasonable clustering, and S > 0.7 means convincing clustering results.

3. Results Analysis

3.1. Analysis of Publication Trends

The annual distribution of the number of papers reflects the overall situation and research trends. It can be used to analyze the relationship between the number of documents published in a particular area of a field and temporal change [41]. To understand the output of mathematical literacy research results, we analyzed the literature on mathematical literacy. We found that the earliest research on mathematical literacy dates back to 1957. From 1957 to 1990, only one paper was included in 1957, 1961, 1973, 1981, 1983, and 1987, and no articles were published in the other years. From 1990 to 22 July 2022, although the number of publications in the field of mathematical literacy research fluctuated slightly, it showed an overall upward trend (Figure 1). Generally speaking, the research on mathematical literacy can be roughly divided into three stages. In the embryonic period (1957–2001), the number of papers published on mathematical literacy accounted for only 5% of the total, and no more than three papers were published yearly. Although the research on mathematical literacy at this stage is not rich, it provides a foundation for subsequent research on mathematical literacy. In the slow development phase (2001–2011), the number of papers published on mathematical literacy accounted for 18% of the total. At the same time, we find an exponential increase in the number of articles published on mathematical literacy, but the growth rate was relatively modest. During the boom phase (2011–2022), the number of papers published on mathematical literacy accounted for 77% of the total. Similarly, at this point, the number of documents published on mathematical literacy grew by a factor of 10, and the quantity of research on mathematical literacy grew quickly, both of which show that mathematical literacy has become a field that many researchers are interested in.

3.2. Analysis of Research Actives

To explore the foremost scholars, institutions, and countries/regions of mathematical literacy research, as well as perform a preliminary study of mathematical literacy, we used CiteSpace software and HistCite to analyze the four dimensions of country/regions, institutions, authors, and highly cited literature.

3.2.1. Analysis of Country/Region

The number of articles published by a country or region reflects the importance, influence, and contribution of the country or region to the field [42]. We used CiteSpace to find that 71 countries participated in the study of mathematical literacy between 1957 and 2022. To further analyze the countries that have significantly influenced mathematical literacy research, we ranked the countries according to the number of publications. We used a table (Table 1) to show the top countries and their numbers of publications.
As can be seen from Table 1, the United States (213) ranks first, accounting for 40% of the total number, and the LCS and GCS are much higher here than in other countries, indicating that the United States attaches great importance to research on mathematical literacy and has achieved rich research results. This is followed by Germany (44 papers), the United Kingdom (44 documents), and China (30 records), which also made significant contributions to mathematics education research. In addition, we found that most of the countries in the top rankings are developed countries, and only China, South Africa, and Turkey are developing countries, indicating that developed countries have made more prosperous achievements in the field of mathematical literacy research, while developing countries are slightly lacking. It is worth noting that although the number of papers published in Canada is not very high, its LCS and GCS values are relatively high, which indicates that the quality of Canadian documents is high and has received wide attention. Scientific research cooperation is a critical way to improve the overall strength of scientific research and improve the complementarity of scientific research resources and knowledge [43]. Through the cooperation between countries, we can find the countries with a strong influence in the field of mathematical literacy research and their cooperation degree. Therefore, we used CiteSpace to draw a knowledge map of the authors’ countries and regions (Figure 2).
This graph used the Cosine algorithm and generated 77 nodes and 66 lines. The Q value was 0.7893, and the S value was 0.9377, which means its clustering effect was remarkable. The result is trustworthy. From Figure 2, we can see that the United States has outstanding performance in international cooperation, cooperating with other countries more, and has become the leading research country in the field of mathematical literacy, with very high cooperative influence and numbers of publications. Germany, Australia, the United Kingdom, and China have also performed well in terms of international cooperation. Others, notably Turkey, have cooperated less with others.

3.2.2. Analysis of Organizations

To gain insight into the core academic groups and institutions of mathematical literacy research, we used CiteSpace and HistCite to analyze the literature institutions visually. We found that 152 research institutions conducted research on mathematical literacy between 1957 and 22 July 2022. We used CiteSpace software to draw a knowledge map of the authors’ institutions (Figure 3). We found that there was close cooperation among various research institutions, and many research institutions had established cooperative relations. We sorted the institutions according to the number of publications. We used the table to show the number of publications, LCS, GCS, and countries of origin of the research institutions with more than five publications (Table 2). In terms of the number of articles published, the number of articles published by the University of Utrecht, Purdue University, and Vanderbilt University exceeds 10. A total of 25 universities published more than five articles, 23 of which were world-renowned universities in developed countries, accounting for 90% of the total. This suggests that developed countries are the main driving force behind mathematical literacy research. In developing countries, only Beijing Normal University in China and the University of Cape Town in South Africa published more than five articles, indicating that the research on mathematical literacy in developing countries lags behind that in developed countries. In addition, 9 of the 20 research institutions are from the United States, indicating that the United States occupies a very important position in mathematical literacy research. It is worth noting that, using HistCite software, we found that although Carleton University does not have the highest number of posts, its LCS and GCS are high, which shows that this research institute has published a lot of papers in the field of mathematical literacy research, and has gotten a lot of attention.

3.2.3. Analysis of Authors

To understand the number of publications and important authors in the field of mathematical literacy research, HistCite was used to develop statistics of the authors in the field of mathematical literacy research and to display the important authors, their numbers of publications, and citation information in a table. However, due to space limitations, we only show the authors with five papers and above. It can be seen from Table 3 that the number of documents published by Purpura DJ is the largest, at 14. The LCS and GCS are also relatively high, indicating that Purpura DJ has published several high-level papers with high reference values. In particular, although the number of papers published by LeFevre JA is not the highest, the LCS and GCS are relatively high, indicating that the papers published by LeFevre JA have important academic value and have attracted wide attention. To explore the cooperative density and relationships between the authors, we drew an author’s knowledge graph using the Cosine algorithm in CiteSpace (Figure 4), and found that there are mainly five research groups in the field of mathematical literacy research. On the whole, the density of the whole author cooperation network is low, and the research cooperation network diagram is relatively scattered. Most scholars do not show cooperation, but a few authors have shown the potential for collaboration in the future. People such as Christopher J. Lonigan, Amy R. Napoli, Ellen C. LITKOWSKI, and Jessica A. R. Logan have worked with Purpura DJ, and Purpura DJ could perhaps be a bridge between them.

3.2.4. The Foundation of Mathematical Literacy Research

Highly cited literature plays a key role in the knowledge flow network and is the basis of discipline knowledge research [44]. This study shows the articles with more than ten citations (Table 4), with a total of nine articles, among which the first article is the user manual of MPLUS software [45], and the remaining eight articles are all related to the measurement of students’ mathematical ability or skills. Among the eight articles, six of them studied toddlers or children [46,47,48,49,50,51], and the other two are meta-analyses [52] and literature reviews [53]. In addition, among the eight highly cited papers, three focus on the analysis of influencing factors or predictors of students’ mathematical performance [46,47,48], and three focus on the analysis of influencing factors or predictors of students’ mathematical ability [49,50,51]. In addition, one paper studied which of the mathematical abilities of students could predict their math performance [52], and another paper analyzed the relationship between symbolic and nonsymbolic number magnitude processing and individual differences in children’s math skills from the perspective of brain science and behavior [53]. These studies mainly focus on preschoolers [47,49,50,51] and children [46,48], and analyze the effects of mathematical language and general language [47], the reflection time of a number comparison task [48], and inhibitory control on mathematical achievement [46]. In addition, the effects of the home computing environment (HNE) [49,51], age [49], and counting ability [50] on students’ mathematical ability were also analyzed. This highly cited literature shows that the research on mathematical literacy is mainly conducted through the measurement of students’ mathematical abilities and achievements, and the analysis of related influencing factors, which provides directions for how to improve students’ mathematical literacy.

4. Research Hotspot and Evolution Analysis

The keywords were summarized and refined to the core of the article. We used CiteSpace software to conduct keyword co-occurrence, cluster and time axis visualization analyses to reveal further show the research hotspots and evolution trends of mathematical literacy.

4.1. Keyword Co-Occurrence Analysis

The keywords have been effectively summarized and refined to the core of the article, and frequent keywords have been used to identify the main themes of the research field [54]. We used the cosine algorithm in CiteSpace to statistically and visually analyze the keywords in the article, draw a keyword knowledge map (Figure 5), and present keywords with a word frequency greater than 20 (Table 5). It was found that the most common keywords in the field of mathematics literacy research are “achievement”, “children”, “individual difference”, “skill”, etc. To a large extent, these keywords reflect that the research in the field of mathematical literacy mainly focuses on the keywords of student achievement, children, individual differences, and math skills.
In addition, these keywords are interlaced with each other, and the network graph formed has a strong focus, reflecting the researchers’ focus on mathematical literacy research to a certain extent. Keywords, centrality, and word frequency are the key factors in measuring the extent of keywords, and the value of centrality is positively correlated with the volume of keywords in the network, which is an index used to measure the importance of nodes in the network. Important keywords are those with a centrality greater than 0.1 [55,56]. The calculation formula is
B C i = s i t n s t i g s t ,
where g s t is the number of shortest paths from node s to node t , and n s t i is the number of shortest paths passing through node i among g s t shortest paths from node s to node t . As can be seen from Table 5, among the keywords with more than 20 occurrences are “achievement”, “children”, “working memory”, “ability”, “gender difference”, “literacy”, and academic achievement. It shows that these keywords have received extensive attention in the field of mathematical literacy research.

4.2. Keyword Cluster Analysis

“Cluster analysis” is a method used to summarize similar research topics to obtain representative clusters in related research fields, and analyze the overall situation of research fields from different perspectives [43]. Given this, to further explore the main directions of mathematical literacy research hotspots, we used the cosine algorithm in CiteSpace to cluster the literature in the field of mathematical literacy research, and present the top 10 clusters with the largest clustering scales (Figure 6 and Table 6). As seen in Figure 6, this cluster’s Q and S values are 0.7899 and 0.922, indicating that the clustering effect is significant and the result is credible. In CiteSpace6, the smaller the value of cluster ID, the larger the values of size and silhouette will be. Conversely, the larger the value of cluster ID, the smaller the values of size and silhouette will be. The higher the silhouette value, the higher the consistency among the cluster members [55]. As shown in Table 6, the values of silhouette are all above 0.85, indicating a high consistency among the members of the first ten clusters, which further verifies the significant clustering effect of this research and the credibility of the results. In addition, the “Mean(Year)” index shows that the average years of the cluster labels are between 2007 and 2015, and six of them are after 2010. By comparison, it is found that the year corresponding to the cluster tag differs from the year corresponding to high-frequency keywords. The reason is that the cluster transition corresponds to the average year, while the high-frequency words correspond to the year of their first appearance. Therefore, the difference between the two is normal. Consequently, it can be concluded that although some high-frequency keywords appeared earlier, they were only paid attention to by most researchers from 2007 to 2015, and the research results from 2007 to 2015 also played a role in promoting the research of mathematical literacy. According to Figure 6 and Table 6, the cluster size of the “Mathematical Literacy” (#0) cluster tag is the largest, which is related to the topic we retrieved, further indicating that our data source is reliable. At the same time, through the analysis of Figure 6 and Table 4, the research hotspots of mathematical literacy are identified. We divide them into the following four research points, which clearly demonstrate the knowledge structure and development of mathematical literacy.

4.2.1. Children’s Working Memory and Mathematical Literacy

This type of research mainly includes “working memory” (#1), “early childhood” (#5), and “student” (#9) in the cluster diagram, and the representative keywords include numeracy and working memory. Working memory is a good predictor of a child’s academic performance [57] and one of the most important mental tools when learning math [58]. Researchers found that working memory deficits may cause poor math performance in children [59]. In addition, the researchers also paid attention to the relationship between working memory and mathematical literacy in children and students [60,61], and found that as children’s working memory skills improved, their mathematical literacy levels also improved [62,63].

4.2.2. Brain Science and Mathematical Literacy

This type of research mainly includes the cluster graph “parietal cortex” (#2). Representative keywords include science and so on. Related research has shown that the relative engagement of brain mechanisms involved in procedural and memory-based computation is associated with high levels of mathematical ability [64]. In addition, there are differences in the neural mechanisms of the parietal lobe in individuals with mathematical learning disabilities, and Price et al. found that grey matter volume in the left IPS at the end of first grade was associated with mathematical ability one year later, at the end of the second grade [65]. Grabner et al. found that brain activation during mental computation was influenced by individual differences in mathematical ability, and confirmed the association between individual differences in mathematical ability and Angular Gyrus (AG) [66]. Subsequently, Grabner et al. further found that the relationship between AG activation and mathematical ability in arithmetic problem-solving appears to be due to differences in arithmetic fact extraction that can be attenuated by training [67]. Ansari et al. found that miscalculation activated the parietal cortex, but was affected by individual differences in math ability [68].

4.2.3. Math Achievement and Mathematical Literacy

This type of research mainly includes “math performance (#3)” in the cluster graph, and the representative keywords include “performance”. Studies have shown a significant correlation between mathematical literacy and math achievement, and good math achievement may lead to a higher level of mathematical literacy [69,70]. Zhao et al. found that student background was an important predictor of students’ math performance [71]. Clark et al. found a strong association between potential executive control and math performance at age 3, and the relationship between EC and math performance was stronger for girls than boys [72]. Ryan et al. found that negative stereotypes create situational stress in students that inhibits their performance in math [73]. In addition, Fleckenstein et al. found greater and faster improvements in math scores among immersion students than traditional students [74].

4.2.4. Teaching Strategies for Generating Mathematical Literacy

Many countries regard the generation of mathematical literacy as the primary goal of mathematics education, so the teaching strategy for the generation of mathematical literacy is also the focus of many researchers. This type of research mainly includes mathematics education (#4) and cognitive development (#8) in the cluster diagram, and mainly focuses on empirical research. Relevant experimental research shows that applying realistic mathematics education teaching methods has a significant role in promoting the development of children’s mathematical literacy [75]. The teaching strategies, such as integrating computers [76,77,78] into mathematics education and using Eduball physical exercise courses [79], can improve students’ mathematical literacy.

4.3. Research Evolution Trend Analysis

To better show the evolution trend of mathematical literacy research, CiteSpace was used to obtain the clustering time chart for this field (Figure 7). According to the first cluster of high-frequency keywords, we found that high-frequency keywords, such as language, children, and cognition, appeared in the cluster of working memory (#1). Further analysis shows that these keywords are related to the next keyword nodes on the clustering axis. This means that some scholars also use these keywords as the main line of their research in the next steps.
Furthermore, we also assessed the cluster working memory (#1). The keywords in this cluster are related to the keywords of other clusters, such as those in the mathematical education (#4) cluster. This indicates that the working memory (#1) cluster lays an important foundation for other research hotspots of mathematical literacy. Meanwhile, the cluster research on working memory (#1) has the longest duration and a trend of continuous attention, indicating that working memory is a major research hotspot in mathematical literacy. According to the time distribution of high-frequency keyword nodes, it is found that the time of the first occurrence of high-frequency keywords is mainly from 1995 to 2010, and there has been a very close relationship between these high-frequency keywords and other high-frequency keywords in recent years, indicating that the research in this period has laid the foundation for subsequent research. After 2010, although the number of high-frequency keywords decreased, there were more keyword nodes and more connections between keywords. This indicates that the related research on mathematical literacy has gradually expanded from concentrated research to a segmented field over time. Working memory (#1), mathematical education (#4), fractions (#7), and precinct beliefs (#6) cluster according to a similar rule. In particular, the evolution laws of working memory (#1) and mathematical education (#4) are the most obvious. For example, the high frequency words in the cluster of working memory (#1) and mathematical education (#4) decrease over time, while the number of relatively small nodes increases, which further confirms the evolution law of the extension of the research topic to the subdivision domain. However, not all clusters evolve in this way. Parietal cortex (#2), math performance (#3), early childhood (#5), cognitive development (#8), and student (#9) are some examples. These clusters did not show large keyword nodes during the whole study period.

5. Conclusions and Future Works

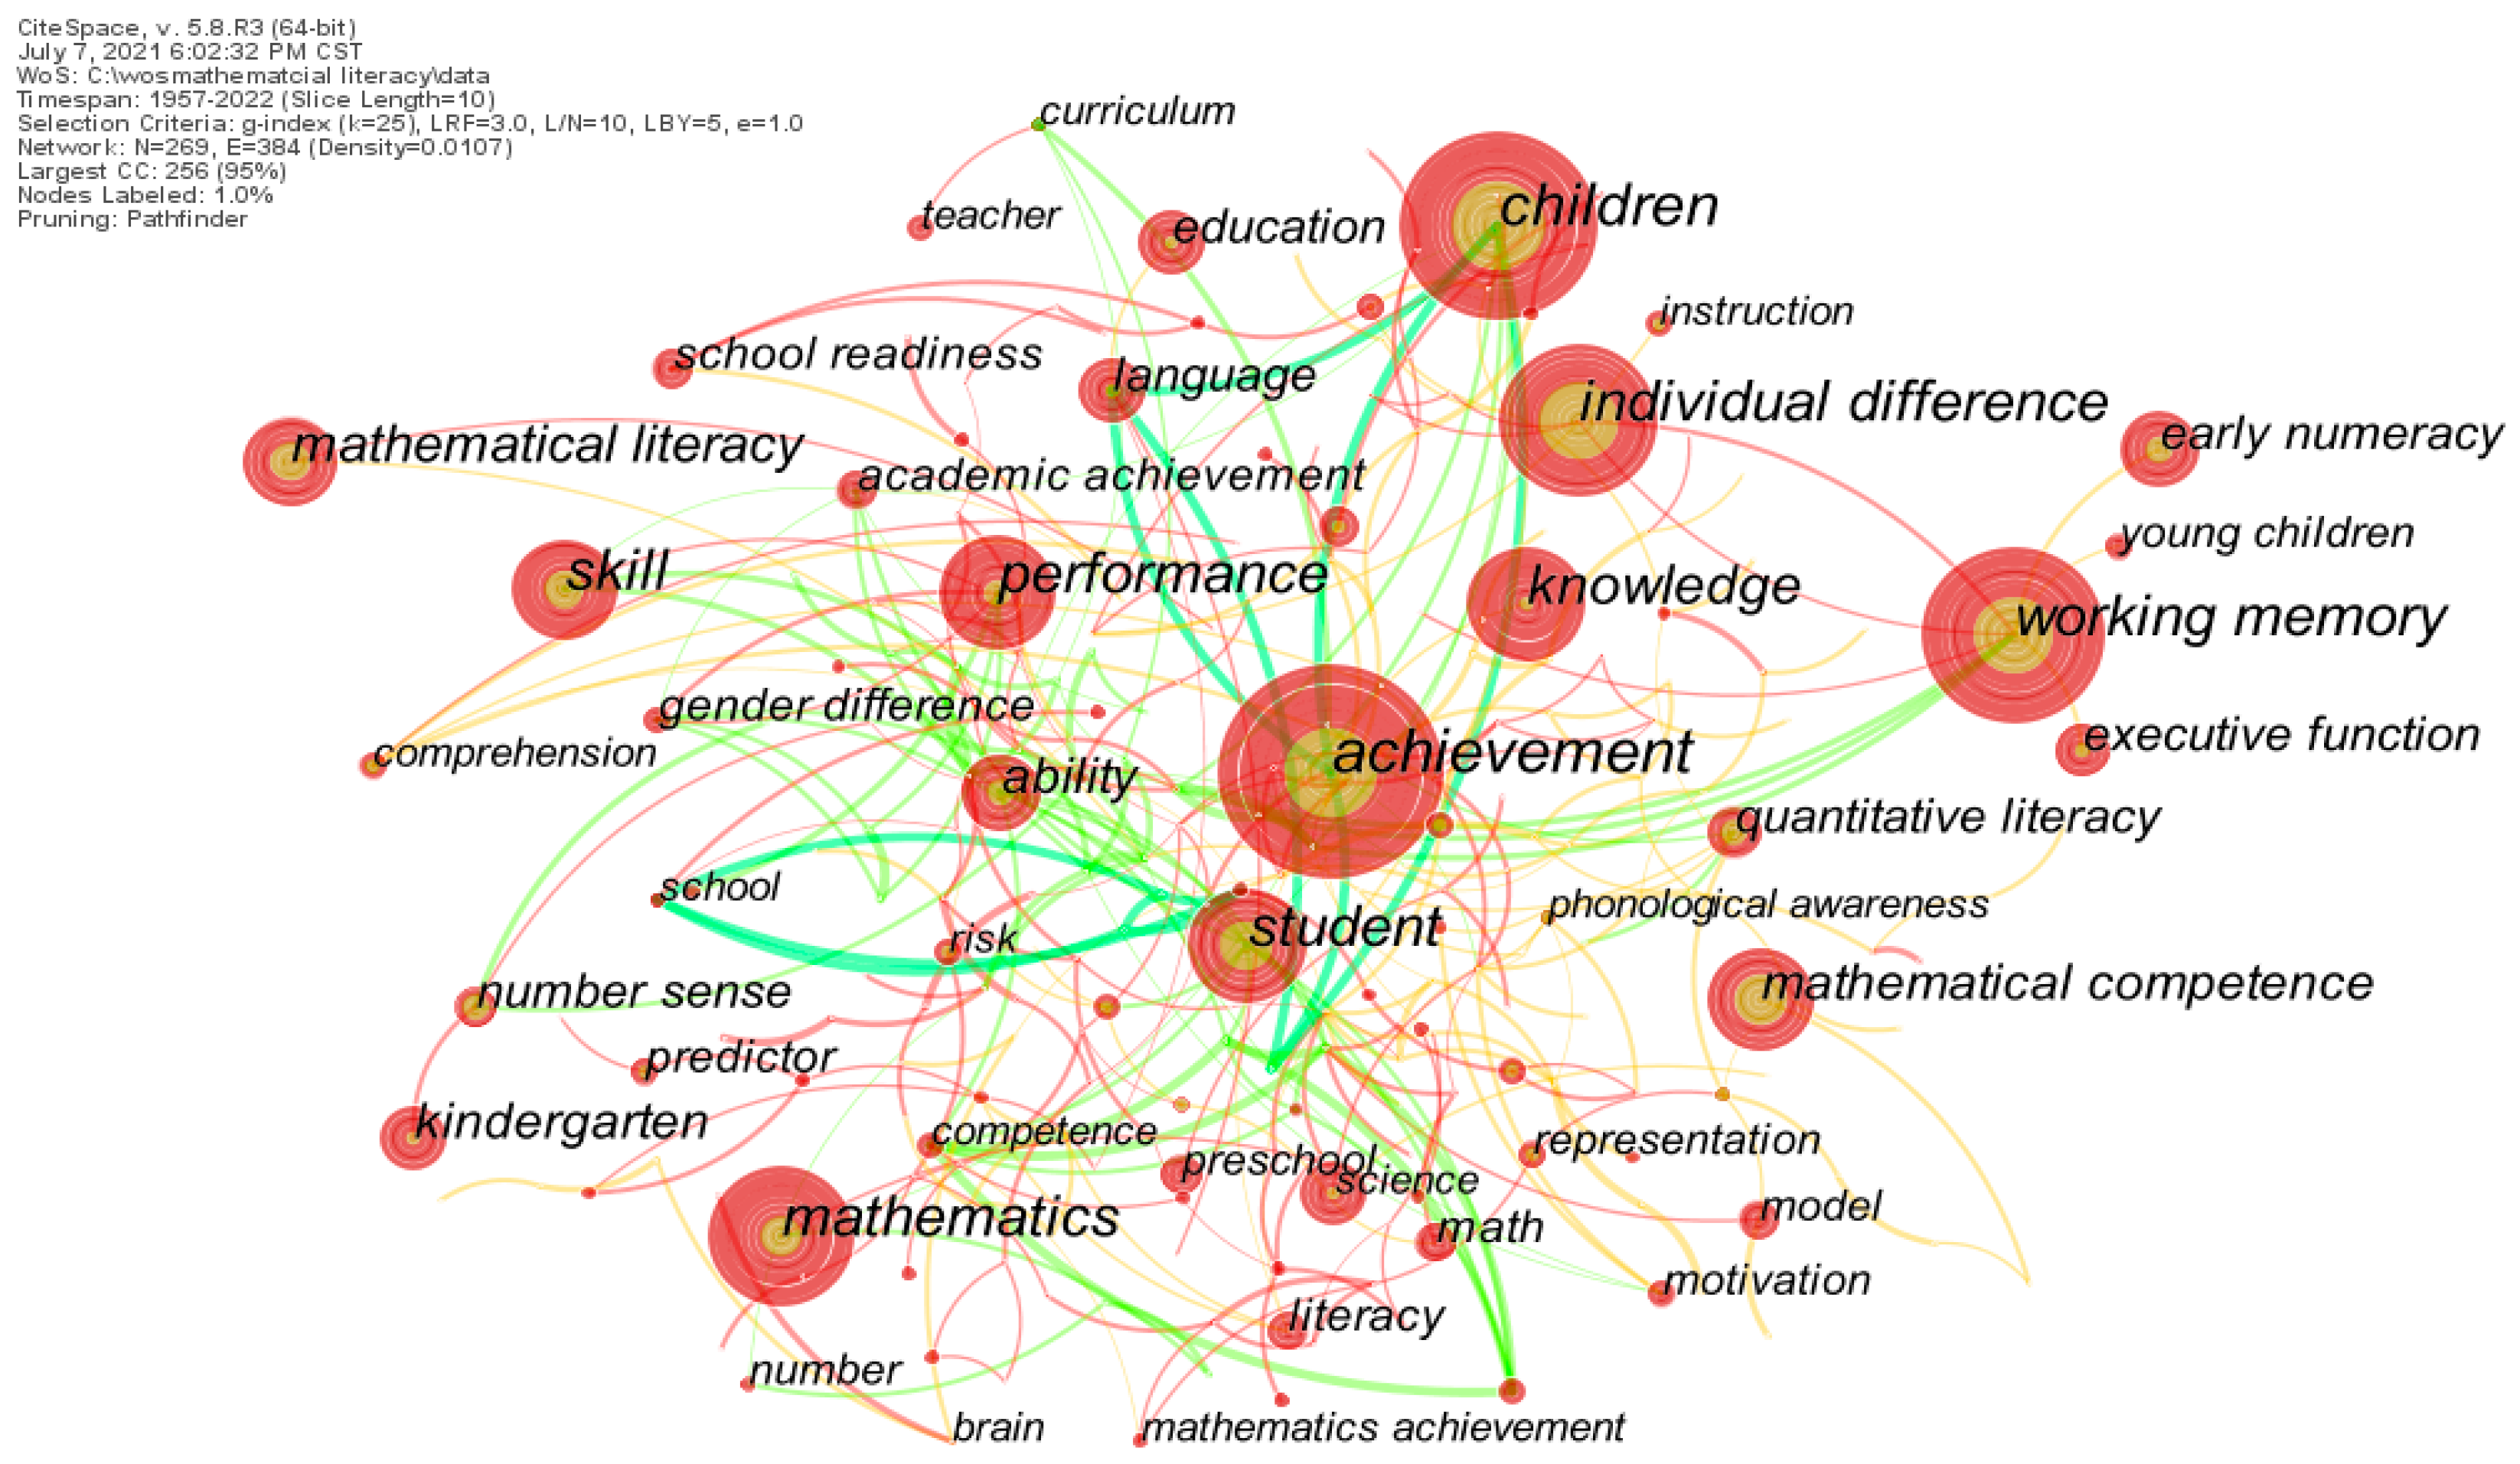
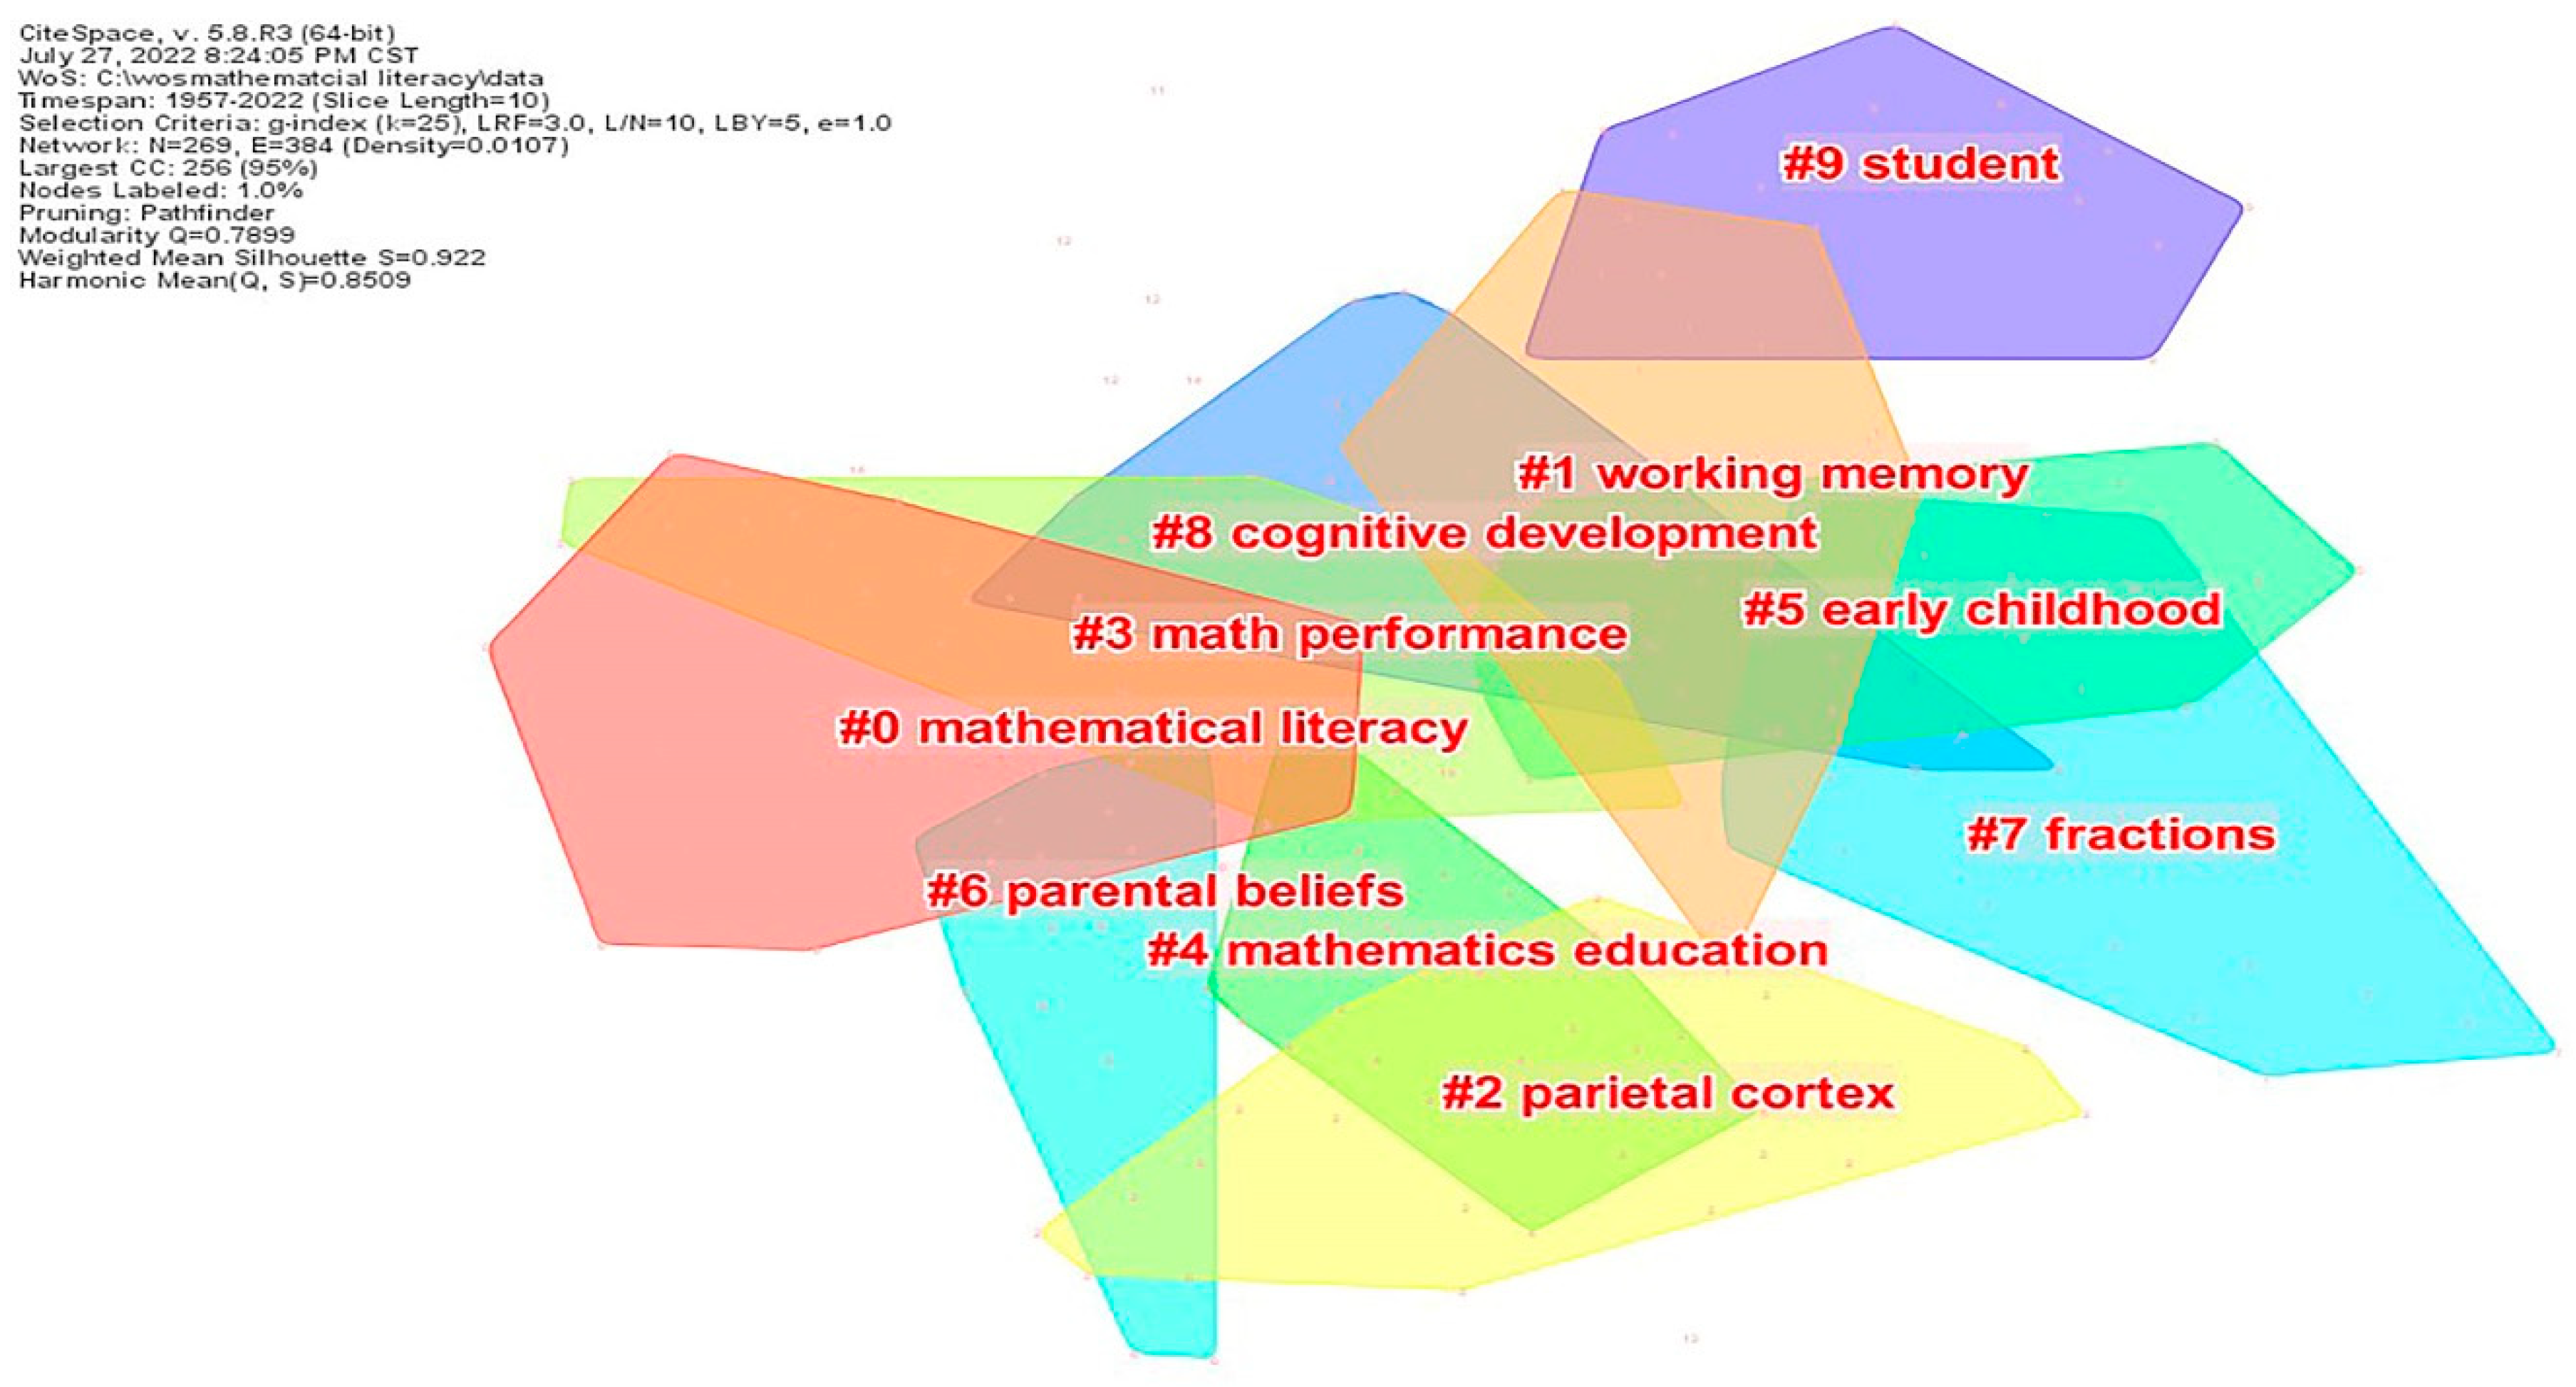
In this study, the CiteSpace and HistCite software were used to visually analyze the literature in the field of mathematical literacy research, and the research hotspots and evolution trends in this field were obtained. This study addresses an important issue that arose in previous reviews in this field; namely, there has not been a holistic analysis of the field of mathematical literacy research from multiple perspectives through a large body of literature, nor has any study fully revealed the changes over time. The main conclusions are as follows: (1) It is found that during the whole research period, the quantity of published mathematical literacy research has shown a steady upward trend, which can be divided into three stages—the germination stage (1957–2001), the slow development stage (2001–2011) and the prosperous development stage (2011–2022). (2) It is found that the United States, the United Kingdom, Germany, Australia, and other developed countries have published a large number of papers on mathematical literacy research, especially the United States, which is in the leading position. Among developing countries, China has the largest number of publications. In addition, the United States is outstanding in international cooperation, and Germany, Australia, the United Kingdom, and China have also shown good performance in international cooperation. At the same time, it is also found that the University of Utrecht, Purdue University, and Vanderbilt University have important academic influences on mathematical literacy research. At the same time, it is also found that the University of Utrecht, Purdue University, and Vanderbilt University have important academic influences on mathematical literacy research. It is also found that the scholar Purpura has the highest number of publications, and LCS and GCS are also high. Although LeFevre does not have the highest number of posts, its LCS and GCS are relatively high. It can be seen from the author’s cooperation network that scholars do not show high cooperation intensity on the whole. In the future, developing countries should further study the field of mathematical literacy research, and researchers should further strengthen cooperation to promote the development of mathematical literacy research. (3) The research on mathematical literacy focuses on four areas—working memory and mathematical literacy, brain science and mathematical literacy, mathematical achievement and mathematical literacy, and mathematical literacy generation strategy. It mainly covers 10 clusters, including working memory (#1), parallel cortex (#2), math performance (#3), mathematics education (#4), early childhood (#5), parent belief (#6), fractions (#7), cognitive development (#8), and student learning (#9). (4) The mathematical literacy research evolution trend has been discovered; there are different evolution trends among different clusters in the mathematical literacy research time axis. Working memory (#1), mathematical education (#4), fractions (#7), and parental beliefs (#6) form clusters, which gradually expand from focused research to subdivision fields with the evolution of time. The parietal cortex (#2), math performance (#3), early childhood (#5), cognitive development (#8), and students (#9) clusters did not show large keyword nodes during the whole study period.
The current research has some limitations. First, we only selected the literature on mathematical literacy research from the SCI-E and the SSCI databases of the Web of Science, and the conclusions may not fully represent the situation of global mathematical literacy research. In the future, we will search for more literature on mathematical literacy research and analyze it. Second, our analysis of the research hotspots and evolution trends of mathematical literacy may not be in-depth enough. In the future, we will further explore the hotspots and evolution trends of mathematical literacy research using visual software and quantitative and qualitative analysis. Third, we will look at the research trends in the field of mathematical literacy in the future.

Author Contributions

All authors confirm they have contributed to the preparation of this article. X.C., J.W., D.W., J.L. and J.Z. proposed the structure of the study together. X.C. performed the data collection and analysis and completed the paper. X.C., J.Z., J.W., D.W., J.L., D.S., D.Y. and Q.P. gave some good advice. All authors have read and agreed to the published version of the manuscript.

Funding

This work was supported by the National Natural Science Foundation of China (No. 61862051), the Science and Technology Foundation of Guizhou Province (No. [2019]1299), the Guizhou Educational Science Planning Project under grant (No. 2021B201, No. 2022B056), the Qianan Educational Science Planning Project under grant (No. 2021B001), the Qiannan Theoretical Innovation of Philosophy and Social Sciences (No. Qnsk2022092) and the Funds of Qiannan Normal University for Nationalities (No. qnsyxk201807, No. 2021gh19).

Institutional Review Board Statement

Not applicable.

Informed Consent Statement

Not applicable.

Data Availability Statement

Not applicable.

Conflicts of Interest

The authors declare no conflict of interest.

References

  1. Giftedness and Talent in the 21st Century: Adapting to the Turbulence of Globalization; Springer: Berlin/Heidelberg, Germany, 2016; Available online: https://sc.panda321.com/extdomains/books.google.com/books?hl=zh-CN&lr=&id=6mSvDAAAQBAJ&oi=fnd&pg=PR5&dq=Gifted-ness+and+talent+in+the+21st+century:+Adapting+to+the+turbulence+of+globalization&ots=0aNCYkPXlj&sig=9wnkFsoJHnm_Omt36Ma3tJfXIBs (accessed on 29 July 2022).
  2. OECD. PISA 2012 Assessment and Analytical Framework. Mathematics, Reading, Science, Problem Solving and Financial Literacy; OECD Publishing: Paris, France, 2013. [Google Scholar]
  3. Seitz, M.; Weinert, S. Numeracy skills in young children as predictors of mathematical competence. Br. J. Dev. Psychol. 2022, 40, 224–241. [Google Scholar] [CrossRef] [PubMed]
  4. Meaney, T. Weighing up the Influence of Context on Judgements of Mathematical Literacy. Int. J. Sci. Math. Educ. 2007, 5, 681–704. [Google Scholar] [CrossRef]
  5. Kilpatrick, J. Understanding mathematical literacy: The contribution of research. Educ. Stud. Math. 2001, 47, 101–116. [Google Scholar] [CrossRef]
  6. Crowther, G. 15 to 18: A Report of the Central Advisory Council for Education (England); HM Stationery Office: London, UK, 1959. [Google Scholar]
  7. Cockcroft, W.H. Mathematics Counts; HM Stationery Office: London, UK, 1982; Available online: http://www.educationengland.org.uk/documents/cockcroft/cockcroft1982.html (accessed on 29 July 2022).
  8. DfEE. The National Numeracy Strategy: Framework for Teaching Mathematics from Reception to Year 6; DfEE Publications: London, UK, 1999. [Google Scholar]
  9. Department of Education. The National Curriculum in England: Framework for Key Stages 1–4. Available online: https://www.gov.uk/government/publications/national-curriculum-in-england-framework-for-key-stages-1-to-4 (accessed on 29 July 2022).
  10. National Council of Teachers of Mathematics. Curriculum and Evaluation Standards for School Mathematics; National Council of Teachers of Mathematics: Reston, VA, USA, 1989. [Google Scholar]
  11. National Council of Teachers of Mathematics, Inc. Principles and Standards for School Mathematics: Discussion Draft; National Council of Teachers of Mathematics: Reston, VA, USA, 1998; Available online: https://www.nctm.org/classroomresources/ (accessed on 1 August 2022).
  12. National Research Council; Mathematics Learning Study Committee. Adding It Up: Helping Children Learn Mathematics; National Academy Press: Washington, DC, USA, 2001. [Google Scholar]
  13. Niss, M. Mathematical competencies and the learning of mathematics: The Danish KOM project. In Proceedings of the 3rd Mediterranean Conference on Mathematical Education, Athens, Greece, 3–5 January 2003; pp. 115–124. Available online: http://www.math.chalmers.se/Math/Grundutb/CTH/mve375/1213/docs/KOMkompetenser.pdf (accessed on 1 August 2022).
  14. Curriculum and Assessment Policy Statement (CAPS): Mathematical Literacy (Grades 10–12); Republic of South Africa Department of Basic Education: Pretoria, South Africa, 2012.
  15. OECD. The PISA 2003 Assessment Framework: Mathematics, Reading, Science and Problem Solving Knowledge and Skills; OECD Publishing: Paris, France, 2004. [Google Scholar] [CrossRef]
  16. Martin, M.O.; Mullis, S., IV; Foy, P. TIMSS 2015 Assessment Design; TIMSS: Amsterdam, The Netherlands, 2015; pp. 85–99. Available online: https://timssandpirls.bc.edu/timss2015/downloads/T15_FW_Chap4.pdf (accessed on 1 August 2022).
  17. Altun, M.; Bozkurt, I. A New Classification Proposal for Mathematical Literacy Problems. Egit. Bilim 2017, 42, 171–188. [Google Scholar] [CrossRef] [Green Version]
  18. Bolstad, O.H. Lower secondary students’ encounters with mathematical literacy. Math. Educ. Res. J. 2021, 1–17. [Google Scholar] [CrossRef]
  19. Gatabi, A.R.; Stacey, K.; Gooya, Z. Investigating grade nine textbook problems for characteristics related to mathematical literacy. Math. Educ. Res. J. 2012, 24, 403–421. [Google Scholar] [CrossRef]
  20. Katranci, Y.; Sengul, S. The Relationship between Mathematical Literacy and Visual Math Literacy Self-Efficacy Perceptions of Middle School Students = Ortaokul ögrencilerinin matematik okuryazarligi ile görsel matematik okuryazarligi öz-yeterlik algilari arasindaki iliski. Pegem J. Educ. Instr. 2019, 9, 1113–1138. [Google Scholar] [CrossRef] [Green Version]
  21. Guzel, C.I.; Berberoglu, G. Students’ affective characteristics and their relation to mathematical literacy measures in the Pro-gramme for International Student Assessment (PISA) 2003. Eurasian J. Educ. Res. 2010, 40, 93–113. [Google Scholar]
  22. Kaur, B.; Areepattamannil, S. Influences of Metacognitive and Self-Regulated Learning Strategies for Reading on Mathematical Literacy of Adolescents in Australia and Singapore; Mathematics Education Research Group of Australasia: Payneham, Australia, 2012. [Google Scholar]
  23. Ozgen, K. An Analysis of High School Students’ Mathematical Literacy Self-efficacy Beliefs in Relation to Their Learning Styles. Asia-Pac. Educ. Res. 2012, 22, 91–100. [Google Scholar] [CrossRef]
  24. Gabriel, F.; Buckley, S.; Barthakur, A. The impact of mathematics anxiety on self-regulated learning and mathematical literacy. Aust. J. Educ. 2020, 64, 227–242. [Google Scholar] [CrossRef]
  25. Geary, D.C.; Hoard, M.K.; Nugent, L.; Ünal, Z.E. Sex differences in developmental pathways to mathematical competence. J. Educ. Psychol. 2022. [Google Scholar] [CrossRef]
  26. Canbazoglu, H.B.; Tarim, K. An Activity-Based Practice for Improving Mathematical Literacy and Awareness of Elementary School Teacher Candidates= Sinif ögretmeni adaylarinin matematik okuryazarligi ve farkindaliklarinin gelistirilmesine yönelik etkinlik temelli bir uygulama. Pegem J. Educ. Instr. 2020, 10, 1183–1218. [Google Scholar] [CrossRef]
  27. Kramarski, B.; Mizrachi, N. Online discussion and self-regulated learning: Effects of instructional methods on mathematical literacy. J. Educ. Res. 2006, 99, 218–231. [Google Scholar] [CrossRef]
  28. Goffman, W.; Harmon, G. Mathematical Approach to the Prediction of Scientific Discovery. Nature 1971, 229, 103–104. [Google Scholar] [CrossRef]
  29. Senturk, I.; Gursoy, N.K.; Oner, T.; Gursoy, A. A novel algorithmic construction for deductions of categorical polysyllogisms by Carroll’s diagrams. Inf. Sci. 2021, 578, 236–256. [Google Scholar] [CrossRef]
  30. Moktefi, A.; Shin, S.J. (Eds.) Visual Reasoning with Diagrams; Springer Science & Business Media: Berlin/Heidelberg, Germany, 2013. [Google Scholar]
  31. Garfield, E. From the science of science to Scientometrics visualizing the history of science with HistCite software. J. Inf. 2009, 3, 173–179. [Google Scholar] [CrossRef] [Green Version]
  32. Chen, C. Searching for intellectual turning points: Progressive knowledge domain visualization. Proc. Natl. Acad. Sci. USA 2004, 101 (Suppl. S1), 5303–5310. [Google Scholar] [CrossRef] [Green Version]
  33. Pillai, S.P.M.; Galloway, G.; Adu, E. Comparative Studies of Mathematical Literacy/Education: A Literature Review. Int. J. Educ. Sci. 2017, 16, 67–72. [Google Scholar] [CrossRef]
  34. Ulger, T.K.; Bozkurt, I.; Altun, M. Thematic Analysis of Articles Focusing on Mathematical Literacy in Mathematics Teach-ing-Learning Process. Educ. Sci. 2020, 45, 1–38. [Google Scholar]
  35. Hillman, A.M. A Literature Review on Disciplinary Literacy: How do secondary teachers apprentice students into mathematical literacy? J. Adolesc. Adult Lit. 2013, 57, 397–406. [Google Scholar] [CrossRef]
  36. Glanzel, W. Bibliometrics as a Research Field a Course on Theory and Application of Bibliometric Indicators. 2003. Available online: http://nsdl.niscair.res.in/bitstream/123456789/968/1/Bib_Module_KUL.pdf (accessed on 20 October 2022).
  37. Du, H.; Li, B.; Brown, M.A.; Mao, G.; Rameezdeen, R.; Chen, H. Expanding and shifting trends in carbon market research: A quantitative bibliometric study. J. Clean. Prod. 2015, 103, 104–111. [Google Scholar] [CrossRef]
  38. Chen, C. CiteSpace II: Detecting and visualizing emerging trends and transient patterns in scientific literature. J. Am. Soc. Inf. Sci. Technol. 2006, 57, 359–377. [Google Scholar] [CrossRef] [Green Version]
  39. Farine, D.R. Proximity as a proxy for interactions: Issues of scale in social network analysis. Anim. Behav. 2015, 104, e1–e5. [Google Scholar] [CrossRef] [Green Version]
  40. Rousseeuw, P.J. Silhouettes: A graphical aid to the interpretation and validation of cluster analysis. J. Comput. Appl. Math. 1987, 20, 53–65. [Google Scholar] [CrossRef] [Green Version]
  41. Wang, D.; Huangfu, Y.; Dong, Z.; Dong, Y. Research Hotspots and Evolution Trends of Carbon Neutrality—Visual Analysis of Bibliometrics Based on CiteSpace. Sustainability 2022, 14, 1078. [Google Scholar] [CrossRef]
  42. Wang, Z.; Ma, D.; Pang, R.; Xie, F.; Zhang, J.; Sun, D. Research Progress and Development Trend of Social Media Big Data (SMBD): Knowledge Mapping Analysis Based on CiteSpace. ISPRS Int. J. Geo-Inf. 2020, 9, 632. [Google Scholar] [CrossRef]
  43. Zhao, Y.; Guo, J.; Bao, C.; Liang, C.; Jain, H.K. Knowledge Graph Analysis of Human Health Research Related to Climate Change. Int. J. Environ. Res. Public Health 2020, 17, 7395. [Google Scholar] [CrossRef]
  44. Shi, D.; Zhou, J.; Wang, D.; Wu, X. Research Status, Hotspots, and Evolutionary Trends of Intelligent Education from the Perspective of Knowledge Graph. Sustainability 2022, 14, 10934. [Google Scholar] [CrossRef]
  45. Muthén, B.; Muthén, L. Mplus. In Handbook of Item Response Theory; Chapman and Hall/CRC: Boca Raton, FL, USA, 2017; pp. 507–518. Available online: https://www.taylorfrancis.com/chapters/edit/10.1201/9781315117430-28/mplus-bengt-muth%C3%A9n-linda-muth%C3%A9n (accessed on 2 August 2022).
  46. Gilmore, C.; Attridge, N.; Clayton, S.; Cragg, L.; Johnson, S.; Marlow, N.; Simms, V.; Inglis, M. Individual Differences in Inhibitory Control, Not Non-Verbal Number Acuity, Correlate with Mathematics Achievement. PLoS ONE 2013, 8, e67374. [Google Scholar] [CrossRef] [Green Version]
  47. Purpura, D.J.; Reid, E.E. Mathematics and language: Individual and group differences in mathematical language skills in young children. Early Child. Res. Q. 2016, 36, 259–268. [Google Scholar] [CrossRef]
  48. Holloway, I.D.; Ansari, D. Mapping numerical magnitudes onto symbols: The numerical distance effect and individual differences in children’s mathematics achievement. J. Exp. Child Psychol. 2009, 103, 17–29. [Google Scholar] [CrossRef] [PubMed]
  49. Thompson, R.J.; Napoli, A.R.; Purpura, D.J. Age-related differences in the relation between the home numeracy environment and numeracy skills. Infant Child Dev. 2017, 26, e2019. [Google Scholar] [CrossRef]
  50. Nguyen, T.; Watts, T.W.; Duncan, G.J.; Clements, D.H.; Sarama, J.S.; Wolfe, C.; Spitler, M.E. Which preschool mathematics competencies are most predictive of fifth grade achievement? Early Child. Res. Q. 2016, 36, 550–560. [Google Scholar] [CrossRef] [Green Version]
  51. Missall, K.; Hojnoski, R.L.; Caskie, G.I.L.; Repasky, P. Home Numeracy Environments of Preschoolers: Examining Relations Among Mathematical Activities, Parent Mathematical Beliefs, and Early Mathematical Skills. Early Educ. Dev. 2014, 26, 356–376. [Google Scholar] [CrossRef]
  52. Schneider, M.; Beeres, K.; Coban, L.; Merz, S.; Schmidt, S.S.; Stricker, J.; De Smedt, B. Associations of non-symbolic and symbolic numerical magnitude processing with mathematical competence: A meta-analysis. Dev. Sci. 2016, 20, e12372. [Google Scholar] [CrossRef]
  53. De Smedt, B.; Noël, M.-P.; Gilmore, C.; Ansari, D. How do symbolic and non-symbolic numerical magnitude processing skills relate to individual differences in children’s mathematical skills? A review of evidence from brain and behavior. Trends Neurosci. Educ. 2013, 2, 48–55. [Google Scholar] [CrossRef] [Green Version]
  54. Wang, X.; Guo, J.; Gu, D.; Yang, Y.; Yang, X.; Zhu, K. Tracking knowledge evolution, hotspots and future directions of emerging technologies in cancers research: A bibliometrics review. J. Cancer 2019, 10, 2643–2653. [Google Scholar] [CrossRef] [Green Version]
  55. Yang, Y.; Qu, G.; Hua, L. Research Status, Hotspots, and Evolution Trend of Decision-Making in Marine Management Using VOSviewer and CiteSpace. Math. Probl. Eng. 2022, 2022, 8283417. [Google Scholar] [CrossRef]
  56. Li, Y.; Fang, R.; Liu, Z.; Jiang, L.; Zhang, J.; Li, H.; Liu, C.; Li, F. The association between toxic pesticide environmental exposure and Alzheimer’s disease: A scientometric and visualization analysis. Chemosphere 2020, 263, 128238. [Google Scholar] [CrossRef]
  57. Alloway, T.P.; Gathercole, S.E.; Adams, A.-M.; Willis, C.; Eaglen, R.; Lamont, E. Working memory and phonological awareness as predictors of progress towards early learning goals at school entry. Br. J. Dev. Psychol. 2005, 23, 417–426. [Google Scholar] [CrossRef] [Green Version]
  58. Geary, D.C. Mathematics and Learning Disabilities. J. Learn. Disabil. 2004, 37, 4–15. [Google Scholar] [CrossRef] [PubMed]
  59. Kyttälä, M.; Aunio, P.; Hautamäki, J. Working memory resources in young children with mathematical difficulties. Scand. J. Psychol. 2010, 51, 1–15. [Google Scholar] [CrossRef] [PubMed]
  60. Jordan, A.-K.; Duchhardt, C.; Heinze, A.; Tresp, T.; Grüßing, M. Mehr als numerische Basiskompetenzen? Zur Dimensionalität und Struktur mathematischer Kompetenz von Kindergartenkindern. Psychol. Erzieh. Unterr. 2015, 62, 205–217. [Google Scholar] [CrossRef]
  61. Passolunghi, M.C.; Costa, H.M. Working memory and early numeracy training in preschool children. Child Neuropsychol. 2014, 22, 81–98. [Google Scholar] [CrossRef]
  62. Kroesbergen, E.H.; Noordende, J.E.V.; Kolkman, M.E. Training working memory in kindergarten children: Effects on working memory and early numeracy. Child Neuropsychol. 2012, 20, 23–37. [Google Scholar] [CrossRef]
  63. Toll, S.W.; Van Luit, J.E. Accelerating the early numeracy development of kindergartners with limited working memory skills through remedial education. Res. Dev. Disabil. 2013, 34, 745–755. [Google Scholar] [CrossRef]
  64. Price, G.R.; Mazzocco, M.M.M.; Ansari, D. Why Mental Arithmetic Counts: Brain Activation during Single Digit Arithmetic Predicts High School Math Scores. J. Neurosci. 2013, 33, 156–163. [Google Scholar] [CrossRef] [Green Version]
  65. Price, G.R.; Wilkey, E.D.; Yeo, D.J.; Cutting, L.E. The relation between 1st grade grey matter volume and 2nd grade math competence. NeuroImage 2016, 124, 232–237. [Google Scholar] [CrossRef] [Green Version]
  66. Grabner, R.H.; Ansari, D.; Reishofer, G.; Stern, E.; Ebner, F.; Neuper, C. Individual differences in mathematical competence predict parietal brain activation during mental calculation. NeuroImage 2007, 38, 346–356. [Google Scholar] [CrossRef]
  67. Grabner, R.H.; Ischebeck, A.; Reishofer, G.; Koschutnig, K.; Delazer, M.; Ebner, F.; Neuper, C. Fact learning in complex arithmetic and figural-spatial tasks: The role of the angular gyrus and its relation to mathematical competence. Hum. Brain Mapp. 2009, 30, 2936–2952. [Google Scholar] [CrossRef]
  68. Ansari, D.; Grabner, R.H.; Koschutnig, K.; Reishofer, G.; Ebner, F. Individual differences in mathematical competence modulate brain responses to arithmetic errors: An fMRI study. Learn. Individ. Differ. 2011, 21, 636–643. [Google Scholar] [CrossRef]
  69. Lin, S.-W.; Tai, W.-C. Latent Class Analysis of Students’ Mathematics Learning Strategies and the Relationship between Learning Strategy and Mathematical Literacy. Univers. J. Educ. Res. 2015, 3, 390–395. [Google Scholar] [CrossRef]
  70. Yılmazer, G.; Masal, M. The Relationship between Secondary School Students’ Arithmetic Performance and their Mathematical Literacy. Procedia-Soc. Behav. Sci. 2014, 152, 619–623. [Google Scholar] [CrossRef] [Green Version]
  71. Zhao, N.; Valcke, M.; Desoete, A.; Verhaeghe, J.; Xu, K. A multilevel analysis on predicting mathematics performance in Chinese primary schools: Implications for practice. Asia-Pac. Educ. Res. 2011, 20, 503–520. [Google Scholar]
  72. Clark, C.A.C.; Sheffield, T.D.; Wiebe, S.; Espy, K.A. Longitudinal Associations Between Executive Control and Developing Mathematical Competence in Preschool Boys and Girls. Child Dev. 2012, 84, 662–677. [Google Scholar] [CrossRef]
  73. Ryan, K.E.; Ryan, A.M. Psychological Processes Underlying Stereotype Threat and Standardized Math Test Performance. Educ. Psychol. 2005, 40, 53–63. [Google Scholar] [CrossRef]
  74. Fleckenstein, J.; Gebauer, S.K.; Möller, J. Promoting mathematics achievement in one-way immersion: Performance development over four years of elementary school. Contemp. Educ. Psychol. 2019, 56, 228–235. [Google Scholar] [CrossRef]
  75. Papadakis, S.; Kalogiannakis, M.; Zaranis, N. Improving Mathematics Teaching in Kindergarten with Realistic Mathematical Education. Day Care Early Educ. 2016, 45, 369–378. [Google Scholar] [CrossRef]
  76. García-Perales, R.; Palomares-Ruiz, A. Education in Programming and Mathematical Learning: Functionality of a Programming Language in Educational Processes. Sustainability 2020, 12, 10129. [Google Scholar] [CrossRef]
  77. Frith, V.; Jaftha, J.; Prince, R. Evaluating the effectiveness of interactive computer tutorials for an undergraduate mathematical literacy course. Br. J. Educ. Technol. 2004, 35, 159–171. [Google Scholar] [CrossRef]
  78. Albert, M.J.; Blazquez-Merino, M.; Lopez-Rey, A.; Castro, M. Influence of Technological Resources on the Development of Mathematical Competence in High School. IT Prof. 2021, 23, 19–25. [Google Scholar] [CrossRef]
  79. Cichy, I.; Kaczmarczyk, M.; Wawrzyniak, S.; Kruszwicka, A.; Przybyla, T.; Klichowski, M.; Rokita, A. Participating in Physical Classes Using Eduball Stimulates Acquisition of Mathematical Knowledge and Skills by Primary School Students. Front. Psychol. 2020, 11, 2194. [Google Scholar] [CrossRef] [PubMed]
Figure 1. The annual number of published articles. (The broken blue line represents the annual publication volume, and the red scatter is the trend of annual publication volume obtained by fitting the exponential function between the annual publication volume and the year.)
Sustainability 14 13842 g001
Figure 2. Knowledge map of author collaboration in mathematical literacy.
Sustainability 14 13842 g002
Figure 3. Knowledge map of institutions’ collaboration in mathematical literacy.
Sustainability 14 13842 g003
Figure 4. Knowledge map of authors’ collaboration in mathematical literacy.
Sustainability 14 13842 g004
Figure 5. Visual knowledge mapping of keywords co-occurrence.
Sustainability 14 13842 g005
Figure 6. Visual knowledge mapping of keyword clusters.
Sustainability 14 13842 g006
Figure 7. The timeline view of keywords clusters.
Sustainability 14 13842 g007
Table 1. The countries/regions with more than 13 publications and their numbers of published articles.
CountryNumber of Published ArticlesLCSGCS
USA2182996404
England53271478
Germany44621206
Australia4128430
China2923672
Canada291281684
Holland2663730
Spain2610295
South Africa2010156
Belgium15552
Turkey13578
Sweden134177
Table 2. Institutions with more than 5 publications and their numbers of publications.
InstitutionNumber of Published ArticlesLocal Citation Score (LCS)Global Citation Score (GCS)Country
University of Utrecht1422426Holland
Purdue University1455327the United States
Vanderbilt University1113189the United States
University of Illinois1152539the United States
Katholieke University Leuven94185Belgium
University of Oslo9257Norway
University Missouri88200the United States
Australian Catholic University8227Australia
Beijing Normal University88835China
Carleton University771762Canada
University of Oregon77155the United States
The University of Western Ontario737544Canada
Stanford University6055the United States
Emory University610278the United States
University of Oxford63128England
University of Granada64174Spain
leibniz Inst Educ trajectories6122Germany
Carnegie Mellon University63248the United States
The University of Iowa617159the United States
NYU63110the United States
University of California, Berkeley6163the United States
University of Cape Town6215South Africa
University of Hong Kong67199China
University of Texas at Austin6230the United States
University of Helsinki622213Finland
Table 3. Authors with more than 5 publications and their numbers of publications.
AuthorRecsLCSGCS
Purpura D.J.1488502
Ansari D.837551
Grabner R.H.832444
Van Luit J.E.H.821337
Verschaffel L.7252
Price G.R.67138
Aunio P.522196
Ebner F.530381
Geary D.C.58193
Gnambs T.5012
LeFevre J.A.571726
Lourenco S.F.59237
Reishofer G.530381
Schmitt S.A.5241
Table 4. References cited more than 10 times.
AuthorsTitleReferences Cited TimesYear
Muthen L., et al. [45]MPLUS USERS GUIDE24
Schneider, Michael, et al. [52]Associations of nonsymbolic and symbolic numerical magnitude processing with mathematical competence: A meta-analysis162017
Nguyen, Tutrang, et al. [50]Which preschool mathematics competencies are most predictive of fifth grade achievement?132016
Holloway, I.D., and Ansari, D. [48]Mapping numerical magnitudes onto symbols: The numerical distance effect and individual differences in children’s mathematics achievement132009
Missall, Kristen, et al. [51]Home numeracy environments of preschoolers: Examining relations among mathematical activities, parent mathematical beliefs, and early mathematical skills122015
De Smedt, et al. [53]How do symbolic and nonsymbolic numerical magnitude processing relate to individual differences in children’s mathematical skills? A review of evidence from brain and behavior122013
Thompson, et al. [49]Age-related differences in the relation between the home numeracy environment and numeracy skills122017
Purpura, D.J., and Reid, E.E. [47]Mathematics and language: Individual and group differences in mathematical language skills in young children102016
Gilmore, Camilla, et al. [46]Individual differences in inhibitory control, not non-verbal number acuity, correlate with mathematics achievement102013
Table 5. Keywords with frequency over 20.
CountCentralityYearKeywordsCountCentralityYearKeywords
970.121995achievement310.002009early numeracy
780.201995children290.081995language
700.032007Individual difference280.002010education
690.102002working memory280.042006number sense
570.071997skill260.002009executive function
550.052001mathematics250.082011school readiness
550.011999performance240.111999gender difference
550.092002student240.012011predictor
490.002007knowledge240.122007literacy
380.012008mathematical literacy230.012010math
370.002007mathematical competence230.262003academic achievement
350.002009kindergarten220.011998number
340.212001ability220.072008representation
310.021997quantitative literacy
Table 6. Keyword clusters’ related data statistics.
Cluster IDSizeSilhouetteMean (Year)Label
0280.9082008Mathematical literacy
1260.9362008Working memory
2240.8512013Parietal cortex
3210.942013Math performance
4190.9212007Mathematical education
5190.8332012Early childhood
6180.892010Parental beliefs
7180.9712012Fractions
8170.9712009Cognitive development
9160.9182015Student
10150.9512012Academic performance
Publisher’s Note: MDPI stays neutral with regard to jurisdictional claims in published maps and institutional affiliations.

