1. Introduction
Climate change has become an important global ecological and environmental concern to the international community. The signing of framework agreements such as the United Nations Framework Convention on Climate Change (UNFCCC) and the Kyoto protocol has contributed to the establishment of a trading market with greenhouse gas emission rights as commodities, so that countries can achieve certain emission reduction targets through market-oriented means at a lower total cost. The 2022 International Carbon Action Partnership (ICAP) Status Report demonstrates how emission trading system (ETS) developments are proliferating and picking up pace across the globe, with an increasing number of systems. There are now 25 such systems in force, covering 17% of global GHG emissions. A total of 22 ETSs are currently under development or under consideration, mainly in South America and South-East Asia. Today, almost one third of the global population lives under an active ETS [
1].
As the largest carbon emitter, China aims to reach its peak in CO2 emissions before 2030 and achieve carbon neutrality before 2060. The construction and stable operation of a national unified carbon market is one of the effective means for China to achieve this goal. On a global scale, big differences exist among countries and regions regarding the coverage and trading mechanism of carbon trading markets. Difficulties and challenges will remain in the future regarding how to expand the scope of national and regional carbon markets and how to explore the establishment of a global unified carbon trading system. Europe is the most successful region in the development of regional integration and is the leader and promoter in the field of ecological environment. The European Union Emissions Trading System (EU ETS) is the most mature carbon market in the world, which is worth using for reference.
The success of the European unified carbon market benefits from the development of European integration, which is nevertheless a dynamic process. While the European Union (EU) continues to expand eastward, Brexit has brought great uncertainty to the future of the EU. Continuous changes in the process of European integration are alongside changes of EU ETS members. In the first stage of the EU ETS from 2005 to January 2021, six countries joined successively, and the UK also left the EU ETS due to its withdrawal from the EU. The entry and exit of a country will have an impact on both the supply and demand of emission allowances, therefore, affecting carbon prices. In addition, since all new member states that accede to the EU become members of the EU ETS as they adopt and implement EU legislation [
2], apart from formally joining or withdrawing from the EU ETS, entering or exiting the EU process may also affect traders’ expectations of supply and demand in the carbon market, thus, also affecting carbon prices. The Paris agreement has set the control target of long-term global warming, which promotes the establishment of a unified global carbon market. The two UN climate conferences in 2018 and 2019 also negotiated the establishment of a unified global carbon trading system. The establishment of a worldwide unified carbon market has become a future development trend and the carbon markets of various countries and regions will also face expansion and integration. In the case of China, nine regional carbon markets with national records were established by the end of 2021, and the construction of a national carbon emissions trading market began in December 2017. The market was officially launched in July 2021 and more industry and regional members will become involved in the future. Therefore, exploring the impact of the process of entering and leaving the EU on carbon prices can provide reference not only for EU ETS traders and regulators, but also for the construction of China and even the world unified carbon market in aspects of market risk management and allowances allocation.
Based on the perspective of supply and demand, the factors affecting the operation of carbon markets mainly include macroeconomic conditions, policies and systems, energy prices and weather. Studies mainly focus on the relationship between macro-economic conditions [
3,
4,
5] or energy prices [
6,
7,
8,
9,
10,
11,
12] and carbon price fluctuations. Few studies explore the impact of policy factors on the operation of carbon markets. The interdisciplinary research methods of economics and political science are utilized in this paper to form a useful supplement to this research perspective.
Using the event study methodology, the paper examines the effects of 22 key events in countries’ process of entering and exiting the EU on the returns of European Union Allowance (EUA) future prices in the EU ETS. The events include 17 entry events concerning the signing of relevant agreements, becoming a candidate or potential candidate country, the process of a negotiation and formally entering the EU, and five exit events including the process of Brexit and the suspension of Iceland. The results show that two entry events involving Albania and Ukraine, respectively, have a significant positive impact, and five entry events have a significant negative impact. Among the exit events, the announcement of the Brexit referendum results causes a significant negative impact. It indicates that for most small carbon emitters, the promotion of their EU accession process tends to generate market expectation that the allocation of the EU ETS to the country’s emission allowances will be greater than its demand. The situation for large emitters is the opposite. Most events regarding small carbon emitters entering the EU cause a negative market reaction and a significant negative correlation between the countries’ annual average carbon emissions, and cumulative abnormal returns of EUA prices are found. It is likely that the greater the country’s carbon emission, the stronger the expectation of this oversupply. Therefore, carbon market regulators should pay attention to the policy arrangement of allowances allocation. For the EU ETS, the allowances allocation for small economies should be appropriately reduced and the allocation for large economies should be increased. The change of the EU ETS national allocation scheme from National Allocation Plan (NAP) to National Implementation Measure (NIM) has no significant impact on reversing the market expectations of allowances allocation, indicating that the EU ETS should further improve the rationality of allowances allocation, especially to appropriately reduce the allocation of small economies and expand the market transparency. Regulators in China and other countries can also adjust their allocation policies accordingly to guide market expectations and strengthen the stability of carbon markets in the case of market expansion, merger, member withdrawal and other changes. For market traders, membership change is also one of key factors that causes market risk, which needs management through corresponding hedging strategies.
The rest of the paper is organized as follows.
Section 2 presents the literature review.
Section 3 demonstrates the methodology and data.
Section 4 analyzes the study results.
Section 5 illustrates a further study on the influencing factors of the market reaction.
Section 6 provides the conclusions and implications.
2. Literature Review
As the carbon market is based on law, its operation is highly dependent on institution and supervision. The literature concentrates on the impact of relevant policies and political events on the carbon market, most of which take the EU ETS as the research object. Based on the event study method, some studies analyzed the impact of EU ETS NAP and verified emissions announcements on carbon prices. Mansanet-Bataller and Pardo [
13] and Lepone et al. [
14] found that NAP announcements and verifications announcements in Phase 1 and Phase 2 of the EU ETS had an impact on carbon returns but no significant impact on their volatilities. Hitzemann et al. [
15] found absolute abnormal returns of carbon price on the day of the release of annual realized emissions announcements in the European carbon market, as well as an increase in trading volumes and intraday volatilities on the event day. Jia et al. [
16] used the method of the econometric model with bilaterally modified dummy variables and suggested that verified emission announcements have a significant impact on the expected returns of EU carbon price. Guo et al. [
17] argued that verified emissions announcements increase the compliance trading volumes of the EU ETS, especially in Phase 1. The study also showed that the over-allocation of carbon allowances disturbs the carbon market to a greater extent than verification events.
Some research focuses on the impact of high-frequency information on carbon markets. Conrad et al. [
18] modeled the EUA price-adjustment process with the release of high-frequency information and found that the release of NAP in Phase 2 and the news that the future economy is better than expected have an obvious impact on EUA prices. Chen et al. [
19] studied the impact of high-frequency information related to macro-economic and verified emission announcements on prices, volatility, trading volumes and illiquidity in the European carbon futures market, defending the belief that some announcements can affect carbon prices within five minutes.
Other literature argued that restrictions on the banking of emission allowances in the EU ETS cause a significant impact on carbon futures prices [
20,
21]. Regarding other policy events, Koch et al. [
22] examined how the evolution of emission cap stringency affects the carbon market and found that the EU ETS backloading policy of the auction would significantly reduce carbon prices. In addition, 2020 and 2030 policy packages would lead to positive price reactions. Deeney et al. [
23] used the event study method and GARCH model, suggesting that decisions made by the European Parliament can influence both the prices and volatilities of EUA, and the impact is related to “party political”, market sentiment and market attention. Fan et al. [
24] comprehensively selected 50 events concerning the release of six types of policies, including aviation emission and cap regulations, and assessed their impact on EUA returns, analyzing the impact mechanism of various events, respectively.
Recent literature found that correlations also exist between economic policy uncertainty or climate policy uncertainty and carbon markets. Ye et al. [
25] found that cross-correlation exists between the returns of EU carbon market futures and economic policy uncertainty, and the cross-correlation behavior structure is different across trading phases. By constructing the GARCH-MIDAS-EUEPU and GARCH-MIDAS-GEPU models, Dai et al. [
26] illustrated that both European and global economic policy uncertainty aggravate the long-term fluctuation of European carbon spot returns, with the latter having a stronger impact. Dou et al. [
27] found a significant negative impact of economic policy uncertainty shock on the volatility of carbon futures price returns in the long run, and the COVID-19 epidemic pandemic also affects the spillover between them. Wu et al. [
28] argued that climate policy uncertainty negatively affects the volatility of EUA futures.
Relations between trading policies and carbon price are also found in China carbon markets. Song et al. [
29] found that the release of carbon trading policy can improve Shanghai Emission Allowance (SHEA) price. Song et al. [
30] further developed a fuzzy stochastic model to predict the impact of demand-related policies on China’s carbon price and applied it to analyze the second developing phase of the Shanghai Environment and Energy. Through the jump test and Logit regression, Song et al. [
31] also suggested that the release of the new policy can lead to substantial fluctuations in China’s carbon price in the short term, but it can also reduce the abnormal fluctuations caused by the dissemination of price information. They also argued that demand-stimulus policy can promote the positive fluctuation of carbon price and will lead to the excessive correction of carbon price in the long run.
Abundant literature has proved that carbon prices are likely to be affected by a variety of policy information such as allowances allocation policy, banking restrictions, emission cap regulations and policy uncertainty. As an obvious policy-oriented market, there are few studies on the impact of relevant information involving the change of participating members on the carbon market. Referring to previous research methods, the paper focus on the influence of relevant information regarding the change of EU ETS membership of different economic scales on carbon prices and explores its impact mechanism. The contributions of this paper are two-fold. First, the paper employs a new cross-level perspective and tries to bridge the macro-political factors with the micro-carbon market operation, which expands the analytical scope of carbon market research. Second, the study is significant for allowances allocation and market management for both traders and regulators in the case of scope changes in the carbon markets of the EU, other countries and regions, and even a world unified carbon market in the future.
3. Methodology and Data
3.1. Research Hypothesis
According to the EU, the process of a country’s accession to the EU is generally a complex procedure requiring several stages, including the signing of relevant agreements, applying for membership, becoming a candidate or potential candidate country, undergoing the process of negotiations, and formally entering the EU. A country’s withdrawal from the EU also requires working through the stages of its exit plan proposal, the EU’s adoption of the exit agreement, and the formal exit. According to the regulations of the EU and EU ETS, all new member states that accede to the European Union become members of the EU ETS as they adopt and implement EU legislation [
2]. The process of a country’s withdrawal from the EU will also be accompanied by the process of withdrawal from the EU ETS. Therefore, the promotion of each stage of EU entry and exit will affect the market expectation of its accession or withdrawal from the EU ETS. It will further affect the market expectation of the allocation of emission allowances, and then disturb carbon prices.
To summarize, the paper tests the hypothesis that the carbon prices of the EU ETS could react to countries’ process of entering and exiting the EU, and there are three possible explanations of such impact:
The event of entering the EU has a positive impact on carbon prices or the event of leaving the EU has a negative impact on carbon prices, indicating that the market expects that the allocation of emission allowances is less than the country’s demand;
The event of entering the EU has a negative impact on carbon prices or the event of leaving the EU has a positive impact on carbon prices, indicating that the market expects that the allocation of emission allowances is greater than the country’s demand;
The event of entering or leaving EU does not have a significant impact on carbon prices, indicating that the market expects that the country’s allowances can balance supply and demand, or the country does not play an important role in the EU ETS, which cannot significantly affect the market expectation.
If the procedure of a country’s entry into or exit from the EU significantly influences carbon prices, it suggests that traders should pay attention to the market risk caused by the change of market participants. On the other hand, it can prompt regulators to improve the rationality of allowances allocation, so as to enhance the stable operation of the carbon market.
3.2. Methodology
Referring to the event research method used by Brown et al. [
32,
33], the paper assesses the impact of the key events of the EU entry and exit process on carbon prices. Specifically, referring to the method of Fan et al. [
24], the paper sets
t = 0 as the event day and [−5, +5] as the event window of 11 trading days, which can take into account the possibility of information leakage in advance to study the overall impact before and after the event. The paper also sets [0, +5] as the second event window of six trading days to study the impact after the event and enhance the robustness of the results. [−65, −6] is selected as the estimation window of 60 trading days to calculate the normal return of carbon prices.
In the event window, the abnormal returns of carbon prices are calculated as the difference between daily returns and expected returns, as shown in Equations (1) and (2):
where
ARt,
Rt and
E(Rt) denote the abnormal returns, rate of returns and expected returns of carbon prices on day
t, respectively, and
Pt is the EUA price on day
t.
Due to the particularity of EUA price series, which can only be used once for compliance [
24], traditional pricing models such as the market model and the multi-factor model cannot be used to calculate expected returns. Following the mean-adjusted model developed by Brown et al. [
33], the paper calculates the expected returns
E(Rt) of carbon prices based on the truncated mean model adopted by Mansanet-Bataller and Pardo [
13], Lepone et al. [
14] and Fan et al. [
24]. That is,
E(Rt) is calculated as the average of carbon price returns between the 5% and 95% percentiles in the estimation window. Although the mean-adjusted model is rather simple, it has similar power to the market model [
33]. Specifically,
E(Rt) can be obtained as:
where
Ri is the
ith return of the estimation period after they have been organized in ascending order. This method can exclude the impact of other events in the estimation window to make more accurate expected returns. The cumulative abnormal returns (CAR) in the event window are calculated as follows:
For the 11-day event window,
τ1 = 5,
τ2 = −5, −4, …, 4, 5; for the 6-day event window,
τ1 = 0,
τ2 = 0, 1, …, 4, 5. The variance of CAR can be obtained by Equation (5):
where
σ2 is the variance of abnormal returns in the event window. The
t statistic is used to determine whether the
CAR of each day in the event window is significant. The
t statistic is calculated as follows:
where
L denotes the length of the estimation period.
3.3. Data of EUA Prices
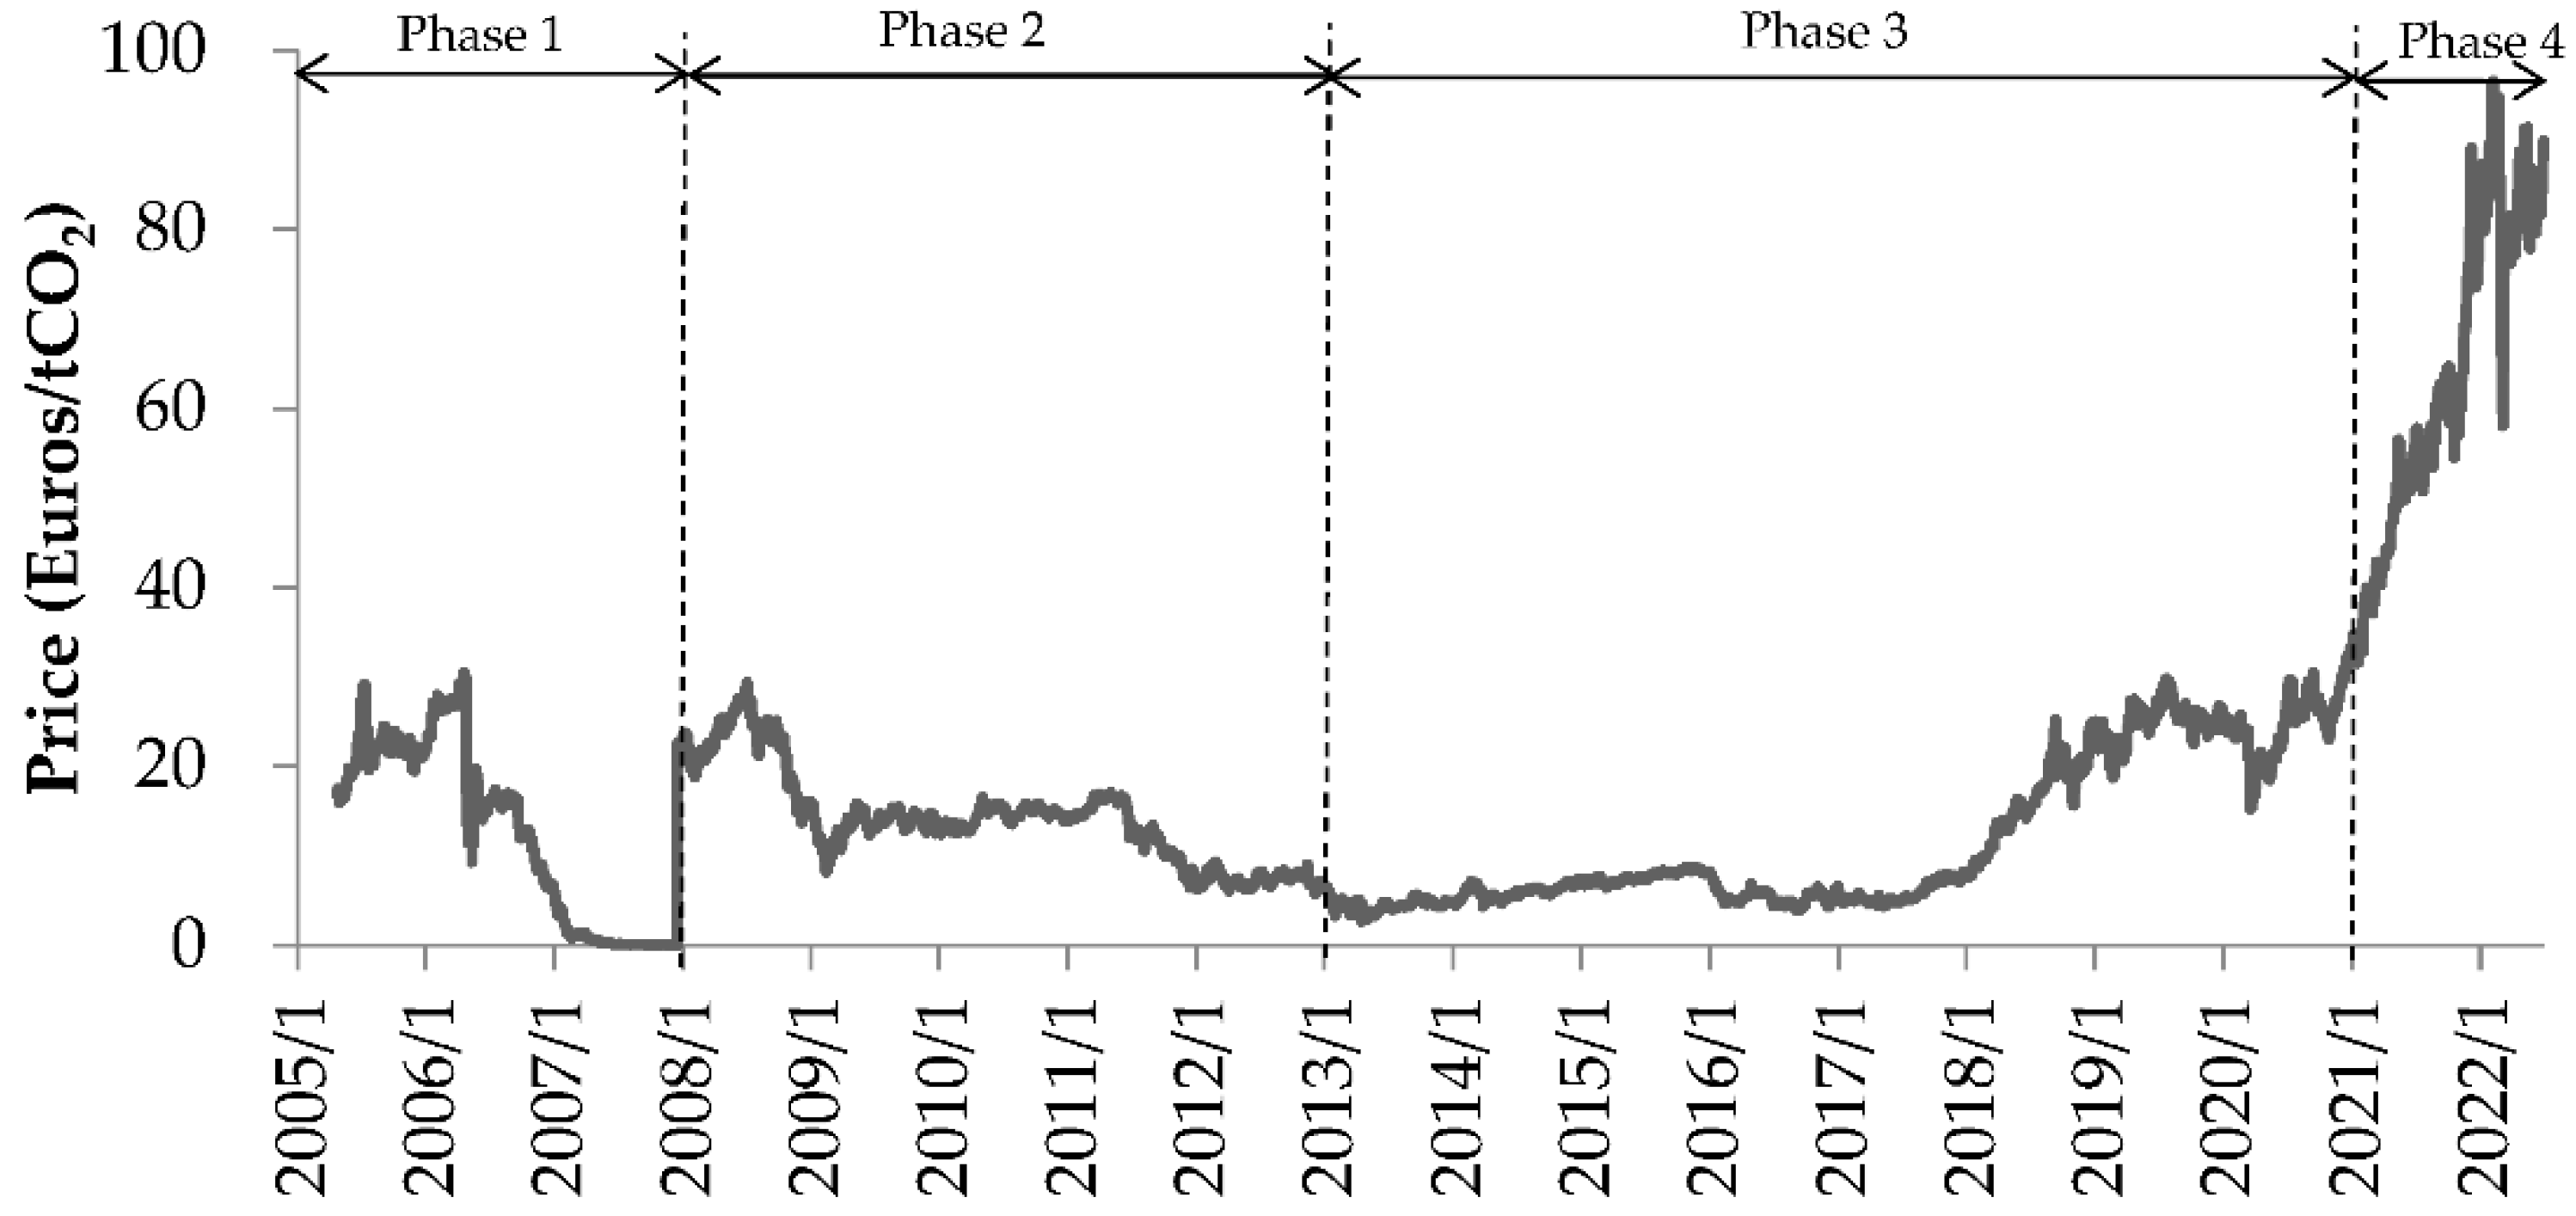
Compared to spot prices, futures prices can better reflect market expectations and represent the trend of market supply and demand more accurately. Therefore, carbon prices in the paper are selected as the settlement prices of EUA futures (continuous) of the European Climate Exchange (ECX) in the EU ETS, and the data source is Intercontinental Exchange (ICE) and Wind. Since the EUA futures trading data of ECX began on 22 April 2005, the time span of data is from 22 April 2005 to 30 June 2022.
Figure 1 illustrates the EUA futures prices used in the paper. It can be seen that the series declined sharply from April 2006 in Phase 1 but became relatively stable in Phases 2 and 3. After the approval of the reform of Phase 4 in February 2018, EUA prices began to rise continuously.
The EU ETS stipulates that the EUA in Phase 1 cannot be used in Phase 2, while the EUA in Phases 2 to 4 can be used universally. Therefore, the descriptive statistics of the EUA futures returns series of the two time intervals are illustrated separately in
Table 1.
3.4. Event Selection
The paper selects key events in the process of entering and leaving the EU from 22 April 2005 to 30 June 2022, in order to study their impact on carbon prices. Since the European Council and the Council of the European Union are the decision-making bodies of the EU, they can release the strongest information to the market. The selection of events is essentially based on the decisions of the two bodies.
The following five categories of EU entry events are selected:
The Stabilisation and Association Agreement (SAA) between the EU and a country was signed.
The EU confirmed granting a country EU candidate or potential candidate status.
The EU proposed a negotiation plan for a country to join the EU. (Since the proposal of a negotiation plan has provided the market with an expectation of opening negotiations, the proposal rather than the formal opening is selected here. If a country joined the EU ETS before the proposal of negotiation (e.g., Iceland), the event of negotiation is not selected).
The EU agreed to end its accession negotiations with a country.
A country formally joined the EU or EU ETS. (If a country joined the EU ETS before joining the EU (e.g., Croatia), the event of joining the EU ETS is selected.)
The exit events only involve two countries, namely the UK and Iceland. The following four types of events are selected:
The country requested that it no longer be regarded as a candidate country.
The results of the Brexit referendum were announced.
The European Council adopted the Withdrawal Agreement.
The country formally left the EU and EU ETS.
If the event day is not a trading day, the first trading day after the event day is taken as day 0. The events with an estimation window or event window that span Phases 1 and 2 are eliminated since the change of EUA universality. Finally, 22 events are selected in the event study, as shown in
Table 2.
4. Results
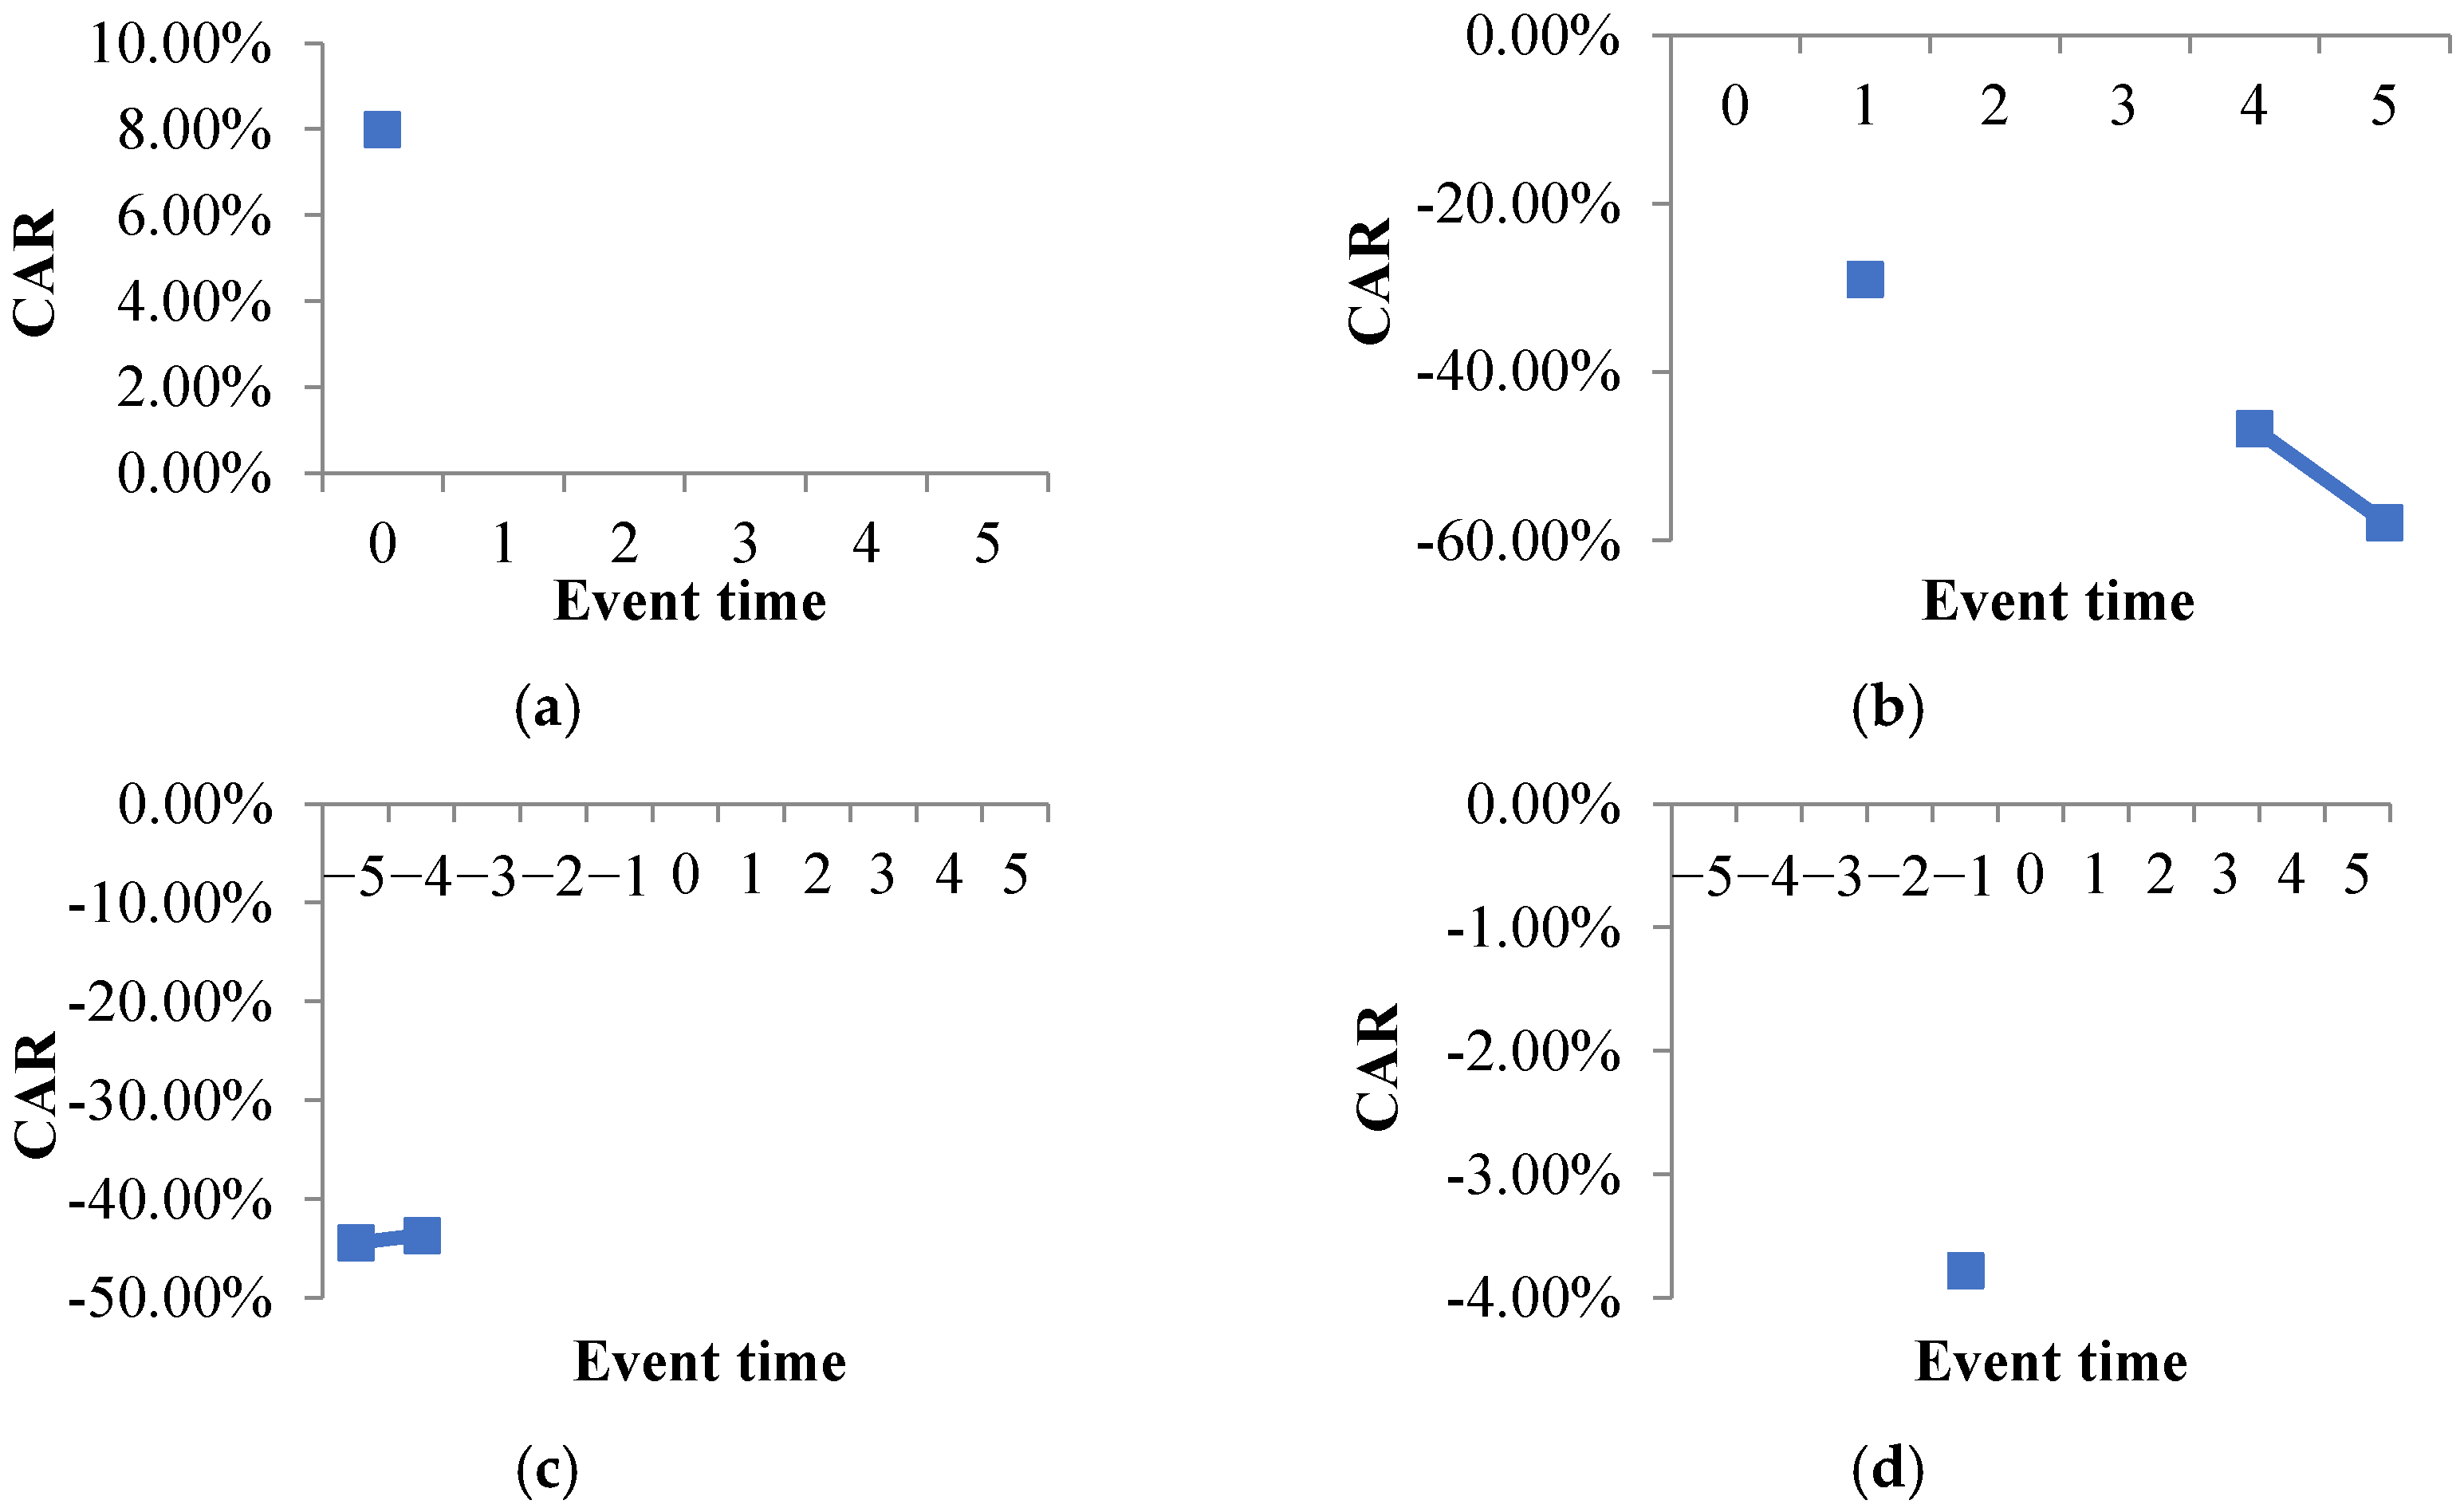
Figure 2 shows the events with significant CAR at the 5% level. The CAR of all 22 events are shown in
Table 3. It can be seen that eight events have significant impacts on the fluctuation of EUA futures prices. Events 3, 4, 6, 8, 9 and 17 have negative impacts and Events 2 and 22 show positive impacts. Events 3 and 22 have significant impacts of 3 days and Events 4 and 17 have significant impacts of 2 and 5 days, respectively. Other significant events indicate one significant day. The rest of the events have no significant impact on CAR. It is likely that the promotion of the EU entry or exit process can indeed lead to significant reactions of carbon price in some cases. Changes in membership or expected membership will lead unified carbon market traders to expect changes in the supply and demand of emission allowances, which will generate certain market risk. The risk caused by such policy events is necessary to gain the attention of carbon market traders and regulators.
Among the significant entry events, only Events 2 and 22 have positive impacts and Event 22 shows a longer impact. Event 2 involves the accession of Albania. Event 22 involves three countries, of which Ukraine has the largest average carbon emissions among the countries involved in the entry events. The five entry events with negative significant impacts involve countries including Romania, Bulgaria, Montenegro, Bosnia and Herzegovina and Croatia. Among these events, Event 3 has the longest and greatest degree of impact, and it also involves two relatively large carbon emitters, namely Romania and Bulgaria.
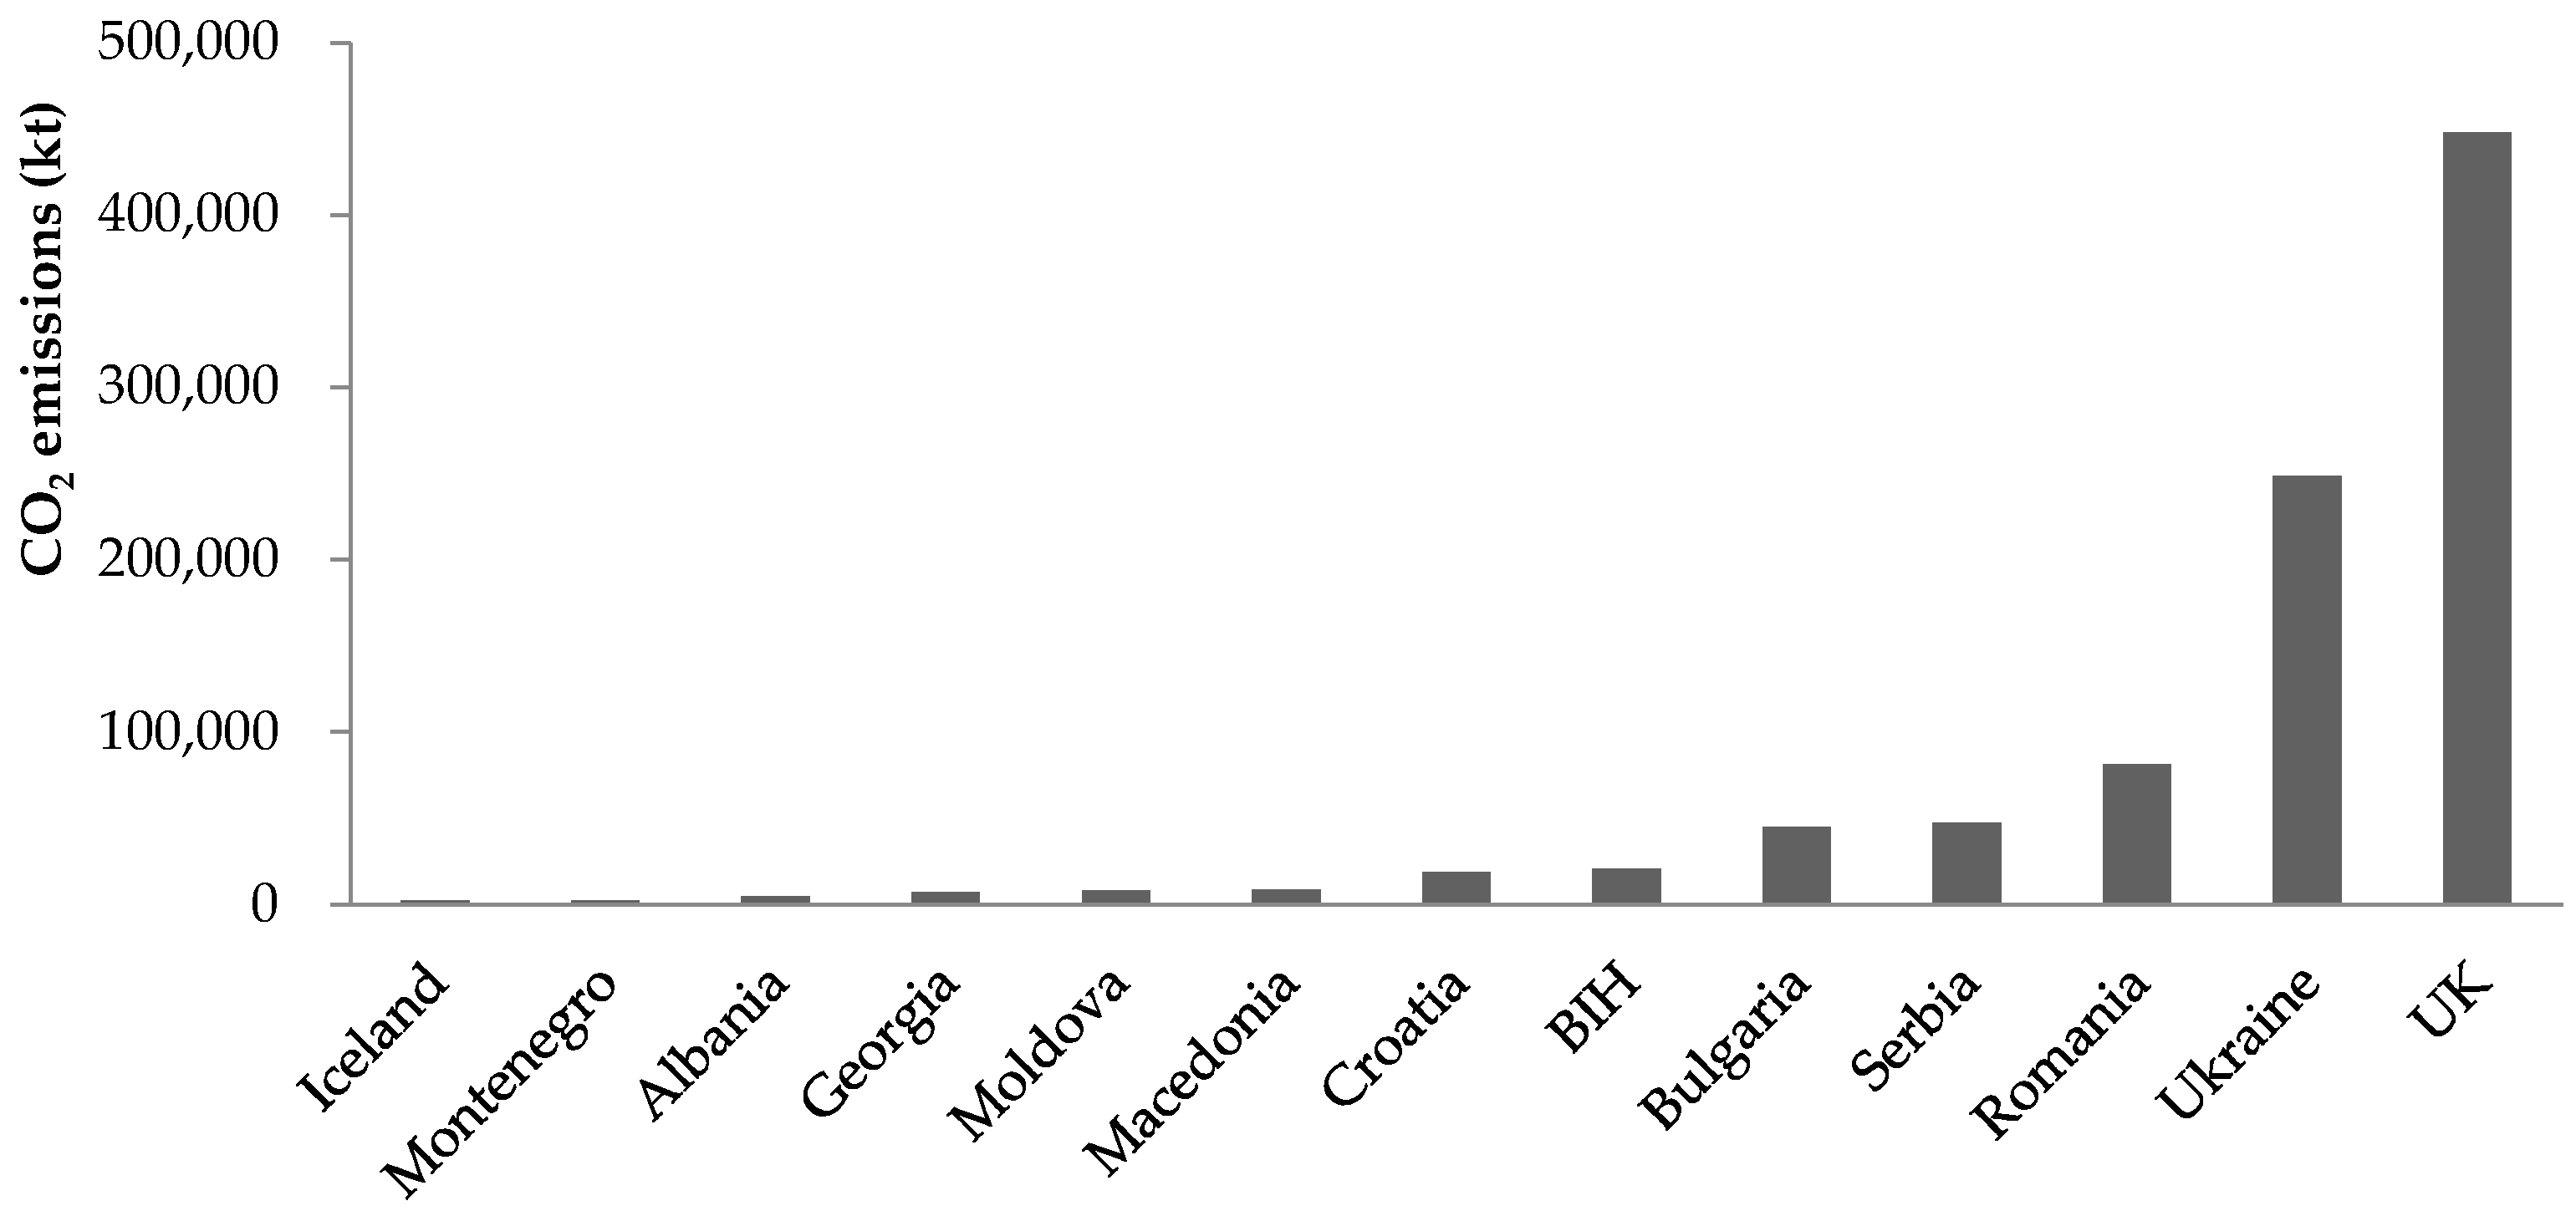
Figure 3 shows the average CO
2 emissions of the countries involved in the events selected. Combined with the figure, it can be seen that the impact of certain events on carbon prices may be related to the emissions of corresponding countries. It indicates that for most small carbon emitters, the promotion of their EU accession process tends to generate the market expectation that the allocation of the EU ETS to the country’s emission allowances will be greater than its demand. However, the situation for large emitters is likely to be just the opposite, which means that the market would expect a greater demand than supply of its emission allowances when it joins the EU ETS. The rest of the EU entry events do not have a significant impact on the carbon price, which may be due to the small carbon emissions of the countries involved. The small allowances allocation of related countries does not produce a big shock of market expectation.
Among the exit events, the announcement of the Brexit referendum results (Event 17) has a significant negative impact on carbon prices for five consecutive days in the post event window, indicating that Brexit negatively influences market expectations. The UK, which is the country with the highest degree of economic development involved in the events, also has much higher carbon emissions than other countries, as shown in
Figure 3. As one of the pioneer countries to mitigate climate change, the UK established the UK Emissions Trading System (UK ETS) in 2002, which provides much reference for the operation of the EU ETS. Moreover, the UK has a sound carbon market supervision system and has promulgated the world’s first law and other relevant regulations to deal with climate change [
35,
36], which improves the international prestige of the UK carbon market and its influence on global carbon markets. Higher carbon emissions and strict requirements for its own emission allowances grant the UK a special position compared with other countries, leading the market to believe that the UK’s demand for allowances is higher than the allowances allocation by the EU ETS. Therefore, the market expectation of Brexit causes significant negative abnormal returns of EUA prices. In addition, the UK was a major participant in the EU ETS, and London was also the EU’s emission allowances trading center. With Brexit, the operation of the EU ETS also entails many uncertainties, causing market participants to form a certain pessimistic expectation, which is likely to be one of reasons for the negative abnormal returns. Since the UK remained in the EU ETS in 2020 and the Brexit referendum has sent sufficient information to the market, Events 19, 20 and 21 do not show significant impacts on the market expectations of the EU ETS. The exit event re-grading Iceland (Event 16) does not lead to significant market reaction. This may be due to the small carbon allowance of the country which cannot affect the market expectation, and the market may also believe that Iceland will remain in the EU ETS.
5. Further Analysis
From previous results, it is likely that the market reaction of each event may be related to the emission of each country, and the influential mechanism seems to be different for large and small carbon emitters. Since there are only two large emitters involved in the events (i.e., UK and Ukraine), the relationship between the CAR of the entry events of small emitters and emissions of corresponding countries is worth further discussion.
In addition, the national allocation scheme of the EU ETS might also impact the supply and demand of emission allowances. The free allocation scheme for EU ETS member states in Phases 1 and 2 (2005–2012) is the National Allocation Plan (NAP), allowing member states to form their own allocation scheme “from the bottom up”, according to their national conditions, which can then be approved by the European Commission. During the implementation process of NAPs, problems were found to be complex, including a lack of transparency and insufficient uniformity of assessing methodology in various countries [
2]. Moreover, it has also led to the excessive allocation of national allowances, and member states maximize their allowances for their own interests. From 2005 to 2007, the annual allocation of 10 member states, including the UK and Germany, was 917.6 million metric tons of CO
2, while the annual verified emissions were only 868.68 [
37]. The allowances submitted by countries were still large when submitting the second NAP, which was approximately 5% more than the verified emissions in 2005 [
38]. To a certain extent, this may also cause the market to expect that the supply of allowances would exceed the demand when new member states enter, causing negative abnormal returns on carbon prices.
During Phase 3 in 2013, the EU ETS replaced NAP with National Implementation Measure (NIM), raising the decision-making position of allowances allocation to the EU level. When member states submit NIM, they use unified methods and standards, which are verified and approved by the European Commission and require necessary modifications. This has also promoted the transparency of implementing the allowances allocation scheme and the consistency of all participants [
2]. After a country’s entry into Europe, it is also worth discussing whether the change of the national allocation scheme will change the market expectation of the supply and demand of its emission allowances, and then change the impact of the event on carbon prices.
In the paper, the 11-day event window CAR and the 6-day event window CAR (
CAR11 and
CAR6, respectively) of each entry event regarding small carbon emitters (i.e., excluding Event 22) are taken as dependent variables. The natural logarithm of annual average carbon emissions (The emission of each country is on average from 2005 to 2019 and there are no data available on the emission of Kosovo. If an event involves multiple countries, the sum of average carbon emissions of the countries is taken) of corresponding countries (
Emission) and the national allocation scheme of corresponding years, which is taken as a dummy variable
NAP_NIM (0 for NAP, 1 for NIM), are used as independent variables for regression analysis. The results are shown in
Table 4.
A significant negative correlation can be seen between CAR6 and Emission at the 5% level, whether NAP_NIM is added or not. Among the 16 European entry events involving small emitters, 13 of CAR11 and 11 of CAR6 are negative, which indicates that certain EU entry events are more likely to cause a negative market reaction on carbon prices. Moreover, the absolute value of the negative abnormal returns increases along with the emissions of countries. The amount of carbon emissions is generally in proportion to the economic scale of a country. This suggests that for countries with a low level of economic scale, the promotion of a country’s accession process will lead the market to expect a greater allowances allocation to the country than its demand. In addition, the greater the country’s carbon emission, the stronger the expectation of this oversupply, thus, increasing the range of negative abnormal returns on carbon prices and aggravating market risk.
The change of national allocation scheme in the EU ETS has a positive impact on CAR, but the impact is not significant, indicating that this change does not play a significant role in reversing the market expectation of the oversupply of carbon allowances.
6. Conclusions and Implications
Using the event study methodology, the paper examines the effects of 22 key events in countries’ process of entering and exiting the EU on the returns of EUA future prices in the EU ETS. The events include 17 entry events concerning the signing of SAA, becoming a candidate or potential candidate country, the process of a negotiation and formally entering the EU, and five exit events including the process of Brexit and the suspension of Iceland. The results show that eight events have a significant impact on EUA returns. Among them, two entry events involving Albania and Ukraine, respectively, have a positive impact, and five entry events have a negative impact. Regarding the exit events, the announcement of the Brexit referendum results causes a significant negative impact. It indicates that for most small carbon emitters, the promotion of their EU accession process tends to generate the market expectation that the allocation of the EU ETS to the country’s emission allowances will be greater than its demand. However, the situation for large emitters is the opposite. Most events regarding small carbon emitters entering the EU lead to a negative market reaction, and a significant negative correlation between the countries’ annual average carbon emissions and the cumulative abnormal returns of EUA prices is found. It is likely that the greater the country’s carbon emission, the stronger the expectation of this oversupply, while the change of national allocation plans does not affect the market reaction notably.
As the region with the highest degree of integration in the world, the EU ETS is by far the most successful transnational regional unified emission trading mechanism. The impact of the entry of Eastern European countries and Brexit on the EU ETS can be used as a reference for other emission trading markets. With the increasing attention to climate change, the establishment of a unified carbon market in China and even the world will become the future development trend. In the process of building a unified carbon market, market regulators and traders should be concerned with the market risk caused by the change of participants. The paper shows that when the participation process of members with a lower economic development level is promoted, the market will tend to produce the expectation that the supply of carbon allowances will exceed the demand, which has a negative impact on the carbon price, and the impact will increase with the amount of carbon emissions of the participants. However, the participation of members with a higher degree of economic development leads to a tendency of the market to produce the expectation that the supply of carbon allowances is less than the demand, which has a positive impact on the carbon price. In short, the process of entering or exiting the existing carbon trading market as a buyer or a seller will have different impacts on the operation of the market. Therefore, carbon market regulators should pay attention to the policy arrangement of carbon allowance allocation. For the EU ETS, the allowances allocation for small economies should be appropriately reduced and the allocation for large economies should be increased. The change of the EU ETS national allocation scheme from NAP to NIM has no significant impact on reversing the market expectations of allowances allocation, indicating that the EU ETS should further improve the rationality of allowances allocation, especially appropriately reducing the allocation of small economies and expanding the market transparency.
In the future, as the international community makes more efforts to mitigate climate change, governments will likely rely more on market-based means to reduce greenhouse gas emissions. The continuous expansion of the scope of emission trading markets will be a long-term trend in climate governance. During the operation of existing carbon markets, new regions may gradually join in. Taking China as an example, in order to achieve the goals of carbon peak and carbon neutralization, the national carbon market was launched in July 2021 and is still under construction. The national carbon market only covers the power generation industry at present, and high energy consumption industries such as steel, nonferrous metals and petrochemicals may also become involved in the future. The regional carbon markets that are in operation may also be merged and integrated. In this process, regulators and traders should pay attention to the impact of the change of membership on carbon price fluctuation. Referring to the experience of the EU, in the process of expanding the coverage of membership, regulators should appropriately control the allocation of emission allowances for industries with low emissions and regions with a low degree of economic development and increase the allocation of allowances for industries with high carbon emissions and regions with a high degree of economic development. Corresponding policies should also be gradually introduced to stabilize market expectations. Regulators in China and other countries can also adjust their allocation policies accordingly to guide market expectations and strengthen the stability of carbon markets in the case of market expansion, merger, member withdrawal and other changes. In addition, market traders should also regard the process of membership change as one of the factors that causes market risk and take corresponding hedging strategies in trading.
The paper tries to employ a new cross-level perspective and illustrate the relationship between political events and carbon prices. However, since the entry and exit events occurred at different points, the methodology applied in the paper may lead to an upward bias in the results. Other methods, such as a Difference-in-Differences setting with staggered adoption, can be considered for further studies to achieve more robust results. Moreover, further research can contribute to demonstrate a clearer causal mechanism between political factors and the operation of carbon markets.


