Article

Operating Successfully on a New Technological Path: The Effect of External Search

1
Business Department, Bern University of Applied Sciences, 3005 Bern, Switzerland
2
ETH Zurich, Swiss Economic Institute (KOF), 8092 Zurich, Switzerland
*
Author to whom correspondence should be addressed.
Sustainability 2022, 14(2), 957; https://doi.org/10.3390/su14020957
Submission received: 22 December 2021 / Revised: 11 January 2022 / Accepted: 12 January 2022 / Published: 14 January 2022
(This article belongs to the Topic Open Innovation and Entrepreneurship)

Abstract

:
Switching to a new technological path is often a serious economic challenge for companies. Incumbents, in particular, are often led by their organizational routines, traditional technological orientation, and experience, and run the risk of losing contact with new technologies, which can decrease their competitiveness. We analyze whether opening up the innovation process to external knowledge partners can help to overcome such path dependence and enable firms to operate successfully on a new technological path. We develop a theoretical concept that shows the potential of external knowledge sources for operating successfully on a new technological path and test it empirically using the example of green technologies. Green technologies are not only relevant for addressing the current environmental problems, but they are also an example of a new technological path that is proving difficult for companies to switch to. Overall, we find strong direct effects of external (green) knowledge on green innovation success. The results even indicate that the direct effect of external knowledge tends to be larger for green than for non-green innovation.

1. Introduction

Firms are bounded in their perception of commercial opportunities [1,2]. They are guided by their organizational routines and their traditional technological orientation and experiences, which limits their ability to adapt to changing market circumstances [3,4]. In the literature, this phenomenon is referred to as technological path dependence [5].
Such path dependence comes with the risk of losing competitiveness, questioning the technological fundamentals of incumbents, and may lead to fierce economic turbulences. For instance, the typewriting industry did not manage to adapt to the new possibilities provided by microelectronics [6]. The pharmaceutical industry missed the early days of biotechnology [7]: it was the start-up company Genentech, rather than the traditional pharmaceutical companies, that first invented biotech drugs [8], and the European car industry has great difficulties adapting to the possibilities provided by alternative propulsion technologies (electric propulsion, hydrogen fuel cell technologies) [9]. While technological path dependence and the difficulty of breaking out of it are hardly disputed facts in the empirical literature [5,10], it is also widely acknowledged that companies have not found efficient ways to overcome it [11,12].
We analyze in this paper whether access to external knowledge sources, that is, an external search, is helpful to overcome a bounded view of the commercial and technological possibilities provided by new technologies, where our focus is on the organizational, rather than the industrial, level of path dependence. We argue that the absorptive capacity of a company is important to detect the potential of external knowledge for the development of new technologies [13]. We also acknowledge that one single company cannot comprise all necessary knowledge [14] and that ties to external knowledge sources are indispensable to develop new technologies from the perspective of a company [15,16]. External knowledge sources carry the potential to enhance and redirect the knowledge base of a company e.g., [17,18,19,20,21] and increase the potential not only to spot the commercial value of new knowledge, but also to successfully transfer such knowledge into the company, and to pursue knowledge accumulation in a new technological path.
Existing external search literature mainly focuses on the effects of external knowledge sources to increase the effectiveness of knowledge processing given the technological environment of a company, e.g., [22,23,24,25,26], but hardly analyses the type of knowledge that is transferred and how it is related to the absorptive capacity of a company. The latter is crucial for the research question we pursue in this paper, i.e., whether access to external knowledge sources helps to commercially and successfully diversify into new technological paths or if it solely helps in increasing the effectiveness within the existing technological orientation of a company.
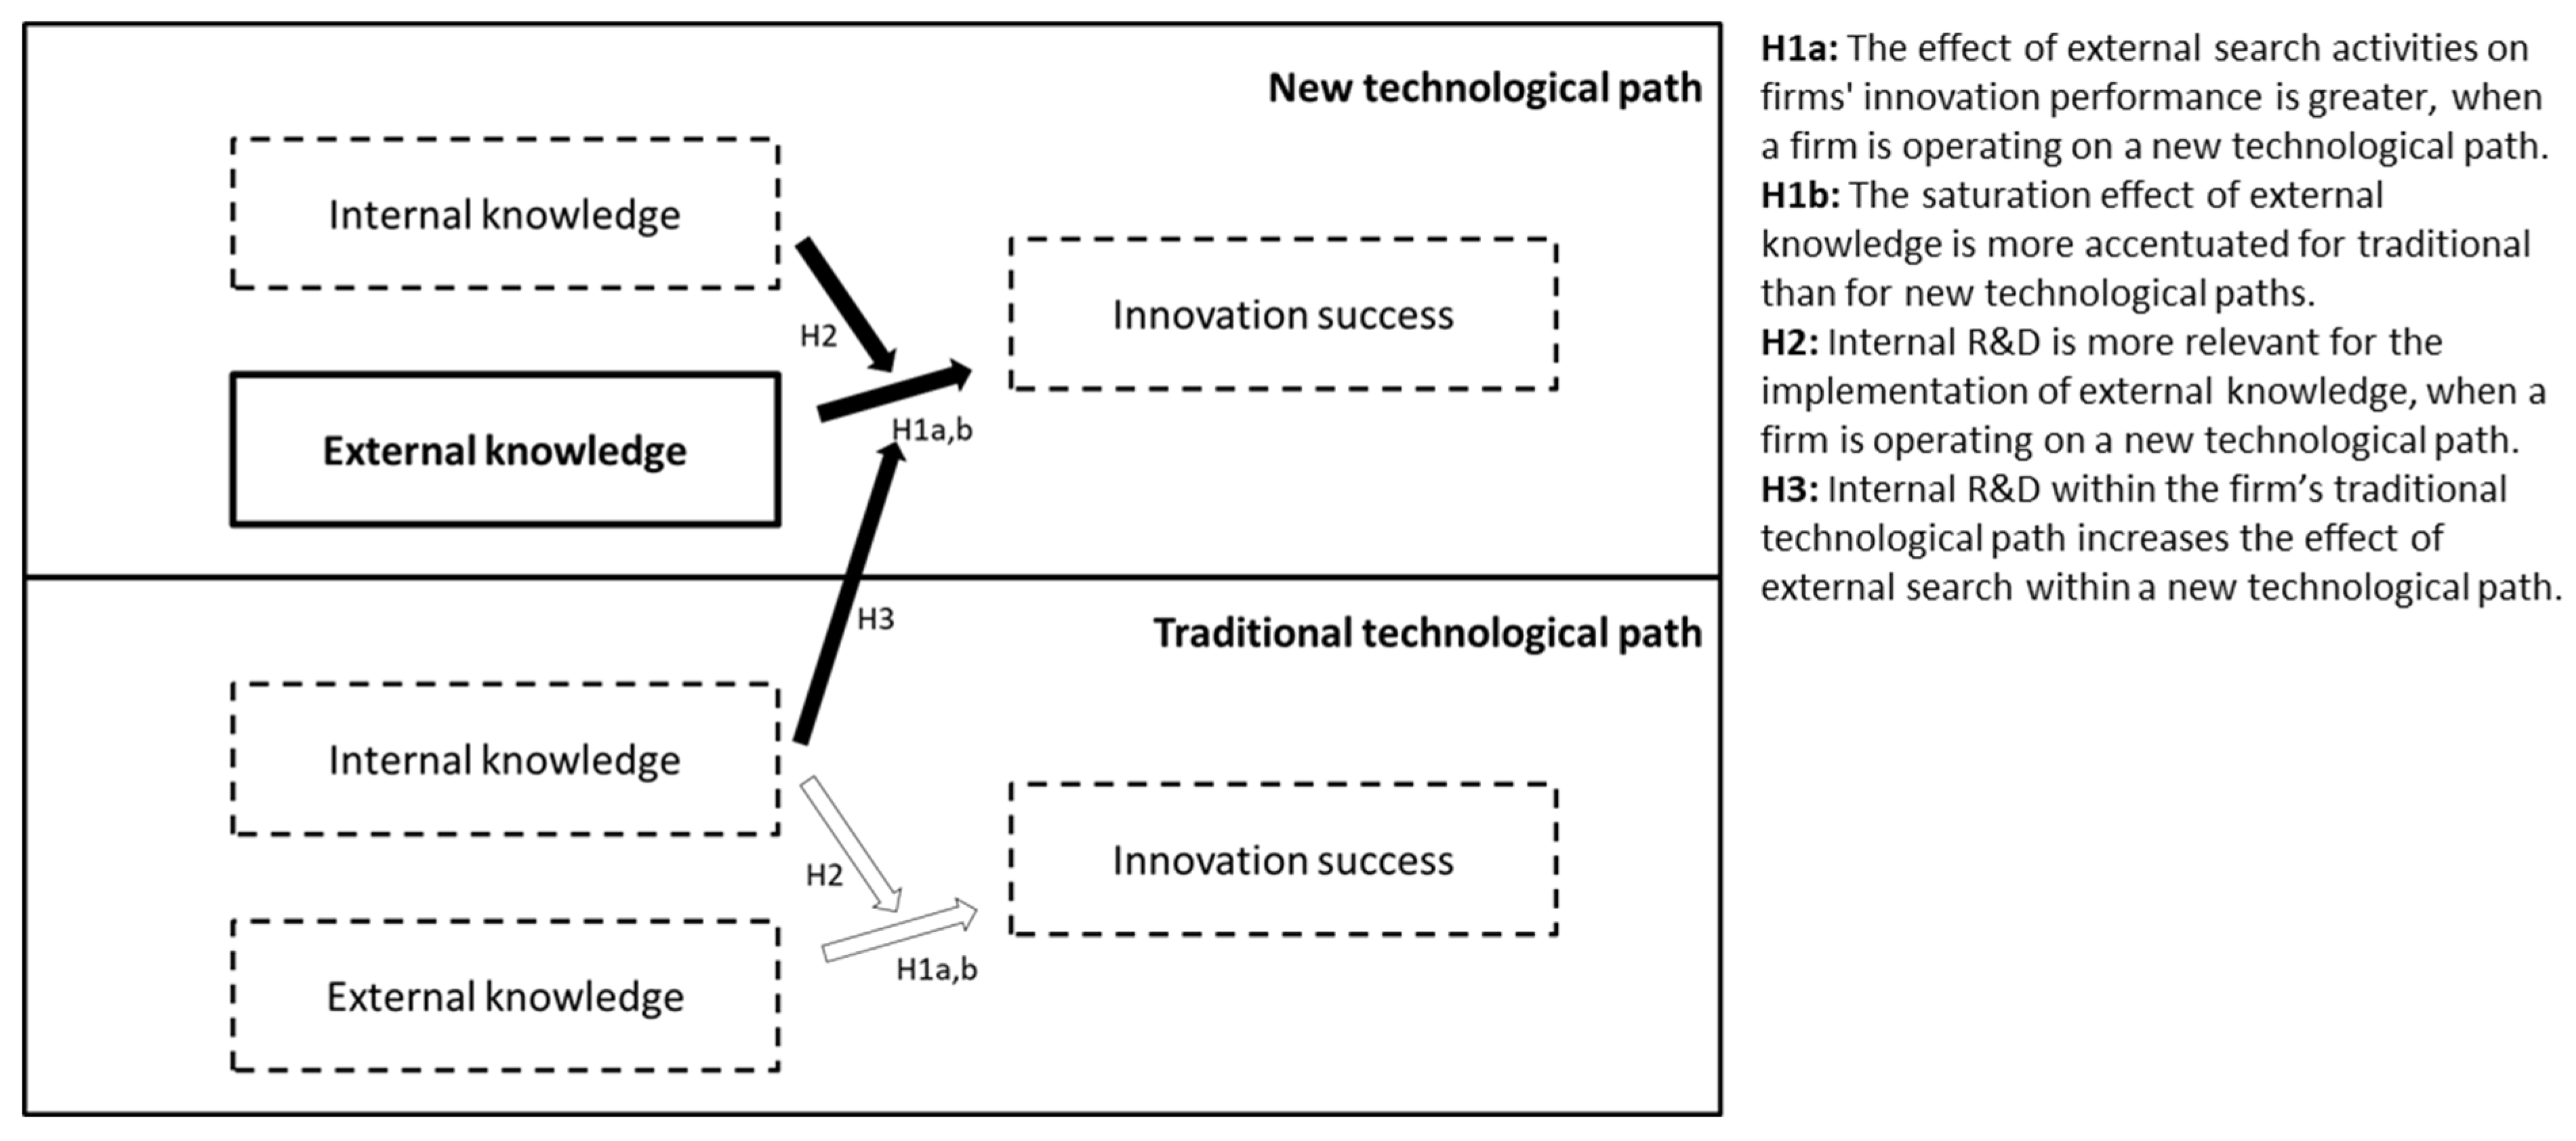
We add to the existing literature in several ways. First, by theorizing on if and how external search affects a firm’s ability to operate successfully on a new technological path, that is, we connect the literature on external knowledge acquisition with the “path dependence” literature. Secondly, we do not only distinguish between different institutional types of external knowledge sources, but also the type of knowledge accessed, i.e., knowledge about environmentally friendly technologies and “other knowledge”. Thirdly, we compare the effectiveness of external knowledge sourcing for improving the innovation performance along traditional technologies with their effectiveness for developing new technologies.
To test our predictions empirically, we used green technologies as an example of a new technological path and non-green innovation representing the traditional technological path. Specifically, we examined whether opening up innovation processes to green external knowledge sources increases the likelihood that a company will successfully pursue new business opportunities outside of its traditional technological path in the field of green technologies. The existing literature dealing with the relationship between green innovation and external search restricts their analysis to green innovation activities, and it remains largely unclear how and why the effect of external search differs between green and traditional technological paths [27,28,29] and if they can help to overcome technological path dependence. Besides the fact that green technologies are highly relevant against the background of seemingly insurmountable environmental and climate problems [30], in this paper, we argue that green innovation shows the typical characteristics of a new technological path, i.e., it is characterized by high technical and organizational barriers. This becomes evident, for example, in the automotive industry. Carmakers have to develop dedicated platforms and convert entire factories to electric vehicle production. In the next five years alone, VW plans to spend around 30 billion euros on the development of electric vehicles, plus 50 billion euros on equipping them with batteries [31]. Our expectation is that external search will positively support such transformation processes.
Testing our predictions requires the use of two different sets of data. One for new technological paths, that is green innovation, and one for the traditional technological path, that is non-green innovation. The data for non-green innovation basically allow us to reproduce the existing external search literature that does not consider the type of knowledge that is transferred. The second dataset allows us to investigate how external green search activities affects the commercial success of green product innovation. By comparing the results of the two models, we can then conclude whether access to external knowledge sources differently affects new and traditional technological paths. If opening up the innovation process reduces path dependence, we basically expect the effect on innovation success to be larger for green than for non-green innovation.

2. Research Background

2.1. Access to External Knowledge Sources and Innovation Activities

Based on a seminal study by [25], an important field of strategic management examined how the openness of companies’ external search strategies, i.e., the use of external knowledge sources, influences the innovation performance of companies (see [32] for a review of the literature). From the existing research, three predictions can be derived which are relevant for our paper.
First, it can be argued that access to external knowledge sources (e.g., knowledge from universities, suppliers, customers, competitors) has a positive impact on companies’ innovation performance. The stimulating effect of external knowledge on a firm’s ability to innovate is widely recognized in the literature [13,33,34,35]. Fierce competition and rapid technological change force companies not only to use internal knowledge, but also to use the experience and knowledge of other market participants in their innovation process [36]. Accordingly, building and sustaining links with other market participants, such as customers or suppliers, is an integral part of product innovation [37]. By sharing information and knowledge, companies benefit from the dynamic effects of interactive processes, which can positively affect their innovative performance. Companies that invest more in the search for external knowledge should therefore be better able to adapt and innovate in response to technological changes [25].
Second, the (positive) effect of external search activities on innovation performance is predicted to be non-monotonous (inverted U-shape-related) [25]; similarly, [38,39] argued, based on the innovation search theory [40] and the attention-based theory [41,42], that it becomes more difficult to distinguish the good from the bad ideas if there is too much (contradictory) external knowledge to process. In addition, time and financial restrictions mean that not all (good) ideas can be considered. Hence, firms can ‘over-search’, which means that extending a firm’s external search activities not always contributes to higher innovation performance, and, when above a certain level, additional external search activities may even negatively affect innovation performance. Reference [28] also argued that over-searching the commercial environment might increase the level of conflicting information from internal and external sources, which results in less efficient innovation processes and decreasing innovation performance. The effect of external search activities on a firm’s innovation performance is thus predicted to be inverted U-shaped.
Third, [13,25,43] have argued that the effect of external search is moderated by internal R&D. Internal R&D is predicted to improve a firm’s ability to imitate new processes or product innovations, and to use external knowledge sources to enhance its internally applied R&D (see, for example, [18,44,45] for a similar argumentation). Accordingly, it is predicted that returns on external search activities will be higher the more in-house R&D knowledge a company has.
In summary, the existing literature therefore predicts that external search activities positively affect a company’s (non-green) innovation performance. It also states that there is a saturation point of external search activities, therefore the effect of the external search on innovation performance should be inverted U-shape-related regardless of the type of knowledge (green or non-green). In-house R&D knowledge increases the effect of external knowledge on companies’ innovation performance.

2.2. Technological Path Dependence

Path dependence has become an essential theoretical construct for many organization scholars [46,47]. References [48,49] argued, based on a series of historical studies, that technical change is path-dependent [50]. Technological path dependence is based on the idea that R&D investments are at least partly “sunk” costs, which lead to irreversibility along the path of technology development, i.e., technological lock-in [12,49,51]. Overcoming path dependence requires a successful switch from old to new technology [52,53]. The concept of path dependence is related to other concepts that differentiate between different technological paths such as technological trajectories [54], dominant designs [55], or architectural innovation [56].
Such ‘path dependence’ is a well-known phenomenon in the history of technical change. The QWERTY keyboard [49], the US Ice-Industry, or the typewriter industry [6] are famous examples of industries that did not timely change their technological basis. The German chemical industry after World War II is a further example that painfully shows the adverse consequences of a technological lock-in [57]. In many cases, the technological lock-in led to drastic changes in the affected industries. The incumbents lost their competitiveness, new companies pushed into the markets with new, disruptive technologies, and profits increasingly shifted to the entrants [6]. Economies usually paid a high price when important industries missed the momentum for the technological change.
Often, the analysis of path dependence focuses on specific industries. These studies examine the development of specific technologies over time, which usually requires longitudinal data from the same group of companies within specific industries. However, there are also studies that take the perspective of a company and examine what prevents them from moving from one technological path to another, e.g., [12,46,58,59]. The focus in this study is on this company level.
There are basically two different mechanisms that lead to technological path dependence. In what follows, we have called them (a) “search cost” effect and (b) “sunk cost” effect. Starting with the search cost effect, increasing returns to knowledge building in the traditional path [60,61] leads to higher search costs for building knowledge in a new technological context [62]. Search costs are higher, because it is more difficult to recognize and exploit new business opportunities outside the firms’ current environment. Bounded rationality and satisfying behavior [1,2] play an import role, since they increase the search costs and limit the firms’ ability to detect new and important technological developments in the marketplace [5].
Even if new technological opportunities are discovered, sunk costs make it costly to develop technological activities along the new technological path. Sunk costs refer to technological investments along a certain path that are irreversible and not useful for the development of alternative technologies [12]. This means that the profitable use of existing knowledge within a new technological path is very limited, which increases the opportunity costs of investing in the development of alternative technologies and ties a company to its traditional technological path.

2.3. Building the Bridge: External Search and Technological Path Dependence

To formulate specific hypotheses, we need to connect the two strands of literature and make predictions about how external search affects path dependence. We argue that access to external knowledge sources can reduce the costs of changing paths or increase the commercial success of innovative products along the new technological path. While this possible connection between opening up the innovation processes to external knowledge sources (e.g., universities, customers, suppliers, competitors) and path dependence has not yet been explicitly investigated, it is basically laid out in open innovation literature.
The use of external knowledge sources for the innovation activities of a company is expected to reduce the effect of the two mechanisms that lead to path dependence, i.e., search costs and sunk costs—see [63,64] for a related argumentation regarding a potential complementarity between IT investments and open innovation. First, access to external knowledge sources is expected to reduce the costs of technological path dependence by improving a firm’s ability to recognize and exploit new business opportunities [65,66,67], thus reducing the costs of building new knowledge, that is, search costs. This increases the permeability of a firm, that is, ideas and potential solutions can also originate outside the firm’s own labs and be brought inside for commercialization [68]. Accordingly, companies using external sources can expand their knowledge base and access and integrate a greater variety of ideas to stimulate their internal innovation activities [69]. We thus expect that, by reducing the costs of building new knowledge inside the company, external search activities can increase the innovation performance of a company in a new technological path (see Hypotheses H1a,b and H2 in Figure 1).
Second, access to external knowledge sources is intended to reduce the sunk costs of traditional knowledge by increasing its profitable use within a new technological path, which in turn lowers the opportunity costs from investing in an alternative technological path. Following the literature on learning-by-hiring, the recruitment of researchers is an important source of knowledge influencing the innovation process of the hiring company, e.g., [70,71,72,73]. Reference [74] found that hiring of experts from other firms reduces a firm’s path dependence and thus eases switching to new technological paths, indicating complementarities between existing internal knowledge and new knowledge from outside the firm. We also expect that informal ties to external knowledge sources (e.g., by reading patents, consulting suppliers and customers)—and not only a formal access to such sources via, e.g., new employees—is complementing existing internal knowledge derived within the firms’ traditional technological paths, and thus reduces a firm’s costs of switching the technological path (see Hypothesis H3 in Figure 1).

2.4. Development of Empirically Testable Hypotheses

2.4.1. Empirically Identifying Organizational Path Dependence: The Case of Green Technologies

A major challenge in the analysis of technological path dependence is the empirical identification of the effects [12]. Path dependence, when considered at the organizational level, as is done here, is primarily a theoretical concept and is difficult to identify empirically. It is clear, however, that technological path dependence refers to a specific type of innovation activity that confronts companies with particularly large technological challenges. The problems are not just restricted to technological aspects. In order to realize the technological transition, companies also need to adapt existing organizational structures. Technological path dependence, as we understand it in this paper, thus refers to innovation activity that is characterized by high technical and organizational barriers (see [14] for a related definition). Thus, path dependence goes well beyond other concepts in the innovation literature, such as radical innovation, which are not directly linked with organizational change.
In this paper, we use green technologies as an example of a new technological path. This decision is supported by literature. Reference [75] found that there is path dependence in the direction of technical change: firms that have significantly innovated in “dirty” technologies in the past will find it more profitable to innovate in “dirty” technologies instead of green technologies in the future. In a model that investigates the effect of existing knowledge on the gap between the leader in green technology inventions and its followers, reference [76] found that hardly any knowledge spills over from non-green technologies to green technologies, indicating the difficulties of switching between non-green and green innovation activities.
An important driver for the path-dependence of green technologies is their high complexity and related to this the “high development costs”, which challenges a firm’s capability profile in terms of knowledge creation and technology development [77,78,79]. Reference [80] found that green jobs generally require more intensive cognitive and interpersonal skills at a high level than non-green jobs, and also demand more formal education, work experience, and on-the-job training. Moreover, the complexity does not only refer to the innovation activity itself. Green innovation typically requires a restructuring of the organization and involves actions along the entire value chain [81]. Hence, business processes and working routines have to be adapted or even newly developed [82,83].
It is therefore obvious that not only technical barriers are central to green innovation. Organizational barriers also act as a key factor in green innovation. Based on quantitative and qualitative data for Switzerland, reference [84] found that a lack of implementation knowledge is seen in many industries as a main barrier for switching to green innovation. Green innovation often involves players from different firms and industries, which makes the organizational implementation of such innovations rather difficult. Moreover, companies are simply stuck in their existing mindsets, which have often been built up over years and where ecological aspects of products usually play hardly any role. A fundamental rethinking in companies is therefore usually a prerequisite not only to successfully address the technical/organizational challenges, but also to adapt marketing strategies in order to address new, more environmentally minded customer segments.
A good example to illustrate the complexity of green innovation are electric vehicles. “Research and development […] costs a fortune. Daimler says that it will spend €10bn by 2025 on just ten battery-powered models. Restructuring is also expensive. For a century, carmakers have built factories, employed workers, and developed a supply chain around the internal combustion engine. In one scenario Morgan Stanley reckons that VW’s entire car business could make a loss between 2025 and 2028 as it transforms itself” [85].
Existing literature thus clearly indicates that companies are confronted with big technical and organizational barriers to green innovation. Green innovation is indeed a good example for a new technological path, and we developed our empirical testing on this differentiation between green and non-green technologies.

2.4.2. Derivation of Hypotheses: External Search and Green Innovation Success

As we argued before in Section 2.2, external search is expected to reduce the costs of building knowledge (i.e., search costs) along a new technological path, that is, green innovation. To illustrate our idea, we assume that a manufacturer of vehicles with combustion engines (traditional path) wants to be successful in the future with electric engines (new path). The car manufacturer has a large knowledge stock in combustion technologies, but a small knowledge stock regarding the production of electric vehicles. In this case, we expect that external knowledge regarding the production of electric vehicles—where the company lacks internal knowledge—has a greater impact on the innovation performance of the car manufacturer than external knowledge in combustion technologies—where the company already has plenty of internal knowledge.
Hence, access to green-specific external knowledge is likely to be all the more important to be able to operate successfully along the green technological path. Compared to innovation activities within a traditional technological path, most companies do not have access to a large stock of green-specific internal knowledge: [77] showed that the share of green inventions on total inventions is around 10% and [76] found that spillovers from green invention activities are insufficient to become competitive in developing green technologies. Hence, drawing knowledge from external sources has a different purpose in the field of green technologies. Such activities play a much more important role for knowledge creation in companies than they do for the enhancement of the traditional knowledge base.
Since dominant designs (see [6]) in green technologies hardly exist so far, firms are trying to timely detect promising technological activities and are therefore trying to draw knowledge from as many different sources as possible and as deep as possible. Compared to innovation within the traditional technological path, i.e., non-green innovation activity, the dependence on external knowledge is therefore likely to be greater for innovation within new technological paths, i.e., green innovation (see Figure 1).
Hypothesis 1a (H1a).
The effect of external search activities on firms’ innovation performance is greater when a firm is operating on a new technological path (green innovation).
The external search literature predicts that there is a saturation point of external search activities, which is why the effect of external search should be inverted U-shape related to innovation performance. One important reason for the decreasing performance effect of intensive external search is the increasing complexity of information and the increasing likelihood of conflicting information from external sources [28]. For a new technological path such as green innovation, it is also to be expected that intensive external search activities will make it more difficult to separate good and bad ideas. However, given the relatively low internal green knowledge base, it is not only more likely to find good ideas outside the company, it is also more likely that the returns from good ideas are higher. Accordingly, it should be more beneficial to invest in the search for such good ideas when operating on a new technological path.
We therefore expect that, not only will the impact of external knowledge be larger for new technological paths (Hypothesis H1a), but that the diminishing impact of external search activities will also be less pronounced for new technological paths. The marginal returns of increasing a firm’s external search activities should thus decrease less quickly for green innovation than for non-green innovation. Similar to [28], it can be argued that the the greater complexity and distance of the external knowledge required for green innovation should impose greater stress on the attention–resources of the firm, which may drive the diminishing effect of external search activities for green innovation compared to non-green innovation. In line with Hypothesis H1b, however, we argue that the saturation point for green innovation is higher than for non-green innovation.
Hypothesis 1b (H1b).
The effect of external knowledge is more linear for new (green innovation) than for traditional technological paths (non-green innovation).
As with innovation in general, internal knowledge increases the absorptive capacity of a company see [13] and should act as a moderator of the effect of external knowledge within a new technological path. Accordingly, in-house R&D knowledge within the new technological path should increase the effect of external knowledge within the new technological path.
As companies build their in-house green R&D knowledge, the expected returns from additional knowledge increase (see [75]), encouraging them to invest further in green technologies. Consequently, green internal knowledge capital should increase a company’s willingness to seek external green knowledge. Because of the greater complexity of green innovation compared to non-green innovation, the availability of firm-internal knowledge should be even more important to effectively use external green knowledge.
Hypothesis 2 (H2).
Internal R&D is more relevant for the implementation of external knowledge when a firm is operating on a new technological path (green innovation).
In the theoretical notions presented in Section 2.2, we also predicted that access to external knowledge sources reduces the firm’s sunk costs of traditional knowledge by increasing its profitable use within a new technological path. As illustrated in the example in the beginning of this section, it can be expected that external knowledge regarding the production of electric vehicles makes internal knowledge in combustion technologies more valuable for the manufacturing of electric cars because a large internal knowledge stock improves the search quality and makes it more likely that the choice of partners is better and the complementarity of knowledge is more likely; simply speaking, a better fit between partners can be expected.
Hence, by using its internal knowledge from combustion technologies, the car manufacturer can improve access to external knowledge sources and should thus be more successful in operating on the electric path. Regarding green technologies as our example of a new technological path, this would mean that the effect of external green knowledge is not only stimulated by internal green knowledge (Hypothesis H2), but also internal non-green knowledge. In our empirical setting, we should thus observe that internal non-green knowledge increases the effect of external green knowledge.
Hypothesis 3 (H3).
Internal R&D within the firm’s traditional technological path increases the effect of external search within a new technological path (green external search).

2.4.3. Depth vs. Breadth of External Search

Reference [25] did not focus on external search as a whole but distinguished between external search depth and breadth. External search breadth is defined as the number of external knowledge sources or search channels that firms rely upon in their innovative activities. External search depth measures the extent to which firms draw deeply from the different external knowledge sources ([25], p. 27). Even though our hypotheses do not distinguish between the two measures of external search, the expected differences between green and non-green innovation may hold primarily for search depth and not search breadth.
The expected differences in the effect of external search and green innovation are motivated by the greater complexity and distance of green innovation compared to non-green innovation. Due to greater complexity, the effect of external search is expected to be larger, less diminishing, and more dependent on in-house R&D activities for green innovation than for non-green innovation. However, the two measures of external search are not equally well suited to cope with this complexity.
Literature on the lifecycles of products reveals that companies at an early stage of the product lifecycle focus their innovation activities on a few external sources of knowledge (see [37,86]), i.e., they prefer search depth over search breadth. Based on this finding, reference [25] also anticipated that search depth is more effective than search breadth for the innovation performance of more radical innovation.
In principle, green innovation is more likely to occur at an early stage of the product life cycle than non-green innovation. Moreover, due to its relatively high complexity, green innovation is more comparable with radical innovation than incremental innovation. Hence, shallow knowledge obtained from broad external search should be less suitable to deal with the complexity of green innovation than deep external search. Accordingly, it is to be expected that in the case of green innovation, it is primarily deep external search that matters. With respect to our hypotheses, we thus expect that (a) primarily search depth shows a larger effect on green innovation performance than on non-green innovation performance (Hypothesis H1a), (b) primarily the effect of search depth is less diminishing for green innovation than for non-green innovation (Hypothesis H1b), and (c) primarily search depth stimulates the effect of internal (green and non-green) R&D on green innovation success (Hypotheses H2 and H3).

3. Methodology

3.1. Data

3.1.1. Green Innovation Data

To model the effect of external search on green innovation success, we make use of firm-level data that were collected in the course of a survey on the “creation and adoption of energy-related technologies” carried out in the three countries Austria, Germany and Switzerland in 2015. Green product innovation was defined as (a) product innovation activities for the generation of more energy-efficient technology for end-user in one of the following areas: production, ICT, transport or building technology; and (b) product innovation activities for the generation of technology for the use of energy from renewable sources, such as wind or hydroelectric power plants or solar systems (see, e.g., [79]). To obtain representative results, the survey was based on representative firm samples, i.e., the WIFO Enterprise Panel for Austria, the ZEW Enterprise Panel for Germany, and the KOF Enterprise Panel for Switzerland. Because most firms belonging to the service sector are rather unlikely to have generated green energy technologies for end-users (i.e., product innovation), the final samples used for this survey were restricted to the whole manufacturing sector (excluding the food industry, textile and cloth industry, printing, pharmaceuticals, and ‘other manufacturing’), the construction sector, and firms belonging to the two service industries ‘information technology services’ and ‘technical services’.
The survey was sent to 2129 Austrian firms, 2780 German firms, and 2870 Swiss firms. The questionnaires were directed to the CEO or other members of the executive board of the companies to ensure the reliability of the surveyed information. Valid information was received for 210 Austrian firms (response rate: 10%), 1056 German firms (37%), and 921 Swiss firms (32%). The questionnaire was very comprehensive, which significantly affected the response rates. However, the response rates for Germany and Switzerland were satisfying, but rather disappointing for Austria. With a comprehensive recall action in all three countries, we wanted to ensure that a sufficiently large number of answers was received for all three countries, covering all industries and all firm size classes according to the underlying sampling schemes. This survey data has been used in other investigations, which underlines the reliability of survey information (see [78,79]).
A specificity of this paper is that we have detailed information on the on the companies’ external search activities referring to their green innovation activities, while previous studies analyzing the effect of external search for green innovation have used information on the firms’ external search activities in general. This is important because green innovation activities typically account for only a small proportion of a company’s total innovation activities. In our sample, the average share of green innovation activities in total innovation activities (limited to companies with green innovation activities) is 11%, and only 6% of the firms with green innovation activities have more green than non-green innovation activities.
To make sure that the contacted firms can seriously assess the relevance of different knowledge sources for green innovation and do not mix this information with the relevance of external sources for non-green innovation, we restricted the sample to 316 firms that effectively have green innovation activities. Such an approach is common in the external search literature, e.g., [25,26,87,88], and does not per se introduce a selection bias. Since it is not possible to investigate the effect of external search on companies without innovation activities, we are only interested in that part of the total population of companies that has effective innovation activities. Due to missing values for some model variables, our final estimation sample included 259 observations: 56% of them are German firms, 36% Swiss firms, and 8% Austrian firms. On average, the firms in our sample have 1036 employees (median: 65 employees). 73% of the firms belong to the manufacturing sector, 23% to the service sector, and only 4% to the construction sector.

3.1.2. Non-Green Innovation Data

Information on non-green innovation is based on representative data from the KOF Swiss Innovation Survey 2015, which is similar in content and structure to the well-established Community Innovation Survey (CIS) in other European countries. As with the Swiss part of the green innovation data, the KOF Enterprise Panel serves as the basis of this survey. With the exception that this sample is limited to Switzerland, we can therefore guarantee a high comparability of the two datasets. Both datasets were collected in 2015 and were sent to the same contacts. In addition, the style and content of the questions in the surveys are very similar.
As the focus of this survey is not restricted to green innovation, the initial firm sample covered the whole business sector. Concurrently, the survey was sent to 5908 firms. Valid information was received for 1208 firms, which represents a response rate of 20%. To make sure that we did not mix information on green and non-green innovation, we then dropped 106 firms that had green innovation activity. Due to missing values for some model variables, our final estimation sample included 967 observations. On average, the firms in our sample had 303 employees (median: 67 employees). A total of 52% of the firms belonged to the manufacturing sector, 41% to the service sector, and only 7% to the construction sector.
Overall, the characteristics of firms with green and non-green innovation activities are insignificantly different. The only exception is company size, which is—at the mean—significantly larger in green companies (1036 vs. 303). However, this high number is due to two outliers. If we look at the median instead of the average firm size, there is hardly any difference in size either.

3.1.3. Information on External Search

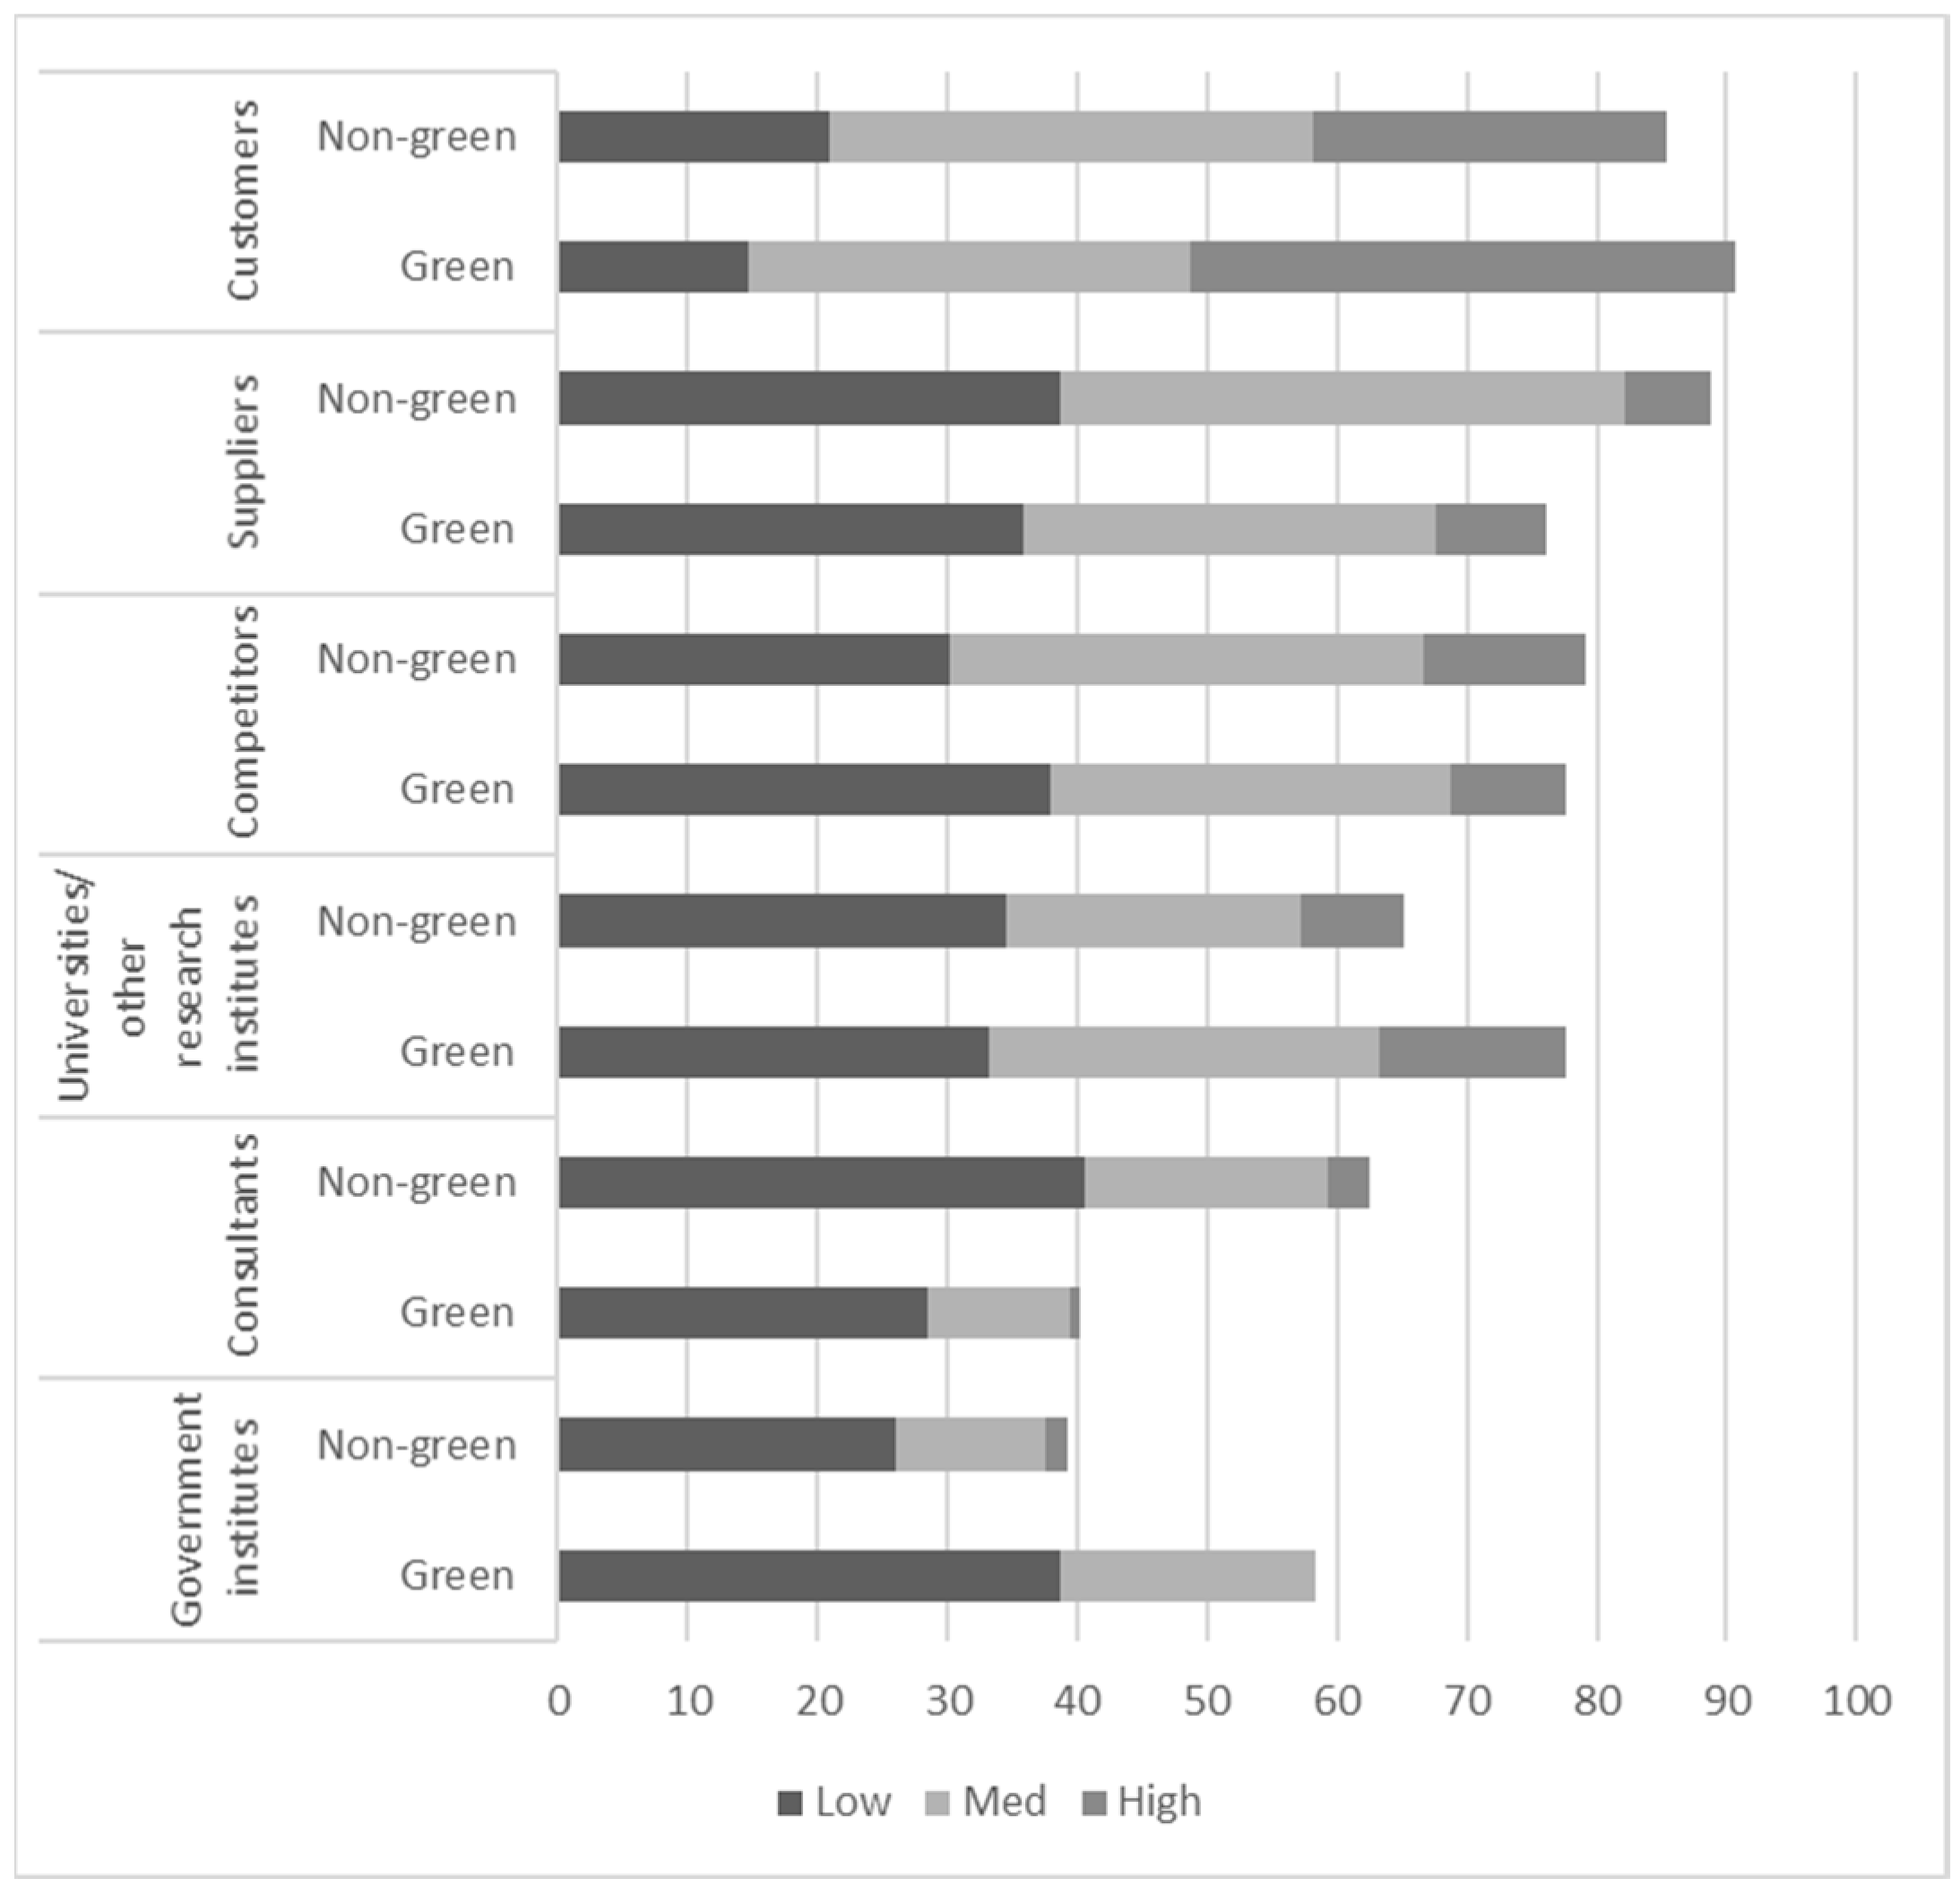
Besides information on the success of innovation and typical innovation drivers, both datasets include information on the use of external knowledge sources for innovation. In both surveys, the firms were asked to assess the relevance of different external knowledge sources on a four-point Likert scale. Overall, we can distinguish six different sources of knowledge for both green and non-green innovation. Figure 2 shows that, although the choice of sources of knowledge does not differ very much between green and non-green innovation, there are significant differences in certain sources. While knowledge from suppliers and consultants is more relevant for non-green innovation than for green innovation, knowledge from research and government institutes shows a higher relevance for green than for non-green innovation. Green innovation often requires access to knowledge that is new to the firm. Such knowledge is hardly available from other firms (competitors) in the sector with a similar technological orientation or from customers or suppliers that are also tied to non-green technologies. It requires knowledge generated from sources that are less tied to the market and to commercial activities in the past. This partly explains the relatively high relevance of knowledge from research institutes for green innovation compared to non-green innovation. Similarly, we see that the governmental institutions are more frequently important for green innovation activities than for non-green ones. This is also intuitively understandable, given that the governments in all three investigated countries are committed to promote the use and generation of environmentally friendly energy technologies. Public procurement plans are not only directed to innovative products but also to environmentally friendly produced products. Hence, the descriptive results provide a first picture of the importance of external knowledge sources for green inventions.
To test our hypotheses, however, we do not refer to the individual sources of external knowledge, but construct aggregated measures for search depth and breadth. In line with the literature (see [24,25,28]), search breadth is proxied by the number of external information sources a firm’s new green or non-green products rely upon. Search depth is measured by the number of highly relevant external information sources a firm’s new green or non-green products rely upon. Again, descriptive information does not differ significantly between green and non-green innovation. On average, firms cite 4.3 and 4.2 external knowledge sources for green and non-green innovation, respectively, and firms draw deeply from only 0.8 and 0.6 sources for green and non-green innovation, respectively. However, to properly compare external search between green and non-green innovation, we have to compare external search within the same firms. By merging the two data sets, 58 companies remain for which we have information regarding both external search for green innovation and innovation activities in general. Based on this information, we observe that external search clearly differs between green and non-green innovation. Within-firm correlations are only 0.38 for search breadth and 0.33 for search depth. This fact indicates that green external search activities are different from non-green external search activities.

3.2. Empirical Concept

To ensure a high level of comparability, we estimate the same models for green and non-green innovation. As discussed before, existing literature supports our argumentation to use green technologies as an example of a new technological path and non-green innovation representing the traditional technological path. Empirical implementation, however, is not that straightforward. Technological path dependence is not unique to green innovations, but can be observed in other areas as well. Therefore, some companies in our control group will also be confronted with technological path dependence. Moreover, some companies with green innovation activities have been on the green path for many years and may consider it their “traditional” path. As long as these are only a few cases, this should not affect our empirical results. In our empirical setting, we do not compare single companies. Instead, we compare the averages of the two groups, green and non-green companies. Moreover, on average, green companies should be much more likely to face a switch to a new technological path. This is also supported by our data. In our sample, 50% of companies with green innovation activities generate less than 5% of their sales from such green products. Just 4% of the companies achieve more than 50% of sales with green products. Thus, very few cases have already completed the switch to the new green technological path. Most companies will thus still consider the green technological path as a new path.
We use innovation performance as the dependent variable, which is measured by the sales share of new green and non-green products, respectively. To identify the effect of external search, we included our two measures for search depth and search breadth. To test our predictions, we also add controls for R&D intensity and collaboration. All these knowledge variables measuring external search, R&D and collaboration refer either to green or non-green innovation. This is important to be able to identify the effect of path-specific knowledge input on path-specific innovation output. To test Hypothesis H3, we also identify potential complementarities across technological paths, that is the effect of external green search and traditional R&D on green innovation performance.
Moreover, to reduce a potential omitted variable bias, we control for a large set of observables. In line with [25], we add controls export intensity, the qualification level of the employees, firm age, competition intensity, firm size, country of origin and industry affiliation (other potential control variables, relevant especially for green innovation such as environmental policy, are discussed in the robustness section). All these control variables represent general firm or market characteristics, which are independent of the type of innovation activity (see Table A1, Table A2 and Table A3 in the Appendix A for variable definition, descriptive statistics, and correlation matrix, respectively). We therefore arrive at the following equations, which we use for our econometric models:
N o n   g r e e n   i n n o v a t i v e   p e r f o r m a n c e = α N o n   g r e e n   b r e a d t h + β N o n   g r e e n   d e p t h + γ N o n   g r e e n   R & D   i n t e n s i t y + δ N o n   g r e e n   c o l l a b o r a t i o n + C o n t r o l s + ε
G r e e n   i n n o v a t i v e   p e r f o r m a n c e = α G r e e n   b r e a d t h + β G r e e n   d e p t h + γ G r e e n   R & D   i n t e n s i t y + δ G r e e n   c o l l a b o r a t i o n + C o n t r o l s + ε
where ε is an error term.
Our measure of innovation performance is the natural logarithm of a continuous variable ranging from 0 to 100, with most values well below the upper bound. To consider the accumulation of observations at the (naturally fixed) lower bound of the distribution, we estimate Tobit regressions. We compare the impact of external knowledge sources for the two types of innovation activities by splitting the sample into two groups of firms, i.e., firms with green innovation activities and firms with non-green innovation activities, and run the estimations for the two groups separately. Since our model includes not only direct effects, but also interaction terms, it would be difficult to interpret the estimation results concerning potential differences between green and non-green innovation within a single model. As discussed above, the two samples have quite similar characteristics. Remaining differences should be capture by our large set of control variables. To compare the coefficients of both models, the different characteristics of the samples must be considered; also, in this case we find significant differences.
Although we should be able to significantly reduce a potentially omitted variable bias by adding a large set of control variables, it cannot be ruled out completely that our results are affected by unobserved heterogeneity. Reverse causality could especially be a problem. We have argued that external knowledge sources can contribute to break a technological path, but the effect could also go in the other direction. Companies which are open for radical change and also willing to leave their technological path may also be more willing to access external knowledge sources (see [89]). Directly testing for endogeneity is not possible in all our models, since we include a large set of (potentially endogenous) knowledge variables (internal vs. external; breadth vs. depth), and we also want to test for nonlinearities in their effects and interactions between different variables.
Instead, we address potential endogeneity in two different ways. First, to obtain a feeling for the robustness of the results in terms of reverse causality, we performed some IV regressions (see section about robustness tests). Second, in addition to the model variables already included in our baseline regression, several extensions control for additional company and environment characteristics, which may bias our main effect (see Section 4.4).
Due to the large scope of the information in our data set, we have to accept a reduction in the time coverage of the data. It is therefore all the more important to check whether our theoretical predictions also hold up to the results of other empirical studies in this field of research conducted on different data sets for different countries using different estimation methods. By discussing similarities and differences to our results in detail, we find further support for the robustness of our predictions (see Table 1).

4. Results

In this section, we present and discuss our empirical results in the context of the existing literature. Specifically, we compare the results on non-green innovations with the well-founded findings of [25] and the results of green innovations with [28]. Although some interesting differences can be identified, this comparison makes it clear that the main results do not differ significantly for different countries, datasets, and estimation methods.

4.1. Results for Non-Green Innovation

We first investigate whether we can reproduce the mainstream results of the relationship between search breadth/depth and the innovation performance of a firm. Table 2 presents the results. As expected, we see in our data the inverted U-shaped relationship between breadth and depth and the innovation performance of a firm (Table 2, Column 6), respectively. This result holds independent of the model specification. We can insert the interaction terms separately (Column 2 for depth; Column 4 for breadth) or together (Column 6), or we combine a linear term for breadth and the interaction of depth in a single equation (Column 3) or the linear term for depth and the interaction of breadth in a single equation (Column 5). We always obtained the same signs, and even the size of the coefficients is very similar, which indicates the robustness of the results.
Table 2 also shows that R&D intensity has the expected positive and significant sign in all equations. If we interact search breadth and search depth with R&D intensity, we obtain a negative and significant interaction term. This is somehow curious at first glance. However, a closer look reveals that breadth and depth are positively related with the innovation performance at rather low levels of R&D. If the R&D intensity increases, the positive effect of breadth and depth with performance decreases. This indicates that the marginal value of external knowledge sources decreases with high R&D intensity of a firm. This is not very surprising; if we see that very R&D-intensive firms tend to operate at the technological frontier and they hesitate to “deeply” open the core elements of their innovation process to external partners. Moreover, even if they open “deeply” to external sources the expected positive effects are likely to be lower compared to companies operating in greater distance to the technological frontier, since such companies are less likely to run into contradictious knowledge signals or conflicts between external and internal knowledge than heavily invested R&D companies. Although R&D intensive companies might still benefit from external knowledge sources, they benefit less than firms with lower internal R&D intensity. This result does not question the importance of absorptive capacity; it suggests that external search activities might have a different focus in R&D-intensive firms, e.g., more related to non-core innovation activities and less intense external relationships. This intuition is confirmed in the estimation presented in Column 9. Here, we see that the negative interaction effect only refers to search depth. Deep relationships are less frequently in firms with high R&D intensity. A further reason for the negative interaction term was provided by [28]. They stated that deeper interaction with external knowledge sources are likely to create a mismatch with internally developed R&D.
The remaining control variables in all estimations show the expected sign. Export intensity, the share of highly qualified employees, and R&D collaborations are significantly and positively related with the innovation performance of firms.
A comparison with the results of [25] shows that our results for non-green innovation also hold in other settings. They also find an inverted U-shaped relationship between external search and innovation success. Moreover, they also find no evidence of complementarity between external search and internal knowledge.

4.2. Results for Green Innovation

In Table 3, we present the results for the “green” innovation performance of a firm. We see a direct effect of search breadth and depth and green innovation performance (see Column 1) and the inverted U-shaped relationship indicated by the interaction terms of breadth. However, the negative effect of the interaction term is not significant in the preferred model, including all interaction terms (Column 6). Here, we only see a significant and positive effect of search breadth. Moreover, we observe a significant and positive mediating effect of internal green R&D intensity for search depth (see Columns 8 and 9).
The control variables with significant signs behave well. Green R&D intensity is positively mirroring the importance of absorptive capacity and the importance of internal green knowledge for green innovation activities. Firm size is negative, indicating that the sales share of green innovative products is still minor in larger companies.
A comparison with the results of [28] shows that our findings for green innovation also hold in other settings (see Table 1). They also found evidence of an inverted U-shaped relationship only for search breadth; the relationship between search depth and green innovation is linear or even exponential in their model. The only difference from our results is that, as we observed with non-green innovation, they did not find evidence of complementarity between external and internal knowledge. One reason for this different result could be that, unlike us, they considered internal knowledge as a whole to test the complementarity of internal knowledge with external knowledge sources. Moreover, R&D activities are measured by a binary variable, which means that the intensity of R&D activities is not captured. It can be assumed that most of these R&D activities relate to non-green innovation activities. If we test the complementarity of our measures for external search with internal non-green R&D, we do not find any significant effects, but, in line with the findings of [28], some of the coefficients are then negative (see Table 4).

4.3. Comparing the Results: Green vs. Non-Green Innovation

The results from Table 2 and Table 3 indicate the path-dependence of innovation activities. Internal green R&D intensity is significantly related to green innovation performance and also internal non-green R&D intensity is significantly related to non-green innovation performance. Since we are comparing linear and non-linear effects, we cannot directly compare the size of a particular coefficient, but rather a comparison of the overall pattern is relevant in our case.
When we compare the findings for green and non-green innovation, our hypotheses are largely confirmed for search depth. In line with Hypotheses H1a,b, the positive effect of external knowledge sources is more pronounced for green innovation than for non-green innovation. While the effect of search depth is partly insignificant for non-green innovation, it is significant for green innovation at the 1% test level and the coefficient is about three times larger compared to non-green innovation. Moreover, while an inverted U-shaped relationship is observed between search depth and non-green innovation, the relationship is linear for green innovation, indicating that we do not observe a saturation point at this level of the use of external knowledge sources.
Consistent with Hypothesis H2, the complementarity between internal knowledge and external search is greater for green innovations than for non-green innovations, with the interaction term even being negative for the latter. This finding clearly shows the importance of internal green knowledge for the efficient use of external green knowledge.
Overall, we therefore observe a larger effect of external search regarding green innovation compared to non-green innovation. As expected, the difference is more pronounced for search depth than for search breadth, which is probably due to the high complexity and low age of green technologies.
Table 4 adds important information. Non-green R&D intensity is negatively related with green innovation activities (although not statistically significant). This confirms the finding from previous studies that existing non-green knowledge increases opportunity costs, which negatively affects the green innovation performance, see, e.g., [75,76]. Table 3 shows that search breadth and search depth do not significantly oppose the path dependence of R&D activities. Both interaction terms (breadth # non-green R&D intensity, depth # non-green R&D intensity) are insignificant independent of the model specification. Unlike that predicted in Hypothesis H3, this means that the search activities of firms are unlikely to facilitate the switch of internal knowledge between different technological paths.
Some evidence for Hypothesis H3, however, can be found when we split the sample of firms by the intensity of their non-green R&D activity (see Table 5). For firms with a small base of internal non-green knowledge, we observe significantly negative interaction effects with green external search activities (Columns 1 to 3). In line with Hypothesis H3, however, we observe significant positive interaction effects for firms with a large base of internal non-green knowledge (Columns 4 to 6). These results indicate that if the internal knowledge base within the firm’s traditional technological path is large enough, firms can effectively absorb external knowledge also from new technological paths. External green knowledge sources contribute to weaken technological path dependence for R&D-intensive companies, they facilitate operating successfully on a new technological path, and decrease the obsolescence of traditional technological activities.
Overall, our results thus confirm the specific importance of external knowledge for switching technological paths. Knowledge acquisition, especially for green innovation, is often not easy due to the added complexity and novelty and requires open forms of innovation and the inclusion of external knowledge sources, e.g., [28,90,91,92].

4.4. Robustness Tests

In order to examine the robustness of our main results, we pursued several robustness tests. Although we compare averages, our empirical concept is based on the assumption that we compare green and non-green companies. In our main model, we already removed companies from the non-green innovation sample that have implemented green innovations according to the survey on the “creation and adoption of energy-related technologies”. However, this control may be insufficient, because this survey only considers energy-related innovations. Companies with other forms of green innovation may still be in the sample. As an additional robustness test, we use information on the objectives of innovation activities. Therefore, we had to merge the data with information from the Swiss Innovation Survey in 2011, where we can find information about the innovation objectives of companies. Since both surveys are based on the KOF enterprise panel the overlap of companies is quite high. By removing all 100 companies for which the creation of environmentally friendly products was a main goal of innovation activities, we can further clean up our sample. However, as Table A4 shows, this adjustment does not affect the estimation results.
Since the models for non-green innovation are basically a replication of the [25] models, we focus on green innovation in all other robustness tests. As discussed before, the average firm size is somewhat larger for the green innovation sample. However, this is primarily due to two outliers. To test whether these two outliers also affect our regression results, both firms were dropped as a robustness test (see Column 1 in Table A5). This modification has no impact on size and direction of the coefficients.
In Columns 2 to 5, we test the effects of corporate exposure to green policies, which is typically a major driver of green innovation activities see [93]. However, our models do not show any significant impact. One possible reason could be that policy primarily affects the likelihood of innovation, but has less impact on intensity once a company has started green innovation (see Woerter et al. 2017 for a related finding). The fact that the inclusion of policy measures has no influence on the effect of external search at least reduces the risk that our results are influenced by unobserved heterogeneity.
In Column 6, we finally test for green process innovation, which is potentially a complement to green product innovation see [78]. This effect is also not statistically significant, which confirms that we already consider a very homogeneous sample of companies in our models. In sum, we find no evidence of an omitted variable bias.
Another potential problem is the comparability of the green and non-green data sets, since the green innovation data includes not only Swiss companies, but also German and Austrian firms. To test the robustness of our comparison, we estimate our models shown in Table 2 for Swiss firms only (see Table A6). This reduces the number of observations to 93, therefore it is not surprising that not all effects can be significantly identified in these models. However, the results clearly show that the directions of the main results are still valid in this setting. For search depth, no inverted U-shaped relationship can be observed. Again, clear indications of complementarities between internal R&D and external search can be found for search depth.
As discussed in the methodology section, controlling for a large set of observables might be insufficient to account for endogeneity of the estimates. Hence, Table A7 shows results of IV regressions. Unfortunately, the external search literature in general is confronted with the problem that it is hardly possible to find external shocks that simultaneously affect knowledge input and innovation output. This is all the more the case for us, as we test multiple knowledge variables at the same time. In our case, the two variables measuring external search depth and breadth are instrumented using their two-digit industry averages (excluding the values of the focal firms). From a conceptual point of view these variables are good instruments, as industry activities typically have an impact on the activities of the individual company, but not vice versa. Test statistics confirm the quality of the instruments. We report the F-Statistics of the instruments to evaluate the strength of the instruments, whereby the values indicate sufficient strength in the simpler models but become lower when we also test for nonlinearities and thus include several potentially endogenous variables at the same time. Finally, LM statistics indicate, that we can reject the prediction of underidentification in all tested models.
Given the complexity of our models and the number of potentially endogenous variables, it is not surprising that not all effects can be significantly identified in the IV models. However, especially in the simpler model presented in Column 1, results indicate that our previous findings are hardly affected by endogeneity; the coefficients of search depth (0.25 vs. 0.31) and search breadth (0.18 vs. 0.18) are almost unaffected. The other results also largely confirm our previous finding that search depth has a linear positive effect on innovation success, while an inverted U-shaped relationship is observed for search breadth. With increasing complexity, however, the accuracy of estimation decreases. This is also the reason why we refrain from additionally endogenizing R&D as a moderator of external search.

5. Conclusions and Policy Implications

In this study, we investigate the effects of external knowledge sources on a firm’s ability to operate successfully on a new technological path. We argue that access to external knowledge sources can help to overcome path dependence as it reduces both the costs of building new knowledge and increases the usefulness of traditional knowledge in the new technological path. We empirically test our predictions by using green technologies as an example for a new technological path. Comprehensive survey data on both green and non-green innovation activity allows us to distinguish green from non-green knowledge sources, green from non-green R&D activities, and green from non-green innovative products. This enables a comparative view on the importance of search breadth and search depth for the respective innovative performance. Moreover, we can investigate if external knowledge sources are facilitating to diversify into green innovation activities successfully.
The results confirm the inverted U-shaped relationship between breadth and depth and the innovation performance in the traditional product space. Moreover, we see a negative moderating effect of R&D intensity on search depth. Following [28] this can be interpreted with increasing conflicts between external and internal information with tends to lower the innovation performance. A further explanation refers to the innovation strategy. R&D intensive firms might hesitate to “deeply” open up the core elements of their innovation process to external partners and direct external knowledge activities to non-core innovation areas. This strategy still leads to positive effects; such firms, however, benefit less from external ties than firms with lower R&D intensity and a different innovation strategy.
The picture changes when we analyze the effect of external search for knowledge along the new technological path, that is, when we look at the effect of green knowledge sources on green innovation performance. Here, we predominantly detect a linear and monotonous relationship between search breadth and search depth and the commercial success of green innovative products. We also see a significantly positive mediating effect of internal green R&D intensity. On the one hand, this indicates that the “over-search” effect is less pronounced at this still at an relatively early stage of green markets development. Firms seem to successfully scan the knowledge environment for new green technologies using as many sources as deep as possible to gain at least some incremental improvements of their green products. On the other hand, external knowledge nicely complements internal knowledge and the risk of contradicting information from the external environment seem to be less of a problem. The relatively low level of the average internal knowledge stock compared to non-green knowledge might be an explanation for this finding.
Overall, we find strong direct effects of external (green) knowledge and green innovation success, with the effect of deep search being particularly pronounced. The results even indicate that the direct effect of external knowledge tend to be larger for green than for non-green innovation. If green innovation is seen as an example of a change to a new technological path, these findings indicate that especially deep search (directly) helps to be successful in a new technological market and thus facilitates technological diversification. For a successful switch, however, a corresponding internal knowledge is required. Our findings indicate that the effect of green external search increases significantly with the availability of internal green knowledge.
In a further step, we investigate whether external green search reduces the sunk costs of traditional knowledge by increasing its profitable use within a new technological path, i.e., whether we can observe a positive moderating effect of internal non-green knowledge on the performance effect of external green search. This is the case if the internal (non-green) knowledge base is sufficiently large; only if this applies, firms can effectively absorb external knowledge from new technological paths. Different factors might help us to understand this small moderating effect of external (green) sources for internal traditional knowledge. First, the external ties are still too weak or the knowledge of external partners too low to significantly boost a switch of internal knowledge derived within their traditional technological path; therefore, the size of internal knowledge is important. Second, the firms do not search for external knowledge that directly nurtures their internal traditional knowledge, e.g., as they use the external ties to monitor the market for early traces of promising technologies in order to timely adapt their innovation activities. Third, the benefits of early external search activities on internal traditional knowledge are not yet visible in the available data, and we will only see positive effects in the longer term. For example, firms may accumulate green knowledge and they wait for promising policy signals that make markets more receptive for green innovative products. Then, they will start to diversify into green markets and also change their internal knowledge base.
There are several limitations to mention. First, although we have data for technologically important countries it would be necessary to have data from countries that are less heavily invested in non-green technologies. This might lead to different results, since firms that drive the frontier in non-green technologies and continue to commercialize new products successfully will refrain from cannibalizing their profitable products with supposably less profitable green innovative products. For firms in technologically less “biased” countries the effects of external green knowledge sources might be different. Second, panel data for a longer period in time is necessary to investigate the lag structure of effects and to consider unobserved heterogeneity. While such data are available for general innovation, this is not the case for green innovation and its specific search activities. Third, it would be also very interesting to distinguish between foreign and domestic external green knowledge sources. It is likely that we would detect different effects, especially if we think in countries that technologically catch-up, as with India or China. Fourth, our empirical test is based on green technologies as an example of a new technological path. It would be important to examine whether our expectations also apply to other new technological paths.

Author Contributions

Conceptualization, T.S. and M.W.; formal analysis, T.S.; writing—original draft preparation, T.S. and M.W.; writing—review and editing, T.S. and M.W. All authors have read and agreed to the published version of the manuscript.

Funding

This work was funded by Swiss National Science Foundation grant number P300P1_164602.

Data Availability Statement

Data available only on request due to privacy restrictions. The data presented in this study are available on request from the corresponding author and accessible in the KOF Data Center for the purpose of research without commercial interests. The data are not publicly available due to confidentiality requirements of the used firm-level information.

Conflicts of Interest

The authors declare no conflict of interest.

Appendix A

Table A1. Variable definition/measurement.
Green Innovation ModelNon-Green Innovation Model
Innovative performanceShare of new green products in total sales, lnShare of new non-green products in total sales, ln
BreadthNumber of external information sources the firm’s new green products rely upon (variable is based on six four-level ordinal variables (level 1: no relevance, level 4: high relevance): (1) customers, (2) suppliers, (3) competitors, (4) universities or other research institutes, (5) consultants, (6) government institutes)Number of external information sources the firm’s new non-green products rely upon (variable is based on six four-level ordinal variables (level 1: no relevance, level 4: high relevance): (1) customers, (2) suppliers, (3) competitors, (4) universities or other research institutes, (5) consultants, (6) government institutes)
DepthNumber of highly relevant external information sources the firm’s new green products rely upon (variable is based on same variables as ‘Breadth’; transformation of the four-level ordinal variables into binary variables: variables are coded with 1 when the firm in question reports that a source is of high relevance for the generation of its new green products and 0 if the source is of no, low, or medium relevance)Number of highly relevant external information sources the firm’s new non-green products rely upon (variable is based on same variables as ‘Breadth’; transformation of the four-level ordinal variables into binary variables: variables are coded with 1 when the firm in question reports that a source is of high relevance for the generation of its new products and 0 if the source is of no, low, or medium relevance)
R&D intensityShare of green R&D expenditures in total sales, ln Share of non-green R&D expenditures in total sales, lnShare of non-green R&D expenditures in total sales, ln
Export intensityShare of exports in total sales, lnShare of exports in total sales, ln
Share of high qualifiedShare of employees with a tertiary-level degree, lnShare of employees with a tertiary-level degree, ln
Firm ageFirm age in years, lnFirm age in years, ln
Competition intensityNumber of competitors in the firm’s domestic and foreign prime market (five-level ordinal variable; level 1: 0–5, level 2: 6–10, level 3: 11–15, level 4: 16–50, level 5: more than 50)Number of competitors in the firm’s domestic and foreign prime market (five-level ordinal variable; level 1: 0–5, level 2: 6–10, level 3: 11–15, level 4: 16–50, level 5: more than 50)
CollaborationSome of the new green products were jointly developed yes (value 1)/no (value 0)R&D cooperation with cooperation partners yes (value 1) /no (value 0)
Firm sizeNumber of employees measured in full-time equivalents; lnNumber of employees measured in full-time equivalents; ln
Country controlsControls for the firm’s country of origin (Austria, Germany, or Switzerland)n/a (sample is restricted to Swiss firms)
Industry controlsControls for industry affiliation at NACE two-digit levelControls for industry affiliation at NACE two-digit level
Table A2. Descriptive statistics.
Green Innovation ModelTraditional Innovation Model
VariableMeanStd. Dev.MinMaxMeanStd. Dev.MinMax
Innovative performance11.8919.94010017.6624.840100
Breadth4.251.57064.201.7106
Depth0.800.83030.590.8804
R&D intensity1.656.250721.586.200100
Export intensity32.0934.28010025.7236.280100
Share of high qualified26.4827.40010026.8722.780100
Firm age46.2738.21420062.5045.361496
Competition intensity2.451.35152.501.3615
Collaboration0.550.50010.210.4101
Firm size1036.138299.211112,305303.261553.80137,139
Notes: Descriptive statistics for green innovation model is based on 259 observations (same sample as main model in Table 2); descriptive statistics for non-green innovation model is based on 967 observations (same sample as main model in Table 1); the large difference in the size of firms with green and non-green innovation models is due to two outliers; if we look at the median instead of the average firm size, there is hardly any difference in size.
Table A3. Correlation matrix.
(a) Green Innovation Model
Innovative PerformanceBreadthDepthR&D IntensityExport IntensityShare of High QualifiedFirm AgeCompetition IntensityCollaboration
Breadth0.22
Depth0.180.18
R&D intensity0.240.070.16
Export intensity0.120.190.060.15
Share of high qualified−0.07−0.030.080.30−0.04
Firm age0.100.09−0.06−0.200.15−0.30
Competition intensity0.010.060.00−0.12−0.210.07−0.16
Collaboration−0.070.08−0.06−0.03−0.170.050.030.08
Firm size0.000.240.06−0.040.36−0.120.40−0.17−0.06
(b) Non-Green Innovation Model
Innovative PerformanceBreadthDepthR&D IntensityExport IntensityShare of High QualifiedFirm AgeCompetition IntensityCollaboration
Breadth0.19
Depth0.180.33
R&D intensity0.370.180.21
Export intensity0.300.210.230.45
Share of high qualified0.190.200.110.290.24
Firm age−0.030.080.00−0.06−0.010.01
Competition intensity−0.12−0.03−0.05−0.16−0.10−0.10−0.04
Collaboration0.310.230.220.570.330.21−0.01−0.11
Firm size0.150.280.250.190.220.170.24−0.210.27
Notes: (a) N = 259; based on same sample as main model in Table 2; (b) N = 967; based on same sample as main model in Table 1.
Table A4. Removing additional green companies from the non-green innovation sample; Tobit regressions.
(1)(2)(3)(4)(5)(6)(7)(8)(9)
Non-Green Innovative Performance
Non-green Breadth0.179 *** 0.170 **0.736 ***0.728 ***0.661 ***0.238 ***0.173 ***0.209 ***
(0.066) (0.066)(0.240)(0.240)(0.241)(0.071)(0.066)(0.073)
Non-green depth0.1050.865 ***0.750 *** 0.1170.692 **0.1260.300 **0.267 *
(0.117)(0.288)(0.290) (0.117)(0.290)(0.117)(0.136)(0.139)
Non-green depth # non-green depth −0.273 **−0.257 ** −0.229 **
(0.107)(0.106) (0.107)
Non-green breadth # non-green breadth −0.075 **−0.076 **−0.068 **
(0.032)(0.032)(0.032)
Non-green breadth # non-green R&D intensity −0.202 ** −0.119
(0.087) (0.098)
Non-green depth # R&D intensity −0.315 ***−0.243 *
(0.116)(0.131)
Non-green R&D intensity0.625 ***0.637 ***0.636 ***0.627 ***0.620 ***0.631 ***1.547 ***0.934 ***1.403 ***
(0.170)(0.171)(0.170)(0.170)(0.170)(0.169)(0.433)(0.205)(0.438)
Non-green collaboration0.688 **0.721 **0.648 **0.727 **0.717 **0.678 **0.725 **0.685 **0.707 **
(0.283)(0.282)(0.282)(0.283)(0.282)(0.282)(0.282)(0.282)(0.282)
Export intensity0.122 *0.130 **0.123 *0.114 *0.109 *0.112 *0.124 *0.114 *0.117 *
(0.066)(0.066)(0.066)(0.066)(0.066)(0.066)(0.066)(0.066)(0.066)
Share of high qualified employees0.180 *0.208 *0.1760.1700.1710.1690.1780.184 *0.182 *
(0.108)(0.108)(0.108)(0.109)(0.108)(0.108)(0.108)(0.108)(0.108)
Firm age−0.190−0.173−0.187−0.202−0.194−0.191−0.191−0.196−0.196
(0.132)(0.132)(0.132)(0.132)(0.132)(0.132)(0.132)(0.132)(0.132)
Competition intensity−0.047−0.028−0.037−0.045−0.047−0.038−0.045−0.043−0.043
(0.077)(0.077)(0.077)(0.077)(0.077)(0.077)(0.077)(0.077)(0.077)
Firm size0.1180.154 **0.1220.133 *0.1250.128 *0.133 *0.1240.131 *
(0.077)(0.076)(0.077)(0.077)(0.077)(0.077)(0.077)(0.077)(0.077)
Country controlsnonononononononono
Industry controlsyesyesyesyesyesyesyesyesyes
N867867867867867867867867867
Wald chi2263.15 ***262.45 ***269.05 ***268.01 ***269.02 ***273.69 ***268.53 ***270.50 ***271.97 ***
Log Likelihood−1330.51−1330.85−1327.55−1328.07−1327.57−1325.23−1327.81−1326.83−1326.09
Notes: See Table A1 in the Appendix A for the variable definitions; standard errors are in brackets under the coefficients; ***, **, * denote statistical significance at the 1%, 5%, and 10% test level, respectively; in this model, the measures for breadth, depth, R&D intensity and collaboration refer to non-green innovation activity.
Table A5. Robustness tests for green innovation model.
Dropping Outliers Regarding Firm SizeAdd Policy ControlsAdd Control for Process Innovation
Green Innovative Performance
Green breadth0.18 ***0.19 ***0.18 ***0.17 **0.16 **0.15 **
(0.07)(0.07)(0.07)(0.07)(0.07)(0.07)
Green depth0.32 ***0.30 **0.32 ***0.32 ***0.31 ***0.34 ***
(0.12)(0.12)(0.12)(0.12)(0.12)(0.12)
Green R&D intensity0.53 ***0.56 ***0.53 ***0.53 ***0.51 ***0.57 ***
(0.14)(0.14)(0.14)(0.14)(0.14)(0.14)
Green collaboration−0.22−0.21−0.16−0.15−0.12−0.12
(0.21)(0.21)(0.21)(0.21)(0.21)(0.21)
Export intensity0.020.020.020.020.040.00
(0.07)(0.07)(0.07)(0.07)(0.07)(0.07)
Share of high qualified0.120.080.120.130.120.11
(0.12)(0.12)(0.12)(0.12)(0.12)(0.12)
Firm age0.130.160.150.140.150.12
(0.15)(0.15)(0.15)(0.15)(0.15)(0.15)
Competition intensity0.100.13 *0.110.110.110.12
(0.08)(0.08)(0.07)(0.07)(0.07)(0.08)
Firm size−0.16 **−0.14 **−0.17 **−0.16 **−0.17 **−0.14 **
(0.07)(0.07)(0.07)(0.07)(0.07)(0.07)
Taxes −0.20
(0.16)
Regulations 0.09
(0.15)
Voluntary agreements 0.14
(0.14)
Public subsidies 0.21
(0.13)
Green process innovation −0.46
(0.55)
Country controlsyesyesyesyesyesyes
Industry controlsyesyesyesyesyesyes
N257259259259259250
Wald chi2122.24 ***124.62 ***123.39 ***123.93 ***125.38 ***119.42 ***
Log Likelihood−380.64−382.66−383.28−383.01−382.28−371.14
Notes: All regressions are based on model (1) of Table 2; see Table A1 in the Appendix A for the variable definitions; standard errors are in brackets under the coefficients; ***, **, * denote statistical significance at the 1%, 5%, and 10% test level, respectively; in this model the measures for breadth, depth, R&D intensity and collaboration refer to green innovation activity. Column 1: Dropping outliers; Columns 2–5: Policy variables: Firm-specific relevance of energy related taxes, regulations, voluntary agreements and subsidies, respectively (three-level ordinary variable; level 1: ‘not relevant’; level 3: ‘high relevance’); Column 6: Green process innovation: intensity of investments in green process innovation.
Table A6. Capturing country effects: estimating green innovation models specifically for Swiss firms.
(1)(2)(3)(4)(5)(6)(7)(8)(9)
Green Innovative Performance
Green breadth0.04 0.050.76 *0.76 *0.79 *0.090.060.05
(0.08) (0.08)(0.44)(0.44)(0.43)(0.09)(0.08)(0.08)
Green depth0.100.450.46 0.100.480.08−0.05−0.05
(0.13)(0.31)(0.31) (0.13)(0.30)(0.13)(0.14)(0.14)
Green depth # green depth −0.16−0.17 −0.18
(0.13)(0.13) (0.13)
Green breadth # green breadth −0.09 *−0.09 *−0.09 *
(0.05)(0.05)(0.05)
Green breadth # green R&D intensity −0.30 0.02
(0.20) (0.24)
Green depth # green R&D intensity 0.68 ***0.70 **
(0.25)(0.31)
Green R&D intensity0.59 ***0.57 ***0.58 ***0.59 ***0.56 ***0.54 ***1.89 **−0.45−0.57
(0.19)(0.19)(0.19)(0.19)(0.19)(0.19)(0.91)(0.43)(1.40)
Green collaboration−0.09−0.06−0.09−0.11−0.11−0.11−0.06−0.11−0.11
(0.22)(0.21)(0.22)(0.22)(0.22)(0.21)(0.22)(0.21)(0.21)
Export intensity0.020.030.020.010.010.01−0.00−0.01−0.01
(0.07)(0.06)(0.07)(0.07)(0.07)(0.07)(0.07)(0.07)(0.07)
Share of high qualified0.050.030.040.080.080.070.030.050.05
(0.13)(0.13)(0.13)(0.13)(0.13)(0.13)(0.13)(0.13)(0.13)
Firm age−0.17−0.16−0.16−0.13−0.14−0.13−0.18−0.10−0.10
(0.15)(0.15)(0.15)(0.15)(0.15)(0.15)(0.15)(0.14)(0.15)
Competition intensity−0.18 **−0.17 **−0.17 **−0.17 **−0.17 **−0.16 **−0.20 **−0.21 ***−0.21 ***
(0.08)(0.08)(0.08)(0.08)(0.08)(0.08)(0.08)(0.08)(0.08)
Firm size−0.11−0.10−0.11−0.11−0.12−0.12−0.11−0.08−0.08
(0.08)(0.08)(0.08)(0.08)(0.08)(0.08)(0.08)(0.08)(0.08)
Country controlsnonononononononono
Industry controlsyesyesyesyesyesyesyesyesyes
N939393939393939393
Wald chi230.3931.7332.0532.5833.1635.0532.4637.41 *37.42 *
Log Likelihood−113.48−112.81−112.65−112.39−112.09−111.15−112.44−109.97−109.96
Notes: See Table A1 in the Appendix A for the variable definitions; standard errors are in brackets under the coefficients; ***, **, * denote statistical significance at the 1%, 5%, and 10% test level, respectively; in this model the measures for breadth, depth, R&D intensity, and collaboration refer to green innovation activity.
Table A7. Testing for endogeneity in the green innovation models (IV regressions).
(1)(2)(3)(4)(5)(6)
Green Innovative Performance
Green breadth0.18 *** 0.18 ***0.36 +0.240.25
(0.06) (0.06)(0.22)(0.23)(0.23)
Green depth0.25 **0.040.00 0.24 *−0.01
(0.12)(0.28)(0.27) (0.12)(0.27)
Green depth # green depth 0.130.11 0.11
(0.12)(0.12) (0.12)
Green breadth # green breadth −0.02−0.01−0.01
(0.03)(0.03)(0.03)
Green R&D intensity0.46 ***0.50 ***0.48 ***0.50 ***0.47 ***0.49 ***
(0.10)(0.10)(0.10)(0.10)(0.10)(0.10)
Green collaboration−0.19−0.14−0.21 +−0.22 +−0.19−0.21 +
(0.14)(0.14)(0.14)(0.15)(0.14)(0.14)
Export intensity−0.000.03−0.00−0.01−0.00−0.00
(0.05)(0.05)(0.05)(0.05)(0.05)(0.05)
Share of high qualified employees0.080.060.090.070.070.08
(0.10)(0.10)(0.09)(0.10)(0.10)(0.10)
Firm age0.080.080.080.090.080.09
(0.11)(0.11)(0.11)(0.11)(0.11)(0.11)
Competition intensity0.080.09 +0.070.08 +0.080.07
(0.06)(0.06)(0.06)(0.06)(0.06)(0.06)
Firm size−0.13 ***−0.10 **−0.13 ***−0.13 ***−0.13 ***−0.13 ***
(0.05)(0.05)(0.05)(0.05)(0.05)(0.05)
Country controlsyesyesyesyesyesyes
Industry controlsyesyesyesyesyesyes
N259259259259259259
R20.360.350.360.350.360.37
adj R20.270.250.270.250.270.27
Log Likelihood−386.68−389.44−385.92−389.30−386.21−385.37
F statistic for weak identification7.9114.034.3710.517.215.05
p-value of underidentification LM statistics0.000.000.000.000.000.00
Notes: All regressions are based on model (1) of Table 2; see Table A1 in the Appendix A for the variable definitions; standard errors are in brackets under the coefficients; ***, **, *, + denote statistical significance at the 1%, 5%, 10%, and 15% test level, respectively; in model (1) the measures for breadth, depth, R&D intensity and collaboration refer to green innovation activity, in model (2) to non-green innovation activity.

References

  1. Simon, H.A. Rational choice and the structure of the environment. Psychol. Rev. 1956, 63, 129–138. [Google Scholar] [CrossRef] [Green Version]
  2. Simon, H.A. Entscheidungsverhalten in Organisationen; Verlag Moderne Industrie: Munich, Germany, 1981. [Google Scholar]
  3. Dosi, G. Sources, procedures, and microeconomic effects of innovation. J. Econ. Lit. 1988, 28, 1120–1171. [Google Scholar]
  4. Woerter, M. Industry diversity and its impact on the innovation performance of firms. J. Evol. Econ. 2009, 19, 675–700. [Google Scholar] [CrossRef]
  5. Antonelli, C. Localised Technological Change. Towards the Economics of Complexity; Routledge: New York, NY, USA, 2008. [Google Scholar]
  6. Utterback, J.M. Mastering the Dynamics of Innovation; Harvard Business School Press: Cambridge, MA, USA, 1996. [Google Scholar]
  7. Malerba, F.; Orsenigo, L. Innovation and market structure in the dynamics of the pharmaceutical industry and biotechnology: Towards a history-friendly model. Ind. Corp. Chang. 2002, 11, 667–703. [Google Scholar] [CrossRef]
  8. Grabowski, H.; Vernon, J. Innovation and structural change in pharmaceuticals and biotechnology. Ind. Corp. Chang. 1994, 3, 435–449. [Google Scholar] [CrossRef]
  9. Dijk, M.; Orsato, R.J.; Kemp, R. The emergence of an electric mobility trajectory. Energy Policy 2013, 52, 135–145. [Google Scholar] [CrossRef]
  10. Antonelli, C. (Ed.) Handbook on the Economic Complexity of Technological Change; Edward Elgar Publishing: Cheltenham, UK; Northampton, MA, USA, 2011. [Google Scholar]
  11. Greve, H.R.; Seidel, M.D.L. The thin red line between success and failure: Path dependence in the diffusion of in-novative production technologies. Strateg. Manag. J. 2015, 36, 475–496. [Google Scholar]
  12. Vergne, J.P.; Durand, R. The missing link between the theory and empirics of path dependence: Conceptual clarifi-cation, testability issue, and methodological implications. J. Manag. Stud. 2010, 47, 736–759. [Google Scholar] [CrossRef]
  13. Cohen, W.M.; Levinthal, D.A. Absorptive capacity: A new perspective on learning and innovation. Adm. Sci. Q. 1990, 35, 128–152. [Google Scholar] [CrossRef]
  14. Powell, W.W.; Koput, K.W.; Smith-Doerr, L. Interorganizational collaboration and the locus of innovation: Networks of learning in biotechnology. Adm. Sci. Q. 1996, 41, 116. [Google Scholar] [CrossRef] [Green Version]
  15. Nagarajan, A.; Mitchell, W. Evolutionary diffusion: Internal and external methods used to acquire encompassing, complementary, and incremental technological changes in the lithotripsy industry. Strat. Manag. J. 1998, 19, 1063–1077. [Google Scholar] [CrossRef] [Green Version]
  16. Nicholls-Nixon, C.L.; Woo, C.Y. Technology sourcing and output of established firms in a regime of encompassing technological change. Strat. Manag. J. 2003, 24, 651–666. [Google Scholar] [CrossRef]
  17. Ahuja, G.; Lampert, C.M.; Tandon, V. 1 moving beyond Schumpeter: Management research on the determinants of technological innovation. Acad. Manag. Ann. 2008, 2, 1–98. [Google Scholar] [CrossRef]
  18. Cassiman, B.; Veugelers, R. R&D cooperation and spillovers: Some empirical evidence from Belgium. Am. Econ. Rev. 2002, 92, 1169–1184. [Google Scholar] [CrossRef] [Green Version]
  19. Ranft, A.L.; Lord, M.D. Acquiring new technologies and capabilities: A grounded model of acquisition implementation. Organ. Sci. 2002, 13, 420–441. [Google Scholar] [CrossRef]
  20. Rothaermel, F.T.; Deeds, D.L. Exploration and exploitation alliances in biotechnology: A system of new product development. Strat. Manag. J. 2004, 25, 201–221. [Google Scholar] [CrossRef]
  21. O’Kane, C.; Haar, J.; Mangematin, V.; Daellenbach, U.; Davenport, S. Distilling and renewing science team search through external engagement. Res. Policy 2021, 50, 104261. [Google Scholar] [CrossRef]
  22. Chesbrough, H.W. Open Innovation: The New Imperative for Creating and Profiting from Technology; Harvard Business Press: Cambridge, MA, USA, 2006. [Google Scholar]
  23. Cheng, C.C.J.; Huizingh, E.K.R.E. When is open innovation beneficial? The role of strategic orientation. J. Prod. Innov. Manag. 2014, 31, 1235–1253. [Google Scholar] [CrossRef]
  24. Garriga, H.; von Krogh, G.; Spaeth, S. How constraints and knowledge impact open innovation. Strat. Manag. J. 2013, 34, 1134–1144. [Google Scholar] [CrossRef]
  25. Laursen, K.; Salter, A. Open for innovation: The role of openness in explaining innovation performance among U.K. manufacturing firms. Strat. Manag. J. 2006, 27, 131–150. [Google Scholar] [CrossRef]
  26. Sofka, W.; Grimpe, C. Specialized search and innovation performance-Evidence across Europe. RD Manag. 2010, 40, 310–323. [Google Scholar] [CrossRef]
  27. Cainelli, G.; Mazzanti, M. Environmental innovations in services: Manufacturing–services integration and policy transmissions. Res. Policy 2013, 42, 1595–1604. [Google Scholar] [CrossRef]
  28. Ghisetti, C.; Marzucchi, A.; Montresor, S. The open eco-innovation mode. An empirical investigation of eleven European countries. Res. Policy 2015, 44, 1080–1093. [Google Scholar] [CrossRef]
  29. Horbach, J.; Rammer, C.; Rennings, K. Determinants of eco-innovations by type of environmental impact—The role of regulatory push/pull, technology push and market pull. Ecol. Econ. 2012, 78, 112–122. [Google Scholar] [CrossRef] [Green Version]
  30. IPCC. Climate Change 2014: Synthesis Report. Contribution of Working Groups I, II and III to the Fifth Assessment Report of the Intergovernmental Panel on Climate Change; Core Writing Team, Pauchari, R.K., Meyer, L.A., Eds.; IPCC: Geneva, Switzerland, 2014; p. 151. [Google Scholar]
  31. Economist. Big Carmakers Are Placing Vast Bets on Electric Vehicles. Available online: https://www.economist.com/business/2019/04/17/big-carmakers-are-placing-vast-bets-on-electric-vehicles (accessed on 20 December 2021).
  32. Bogers, M.; Zobel, A.K.; Afuah, A.; Almirall, E.; Brunswicker, S.; Dahlander, L.; Frederiksen, L.; Gawer, A.; Gruber, M.; Haefliger, S.; et al. The open innovation research landscape: Established perspectives and emerging themes across different levels of analysis. Ind. Innov. 2017, 24, 8–40. [Google Scholar] [CrossRef]
  33. Rosenkopf, L.; Nerkar, A. Beyond local search: Boundary-spanning, exploration, and impact in the optical disk industry. Strat. Manag. J. 2001, 22, 287–306. [Google Scholar] [CrossRef]
  34. Snihur, Y.; Wiklund, J. Searching for innovation: Product, process, and business model innovations and search behavior in established firms. Long Range Plan. 2019, 52, 305–325. [Google Scholar] [CrossRef]
  35. Ko, Y.J.; O’Neill, H.; Xie, X. Strategic intent as a contingency of the relationship between external knowledge and firm innovation. Technovation 2021, 104, 102260. [Google Scholar] [CrossRef]
  36. Caloghirou, Y.; Kastelli, I.; Tsakanikas, A. Internal capabilities and external knowledge sources: Complements or substitutes for innovative performance? Technovation 2004, 24, 29–39. [Google Scholar] [CrossRef]
  37. Von Hippel, E. The Sources of Innovation; Oxford University Press: New York, NY, USA, 1988. [Google Scholar]
  38. Leiponen, A.; Helfat, C.E. Innovation objectives, knowledge sources, and the benefits of breadth. Strateg. Manag. J. 2010, 31, 224–236. [Google Scholar] [CrossRef] [Green Version]
  39. Leiponen, A.; Helfat, C.E. Location, decentralization, and knowledge sources for innovation. Organ. Sci. 2011, 22, 641–658. [Google Scholar] [CrossRef]
  40. Koput, K.W. A chaotic model of innovative search: Some answers, many questions. Organ. Sci. 1997, 8, 528–542. [Google Scholar] [CrossRef]
  41. Ocasio, W. Towards an attention-based view of the firm. Strateg. Manag. J. 1997, 18, 187–206. [Google Scholar] [CrossRef]
  42. Simon, H.A. Administrative Behavior: A Study of Decision-Making Process in Administrative Organization; Macmillan: Chicago, IL, USA, 1947. [Google Scholar]
  43. Cohen, W.M.; Levinthal, D. Innovation and learning: The two faces of R & D. Econ. J. 1989, 99, 569. [Google Scholar] [CrossRef]
  44. Arora, A.; Gambardella, A. Evaluating technological information and utilizing it: Scientific knowledge, technological capability, and external linkages in biotechnology. J. Econ. Behav. Organ. 1994, 24, 91–114. [Google Scholar] [CrossRef]
  45. Berchicci, L. Towards an open R&D system: Internal R&D investment, external knowledge acquisition and innovative performance. Res. Policy 2013, 42, 117–127. [Google Scholar] [CrossRef]
  46. Sydow, J.; Schreyögg, G.; Koch, J. Organizational path dependence: Opening the black box. Acad. Manag. Rev. 2009, 34, 689–709. [Google Scholar]
  47. Sydow, J.; Schreyögg, G.; Koch, J. On the theory of organizational path dependence: Clarifications, replies to objections, and extensions. Acad. Manag. Rev. 2020, 45, 717–734. [Google Scholar] [CrossRef]
  48. Arthur, W.B. Competing technologies, increasing returns, and lock-in by historical events. Econ. J. 1989, 99, 116–131. [Google Scholar] [CrossRef]
  49. David, P.A. Clio and the economics of QWERTY. Am. Econ. Rev. 1985, 75, 332–337. [Google Scholar]
  50. Ruttan, V.W. Induced innovation, evolutionary theory and path dependence: Sources of technical change. Econ. J. 1997, 107, 1520–1529. [Google Scholar] [CrossRef]
  51. Helfat, C.E. Evolutionary trajectories in petroleum firm R&D. Manag. Sci. 1994, 40, 1720–1747. [Google Scholar] [CrossRef]
  52. Rothaermel, F.T.; Boeker, W. Old technology meets new technology: Complementarities, similarities, and alliance formation. Strat. Manag. J. 2008, 29, 47–77. [Google Scholar] [CrossRef] [Green Version]
  53. Bourreau, M.; Cambini, C.; Doğan, P. Access pricing, competition, and incentives to migrate from “old” to “new” technology. Int. J. Ind. Org. 2012, 30, 713–723. [Google Scholar] [CrossRef] [Green Version]
  54. Dosi, G. Technological paradigms and technological trajectories: A suggested interpretation of the determinants and directions of technical change. Res. Policy 1982, 11, 147–162. [Google Scholar] [CrossRef]
  55. Anderson, P.; Tushman, M.L. Technological discontinuities and dominant designs: A cyclical model of technological change. Adm. Sci. Q. 1990, 35, 604. [Google Scholar] [CrossRef] [Green Version]
  56. Henderson, R.M.; Clark, K.B. Architectural innovation: The reconfiguration of existing product technologies and the failure of established firms. Adm. Sci. Q. 1990, 35, 9–30. [Google Scholar] [CrossRef] [Green Version]
  57. Stokes, R.G. Opting for Oil: The Political Economy of Technological Change in the West German Industry, 1945–1961; Cambridge University Press: Cambridge, MA, USA, 2006. [Google Scholar]
  58. Schreyögg, G.; Sydow, J. Organizational path dependence: A process view. Organ. Stud. 2011, 32, 321–335. [Google Scholar] [CrossRef] [Green Version]
  59. Wu, B.; Wan, Z.; Levinthal, D.A. Complementary assets as pipes and prisms: Innovation incentives and trajectory choices. Strat. Manag. J. 2014, 35, 1257–1278. [Google Scholar] [CrossRef] [Green Version]
  60. Arthur, W.B. Increasing Returns and Path Dependence in the Economy; University of Michigan Press: Ann Arbor, MI, USA, 1994. [Google Scholar]
  61. Maréchal, K. The economics of climate change and the change of climate in economics. Energy Policy 2007, 35, 5181–5194. [Google Scholar] [CrossRef]
  62. Foray, D. The dynamic implications of increasing returns: Technological change and path dependent inefficiency. Int. J. Ind. Organ. 1997, 15, 733–752. [Google Scholar] [CrossRef]
  63. Gómez, J.; Salazar, I.; Vargas, P. Sources of information as determinants of product and process innovation. PLoS ONE 2016, 11, e0152743. [Google Scholar] [CrossRef] [PubMed]
  64. Gómez, J.; Salazar, I.; Vargas, P. Does information technology improve open innovation performance? An Exami-nation of Manufacturers in Spain. Inform. Syst. Res. 2017, 28, 661–675. [Google Scholar] [CrossRef]
  65. Foss, N.J.; Lyngsie, J.; Zahra, S.A. The role of external knowledge sources and organizational design in the process of opportunity exploitation. Strat. Manag. J. 2013, 34, 1453–1471. [Google Scholar] [CrossRef] [Green Version]
  66. Foss, N.J.; Laursen, K.; Pedersen, T. Linking customer interaction and innovation: The mediating role of new or-ganizational practices. Organ. Sci. 2011, 22, 980–999. [Google Scholar] [CrossRef] [Green Version]
  67. Baldwin, C.; Von Hippel, E.A. Modeling a paradigm shift: From producer innovation to user and open collaborative innovation. Organ. Sci. 2011, 22, 1399–1417. [Google Scholar] [CrossRef] [Green Version]
  68. Chesbrough, H.W. The era of open innovation. MIT Sloan Manag. Rev. 2003, 44, 35–41. [Google Scholar]
  69. Rigby, D.; Zook, C. Open-market innovation. Harv. Bus. Rev. 2002, 80, 80–93. [Google Scholar]
  70. Corredoira, R.A.; Rosenkopf, L. Should auld acquaintance be forgot? the reverse transfer of knowledge through mobility ties. Strat. Manag. J. 2010, 31, 159–181. [Google Scholar] [CrossRef] [Green Version]
  71. Kaiser, U.; Kongsted, H.C.; Rønde, T. Does the mobility of R&D labor increase innovation? J. Econ. Behav. Organ. 2015, 110, 91–105. [Google Scholar] [CrossRef] [Green Version]
  72. Kaiser, U.; Kongsted, H.C.; Laursen, K.; Ejsing, A.-K. Experience matters: The role of academic scientist mobility for industrial innovation. Strat. Manag. J. 2018, 39, 1935–1958. [Google Scholar] [CrossRef]
  73. Singh, J.; Agrawal, A. Recruiting for ideas: How firms exploit the prior inventions of new hires. Manag. Sci. 2011, 57, 129–150. [Google Scholar] [CrossRef]
  74. Song, J.; Almeida, P.; Wu, G. Learning–by–hiring: When is mobility more likely to facilitate interfirm knowledge transfer? Manag. Sci. 2003, 49, 351–365. [Google Scholar] [CrossRef]
  75. Aghion, P.; Dechezleprêtre, A.; Hemous, D.; Martin, R.; Van Reenen, J. Carbon taxes, path dependency, and directed technical change: Evidence from the auto industry. J. Political Econ. 2016, 124, 1–51. [Google Scholar] [CrossRef] [Green Version]
  76. Stucki, T.; Woerter, M. Green inventions: Is wait-and-see a reasonable option? Energy J. 2017, 38. [Google Scholar] [CrossRef]
  77. Soltmann, C.; Stucki, T.; Woerter, M. The impact of environmentally friendly innovations on value added. Environ. Resour. Econ. 2015, 62, 457–479. [Google Scholar] [CrossRef]
  78. Stucki, T.; Woerter, M.; Arvanitis, S.; Peneder, M.; Rammer, C. How different policy instruments affect green product innovation: A differentiated perspective. Energy Policy 2018, 114, 245–261. [Google Scholar] [CrossRef]
  79. Stucki, T. What hampers green product innovation: The effect of experience. Ind. Innov. 2019, 26, 1242–1270. [Google Scholar] [CrossRef]
  80. Consoli, D.; Marin, G.; Marzucchi, A.; Vona, F. Do green jobs differ from non-green jobs in terms of skills and human capital? Res. Policy 2016, 45, 1046–1060. [Google Scholar] [CrossRef] [Green Version]
  81. Noci, G.; Verganti, R. Managing ‘green’ product innovation in small firms. R&D Manag. 1999, 29, 3–15. [Google Scholar]
  82. Danneels, E. The dynamics of product innovation and firm competences. Strat. Manag. J. 2002, 23, 1095–1121. [Google Scholar] [CrossRef]
  83. Singh, S.K.; Del Giudice, M.; Chierici, R.; Graziano, D. Green innovation and environmental performance: The role of green transformational leadership and green human resource management. Technol. Forecast. Soc. Chang. 2020, 150, 119762. [Google Scholar] [CrossRef]
  84. Spörri, A.; Stucki, T.; Zweidler, R.; von Felten, N.; Perch-Nielsen, S.; Kissling, I.; Frecè, J. Die Hürden gegen Ressourceneffizienz und Kreislaufwirtschaft abbauen. Studie zum gleichnamigen Postulat 18.3509 von Ständerat Ruedi Noser. In Schlussbericht im Auftrag des Bundesamts für Umwelt; EBP Schweiz AG, Berner Fachhochschule: Bern, Switzerland, 2022. [Google Scholar]
  85. Economist. Volts Wagons-Electric Cars Are Set to Arrive Far More Speedily than Anticipated. Available online: https://www.economist.com/business/2017/02/18/electric-cars-are-set-to-arrive-far-more-speedily-than-anticipated (accessed on 20 December 2021).
  86. Urban, G.L.; von Hippel, E. Lead user analyses for the development of new industrial products. Manag. Sci. 1988, 34, 569–582. [Google Scholar] [CrossRef] [Green Version]
  87. Pullen, A.J.J.; de Weerd-Nederhof, P.C.; Groen, A.J.; Fisscher, O.A.M. Open innovation in practice: Goal complementarity and closed npd networks to explain differences in innovation performance for smes in the medical devices sector. J. Prod. Innov. Manag. 2012, 29, 917–934. [Google Scholar] [CrossRef]
  88. Laursen, K.; Salter, A. The paradox of openness: Appropriability, external search and collaboration. Res. Policy 2014, 43, 867–878. [Google Scholar] [CrossRef] [Green Version]
  89. Remneland-Wikhamn, B. Path dependence as a barrier for ‘soft’and ‘open’innovation. Int. J. Bus. Innov. Res. 2011, 5, 714–730. [Google Scholar] [CrossRef]
  90. Cainelli, G.; De Marchi, V.; Grandinetti, R. Does the development of environmental innovation require different resources? Evidence from Spanish manufacturing firms. J. Clean. Prod. 2015, 94, 211–220. [Google Scholar] [CrossRef]
  91. Marzucchi, A.; Montresor, S. Forms of knowledge and eco-innovation modes: Evidence from Spanish manufacturing firms. Ecol. Econ. 2017, 131, 208–221. [Google Scholar] [CrossRef]
  92. Barbieri, N.; Marzucchi, A.; Rizzo, U. Knowledge sources and impacts on subsequent inventions: Do green tech-nologies differ from non-green ones? Res. Policy 2020, 49, 103901. [Google Scholar] [CrossRef]
  93. Horbach, J. Determinants of environmental innovation—New evidence from German panel data sources. Res. Policy 2008, 37, 163–173. [Google Scholar] [CrossRef] [Green Version]
Figure 1. Different technological paths and external knowledge sources.
Sustainability 14 00957 g001
Figure 2. Relevance of different external knowledge sources by type of innovation.
Sustainability 14 00957 g002
Table 1. Comparison of the results with existing studies.
This StudyGhisetti et al. (2015)Laursen and Salter (2006)
Green innovation:
Breadth++n/a
Breadth # breadthinverted U-shapedinverted U-shaped/linearn/a
Breadth # R&D(+)+/(−)n/a
Depth++n/a
Depth # depthlinearlinear/U-shapedn/a
Depth # R&D+n/a
Non-green innovation:
Breadth+n/a+
Breadth # breadthinverted U-shapedn/ainverted U-shaped
Breadth # R&D(−)/−n/a
Depth(+)/+n/a+
Depth # depthinverted U-shapedn/ainverted U-shaped
Depth # R&Dn/a
Notes: +, −, () denote statistical significant positive, negative, and insignificant coefficients (at the 10% test level).
Table 2. External search within the traditional technological path; Tobit regressions.
(1)(2)(3)(4)(5)(6)(7)(8)(9)
Non-Green Innovative Performance
Non-green breadth0.173 ** 0.163 ***0.637 ***0.628 ***0.565 ***0.219 ***0.163 ***0.189 ***
(0.060) (0.060)(0.218)(0.218)(0.218)(0.064)(0.060)(0.065)
Non-green depth0.1150.861 ***0.748 *** 0.1230.703 ***0.1300.311 **0.290 **
(0.106)(0.264)(0.266) (0.106)(0.266)(0.106)(0.125)(0.127)
Non-green depth # non-green depth −0.272 ***−0.254 *** −0.233 **
(0.098)(0.098) (0.098)
Non-green breadth # non-green breadth −0.062 **−0.063 **−0.056 *
(0.029)(0.029)(0.029)
Non-green breadth # non-green R&D intensity −0.158 ** −0.085
(0.077) (0.084)
Non-green depth # R&D intensity −0.294 ***−0.251 **
(0.101)(0.110)
Non-green R&D intensity0.604 ***0.625 ***0.624 ***0.614 ***0.604 ***0.623 ***1.335 ***0.898 ***1.247 ***
(0.154)(0.155)(0.154)(0.154)(0.154)(0.154)(0.389)(0.185)(0.391)
Non-green collaboration0.730 ***0.748 ***0.686 ***0.764 ***0.753 ***0.709 ***0.764 ***0.718 ***0.738 ***
(0.254)(0.254)(0.253)(0.254)(0.254)(0.253)(0.254)(0.253)(0.253)
Export intensity0.123 **0.130 **0.121 **0.119 **0.114 *0.113 *0.129 **0.114 *0.118 **
(0.060)(0.060)(0.060)(0.060)(0.060)(0.060)(0.060)(0.060)(0.060)
Share of high qualified employees0.172 *0.204 **0.173 *0.160 +0.163 +0.165 *0.168 *0.179 *0.176 *
(0.099)(0.099)(0.099)(0.100)(0.099)(0.099)(0.099)(0.099)(0.099)
Firm age−0.136−0.126−0.138−0.142−0.134−0.136−0.136−0.144−0.142
(0.122)(0.122)(0.122)(0.122)(0.122)(0.122)(0.122)(0.122)(0.122)
Competition intensity−0.060−0.042−0.051−0.060−0.062−0.053−0.063−0.053−0.056
(0.070)(0.070)(0.070)(0.070)(0.070)(0.070)(0.070)(0.070)(0.070)
Firm size0.102 +0.141 **0.110 +0.120 *0.109 +0.116 *0.114 +0.120*0.124 *
(0.070)(0.069)(0.070)(0.070)(0.070)(0.070)(0.070)(0.070)(0.070)
Country controlsnonononononononono
Industry controlsyesyesyesyesyesyesyesyesyes
N967967967967967967967967967
Wald chi2297.31 ***296.67 ***304.09 ***300.82 ***302.17 ***307.84 ***301.51 ***305.73 ***306.75 ***
Log Likelihood−1513.16−1513.49−1509.78−1511.41−1510.74−1507.90−1511.07−1508.96−1508.44
Notes: See Table A1 in the Appendix A for the variable definitions; standard errors are in brackets under the coefficients; ***, **, *, + denote statistical significance at the 1%, 5%, 10%, and 15% test level, respectively; in this model, the measures for breadth, depth, R&D intensity, and collaboration refer to green innovation activity.
Table 3. External search within a new technological path; Tobit regressions.
(1)(2)(3)(4)(5)(6)(7)(8)(9)
Green Innovative Performance
Green breadth0.183 *** 0.181 ***0.786 ***0.645 **0.642 **0.144 **0.184 ***0.157 **
(0.066) (0.066)(0.300)(0.302)(0.302)(0.073)(0.065)(0.072)
Green depth0.313 ***0.021−0.015 0.281 **−0.0440.315 ***0.1700.178
(0.117)(0.313)(0.309) (0.118)(0.308)(0.117)(0.126)(0.126)
Green depth # green depth 0.1470.141 0.140
(0.125)(0.123) (0.122)
Green breadth # green breadth −0.075 **−0.060 +−0.060 +
(0.038)(0.038)(0.038)
Green breadth # green R&D intensity 0.103 0.071
(0.084) (0.084)
Green depth # green R&D intensity 0.488 ***0.466 ***
(0.175)(0.177)
Green R&D intensity0.542 ***0.595 ***0.567 ***0.614 ***0.567 ***0.591 ***0.062−0.033−0.338
(0.137)(0.140)(0.138)(0.137)(0.137)(0.138)(0.419)(0.247)(0.441)
Green collaboration−0.178−0.147−0.199−0.205−0.187−0.209−0.153−0.106−0.093
(0.210)(0.213)(0.211)(0.212)(0.210)(0.210)(0.211)(0.208)(0.209)
Export intensity0.0210.0480.0230.0180.0220.0250.0290.0370.041
(0.069)(0.070)(0.069)(0.070)(0.069)(0.069)(0.070)(0.069)(0.069)
Share of high qualified employees0.1120.1040.1280.0690.0790.0940.1130.1190.119
(0.117)(0.119)(0.118)(0.120)(0.118)(0.119)(0.117)(0.115)(0.115)
Firm age0.1430.1390.1470.1790.1770.1810.1480.1580.161
(0.146)(0.148)(0.146)(0.149)(0.147)(0.147)(0.146)(0.143)(0.143)
Competition intensity0.114 +0.125 +0.1030.133 *0.122 +0.112 +0.110 +0.1040.101
(0.075)(0.076)(0.075)(0.076)(0.075)(0.075)(0.075)(0.074)(0.074)
Firm size−0.159 **−0.126 *−0.157 **−0.150 **−0.154 **−0.152 **−0.170 **−0.165 **−0.172 ***
(0.066)(0.066)(0.066)(0.067)(0.066)(0.066)(0.067)(0.065)(0.066)
Country controlsyesyesyesyesyesyesyesyesyes
Industry controlsyesyesyesyesyesyesyesyesyes
N259259259259259259259259259
Wald chi2123.04 ***116.81 ***124.36 ***119.94 ***125.56 ***126.86 ***124.60 ***130.74 ***131.48 ***
Log Likelihood−383.45−386.57−382.79−385.00−382.19−381.54−382.68−379.60−379.24
Notes: See Table A1 in the Appendix A for the variable definitions; standard errors are in brackets under the coefficients; ***, **, *, + denote statistical significance at the 1%, 5%, 10%, and 15% test level, respectively; in this model, the measures for breadth, depth, R&D intensity, and collaboration refer to green innovation activity.
Table 4. Complementarity with green and non-green R&D, respectively; Tobit regressions.
(1)(2)(3)
Green Innovative Performance
Green breadth0.1240.171 ***0.127
(0.089)(0.066)(0.089)
Green depth0.373 ***0.249 +0.269 +
(0.119)(0.170)(0.172)
Green breadth # non-green R&D intensity0.026 0.045
(0.072) (0.075)
Green depth # non-green R&D intensity −0.010−0.031
(0.106)(0.112)
Green breadth # green R&D intensity0.060 0.011
(0.098) (0.100)
Green depth # green R&D intensity 0.449 **0.445 **
(0.181)(0.185)
Non-green R&D intensity−0.417−0.249 +−0.419
(0.338)(0.153)(0.332)
Green R&D intensity0.250−0.035−0.075
(0.475)(0.268)(0.489)
Green collaboration−0.143−0.095−0.076
(0.215)(0.213)(0.215)
Export intensity0.0400.0480.045
(0.074)(0.072)(0.073)
Share of high qualified employees0.204 *0.206 *0.206 *
(0.121)(0.120)(0.120)
Firm age0.1080.1250.111
(0.147)(0.144)(0.146)
Competition intensity0.0930.0920.097
(0.077)(0.076)(0.077)
Firm size−0.176 ***−0.173 ***−0.174 ***
(0.068)(0.066)(0.067)
Country controlsyesyesyes
Industry controlsyesyesyes
N251251251
Wald chi2119.76 ***124.95 ***125.51 ***
Log Likelihood−368.86−366.26−365.98
Notes: See Table A1 in the Appendix A for the variable definitions; standard errors are in brackets under the coefficients; ***, **, *, + denote statistical significance at the 1%, 5%, 10%, and 15% test level, respectively; in this model, the measures for breadth, depth, and collaboration refer to green innovation activity.
Table 5. Testing complementarity with non-green R&D by intensity; Tobit regressions.
(1)(2)(3)(4)(5)(6)
Sample:Little Non-Green R&D ActivityMuch Non-Green R&D Activity
Green Innovative Performance
Non-green breadth0.314 ***0.163 +0.305 ***−0.346 +0.135 +−0.211
(0.118)(0.099)(0.115)(0.225)(0.092)(0.226)
Non-green depth0.451 **0.664 ***0.608 ***0.314 *−0.424−0.237
(0.187)(0.225)(0.222)(0.170)(0.410)(0.416)
Non-green breadth # non-green R&D intensity−0.910 * −1.000 **0.264 * 0.183
(0.503) (0.495)(0.143) (0.143)
Non-green depth # non-green R&D intensity −1.769 **−1.919 ** 0.268 +0.174
(0.804)(0.821) (0.180)(0.186)
Non-green breadth # green R&D intensity−0.072 −0.1240.031 0.067
(0.218) (0.214)(0.148) (0.143)
Non-green depth # green R&D intensity 0.595 *0.695 ** 0.624 ***0.575 **
(0.327)(0.325) (0.238)(0.236)
Non-green R&D intensity3.854 *0.8015.245 **−1.642 **−0.684 **−1.405 **
(2.303)(0.874)(2.346)(0.670)(0.268)(0.643)
Green R&D intensity0.644−0.2690.3310.565−0.054−0.269
(1.043)(0.439)(1.030)(0.673)(0.326)(0.729)
Non-green collaboration−0.024−0.0710.0510.1880.1250.213
(0.337)(0.336)(0.336)(0.301)(0.297)(0.296)
Export intensity0.0360.1190.1090.0870.0960.082
(0.109)(0.112)(0.110)(0.098)(0.094)(0.096)
Share of high qualified employees0.260 +0.296 *0.342 **0.2230.2360.241
(0.171)(0.172)(0.169)(0.180)(0.179)(0.176)
Firm age−0.241−0.223−0.2580.535 **0.573 ***0.550 ***
(0.212)(0.210)(0.207)(0.211)(0.209)(0.206)
Competition intensity−0.086−0.060−0.0790.303 ***0.284 ***0.277 **
(0.110)(0.109)(0.107)(0.110)(0.104)(0.108)
Firm size−0.119−0.136−0.122−0.303 ***−0.271 ***−0.290 ***
(0.115)(0.114)(0.112)(0.082)(0.078)(0.080)
Country controlsyesyesyesyesyesyes
Industry controlsyesyesyesyesyesyes
N126126126125125125
Wald chi276.28 ***78.78 ***84.39 ***80.91 ***83.08 ***87.50 ***
Log Likelihood−178.71−177.46−174.66−170.79−169.71−167.50
Notes: See Table A1 in the Appendix A for the variable definitions; standard errors are in brackets under the coefficients; ***, **, *, + denote statistical significance at the 1%, 5%, 10%, and 15% test level, respectively; in this model, the measures for breadth, depth, and collaboration refer to green innovation activity; to split the sample we used the median firm’s non-green R&D intensity, which is 1.01%.
Publisher’s Note: MDPI stays neutral with regard to jurisdictional claims in published maps and institutional affiliations.

