Review

A Review on the CO2 Emission Reduction Scheme and Countermeasures in China’s Energy and Power Industry under the Background of Carbon Peak

1
School of Economics and Management, China University of Mining and Technology, Xuzhou 221116, China
2
Scotland Academy, Wuxi Taihu University, Wuxi 214063, China
3
State Environmental Protection Key Laboratory of Atmospheric Physical Modeling and Pollution Control, China Energy Science and Technology Research Institute Co., Ltd., Nanjing 210023, China
4
Collaborative Innovation Center of Atmospheric Environment and Equipment Technology, Nanjing University of Information Science & Technology, Nanjing 210044, China
*
Author to whom correspondence should be addressed.
Sustainability 2022, 14(2), 879; https://doi.org/10.3390/su14020879
Submission received: 24 November 2021 / Revised: 4 January 2022 / Accepted: 6 January 2022 / Published: 13 January 2022
(This article belongs to the Special Issue Regional Carbon Dioxide Emission Market)

Abstract

:
To reach the peak of carbon emission in China, the energy and power industry has the most arduous task and the heaviest responsibility. It should not only ensure efficient economic development, but also complete the arduous task of energy conservation and emission reduction. It is the main force in helping reach the peak of carbon emission. Taking the achievement of carbon peak in China’s power industry as the research object, this paper utilizes time series analyses to establish CO2 emission prediction models for China and its power industry under two scenarios: with and without a carbon peak target. The paper analyzes the current status of achieving carbon peak in China’s power industry and puts a forward CO2 emission reduction scheme for China and its power industry in the future. On this basis, countermeasures for China’s power industry to deal with carbon peak are explored.

1. Introduction

As the world’s largest energy consumer and greenhouse gas emitter, China has been actively participating in the global response to climate change. In 2017, its carbon emission amounted to 9.258 billion tons, accounting for 28.19% of the world’s total carbon emission [1]. China’s CO2 emission reduction plays a vital role in global carbon peak and carbon neutrality. Therefore, it is important to explore ways for China to achieve net-zero carbon emission by the middle of the 21st century. While coping with climate change has become the biggest challenge for China to achieve modernization, it has also become the biggest opportunity for China to achieve green industrialization, urbanization and agricultural and rural modernization.
In September 2020, the Chinese government announced that China will strive to reach its peak in carbon emissions by 2030 and carbon neutrality by 2060, demonstrating China’s commitment to flight global climate change as a responsible member of the global community [2].
As a cornerstone of China’s economic development, it should not only reduce its own carbon emission, but also help optimize the energy structure [3,4] in China. The carbon reduction path in China’s energy sector mainly includes energy conservation and development of non-fossil energy. Given electricity is an important form of energy conversion, the power industry needs to promote use of low-carbon fossil fuels and clean energy [5,6]. At the technical level, it is necessary to improve total factor productivity and the energy efficiency of generator sets; to further advance carbon capture, storage and secondary utilization technologies; to adopt multi energy complementary coupling technology; to actively develop distributed energy technology, terminal power substitution, and hydrogen energy; and to reduce energy consumption through digitization, regional chain and the Smart grid [7,8].
Since September 2020, carbon peak and carbon neutrality have become hot issues in China. There are many relevant studies, but they mainly focus on the qualitative description of the path, ideas and measures to achieve carbon peak and carbon neutrality [9,10]. There are few quantitative studies on the power industry. Based on the historical data published in the Yearbook of China Statistics and the Yearbook of China Electricity Council, this study quantitatively predicts the development trend of China’s total CO2 emissions, power generation of China’s power industry and total CO2 emissions of China’s power industry in the process of pursuing carbon peak. Also, the study puts forward the CO2 emission reduction scheme for China and its power industry in the following years. Based on the above analyses, the countermeasures of China’s power industry to deal with the carbon peak goal are explored.

2. National Requirements and Current Situation for Power Industry Facing Carbon Peak

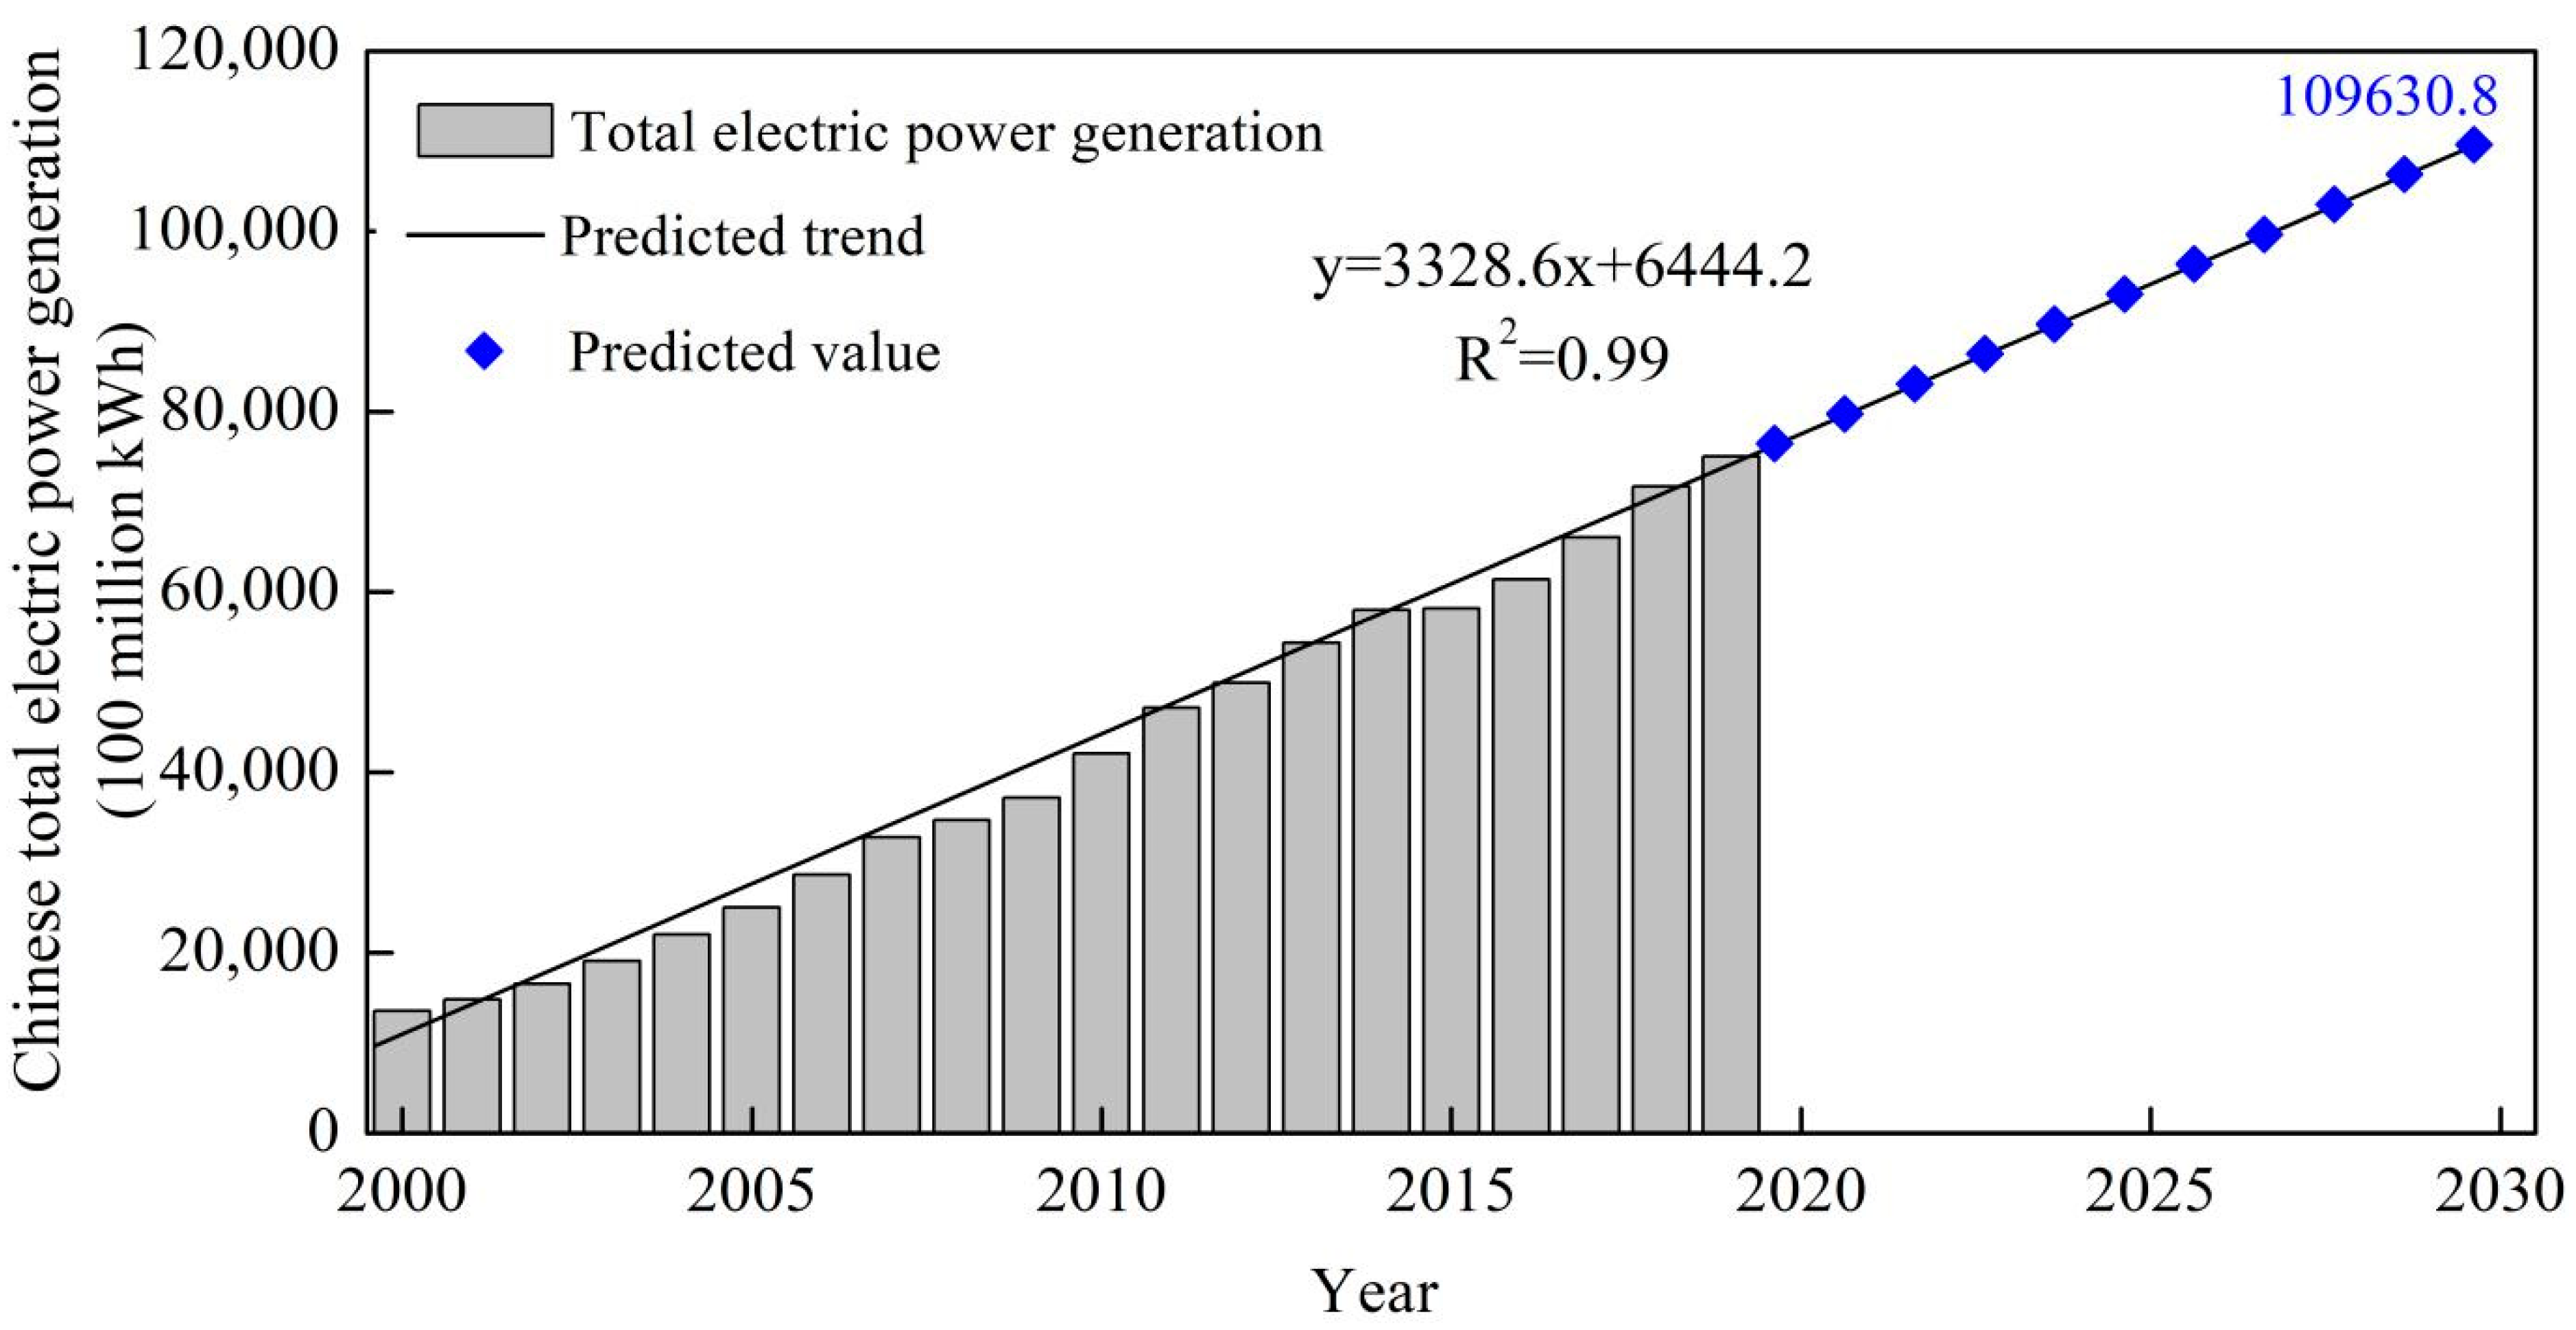
2.1. Current Situation for China’s Power Industry

The process of carbon peak in developed countries is generally a natural process of economic and social development. The industrialization, urbanization process, and the economic transformation of the world’s major developed countries were completed earlier than those of other countries. Therefore, carbon peak was also achieved earlier. For example, Britain achieved carbon peak in 1973, France, Germany and Sweden achieved carbon peak in 1978, and the United States achieved carbon peak in 2007. United States, Canada and Australia are the biggest emitters with a peak emission per capita of about 20 tons. Germany, Britain, Belgium and a few other countries have a peak per capita emission of 10–15 tons. These countries are pioneers in emission reduction and were able to balance economic development and emission reduction. With per capita emission below 10 tons, countries such as Italy and Spain have even lower emissions than Britain and Germany because their economies are less developed. All these countries have already completed industrialization and have entered the information age. Their economic growth does not depend on the growth of energy consumption anymore. The installed capacity or power generation has been at a relatively stable level for many years [9].
In November 2019, the EU issued The European Green Agreement, aiming to reduce emissions by 55% by 2030 compared with 1990 levels and achieve the goal of carbon neutrality by 2050. In 2018, California proposed that 60% of electricity will come from renewable energy by 2030 and only “carbon free energy” will be used for power generation by 2045. Since many developed countries have already reached their carbon peak, China is under pressure to achieve its own carbon peak. While China needs to continue to grow its economy, it also needs to implement carbon emission reduction measures and achieve carbon peak and carbon neutralization, especially in the energy industry.
Compared with developed countries in the world, China has not yet completed industrialization, and the growth of GDP still depends on the growth of energy consumption. Therefore, while China’s power industry have to reduce CO2 emissions, it also needs to meet the increasing demand for electricity. However, the study points out that the reduction of carbon emissions is directly proportional to the reduction of GDP, that is, the more carbon emissions are reduced, the greater the reduction of GDP [11]. Achieving carbon peak and carbon neutralization requires broad and profound economic and social changes. China’s efforts to achieve carbon peak by 2030 and carbon neutralization by 2060 are a major strategic decision made by the Chinese government after careful consideration and are key to the sustainable development of China and the world.
According to the statistics of the International Energy Agency in 2017, the carbon emission of the global power industry was 13.451 billion tons, accounting for 40.59% of the total global carbon emission. The carbon emission of China’s power industry was 4.558 billion tons, accounting for 49.23% of China’s total carbon emission. It accounts for 33.88% of carbon emissions of the global power industry and 13.87% of the total global carbon emissions. China’s power industry is less efficient and accounts for a disproportionate amount of emissions in China, and it therefore should take greater responsibility for carbon reduction [1].

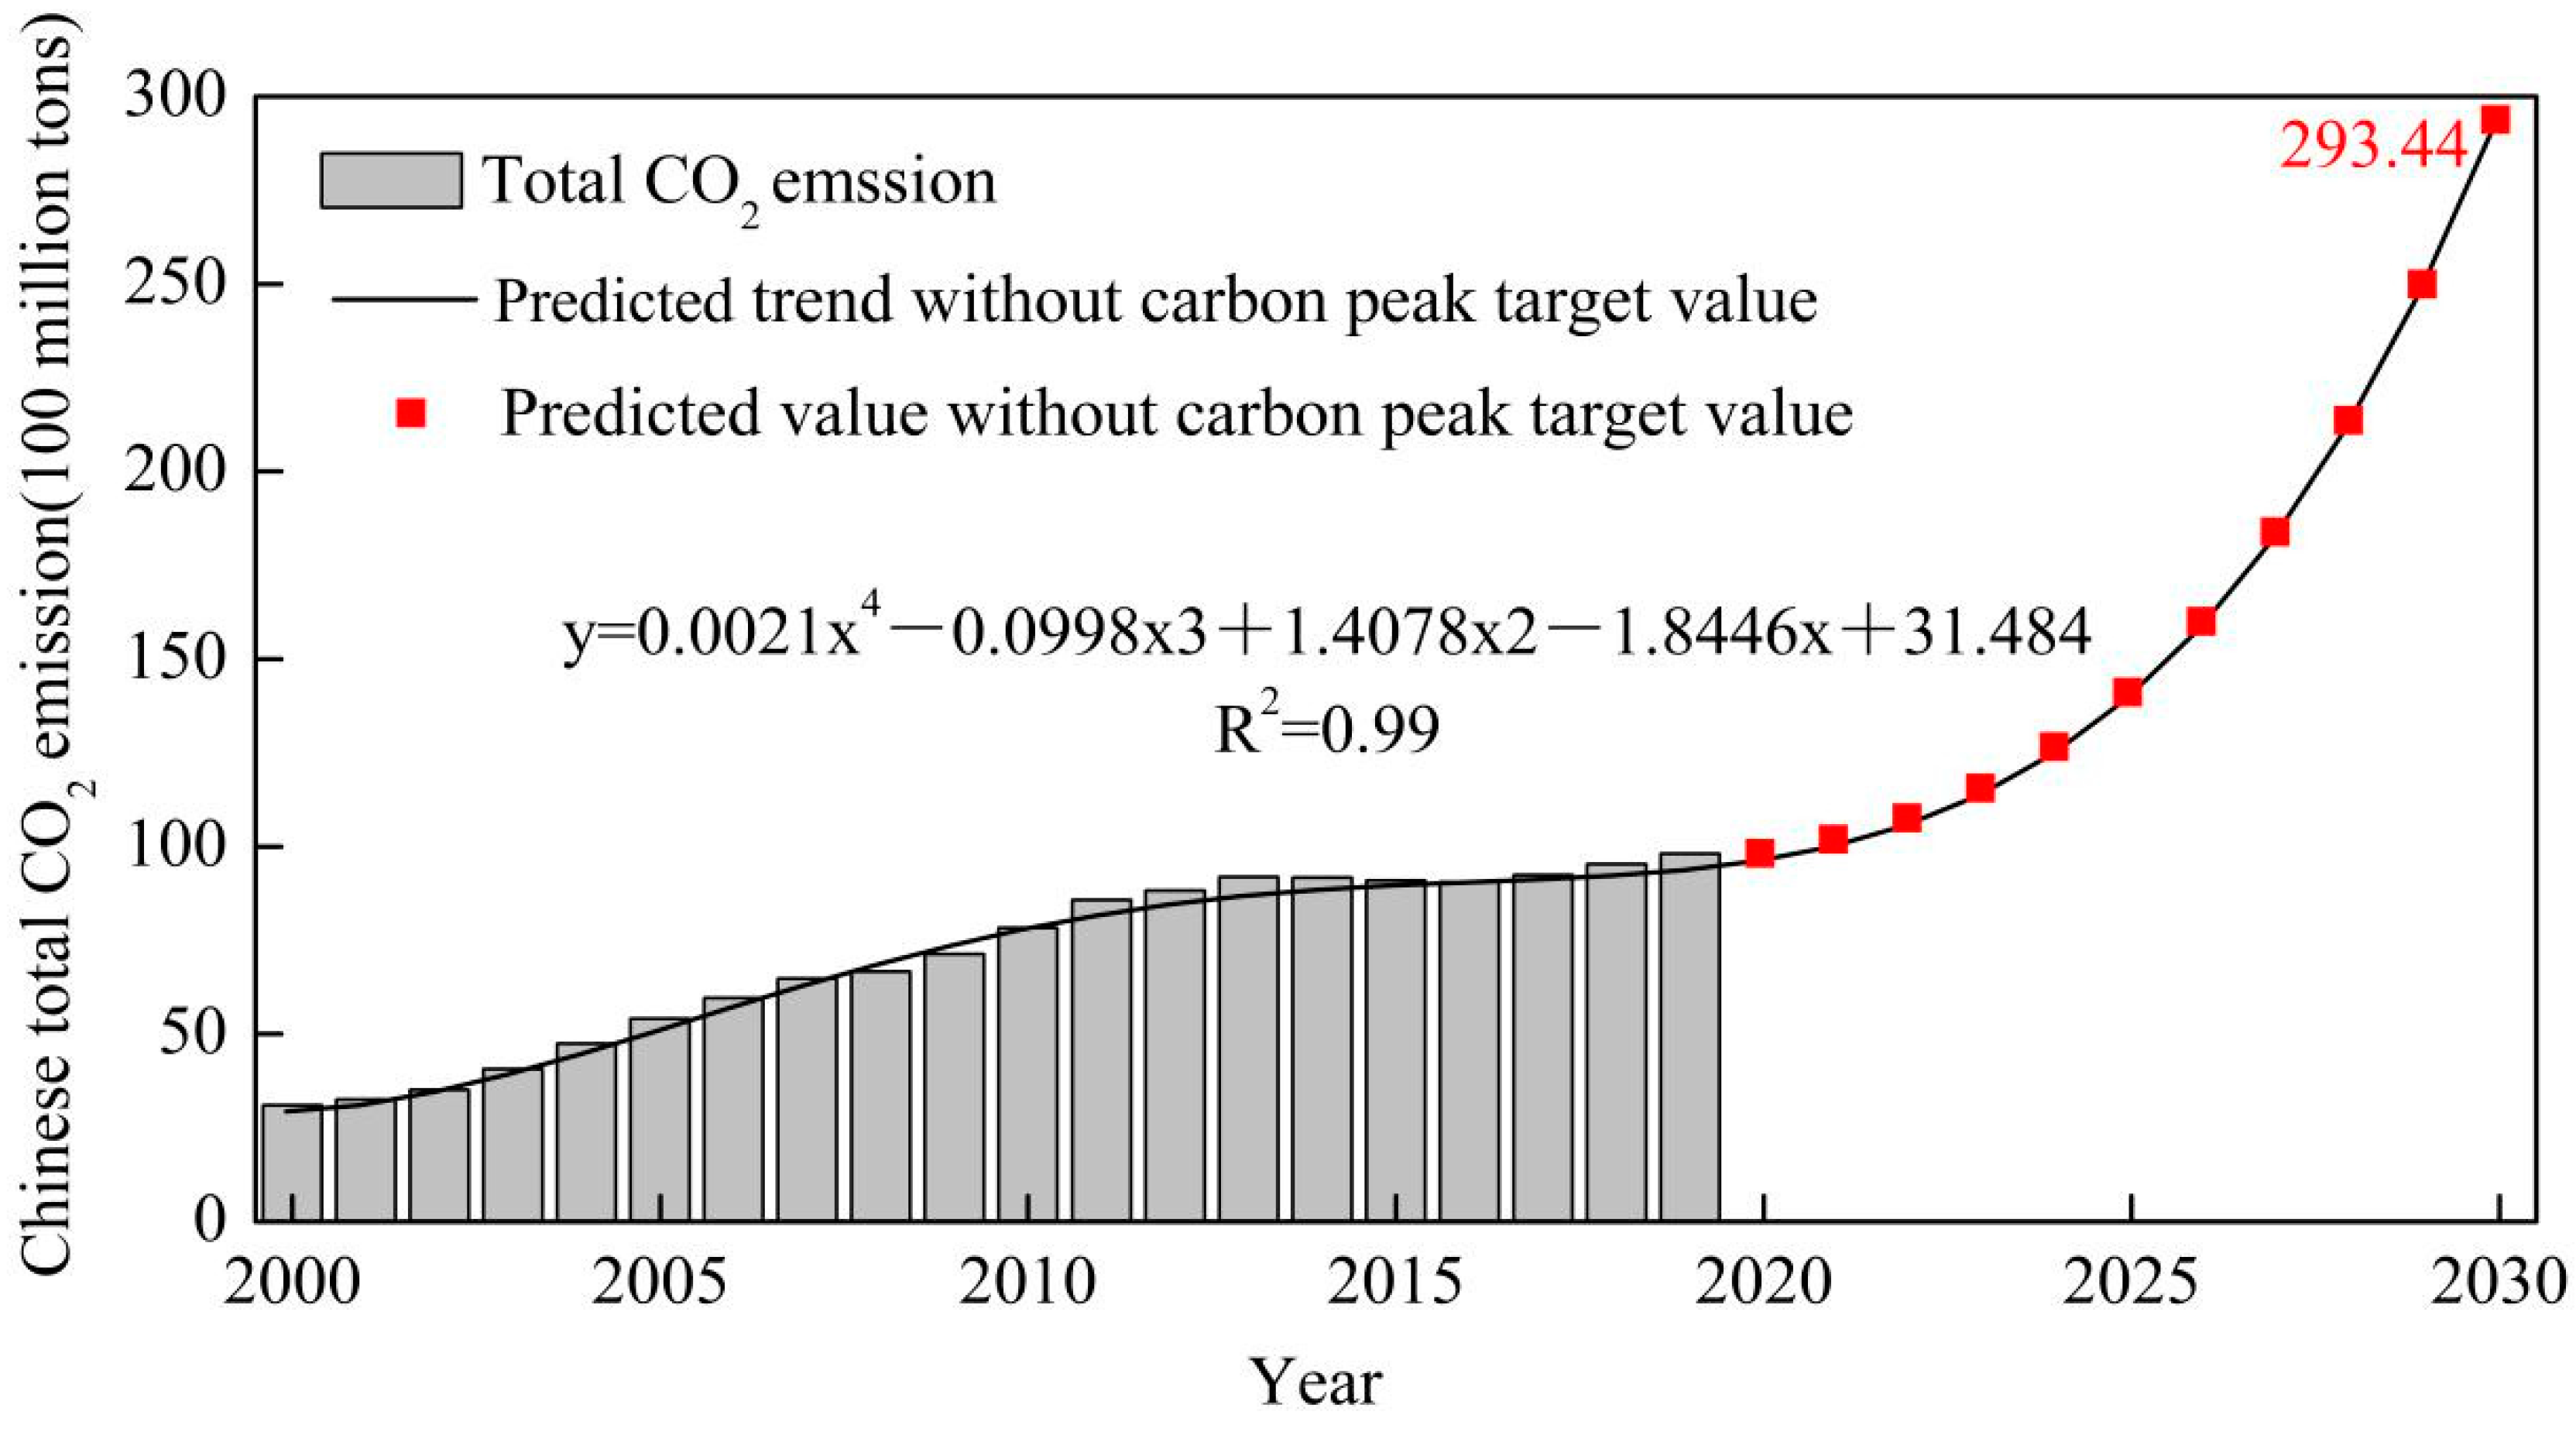
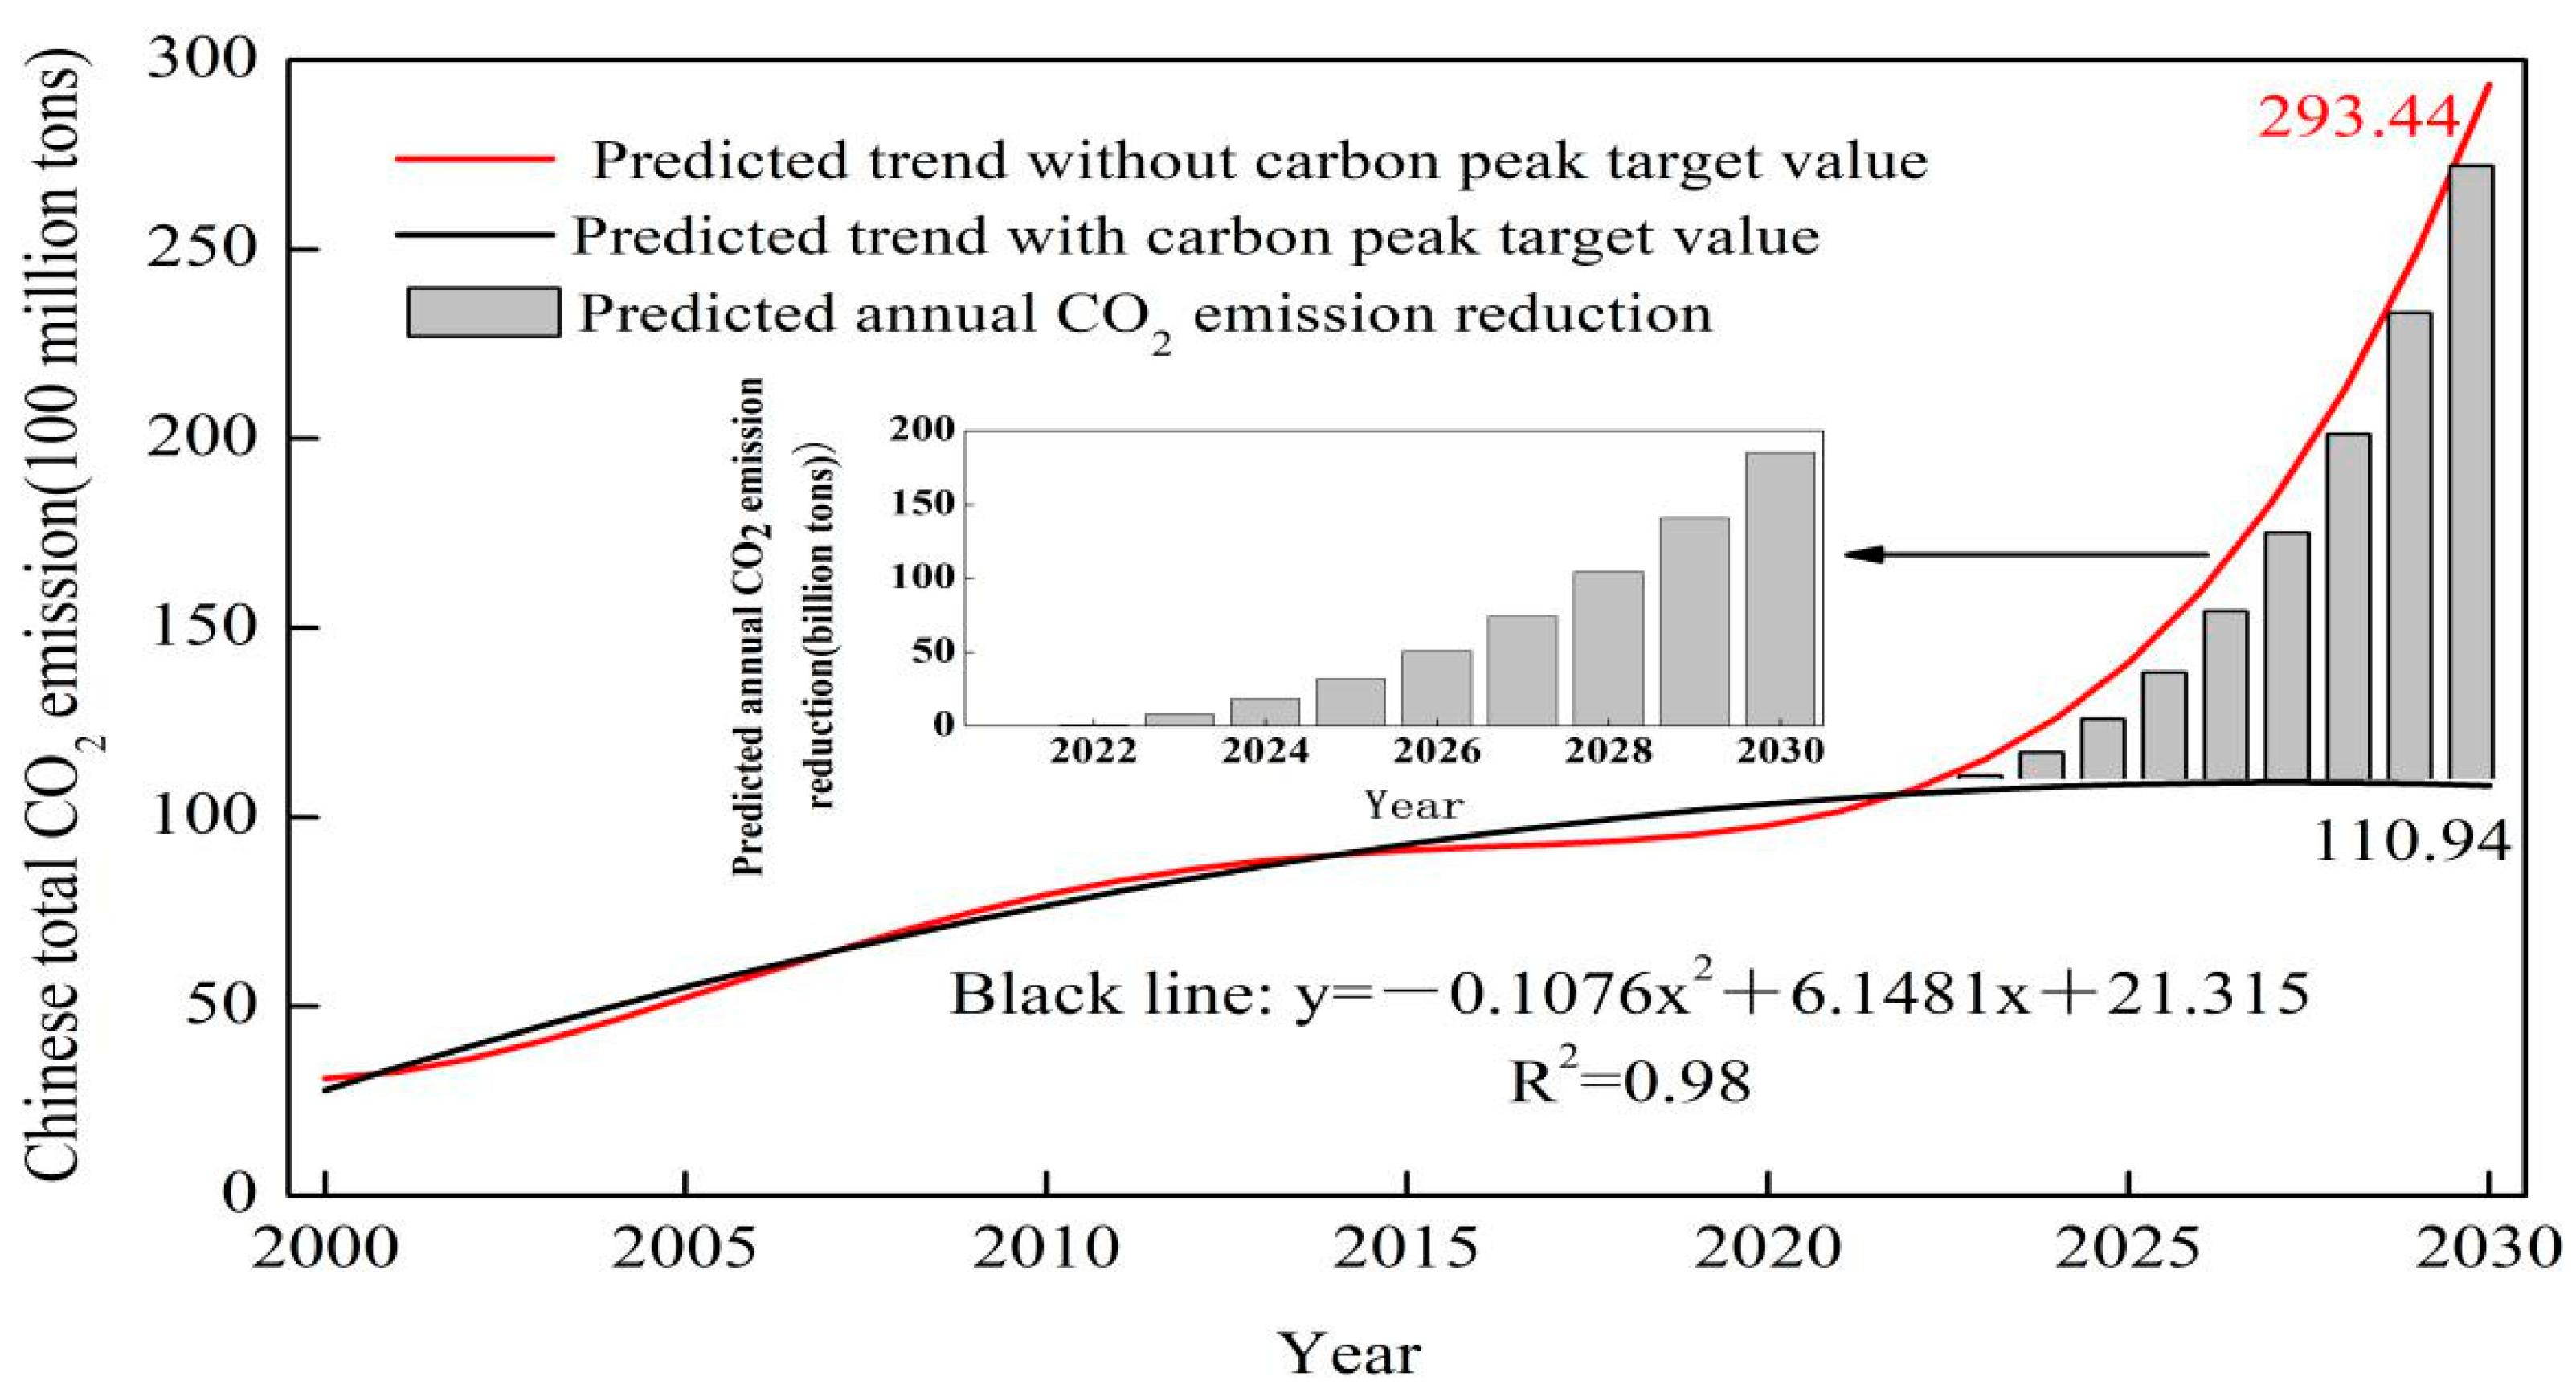
2.2. Predicted Total CO2 Emissions at Carbon Peak in China

At the 2020 climate summit, China announced that by 2030, CO2 emissions per unit of GDP will be reduced by more than 65% compared with 2005. In order to achieve the goal of carbon peak by 2030, China’s carbon emissions in 2030 should not exceed 11.094 billion tons. Therefore, 11.094 billion tons has become the target value of total CO2 emissions when China reaches the peak.
Figure 1 shows the development trend of China’s total CO2 emissions under the no carbon peak target scenario from 2000 to 2018. The data are from China’s Statistical Yearbook. As shown in Figure 1, China’s total CO2 emissions increased from 3.099 billion tons in 2000 to 9.528 billion tons in 2018. The emission level began to grow rapidly in 2003 and plateaued in 2013. Overall, the emission level has shown a trend of rapid growth, which is in line with the rapid development of the Chinese economy. Based on the data in Figure 1, the development trend of total CO2 emissions is predicted to show the total CO2 emission until 2030 without a carbon peak target. The fitting model is as follows:
y = 0.0021 x 4 0.0998 x 3 + 1.4078 x 2 1.8446 x + 31.484 ( R 2 = 0.99 )
(y is the predicted total CO2 emission of China without a carbon peak target (100 million tons); x is the year).
In Figure 1, the correlation coefficient R2 of the fitting model reaches 0.99. In order to further verify the formula, the predicted total CO2 emission of China in 2019 is 9.531 billion tons. According to the China Statistical Yearbook, the actual total CO2 emission of China in that year is 9.809 billion tons, and the error of the predicted value is only 2.8%, indicating that the fitting effect of the model is good and it can be used to predict the total CO2 emission in 2030 without a carbon peak goal, and the predicted value is 29.344 billion tons.
According to Equation (1), without a carbon peak target, China’s total CO2 emissions in 2030 would far exceed the target value of China’s total CO2 emission at the peak (11.094 billion tons), which is completely inconsistent with China’s vision of achieving carbon peak in 2030 and carbon neutrality in 2060. Therefore, China must start carbon emission reduction immediately. Based on the target value of total CO2 emissions in 2030, in conjunction with China’s total CO2 emissions data from 2000 to 2018, the revised fitting model is as follows:
y = 0.1076 x 2 + 6.1481 x + 21.315 ( R 2 = 0.98 )
(y is the projected total CO2 emission in China with a carbon peak target value (100 million tons); x is the year).
As shown in Figure 1 and Figure 2, according to the Equation (1), without a carbon peak target, China’s total CO2 emissions would show a rapid upward trend in the future, growing to 29.344 billion tons in 2030. Based on Equation (2), China’s total CO2 emission in the future would have a relatively slow rising trend. Combining the results of Equations (1) and (2), the annual CO2 emission reduction in China in the future (2022~2030) is predicted (see Table 1). From Table 1, it can be seen that the predicted amount of emission reduction increases rapidly year over year, from 100 million tons of CO2 emission reduction in 2022 to 18.511 billion tons in 2030.

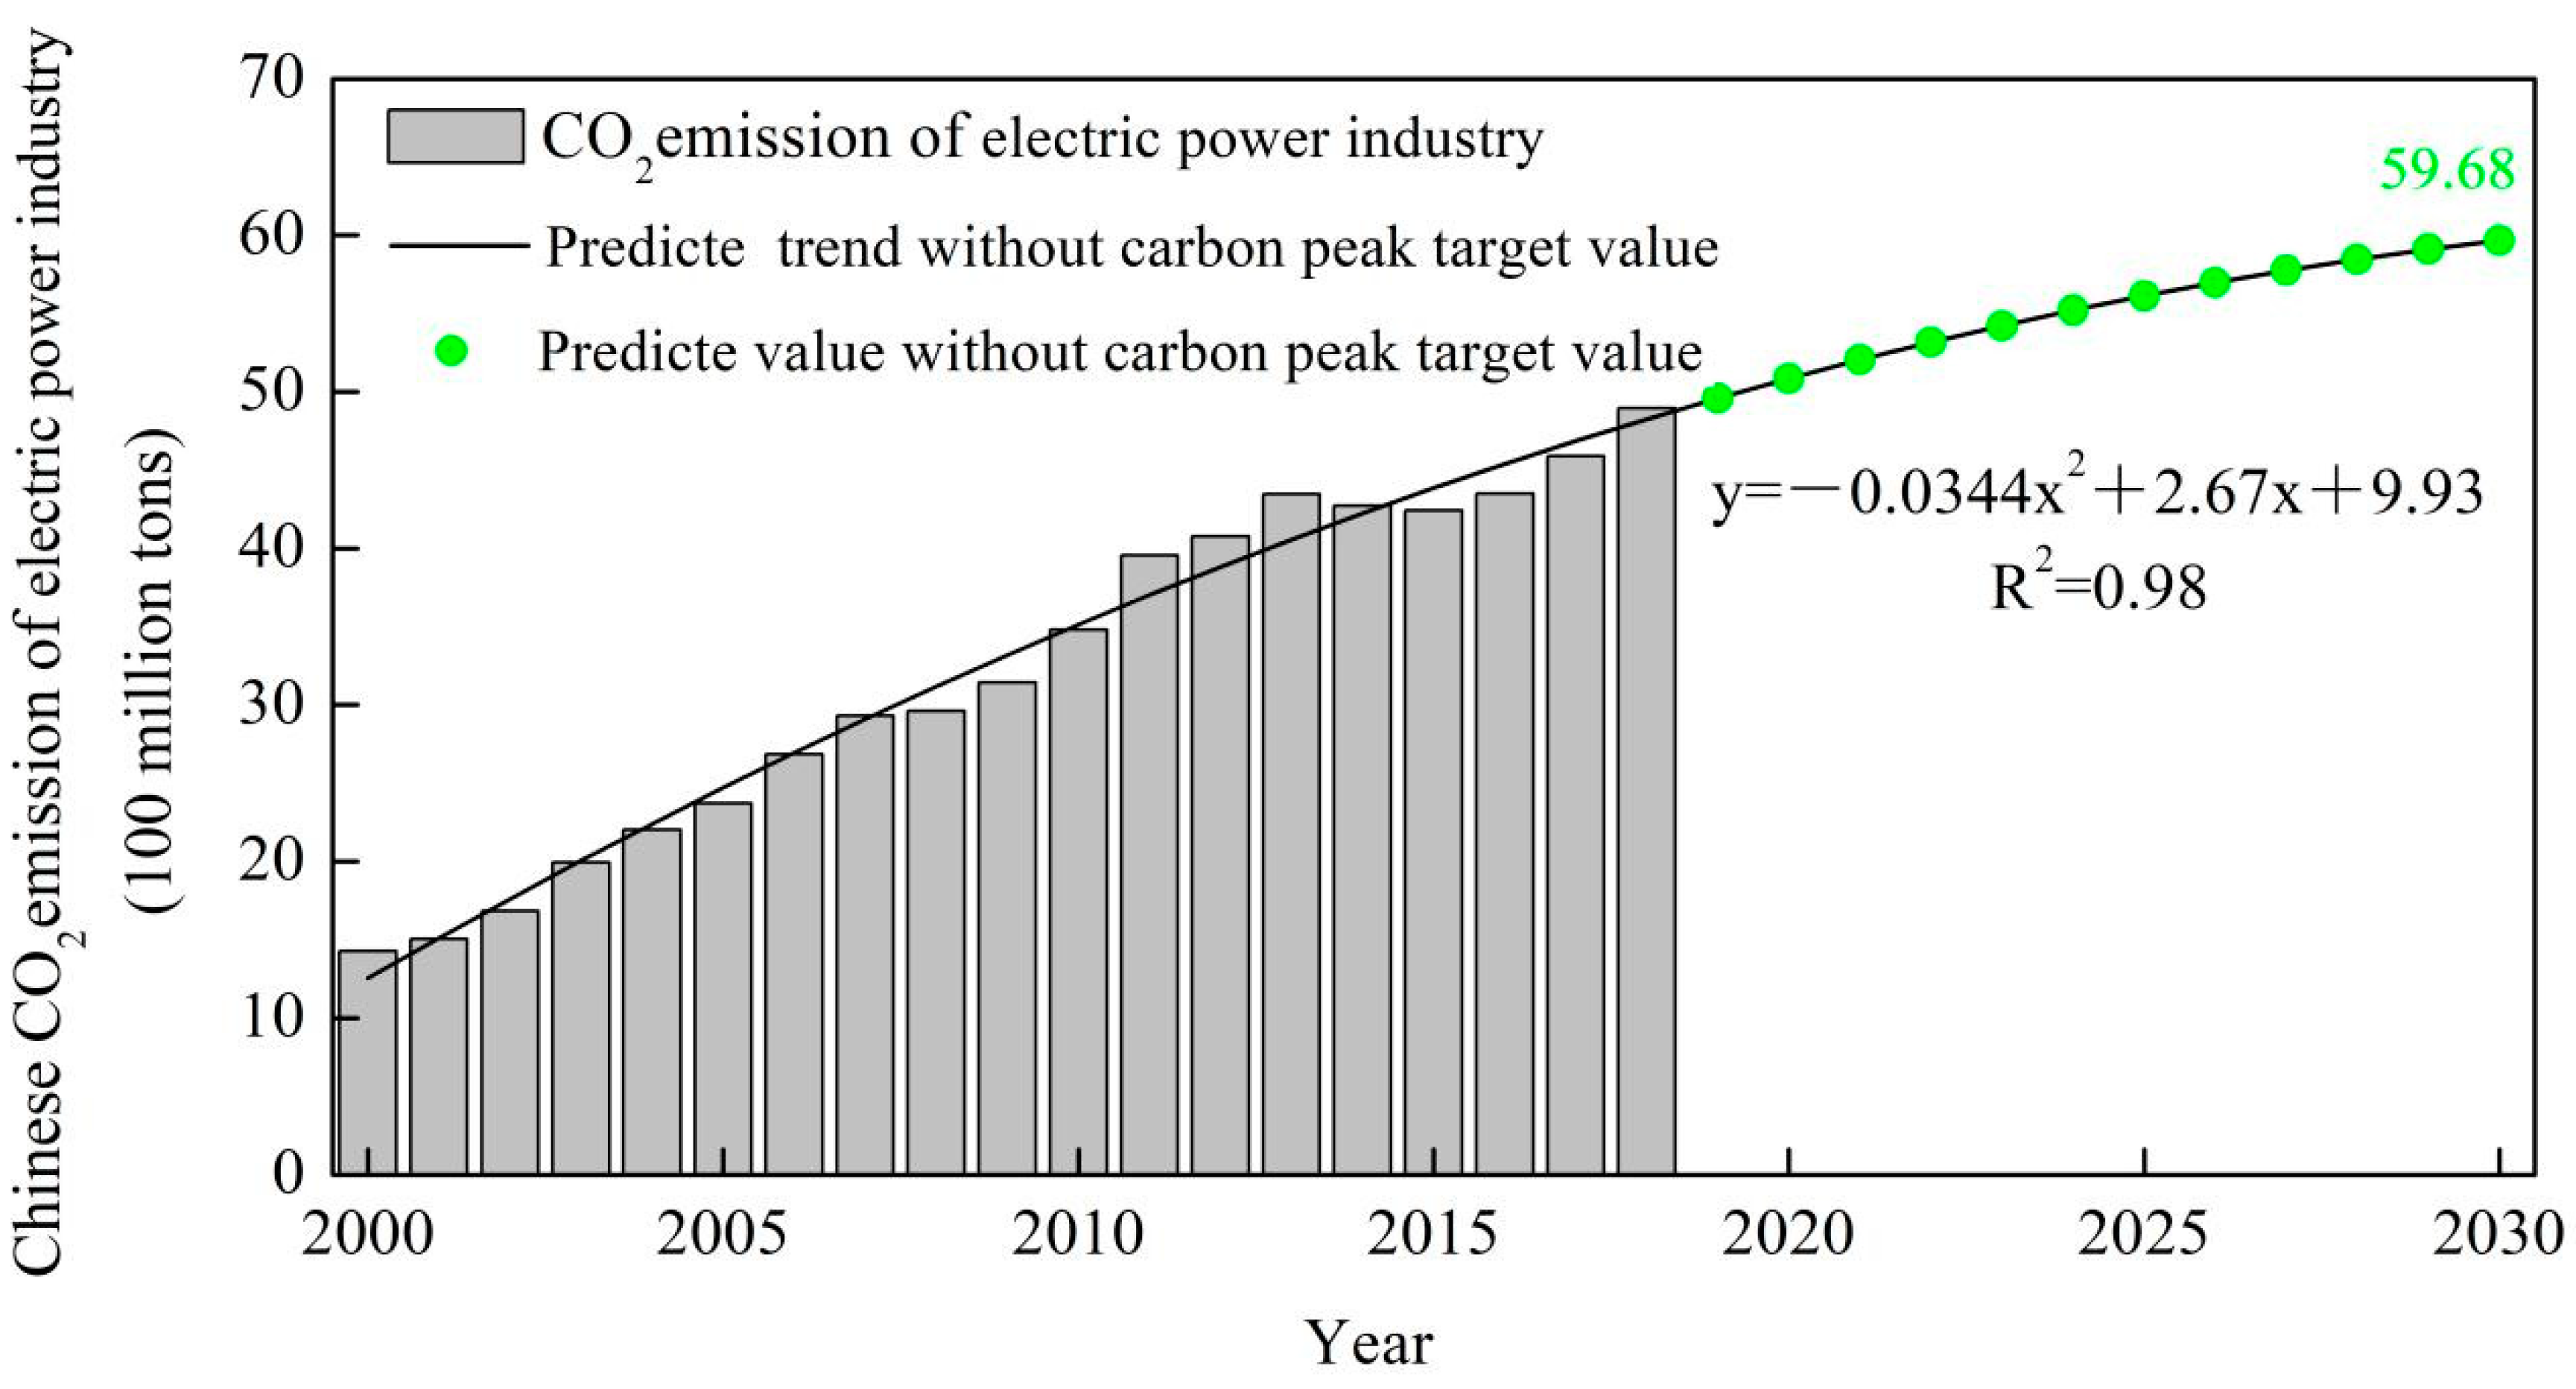
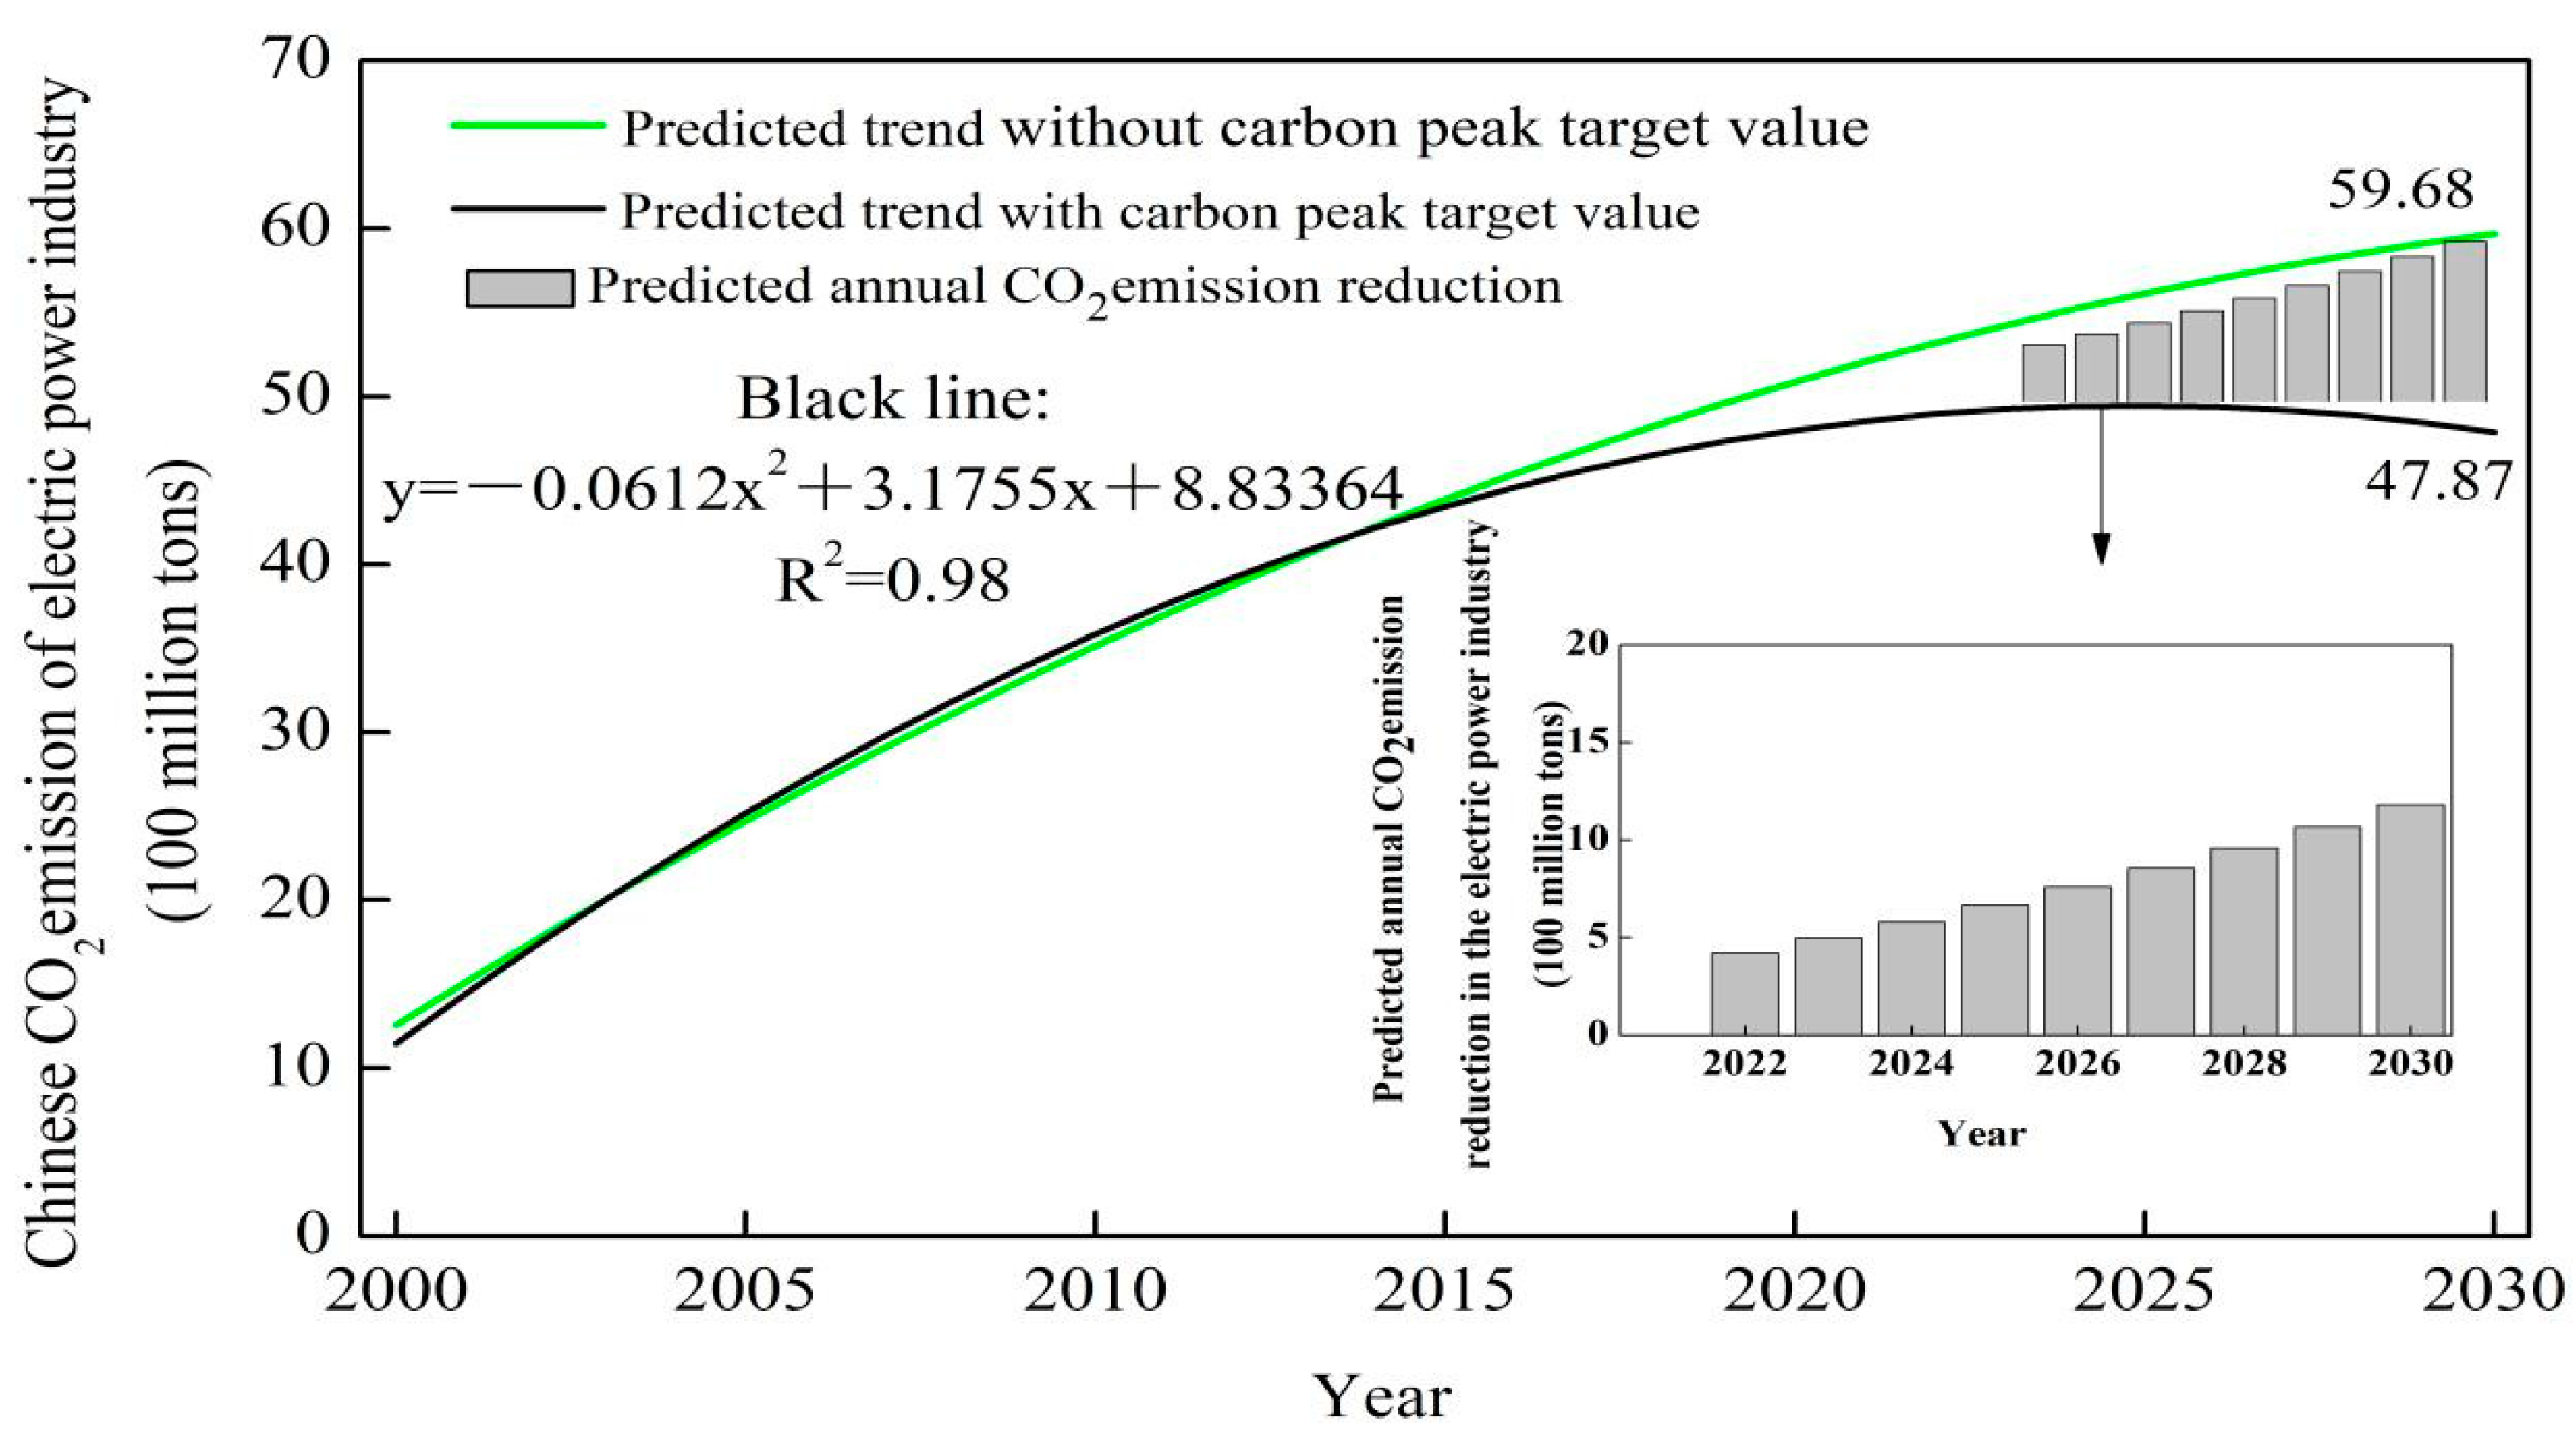
2.3. Predicted CO2 Emissions of China’s Power Industry at Carbon Peak

The main emission source of CO2 in China is the consumption of coal. In China, coal is mainly used in four industries: coal-fired power generation, steel, chemical industry and building materials. In 2019, the power industry accounted for 52% of total coal consumption, the steel industry accounted for 17%, the chemical industry accounted for about 7%, and other industries accounted for 11%. The thermal power industry is the biggest consumer of coal. In 2018, the CO2 emission of thermal power plants (about 90% of which is coal-powered) in China accounted for 43% of the total national emission and is the largest single source of CO2 emission [12]. Therefore, it is necessary to reduce CO2 emissions from China’s power industry. China is committed to reach carbon peak by 2030. To achieve that goal, the power industry not only needs to reach carbon peak, but also needs to do so before 2030 [1]. China now has the ability to develop green power at a large scale, so the power industry has great potential to contribute to achieving the goals of carbon peak and carbon neutralization [13].
Figure 3 shows the data of China’s total power generation from 2000 to 2018 and its development trend. The data are derived from the Statistical Yearbook of China Power Council. As shown in Figure 1, China’s total power generation shows an upward trend year by year, from 1355.6 billion kWh in 2000 to 7166.1 billion kWh in 2018, 5.5 times that in 2020. Based on the above data, the trend fitting is carried out to predict China’s total power generation in the future. The fitting model is as follows:
y = 3328.6 x + 6444.2 ( R 2 = 0.99 )
(y is the predicted value of China’s total power generation (100 million kWh); x is the year).
In Figure 3, the correlation coefficient of the fitting formula reaches 0.99. In order to further verify the model, China’s total power generation in 2019 predicted by the formula is 730.62 billion kWh. According to the Statistical Yearbook of China Electric Power Council, China’s actual total power generation in that year is 7503.43 billion kWh, and the error between it and the predicted value is only 2.7%. This shows that the model can be used to predict China’s total power generation. The model predicts that China’s total power generation will be 10,963.08 billion kWh in early 2030.
All forms of power generation emit CO2. In April 2021, the Chinese government indicated that China would limit new coal power projects, strictly control the growth of coal consumption during the 14th Five Year Plan period, and gradually reduce coal consumption during the 15th Five Year Plan period. It can be inferred that the installed capacity of coal power plants will increase before 2030. Some studies have predicted that the peak CO2 emission from China’s thermal power sector is 15% higher than 2018 levels, or about 4.7 billion tons [13]. In this study, 4.7 billion tons is selected as the CO2 emission target value for the power industry when China’s carbon peak is reached.
Figure 4 shows the development trend of actual annual CO2 emissions from 2000 to 2018. The data are from China’s Statistical Yearbook. As shown in Figure 4, the CO2 emissions of China’s power industry increased rapidly from 2003 to 2013. While the growth slowed after 2013, including a modest decline from 2014 to 2015. Overall, there is an upward trend, which is consistent with the rapid increase of installed capacity since 2003. Based on the data in Figure 4, the CO2 emission trend of China’s power industry until 2030 without a peak emission target is predicted. The fitting model is as follows:
y = 0.0344 x 2 + 2.67 x + 9.93 ( R 2 = 0.98 )
(y is the predicted CO2 emissions of China’s power industry without a peak emission target (100 million tons); x is the year).
According to the formula, without a peak emission target, the CO2 emission of the power industry will be 5.968 billion tons in 2030. A comparison of Figure 1 and Figure 4, shows that while China’s total CO2 emission and CO2 emission from China’s power sector have a similar trajectory, there are also differences, resulting in great differences in the development trend in the figure. The fitting curve for China’s overall CO2 emission shows exponential growth in the coming years, while the fitting curve of power industry CO2 emission is flatter. This difference may be caused by the fact that China’s power industry, especially the thermal power industry, has begun to undertake initiatives to conserve energy and reduce carbon emission. For example, the upgrade of existing subcritical steam generators can increase the coal consumption efficiency to a level that is on par with ultra-supercritical level, greatly reducing coal consumption and CO2 emission. Similarly, CO2 capture and utilization in coal-fired power plants can contribute to CO2 reduction. The existing CO2 capture technology can be divided into three categories, pre-combustion capture, oxygen enriched combustion and post combustion capture. Among them, post combustion capture technology is most mature at present and researchers are focused on improving efficiency and reducing operation cost [14].
According to the Equation (4), the rise of CO2 emissions of China’s power industry is relatively slow. The predicted value by 2030 is 5.968 billion tons, which is still much higher than the target value of CO2 emission of China’s power industry when the carbon peak is reached (4.7 billion tons). According to the target emission value, based on the CO2 emission data of China’s power industry from 2000 to 2018, the fitting model is as follows:
y = 0.0613 x 2 + 3.1755 x + 8.3364 ( R 2 = 0.98 )
(y is the CO2 emission of China’s power based on the carbon peak target value (100 million tons); x is the year).
It can be seen from Figure 4 and Figure 5 that according to the Equation (4), the predicted value of China’s power CO2 emission in 2030 with a peak emission target is 5.968 billion tons. Based on Equation (5), under a carbon peak target, the CO2 emission of China’s power industry should exhibit a downward trend in 2030, and the predicted value is 4.787 billion tons. Combining results of Equations (4) and (5), the amount of annual CO2 emission reduction China’s power industry needs to achieve is predicted (see Table 2). From Table 2, it can be seen that the predicted CO2 emission reduction increases year over year, from 422 million tons in 2022 to 1.182 billion tons in 2030.

3. Measures and Policy to Deal with Carbon Peak in Power Industry

In the next 10 years, should China adopt our CO2 emission reduction plan, China will be able to reach its peak carbon emission as scheduled. Reducing energy consumption should be the primary path to reach the goal. The key is to substitute fossil fuel with clean energy. To accomplish that, we put forward the following policy recommendations.

3.1. Reducing Energy Consumption Is the Primary Path for Carbon Peak

In 2019, fossil fuel accounted for 85.7% of primary energy consumption, and coal-fired power generation and fossil fuel consumption accounted for 88% of the total CO2 emission in China. It is expected that before achieving carbon peak, China will still rely heavily on fossil energy. Reducing energy consumption has become the primary measure to reduce CO2 emissions.
At present, China’s dependence on coal and oil is 14.0% higher than the world average, and the energy consumption per unit of GDP is ~50% higher than the world average. It is estimated that if China was to reach the world average, it could save 1.3 billion tons of standard coal every year, resulting in CO2 emission reduction of 3.4 billion tons, which is equivalent to about 1/3 of China’s total emission in 2020. Therefore, for the electric power industry, energy conservation and efficiency improvement are the best ways to reach carbon peak and carbon neutrality compared with other methods (such as CO2 capture and utilization). Reducing energy consumption is still the primary method for carbon emission reduction.
The electric power industry is a key industry in China. Thermal electric power generation is the main power generation mode at present. Taking coal-fired power plants as an example, the energy conversion efficiency varies greatly, ranging from less than 30% to 45% or more. High efficiency power generation (HELE) technologies such as ultra-super critical technology can significantly improve the conversion efficiency, which results in less CO2 emissions for the same amount of power produced. All else being equal, CO2 emissions of an ultra-super critical power plant can be 25% lower than subcritical power plants. If HELE units as a proportion of total install capacity in China was to increase from the current 43% to 70%, carbon emission could be reduced by 250 million tons [15]. While carbon capture and storage technology can reduce the CO2 emission of coal-fired power plants by 80~90%, the operational cost of such technology is much higher. Therefore, wider adoption of HELE technology can help reduce the cost of emission reduction for power plants. In addition, coal fired co-generation units can also replace heating boilers and coal-fired home heat. If the proportion of efficient heating was to increase from the current 55% to 95%, CO2 emissions of more than 50 million tons can be eliminated in northern China alone [16]. In addition, other technologies in energy production, such as pyrolysis, circulating fluidized bed boiler used in thermal power generation, and fluidized pyrolysis combustion, are effective means for the power industry to reduce pollutant emissions and improve efficiency [17]. Therefore, thermal power plants need to fully embrace the concept of energy conservation and emission reduction and optimize its production process accordingly. Through the application of technical innovations such as co-generation technology, electrical system transformation technology, steam turbine system transformation technology and boiler transformation technology, the energy consumption and CO2 emission generated in the production process of thermal power plants can be reduced [18].

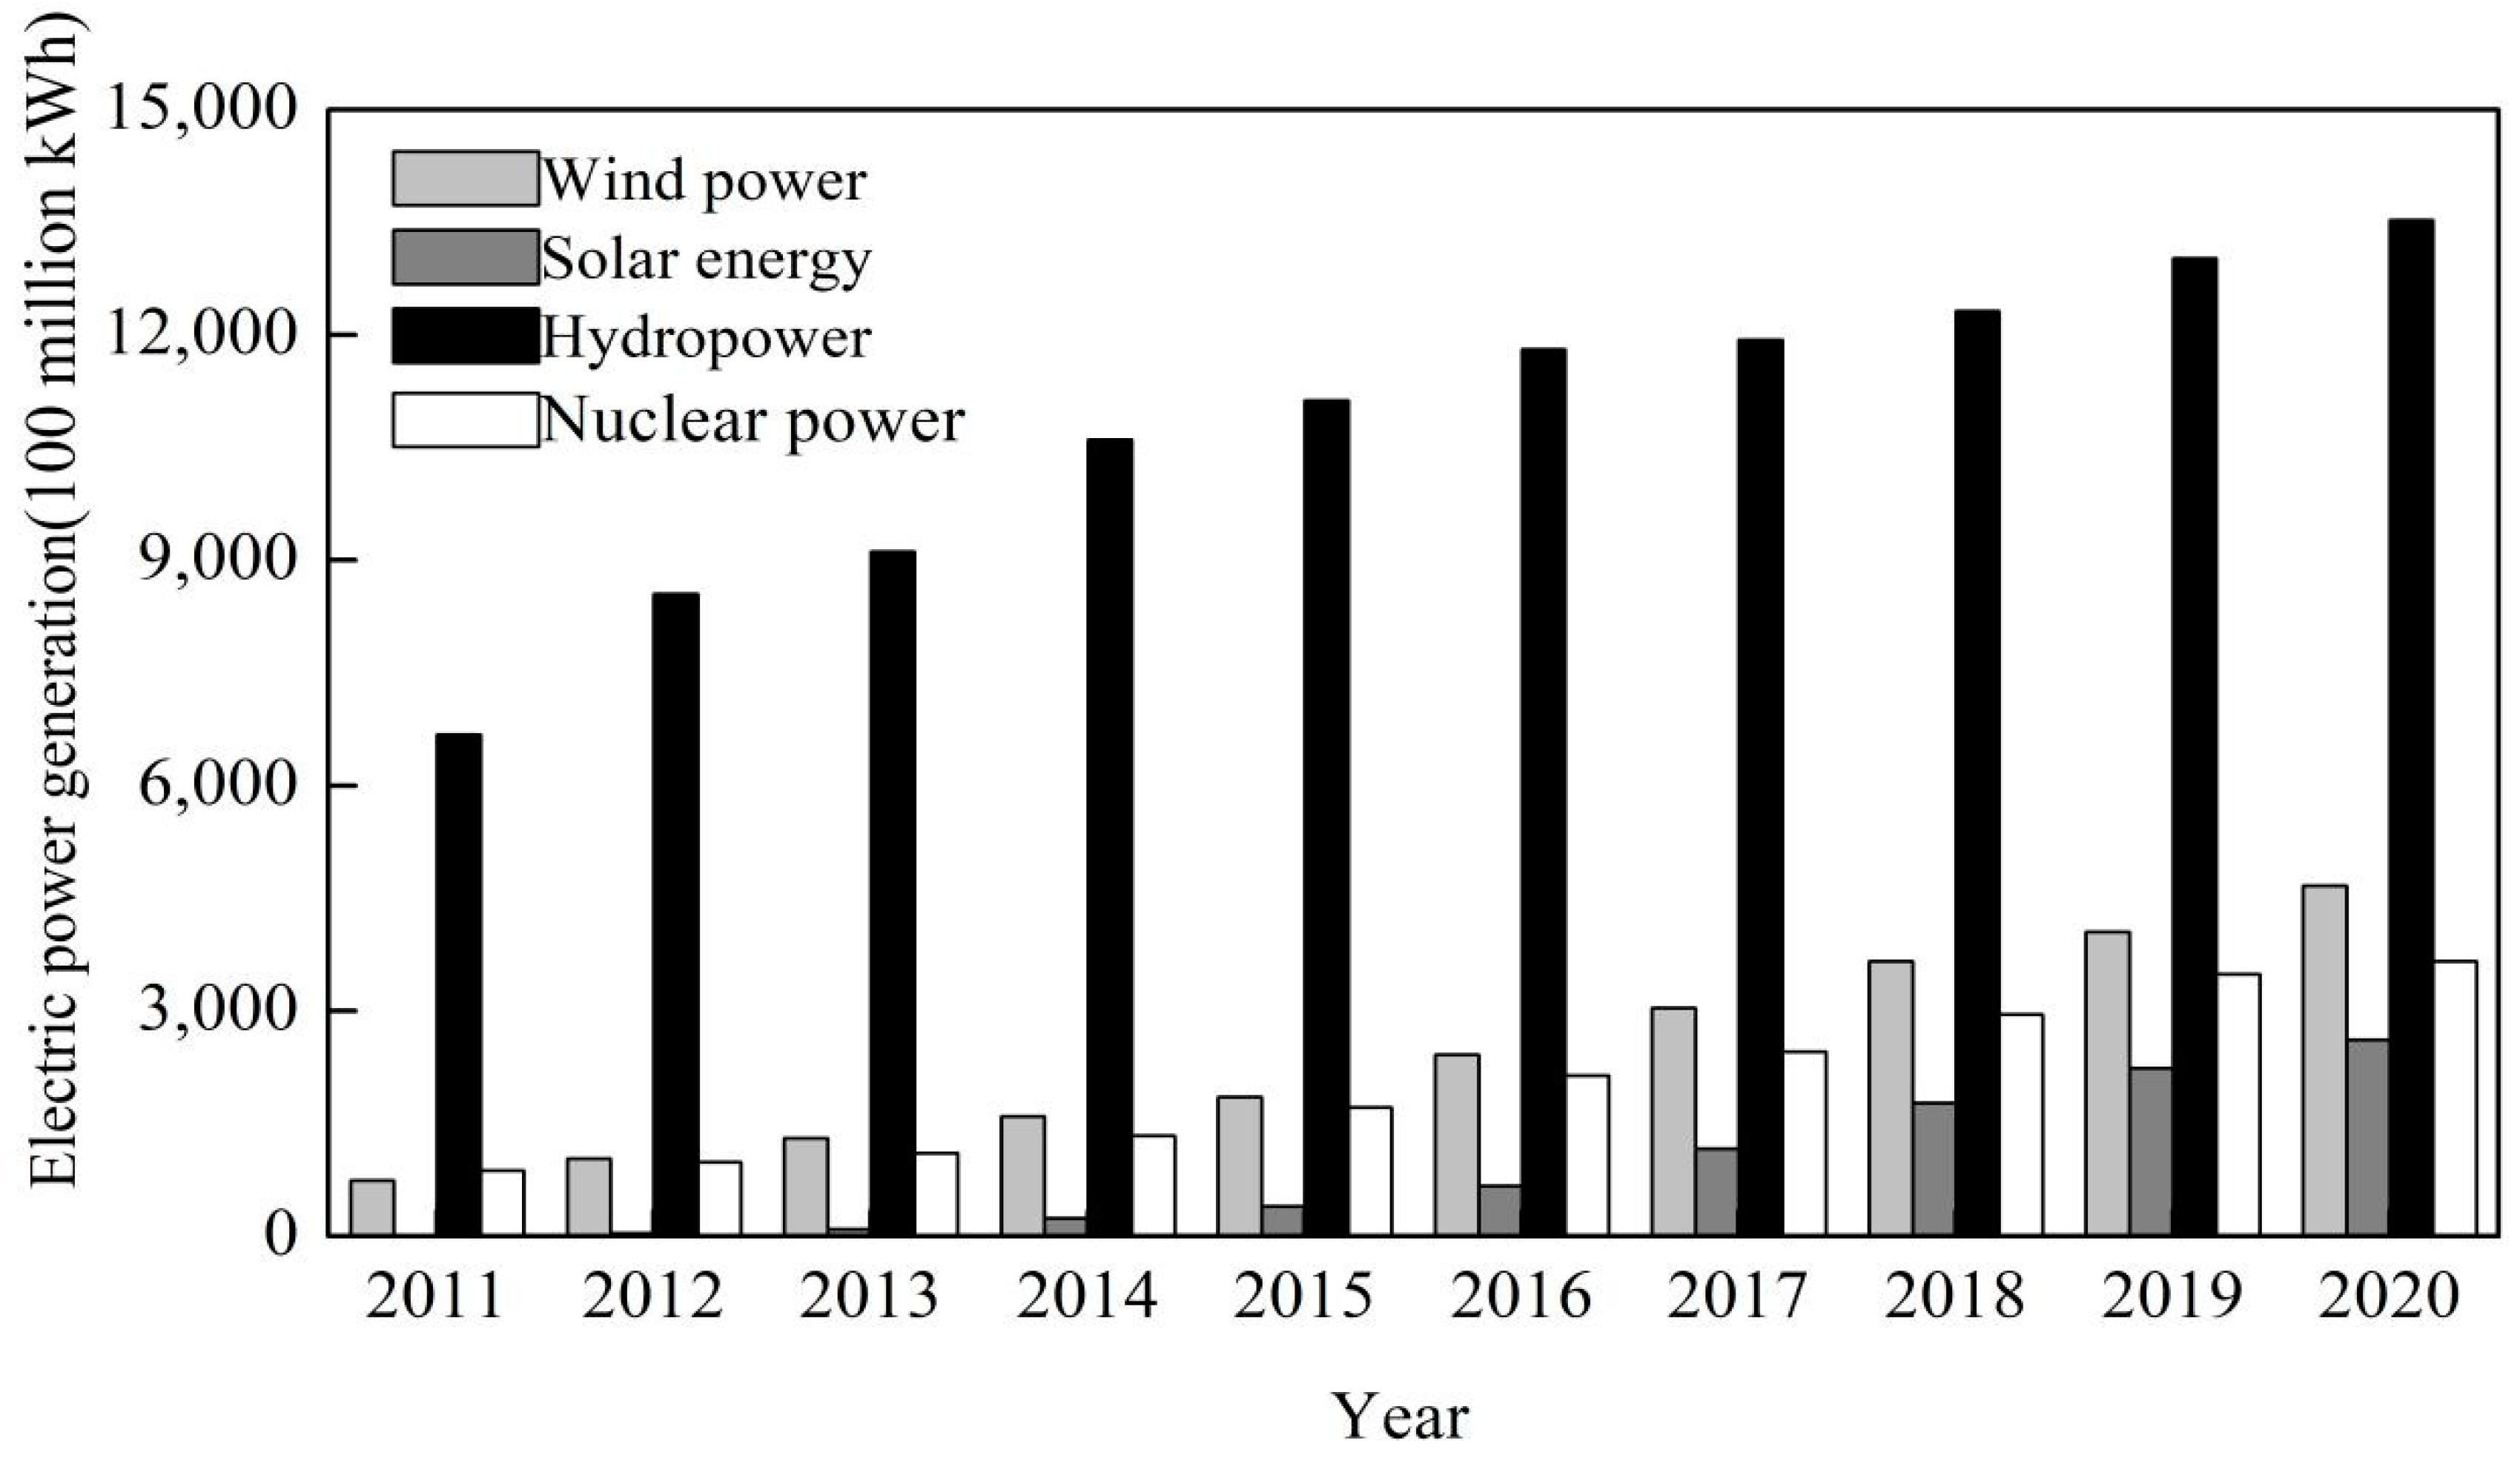
3.2. Elevate the Role of Renewable Energy in Energy Structure to Reduce Emission

Large scale deployment of clean energy in the power industry to replace fossil energy will further strengthen the role of renewable energy such as onshore wind power, offshore wind power and photo-voltaic power generation. Photo-voltaic power generation and wind power will eventually replace coal as the main energy source. Some studies have found that grid-connected solar power generation can eliminate 119,000 metric tons of CO2 emissions per year [19]. The exploitable amount of land-based wind energy resources at 70 m height is 7.2 billion kW, and at least 700 million kW of offshore wind energy resources has development potential [20]. The solar energy rich areas such as Qinghai Tibet Plateau, Gansu and Xinjiang have a total annual solar radiation of 40 billion hours [21]. The maximum potential installed capacity in the hydropower sector is 540 million kW [22]. Figure 6 shows the annual power generation in China from renewable energy from 2011 to 2020. The data are from the Statistical Yearbook of China Electric Power Federation. As shown in Figure 6, China’s wind power, solar power and nuclear power generation have increased significantly, while the increase in hydropower generation is more modest. At present, the power generation capacity of renewable energy is close to the global average, and China ranks first in the world in terms of installed capacity of wind power, solar power and hydropower.
Based on the annual power generation data of renewable energy in Figure 6, The trend fitting is carried out one by one (the fitting model is not given). As shown in Table 3, the predicted power generation from wind power, solar power, hydropower and nuclear power will be 13,979, 12,971, 15,213 and 1105.3 billion kWh, respectively, by 2030, accounting for 13.7%, 12.7%, 14.9% and 10.8% of total power generation. The total power generation from renewable energy will reach 5321.7 billion kWh, accounting for 52% of total electric power generated. Our result is similar to Qu et al. (2021), which projected that the proportion of electric power produced from non-fossil fuel will reach 49% in 2030 [23]. In the next 10 years, assuming an annual growth rate of 10%, the average annual new power generation in China will reach 2600 kWh [24], and the incremental power generation will be mainly come from by wind, photovoltaic, conventional hydropower and nuclear power.
There is a need to strengthen biomass power generation and alternative fuels [25,26]. The main advantage of coal and biomass coupled co-combustion power generation is that is allows solid biomass fuel to partially or completely replace coal, significantly reducing the CO2 emissions of the original coal-fired power plant. The proportion of biomass fuel involved in co-combustion can be adjusted within a wide range (usually 5~20%), allowing power plants to adapt to fluctuation in biomass fuel supply chain [27].
Pumped storage and other energy storage technology enable flexible operation of the power system. The adoption of energy storage and hydrogen fuel will improve the reliability of renewable energy and enable the transformation of the power allocation mode from one-way to multi-way.
Even after the carbon peak, it is still necessary to further develop clean and renewable energy and reduce the reliance on thermal power. Guo et al. (2021) predicted the proportion of power generated from various sources in China during the carbon neutralization period (see Table 4) [24].

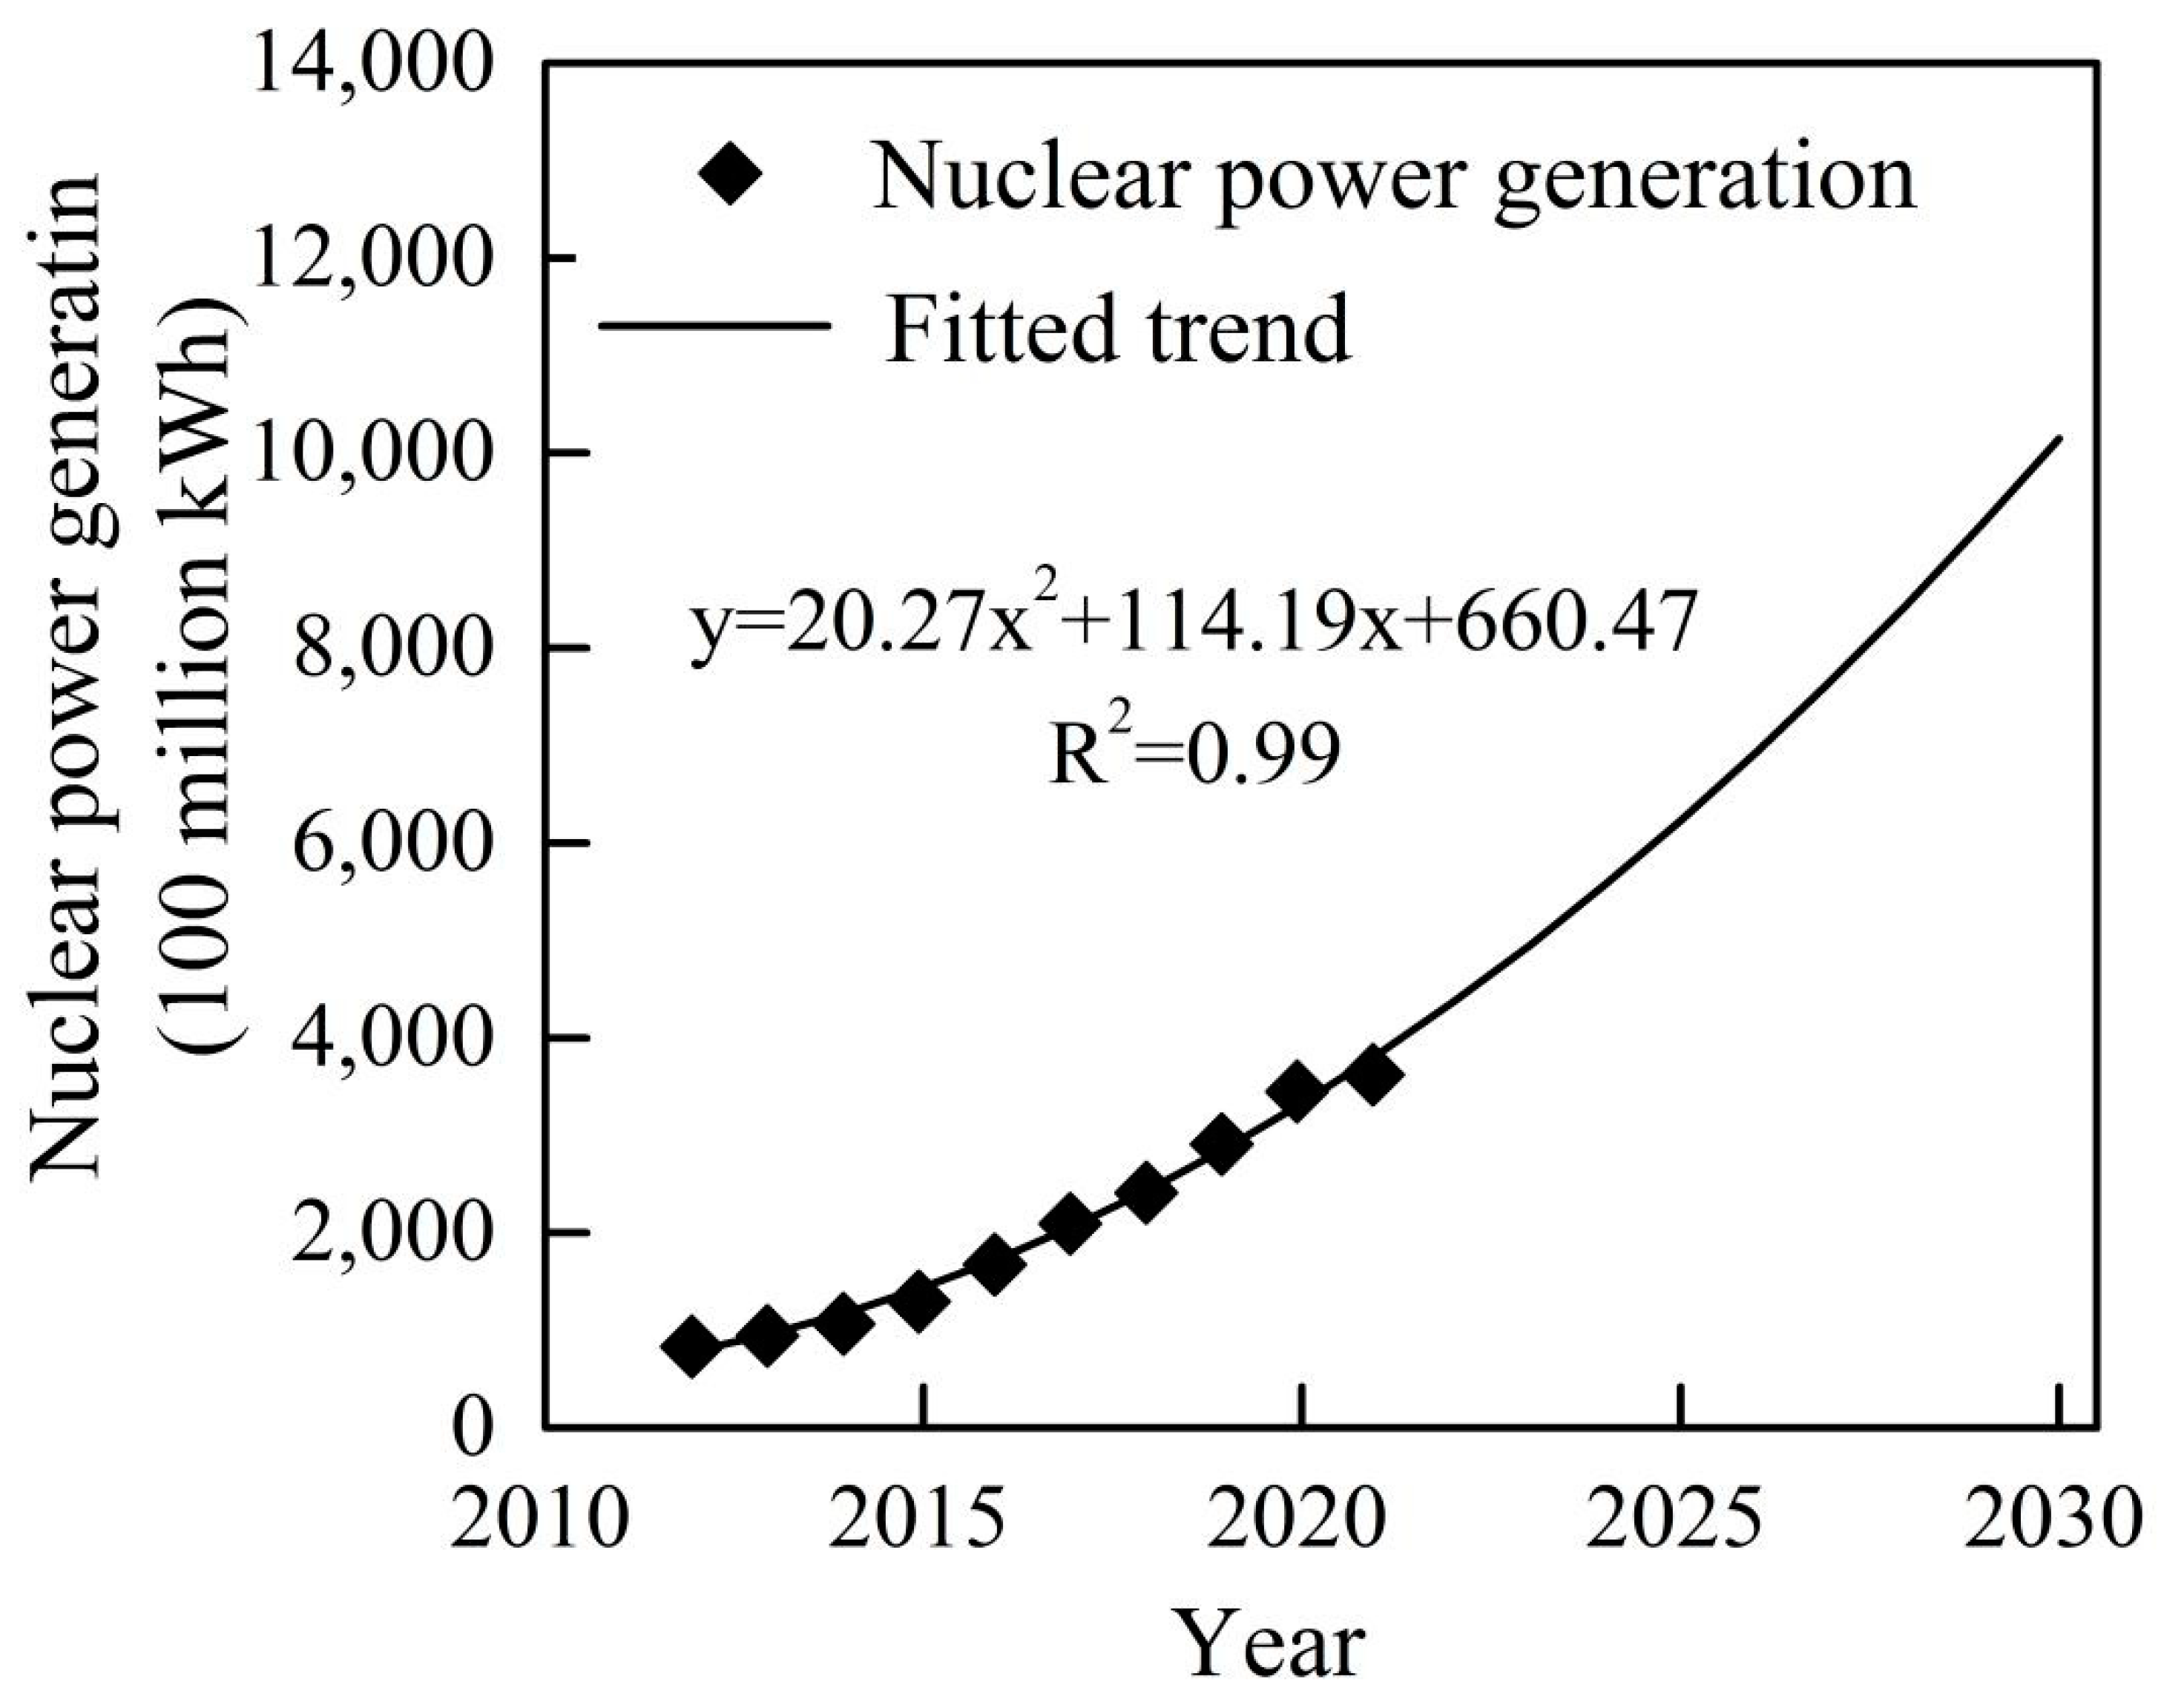
3.3. Promoting the Use of Nuclear Power as Supplement to Other Clean Energy Sources in Power Generation

Since wind power and photo-voltaic are unstable power sources, if a certain area depends solely on wind power and photo-voltaic, it is possible that no power may be generated at a given point in time. In that scenario, energy storage cannot support the whole power system. Therefore, other stable energy sources must be used as the base load power supply for the safety and stability of the power system. Under the goal of “carbon peak”, coal power will be gradually phased out, and nuclear power is the most feasible substitute for coal power [24]. According to IAEA statistics, by the end of June 2019, there were 449 nuclear units in operation across 30 countries around the world, with total installed capacity of nearly 400 million kW. There are another 54 units under construction, with an installed capacity of about 55 million kW. According to the annual report of the World Nuclear Association, global nuclear power generation exceeded 250 billion kWh in 2018, accounting for 10.5% of the total global power supply. There are 47 nuclear power units operating in mainland China today, with an installed capacity of 48.73 million kW; there are 11 additional units under construction with an installed capacity of about 11.34 million kW, ranking first in the world for many years [28].
In 2018, there were 44 commercial nuclear power units in mainland China, with a total installed capacity of 44.64516 million kW, accounting for 2.35% of the total installed capacity of power in China. The annual nuclear power generation was 286.511 billion kWh, accounting for about 4.22% of the national cumulative power generation, lower than the international average. The annual average utilization hours of nuclear power equipment was 7499.22 h, and the average utilization rate of equipment was 85.61%. Producing the same amount of energy would consume 88.2454 million tons of standard coal and result in 231.2029 million tons of incremental CO2 emission. Figure 7 shows the annual change and trend forecast of China’s nuclear power generation from 2011 to 2020. As shown in the figure, China’s nuclear power generation has been increasing year over year, from 79.493 billion hours in 2011 to 382.967 billion hours in 2020, with an average annual growth rate of 16%. Based on the trend fitting of the above year by year data, it is predicted that China’s nuclear power generation will reach 120 million hours in 2030. Therefore, in order to ensure a smooth carbon peak, we need to continue to develop nuclear power efficiently along the coast in a safe manner. It is estimated that the installed capacity of nuclear power will reach more than 320 million kW in 2060, that is, more than five nuclear power units will start every year before 2060 [24].
Replacing part of coal-fired power with nuclear power not only plays a key role in meeting China’s growing energy demand, optimizing energy structure, reducing dependence on fossil energy, and overall high-quality development strategy, but also reduces carbon and nitrogen emissions. The statistical report of China’s Nuclear Energy Industry Association shows that safe and efficient development of nuclear power is one of the most effective ways to achieve short-term carbon peak and long-term carbon neutrality.

3.4. Emphasis on the Development of Energy Storage System to Ensure the Utilization of Renewable Energy

Given the increasing popularity of new energy sources and the urgent needs for peak regulation, stability and quality improvement in power grid, the development of electric storage system has become increasingly important. The development of clean energy is the key to achieve carbon peak in 2030 and carbon neutrality in 2060 (The 30·60 goal). The development of electrochemical energy storage is instrumental to the sustainable development of clean energy and renewable energy. Energy storage overcomes issues with wind power and solar energy and addresses their impact on the power grid. Internationally, many countries have carried out pilot projects such as compressed air energy storage on the basis of electrochemical energy storage. Projects such as flywheel energy storage will be carried out in China. In recent years, the new installed capacity of electrochemical energy storage in China has also increased significantly. By the end of 2019, China’s installed capacity of photo-voltaic power, wind power and solar thermal power are 206 GW, 210 GW, and 420 MW, respectively, and it collectively represents over 20% of installed capacity [29].
In terms of using electric energy as substitute for other source of energy in China, coal-fired power plants, industrial manufacturing and auxiliary electric power are further along, while household electrification, electric vehicles and oil to electricity transformation have lagged [30]. With the rapid development of electric energy substitution, the primary goal is to accommodate distributed power sources and to further develop energy storage technology.
During the 14th Five-Year Plan period, it is necessary to make breakthroughs in the development of energy storage technologies, with a focus on upgrading targeted energy storage technologies and the integration of energy storage system and power grid access needs.

3.5. R&D and Utilization of Hydrogen Energy to Minimize Pollution and CO2

The poor synchronization between power generation and consumption is a challenge for utilization of wind and solar energy. Meanwhile, there is also the problem of disconnection between power station and the center of power consumption. Hydrogen energy storage technology, which transforms electricity into hydrogen, can enable the large-scale development of renewable energy power generation and enable carbon reduction [31].
As the “ultimate energy in the 21st century”, the development and utilization of hydrogen energy has become an important topic for a new round of world energy reform. Hydrogen produced from renewable energy, known as “green hydrogen”, has achieved “zero carbon emission” in its production process. Given’s China’s focus on renewable energy utilization, hydrogen energy storage has become a key technology to absorb excess electricity generated from wind power and solar energy. Electrolyzing water to produce hydrogen using the power of wind and light can effectively reduce pollutant emissions and increase the benefits of renewable energy [31]. At present, alkaline water electrolysis technology is commonly used in hydrogen cooling of steam turbines in coal-fired power plants. In the future, we need to make breakthroughs in a number of key areas, such as use of renewable energy in electrolytic water hydrogen production, liquid hydrogen production and hydrogen fuel cell system. Hydrogen based power generation is a powerful supplement to clean energy, promoting low-carbon transformation and accelerating the optimization of the energy structure. This technology also enables provision of power generation and hydrogen energy to small communities in remote areas [32].

3.6. Build a Smart “Wind-Solar-Nuclear Storage” Hybrid Power Generation System

With the rapid increase of the capacity of power generated from wind power, photovoltaic and other new energy sources in the power grid, the joint operation and coordinated control among various power sources has become a key problem in the operation of modern power grid. The joint operation of nuclear power units and other peak load regulation power sources in the system, and the coordinated dispatching and intelligent control of a wind-solar-nuclear storage hybrid power generation system are key for the utilization of nuclear power in power grid of the future.
The effective operation of a wind-solar-nuclear storage hybrid power generation system relies on the application of advanced technologies such as internet, cloud computing and big data. Through the development of smart energy management system platform, we can carry out the construction of energy network and smart regional energy supply system [11].

3.7. Improve the Management of Carbon Trading and Carbon Finance

Research shows that the earlier the peak of carbon emissions is achieved, the greater the negative impact is on economic growth. Different carbon peak scenarios can significantly reduce government revenue. Therefore, we need to carry out research on how to maintain China’s robust economic development while reducing carbon emissions at the same time under the 2030 carbon peak goal [32].
China should speed up the construction of a national trading market for energy use rights and carbon emission rights, improve the dual control system of energy consumption, speed up the research on the carbon emission trading market mechanism, effectively promote the construction of the carbon market in combination with the startup and operation of a national carbon emission trading market, and vigorously develop low-carbon green finance in line with the “30·60” goal, and build a mature green financial system including a carbon trading and carbon tax system, green financial standards, incentive mechanisms and product systems as soon as possible [33,34]. At the same time, it is necessary to combine the medium and long-term green development plan and regional layout of energy industries with carbon trading and carbon finance, prepare investment and financing plans for green industries and key projects, and establish a dynamic coordination mechanism between green industry planning and green financial development planning [35,36].

4. Conclusions

Taking the realization of carbon peak in China’s power industry as the research object, this study established several prediction models of CO2 emissions in China and China’s power industry in the absence or existence of the carbon peak and carbon neutrality goal with time series analysis. The predicted amount of CO2 emissions in 2030 in the absence of carbon peak and carbon neutrality are 29.344 billion tons, while the predicted amount of CO2 emissions in 2030 under the goal of carbon peak and carbon neutrality are 10.834 billion tons. It is predicted that the total CO2 emission reduction in 2030 will be 18.511 billion tons. The predicted CO2 emissions of China’s power industry in 2030 in the absence of carbon peak goal are 5.968 billion tons, while it is predicted to be 4.787 billion tons under the goal of carbon peak. The CO2 emission reduction of the power industry in 2030 is predicted to be 1.182 billion tons.
Based on the CO2 emission reduction plan, seven countermeasures were put forward: reducing energy consumption, strengthening the role of renewable energy in energy structure, promoting the use of nuclear power, focusing on the development of energy storage to support the use of renewable energy, R&D and utilization of hydrogen energy, building a smart “wind-solar-nuclear storage” hybrid power generation system, and improving the management of carbon trading and carbon finance. These measures promise to ensure China’s achievement of carbon peak in 2030 on schedule.

Author Contributions

Conceptualization, B.Z. and S.W.; methodology, B.Z., S.W. and J.X.; writing—original draft preparation, B.Z., S.W. and J.X.; writing—review & editing, B.Z.; visualization, S.W. and J.X.; supervision, B.Z.; project administration, B.Z.; funding acquisition, B.Z. All authors have read and agreed to the published version of the manuscript.

Funding

This work was supported by the Special Project for Transformation of Scientific and Technological Achievements in Jiangsu Province (BA2020001).

Institutional Review Board Statement

Not applicable.

Informed Consent Statement

Not applicable.

Data Availability Statement

Data sharing not applicable.

Conflicts of Interest

The authors declare that there is no conflict of interest regarding the publication of this article.

References

  1. Lu, C. Research on the Scenarios and Effectiveness of Post Carbon Peaking in China’s Power Industry under the Constraint of 1.5 °C; North China Electric Power University: Beijing, China, 2020. [Google Scholar]
  2. He, J.K. Low Carbon Transformation of Energy and Economy Aiming for the Peaking of Carbon Emission and Carbon Neutrality. J. Environ. Econ. 2021, 6, 1–9. [Google Scholar]
  3. Zhao, M.Q.; Lyu, L.H.; Zhang, B.L.; Luo, H. Dynamic relationship between energy consumption, economic growth and carbon emission in China. Res. Environ. Sci. 2021, 34, 1509–1522. [Google Scholar]
  4. Wang, S.; Wang, H.M.; Zhu, F.H. Promoting China’s energy structure adjustment by considering power coal consumption and emission. Environ. Prot. 2013, 41, 67–69. [Google Scholar]
  5. Wang, S. Analysis on Development Trend of Coal Power and Key Points of Environmental Protection in China’s 14th Five Year Plan. Environ. Prot. 2020, 48, 61–64. [Google Scholar]
  6. Wang, Y.; Wang, Y. Feasibility and optimal pathway of China’s double targets for carbon reduction-The perspective of energy structure optimization. China Environ. Sci. 2019, 39, 4444–4455. [Google Scholar]
  7. Borowski, P.F. Digitization, digital twins, blockchain, and industry 4.0 as elements of management process in enterprises in the energy sector. Energies 2021, 14, 1885. [Google Scholar] [CrossRef]
  8. Sun, H.; Awan, R.U.; Nawaz, M.A.; Mohsin, M.; Rasheed, A.K.; Iqbal, N. Assessing the socio-economic viability of solar commercialization and electrification in south Asian countries. Environ. Dev Sustain. 2021, 23, 9875–9897. [Google Scholar] [CrossRef]
  9. Wang, Z.X. Research on the realization path and policy framework of carbon peak and carbon neutralization. Electr. Power Technol. Environ. Prot. 2021, 37, 1–8. [Google Scholar]
  10. Liu, Z.Y. The fundamental way to achieve carbon peak carbon neutrality. Power Equip. Manag. 2021, 3, 20–23. [Google Scholar]
  11. Zhang, S.G.; Jia, H.Q.; Liu, M. Analysis on the economic effects of different plans for China to achieve the “Double Goals” of carbon emissions in 2030. J. Chongqing Univ. Technol. 2021, 35, 8–15. [Google Scholar]
  12. Wang, S.; Lyu, L.H.; Zhang, B.L.; Wang, S.Y.; Wu, J.; Fu, J.F.; Luo, H. Multi Objective Programming of Low-Cost Path for China’s Peaking Model Carbon Dioxide Emissions and Carbon Neutrality. Res. Environ. Sci. 2021, 34, 2044–2055. [Google Scholar]
  13. Zhu, F.H.; Wang, Y.S.; Xu, Z.; Li, J.Z.; Dong, Y.H.; Li, H.; Li, X.L.; Hu, Y.; Sun, X.L.; Ding, L. Research on the development path of carbon peak and carbon neutrality in China’s Power Industry. Electr. Power Environ. Prot. 2021, 37, 9–16. [Google Scholar]
  14. Han, T.; Zhao, R.; Zhang, S.; Yu, X.H.; Liao, H.Y. Research and application of carbon dioxide capture technology in coal-fired power plants. Coal Eng. 2017, 49, 24–28. [Google Scholar]
  15. IEA. China’s Carbon Emission Trading System: Designing an Efficient Quota Allocation Scheme [EB/OL]. Available online: https://www.iea.org (accessed on 30 December 2021).
  16. Zhou, H.C.; Li, C.Z.; Zhou, C. Development Report of China’s Clean Heating Industry (2020); China Economic Publishing House: Beijing, China, 2020. [Google Scholar]
  17. Spreafico, C.; Russo, D.; Spreafico, M. Investigating the evolution of pyrolysis technologies through bibliometric analysis of patents and papers. J. Anal. Appl. Pyrolysis 2021, 159, 105021. [Google Scholar] [CrossRef]
  18. Li, Y.X. Study on Technical Measures of Energy Saving and Emission Reduction in Thermal Power Plants. Mod. Chem. Res. 2020, 17, 56–57. [Google Scholar]
  19. Sun, H.; Edziah, B.K.; Kporsu, A.K.; Sarkodie, S.A.; Taghizadeh-Hesary, F. Energy efficiency: The role of technological innovation and knowledge spillover. Technol. Forecast. Soc. Chang. 2021, 167, 120659. [Google Scholar] [CrossRef]
  20. Yi, Y.C. China offshore wind power. Electr. Power Equip. Manag. 2018, 12, 81–83. [Google Scholar]
  21. Li, K.; He, F.N. Analysis on mainland China’s solar energy distribution and potential to utilize solar energy as an alternative energy source. Prog Geogr. 2010, 29, 1049–1054. [Google Scholar]
  22. Huang, Q.L. Energy structure adjustment and renewable energy development. Modern Electr. Power 2007, 24, 1–5. [Google Scholar]
  23. Qu, B.; Liu, C.; Li, D.Z.; Guo, B.Q. Research on the development strategy of electricity substitution under the target of “carbon neutral”. Power Dsm 2021, 23, 1–3. [Google Scholar]
  24. Guo, T.C.; Sun, S.X.; Zhang, W.J. Research on the positive and orderly development strategy of nuclear energy under the target of “carbon neutral”. Res. Approach 2021, 43, 44–50. [Google Scholar]
  25. Borowski, P.F. Significance and directions of energy development in African countries. Energies 2021, 14, 4479. [Google Scholar] [CrossRef]
  26. Zhang, Y.; Shen, Z.X.; Zhang, B.; Sun, J.; Zhang, L.M.; Zhang, T.; Xu, H.M.; Bei, N.F.; Tian, J.; Wang, Q.Y.; et al. Emission reduction effect on PM2.5, SO2 and NOX by using red mud as additive in clean coal briquetting. Atmos. Environ. 2020, 223, 117203. [Google Scholar] [CrossRef]
  27. Mao, J.X. How to develop low carbon coal power in China under the ”3060” goal. China Power News, 19 March 2021. [Google Scholar]
  28. Long, M.X. Current situation and Prospect of world nuclear power development. China Energy News, 16 September 2019. [Google Scholar]
  29. Tong, J.L.; Hong, Q.; Lyu, H.K.; Wu, R.K.; Ying, G.Y. Development status and application prospect of power side energy storage technology. Huadian Technol. 2021, 43, 17–23. [Google Scholar]
  30. Li, M. Current situation analysis and suggestions of electric energy substitution industry. Plant Maint. Eng. 2021, 2, 153–154. [Google Scholar]
  31. Liu, J.P.; Hou, T. Review and Prospect of Hydrogen Energy Storage Technology and its Application in Power Industry. Power Energy 2020, 41, 230–247. [Google Scholar]
  32. Xia, T.; Rezaei, M.; Dampage, U.; Alharbi, S.A.; Nasif, O.; Borowski, P.F.; Mohamed, M.A. Techno-Economic Assessment of a Grid-Independent Hybrid Power Plant for Co-Supplying a Remote Micro-Community with Electricity and Hydrogen. Processes 2021, 9, 1375. [Google Scholar] [CrossRef]
  33. Feng, C.Q.; Cui, Y. Progress and suggestions on global climate investment and financing. Financ. Perspect. J. 2021, 6, 36–42. [Google Scholar]
  34. Li, G. Accelerate the construction of Climate Investment and financing policy system. China Financ. 2020, 23, 51–52. [Google Scholar]
  35. Qian, L.H.; Lu, Z.W.; Fang, Q. Climate change and the development of international climate investment and financing. Financ. View 2019, 10, 56–57. [Google Scholar]
  36. Zhang, H.B. Development prospect of green finance under the guidance of carbon neutrality vision. Financ. Perspect. J. 2021, 1, 58–63. [Google Scholar]
Figure 1. Development trend of annual total CO2 emissions in China from 2000 to 2018 without a peak emission target.
Sustainability 14 00879 g001
Figure 2. Development trend of total CO2 emissions in China with a carbon peak target and the amount of CO2 emission reduction required per year.
Sustainability 14 00879 g002
Figure 3. Development trend of China’s total power generation from 2000 to 2018.
Sustainability 14 00879 g003
Figure 4. Development trend of annual CO2 emissions of China’s power industry from 2000 to 2018 without a peak emission target.
Sustainability 14 00879 g004
Figure 5. Development trend of annual CO2 from China’s power industry with a peak emission target and the amount of emissions reduction required per year.
Sustainability 14 00879 g005
Figure 6. Annual power generation of wind power, solar power, hydropower and nuclear power in China from 2011 to 2020.
Sustainability 14 00879 g006
Figure 7. Annual change and development trend of China’s nuclear power generation from 2011 to 2020.
Sustainability 14 00879 g007
Table 1. To successfully reach carbon peak, total CO2 emission reduction required in China by year (2022~2030).
YearPredicted Total CO2 Emissions without Carbon Peaking Target Value
(100 Million Tons)
Predicted Total CO2 Emission Based on Carbon Peak Target Value
(100 Million Tons)
Predicted Emission Reduction
(100 Million Tons)
2022107.18106.181.00
2023115.20107.227.98
2024126.18108.0418.14
2025140.76108.6432.13
2026159.63109.0150.61
2027183.52109.1774.34
2028213.22109.12104.10
2029249.57108.84140.73
2030293.45108.34185.11
Table 2. China’s power industry CO2 emission reduction plan in the future (2022~2030) to successfully achieve peak emission target.
YearPredicted CO2 Emission of Electric Power under no Carbon Peak Target Value
(100 Million Tons)
Predicted CO2 Emission of Electric Power Based on Carbon Peak Target Value
(100 Million Tons)
Predicted Emission Reduction
(100 Million Tons)
202248.9553.174.22
202349.2454.224.98
202449.4155.215.8
202549.4656.136.67
202649.3956.987.59
202749.1957.768.56
202848.8758.479.59
202948.4359.1110.68
203047.8759.6811.82
Table 3. Electric power generation based on renewable energy source at carbon peak.
Energy SourcePredicted Power Generation at Carbon Peak
(100 Million kWh)
Proportion (%)
Wind power13,979 13.7
Solar energy12,971 12.7
Hydropower15,213 14.9
Nuclear power11,053 10.8
Total53,217 52.0
Table 4. Estimated proportion of power generation based on various energy sources in China in 2060.
Energy SourceProportion (%)
Wind power, photo-voltaic45~55
Hydropower (excluding pumped storage)14~16
Nuclear power15~22
Thermal power15~22
Publisher’s Note: MDPI stays neutral with regard to jurisdictional claims in published maps and institutional affiliations.

