Case Report

The Impact of Urbanization on Water Quality: Case Study on the Alto Atoyac Basin in Puebla, Mexico

by
Andrés Estrada-Rivera
1,2,
Alfonso Díaz Fonseca
3,
Samuel Treviño Mora
3,
Wendy Argelia García Suastegui
1,2,
Edith Chávez Bravo
1,4,
Rosalía Castelán Vega
1,5,
José Luis Morán Perales
2 and
Anabella Handal-Silva
1,2,*
1
Posgrado en Ciencias Ambientales, Instituto de Ciencias, Benemérita Universidad Autónoma de Puebla, Puebla 72570, Mexico
2
Departamento de Biología y Toxicología de la Reproducción, Instituto de Ciencias, Benemérita Universidad Autónoma de Puebla, Puebla 72570, Mexico
3
Departamento de Farmacia, Facultad de Ciencias Químicas, Benemérita Universidad Autónoma de Puebla, Puebla 72570, Mexico
4
Centro de Investigaciones en Ciencias Microbiológicas, Departamento de Patogenicidad Microbiana, Instituto de Ciencias, Benemérita Universidad Autónoma de Puebla, Puebla 72570, Mexico
5
Departamento de Investigación en Ciencias Agrícolas, Instituto de Ciencias, Benemérita Universidad Autónoma de Puebla, Puebla 72570, Mexico
*
Author to whom correspondence should be addressed.
Sustainability 2022, 14(2), 667; https://doi.org/10.3390/su14020667
Submission received: 17 November 2021 / Revised: 27 December 2021 / Accepted: 28 December 2021 / Published: 7 January 2022

Abstract

:
Population growth, poorly planned industrial development and uncontrolled production processes have left a significant footprint of environmental deterioration in the Alto Atoyac watershed. In this study, we propose using the integrated pollution index (PI) to characterize the temporary variations in surface water quality during the rapid urbanization process in the municipalities of San Martín Texmelucán (SMT) and Tepetitla de Lardizabal (TL), in the states of Puebla and Tlaxcala, between 1985 and 2020. We assessed the correlation between the population growth rate and the water quality parameters according to the Water Quality Index (ICA). The contribution of each polluting substance to the PI was determined. The industry database was created and the increase in population and industry, and their densities, were estimated. The results indicated that the temporal pattern of surface water quality is determined by the level of urbanization. The water integrated pollution index (WPI) increased with the passage of time in all the localities: SLG 0.0 to 25.0; SMTL 25.0 to 29.0; SRT 4.0 to 29.0; VA 6.0 to 30.0; T 3.5 to 24.0 and SMA 4.0 to 27.0 from 2010 to 2020, respectively. The correlation coefficients between the five parameters (BOD5, COD, CF, TU and TSS) in the six localities were positive with the population. The values that showed a higher correlation with the population were: SLG (FC 0.86), SMTL (BOD5 0.61, COD 0.89, TSS 0.64) and SRT (TU 0.83), corresponding to highly polluted localities, which generates complex and severe environmental implications due to the unsustainable management of water resources. Achieving the sustainability of water in the watershed is a challenge that should be shared between society and state. This type of research can be a useful tool in making environmental management decisions.

1. Introduction

The process of urbanization, as well as the accelerated growth of population and industry make up, are, without a doubt, the most important global phenomena in the development of human society due to their impact on environmental deterioration [1,2]. In Mexico, the situation is no different; urbanization trends are dynamic and face risks that force the low-income population to concentrate in cities in sectors with high environmental impact [3,4,5,6,7]. Such is the case of the Balsas Hydrological Region, formed by 15 hydrographic basins, among them the Alto Atoyac basin (Puebla-Tlaxcala) [8], where the Atoyac River is located [9,10].
The Atoyac River is the second most polluted river in Mexico, mainly because it receives untreated wastewater from more than 8000 companies, including industries such as textile, food, pharmaceutical and automotive, that produce hazardous waste [11,12,13,14]. Several studies carried out in the basin have shown that factors such as increasing urbanization, improper land use, overexploitation of natural resources and the construction of industrial drains have influenced water and soil pollution. All studies agree that the river is anoxic and that most of the physical and chemical parameters exceed the maximum permissible limits of the Official Mexican (NOMs) and International Standards [15,16,17,18,19,20,21,22,23,24,25,26,27].
The urbanization process is associated with population growth and industrial and agricultural development and, consequently, the chemical composition of water is possibly influenced by human activities [28,29,30,31]. In this regard, numerous studies have shown that there is a close relationship between water quality and urban development [32,33,34,35,36]. It has also been shown that human activities are positively correlated with the degradation of water quality in the river [36,37,38].
The study was carried out in the municipalities of (SMT) and (TL), where the environmental problem of pollution of the Atoyac River and its tributaries is mainly due to the increase in anthropogenic activities [29,30,37]. Within the last 35 years, the municipalities have experienced a profound transition from rural activities to intensive industrialization, leading to the diversification of pollutants, including heavy metals and volatile organic compounds (chloroform, chlorine methyl and toluene, among others) [14,23,37]. These types of substances affect the health of ecosystems and inhabitants [25,26,27].
In Mexico, and specifically in the Alto Atoyac watershed, there is information and evidence on the impact of the urbanization process [29,39,40]. However, there is no research in which the process of urbanization and industrialization in SMT and TL and its environmental implications are analyzed and related to the water quality of hydric resources. The objective of the study was to evaluate the Alto Atoyac watershed between the states of Puebla and Tlaxcala in the municipalities of SMT and TL as a case study. The index proposed, PI, is based on the permissible standard limits for surface water parameter recommended by the WHO. This index produces a single numerical result, which expresses and categorizes all water quality by transforming a large number of variable data using an integrated approach [41]. This method has been widely accepted and applied in various countries [42]. In this document, the (PI) will be used to analyze the temporal changes in water quality during the period of rapid urbanization from 1985 to 2020 based on the rate of population growth and industrial development according to the (ICA), established in Mexico between 2012–2019 [43]. Some socioeconomic aspects related to the environmental problems in the Alto Atoyac watershed are also highlighted. The relevance of this research consists in analyzing the water pollution of the Atoyac River generated over eight years (2012–2019) using the integrated pollution index (PI), and associating it to the urbanization process, taking into account territorial transformations, its impact on hydric resources and the severe environmental implications the watershed has suffered, which have contributed to serious deterioration and have prevented its conservation and sustainable regeneration, since works of this type have not been reported.

2. Materials and Methods
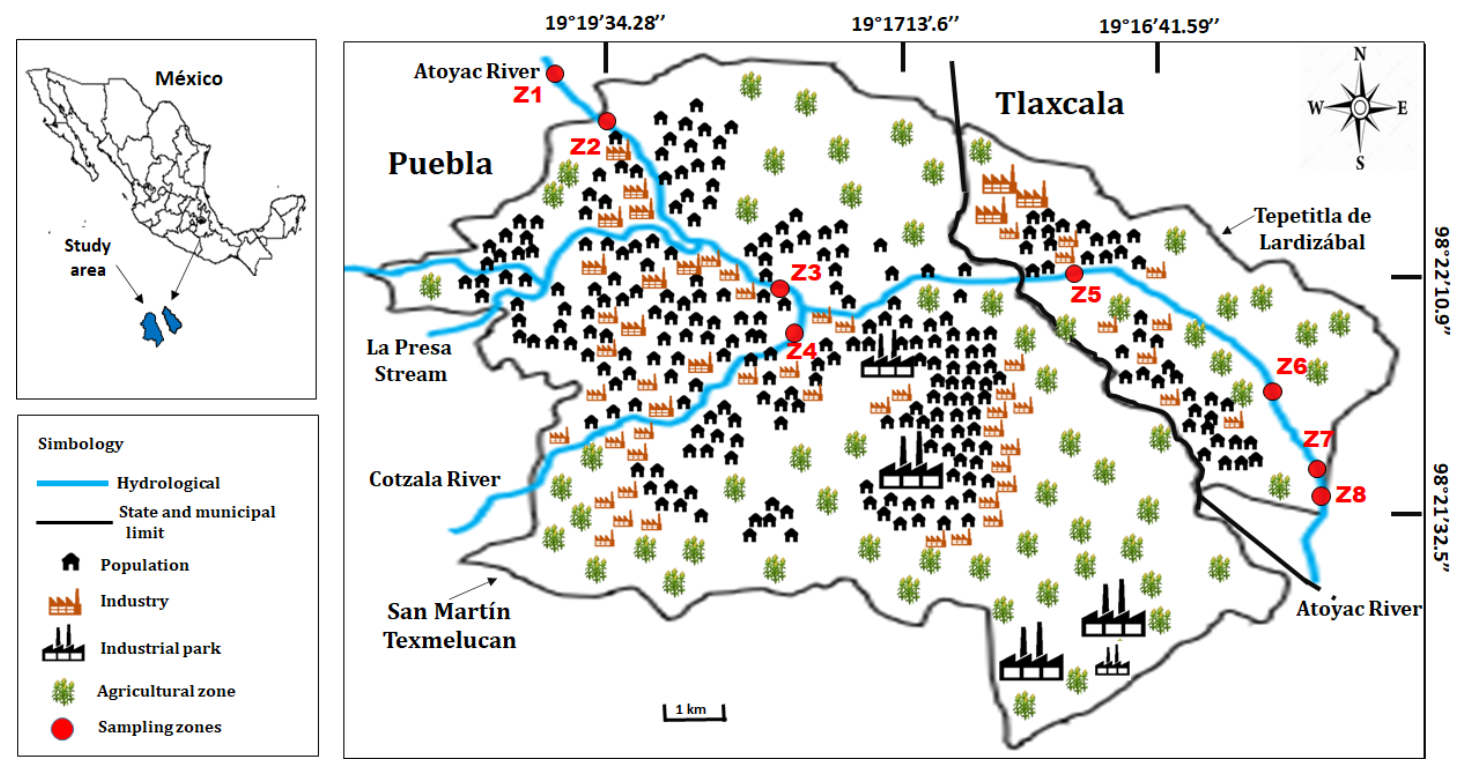
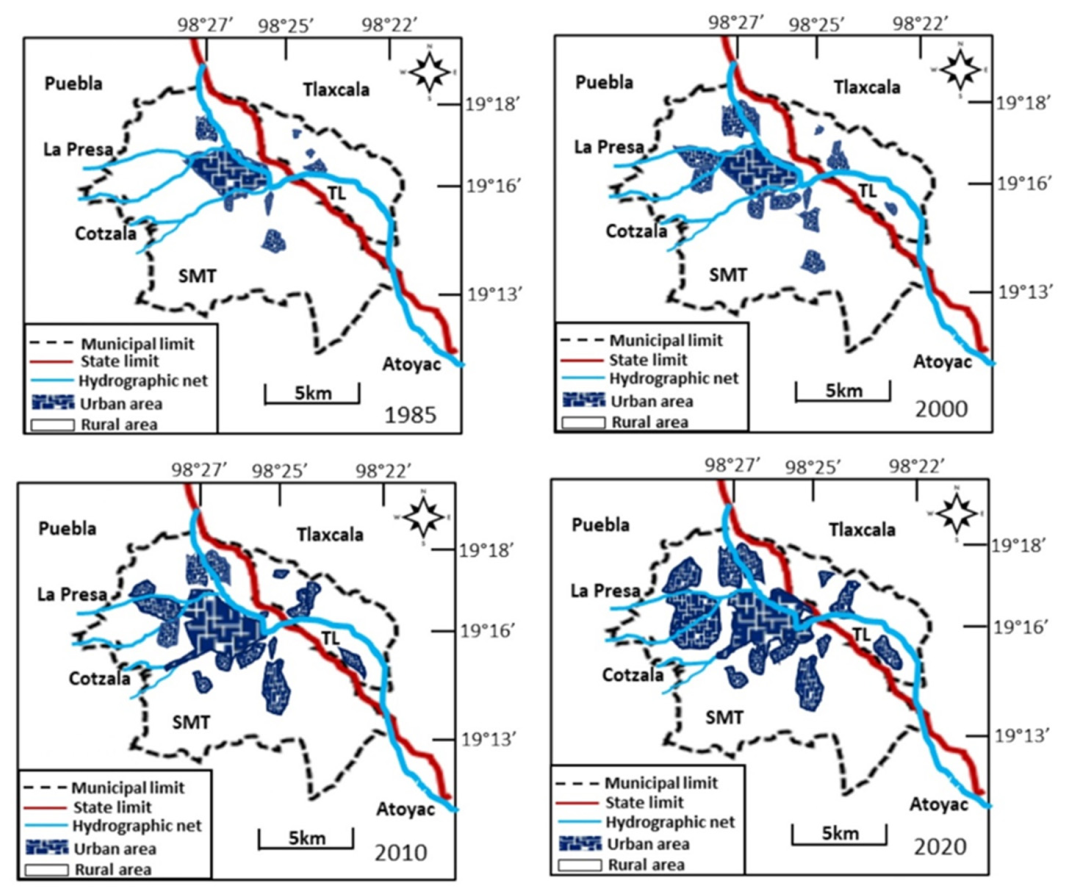
2.1. Area of Study

The Atoyac River belongs to the Alto Balsas basin [10]. It originates from the ice on the Iztaccíhuatl volcano in the state of Puebla-Mexico, melting at an altitude of 3250 m above sea level and measuring 84.97 km [10]. On its descent, the Atoyac River is divided into three sections; in the first section, the current runs through the state of Puebla (SMT) (~30 km), in the second it runs through Tlaxcala (TL) (~22 km) and then returns to Puebla (~32 km), where it is dammed at the Valsequillo dam [44]. The study was carried out in the municipalities of SMT and TL, located between the boundaries of the states of Puebla and Tlaxcala, respectively. Both municipalities are crossed entirely by the Atoyac River and belong to the Basin of the Alto Atoyac Balsas Hydrological Region (RH18). SMT has an area of 71.45 km2; its coordinates are latitude 19.2834 and longitude −98.4332 19°17′0″ north, 98°25′60″ west. Its altitude fluctuates between 2200 and 2500 m above sea level. The main localities of the study in SMT were San Martín Texmelucan Labastida (SMTL) and San Lucas el Grande (SLG), the latter belonging to the municipality of San Salvador el Verde but, for the purposes of this study, it is included in the SMT area because, though its population and area are very small, it is important as a point of reference given that the areas of study (Z1 and Z2) are in this town. TL has an area of 28.68 km2, its coordinates are latitude 19.2664 and longitude −98.3773 19°15′59″ north, 98°22′38″ west. Its altitude fluctuates between 2200 and 2500 m above sea level. The main towns of study were: San Mateo Ayecac (SMA), San Rafael Tenanyecac (SRT), Villa Alta (VA) and Tepetitla (T) [45,46] (Figure 1).

2.2. Industrial and Population Growth

The municipalities of SMT and TL began to develop an important industrial presence in 1970 due to public policies favoring industrialization and urban development; this development was consolidated in the 1980s. The data on the industries were obtained from the National Statistical Directory of Economic Units (DENUE) during 2019. The DENUE began its activities in 2010, and every five years since this date, the information is updated automatically; therefore, it is difficult to obtain records from previous years. It is published on the National Institute of Statistics and Geography (INEGI) website through a system that allows one to see the establishments that are georeferenced in digital cartography and satellite images. The industry presented was established in the 1970s and consolidated in the 1980s, with increases in subsequent decades [47]. They identified and quantified those economic units active in the geographical area of SMT and TL that, due to their productive activity, generate pollution and waste, among which are large, medium and small industries. Industrial complexes and corridors are also located (Figure 1); however, the DENUE does not count the industries located in those places. The main activities are textile, chemical, petrochemical, metalworking, food and paper. Additionally, microenterprises such as blacksmith shops, textile workshops and printing presses were considered, which are the source of various toxic substances such as metals, inks, solvents, dyes, acids and bases, among others. Microenterprises that are not registered in the DENUE [47], since they operate underground, are not included, as well as those that do not generate pollutants from their activity (Table 1).
The information on the population was obtained from the National Institute of Statistics and Geography (INEGI), the entity responsible for generating information every ten years on the volume, structure and spatial distribution of the population, as well as its main demographic, socioeconomic and cultural characteristics, both as a nation and by state. Population information was consulted in the [48,49] censuses in each town. For purposes of comparison, the population density of the period from 1980–2000 is presented. The estimate of population density was obtained by dividing the population by the area of the town (Table 2).
The degree of development of a population is a spatial concept that incorporates economic, population, social and ecological indicators, and is described according to the guidelines of [49], indicating that a “population is rural when it has less than 2500 inhabitants, its cost of living is low, they are dedicated to the production of raw materials, like agriculture, livestock and fishing, the nature that surrounds it does not suffer great damage, economic and technological resources are scarce.” It is considered urban when it is “made up of more than 2500 people, the population has better infrastructure, is surrounded by large-scale industrialization, produces all kinds of products and services, is exposed to greater pollution and the cost of living is high”. A conurbation is “that area that is not totally linked to the urban area itself, but rather is located on the periphery of it and its inhabitants depend on the urban axis” [50]. One of the crucial factors in defining the level of urbanization is the size and density of the population. To analyze the evolution suffered by urban and rural areas in the areas of study from 1985–2020, satellite images from Google Earth were used, as well as the Polygon Tool (Figure 2).

2.3. Water Samples

The Atoyac River runs a total length of 18.78 km (Figure 1) in SMT and TL. The quality of water in the Atoyac River has been measured by the National Water Commission [44], which is an administrative body of the Ministry of Environment and Natural Resources in Mexico, and has carried out, through the National Water Quality Measurement Network (RNM), the systematic monitoring of bodies of surface water since 2012. The dataset measured each month between 2012 and 2019 was used to characterize the change in water quality during rapid urbanization in the Alto Atoyac basin. The RNM measured the quality of water in SMT at four surface sites—three located in the Atoyac River (Z1, Z2 and Z3) and one in the Cotzala River (Z4), in the state of Puebla. In TL, water quality was measured at four surface sites located in the Atoyac River (Z5–Z8) in the state of Tlaxcala (Figure 1); two areas of study were not reported due to lack of data [43]. The RNM qualifies water quality as Excellent, Good, Acceptable, Polluted or Strongly Polluted; therefore, the highly polluted water will have an ICA near or equal to 0% and water with excellent quality will have an ICA near or equal to 100%. The surface water (ICA) looks at seven indicators, which are Five-day Biochemical Oxygen Demand (BOD5), Chemical Oxygen Demand (COD), Total Suspended Solids (TSS), Fecal Coliforms (FC), Escherichia coli, (E. coli) and Percentage of Oxygen Saturation (OD%); toxicity is also indicated in toxicity units (TU). Additionally, depending on the range in which it is located, each indicator is assigned a color, which indicates the degree of toxicity of the sample. Five water quality parameters were used in the study: BOD5, COD, TSS, FC and TU (OD and Escherichia coli parameters were not considered due to lack of data in area of study). The data of five parameters were taken into consideration, in eight sampling zones for 12 months over the course of eight years, equivalent to 3840 monthly records, and the annual average was quantified, equivalent to 320 records, to analyze the correlation between water quality and population, which represents a set of solid data to be analyzed.

2.4. Correlation Analysis

We used the (PI) to annually assess the impact of anthropogenic activities in each area of study of the Atoyac River on the water quality of the river [35,36,38,51], with the aim of analyzing the effect of the population and industry located in the basin on water quality. The formula given in Equation (1) was used to calculate the (PI) of water quality at each sampling site.
PI = 1 / m b = 0 m Cb / Co b = 1 ,   2 ,   ,   m
where PI is the Integrated Pollution Index, Cb is the actual value of the water quality parameter for each sample and Co is the water’s standard value (ICA). The average annual value of each of the five real parameters of water quality at each site, obtained by the RNM [43], was taken. The standard water quality values for each parameter were selected in the category of Excellent (drinking water). The m represents the number of parameters monitored.
The water integrated pollution index in surface water (PI) is classified into six categories (WPI), such as very Pure, when WPI ≤ 0.3, Pure, when WPI varied from 0.3 to 1.0, Moderately Polluted, when it varied between 1.0 and 2.0, Polluted, when WPI was between 2.0 and 4.0, Impure, when WPI varied from 4.0 to 6.0 and Heavily Impure, when WPI was >6 (Table 3). The quality of the PI can be classified into these classes according to the water pollution index (WPI) [38] (Table 3).
The contribution of each pollutant to the integrated pollution index of all pollutants was calculated as follows:
K i = C b C o P I Σ k b × 100
where Ki is the contribution of each substance to the integrated pollution index, Cb is the actual value of parameter b, Co is the standard value of parameter b and PI is the integrated pollution index.

2.5. Determination of Industrial Density

A key factor in defining the level of urbanization is industrial density (ID). The greater the economic and business activity in a territory, the greater the probability that more pollutants will be emitted into the environment. This parameter shows the relationship between the number of industries over the territory occupied by them (Table 1), and the formula of Equation (3) is applied:
ID = Num .   of   industries   in   the   town   × 100   Territory   in   km 2
With the results obtained, the PI of each area of study was correlated with the level of urbanization to identify the greatest negative effect on the quality of water in each town. Pearson’s correlation coefficient was used to analyze how the variables correlated with the population. Its values range from −1 to +1. The PI and ID data were analyzed using the Pearson correlation test with 0.01 significance, and the Minitab 19 statistical program was also used.

3. Results and Discussion

3.1. Population and Industrial Growth

According to the density of the population [48,49] and due to the process of conurbation between the municipal capitals and the communities in the 1990s, due to the growth of the secondary sector and population expansion, the population in the Alto Atoyac basin is defined as urban and is predominant (Table 2). Previous studies made a similar comparison [28,29,37]. In Table 1 and Table 2 and Figure 2, it is seen that in the same years of development and boom of industrial activity (1980–2020), the highest rates of population growth are recorded and the process of conurbation in the territory begins, which means the urban areas extend to more than one town and/or more than one administrative political unit to form a continuous urbanized space.
This information allows us to affirm that the profound social and economic transformations that have occurred in SMT and TL are largely related to the process of industrialization [28,37,52]. The population increase between 1980 and 2000, 2000 and 2010 and 2010 and 2020 in SMT was 13.9, 3.0 and 11.7%, respectively, and in TL it was 4.9, 6.8 and 12.5%, respectively. The largest population increase occurred from 1980 to 2000, with 13.9%, in SMT, which coincides with the rapid industrial growth of the area (Table 2), [28]. From 2000 to 2010, the population growth in SMT decreased while, in the following decade, it increased again in both municipalities.
In the area of study, a total of 479 polluting industries were identified, among which textile, metallurgical, petrochemical and metalworking industries stand out. The largest number of industries was in SMTL, followed by SRT and SLG, and the highest industrial density was 27.7 and 12.8 in the towns of SRT and SMA, respectively, which have similar territorial area and are equivalent to 2.47% of the territory occupied by SMTL (Table 1). When comparing industrial density with population density (Table 2), results are similar. It is worth noting that 189,687 people live in an area of 89.41 km2 and coexist with 479 polluting industries. Urban expansion due to industrial and population growth is accompanied by a gradual increase in the urbanized area, coupled with the diversification of economic activities which occurs in both municipalities and is reflected in the spatial changes in land coverage and use (Figure 2).
The main land coverage was the agricultural zone, urban area, industrial zone, vegetation and wetlands (1985). For the year 2010, a decrease in the agricultural area was seen over 1102.7 ha and the vegetation area lost 187.6 ha, while the human settlements and the industrial zone gained 1129.7 ha and 230.2 ha, respectively. It is important to mention that urban expansion occurs on agricultural, forest or water harvesting land, causing deterioration in natural ecosystems and affecting the resources that sustain productive activities. These results are due to the state, in the 1970s and 80s, seeking to attract new industries through tax exemption and the expropriation or acquisition of land, mostly agricultural, for the development of infrastructure (energy, mining, roads, tourism, real estate, commercial and recreational projects were privileged). As the change of use from agricultural land to housing was legitimized, a whole infrastructure was generated that would ensure economic development to the detriment of the quality of the water in the basin [52,53].

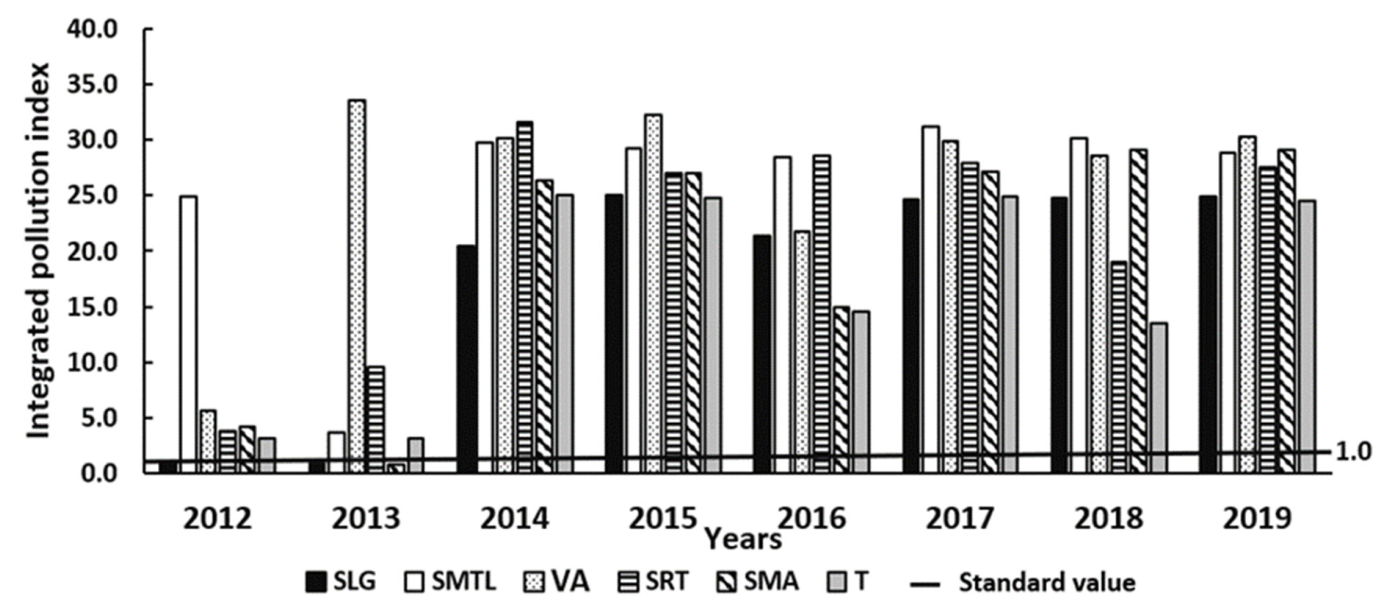
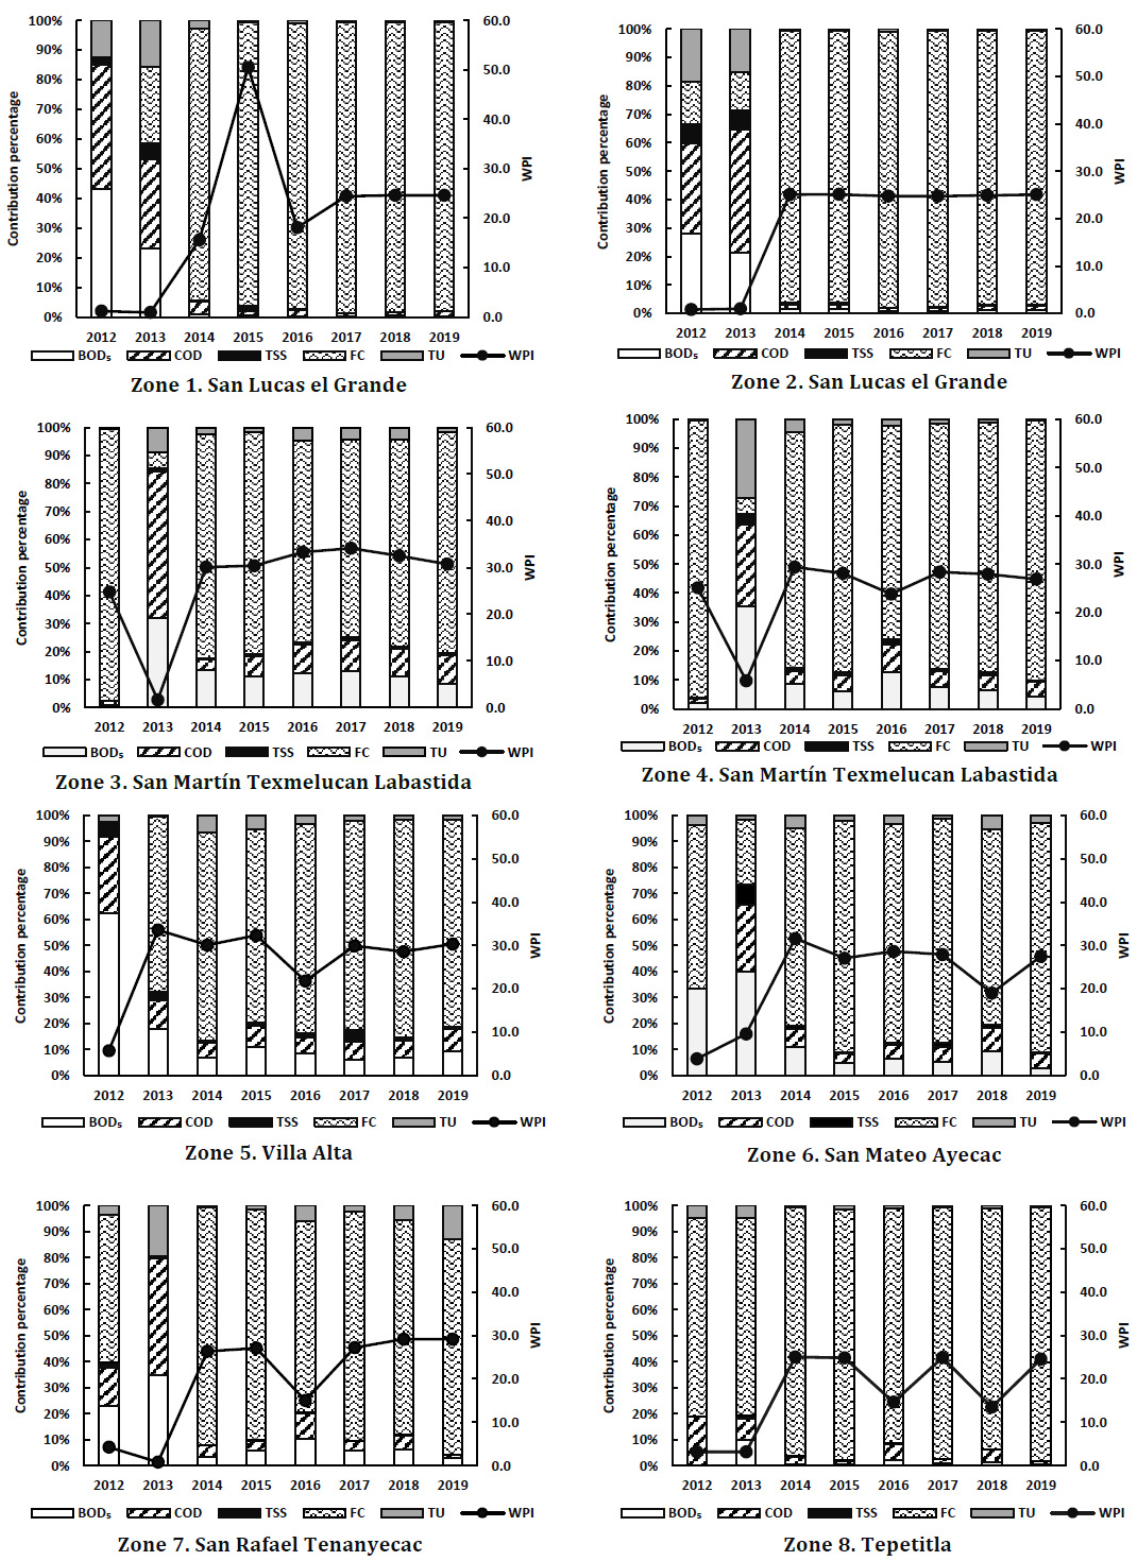
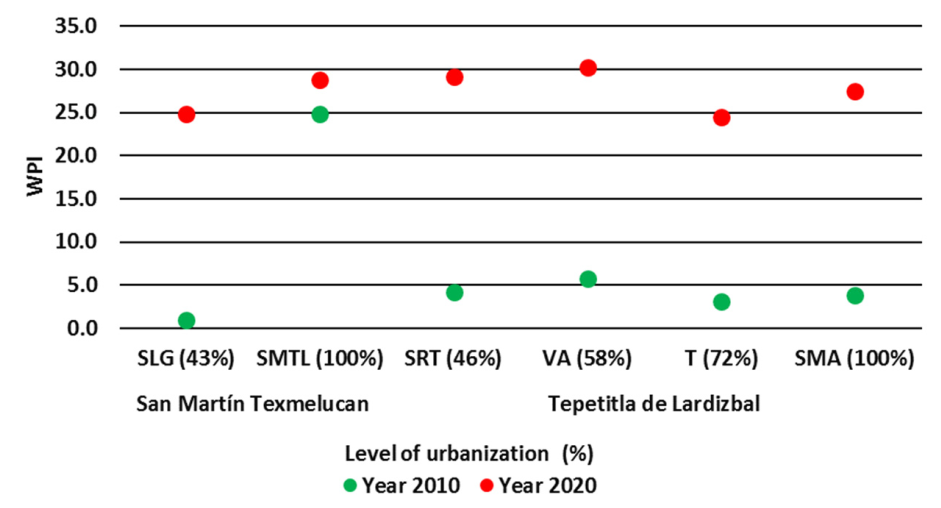
3.2. Temporal Trend in Water Quality

According to Section 2.2, the six towns of study are categorized as urban. Figure 3 presents the level of impact urbanization has on surface water quality during the 2012–2019 monitoring years in the Alto Atoyac basin. In the towns of San Lucas el Grande and San Martín Texmelucan, there are two sampling areas; the average value was calculated so that each town corresponded to a PI value.
The highest PI value (34.1) occurred in zone 5 during 2017 (Figure 3) and corresponds to the town Villa Alta of TL, probably due to the increase in microenterprises of the underground textile sector that produces highly toxic industrial waste, therefore impacting human health [28,29,34,37]. The lowest PI was seen in the towns of San Lucas el Grande and San Mateo Ayecac during the years 2012 (1.0) and 2013 (1.0–0.8) and belongs to class III, which means the quality of the water is moderately polluted and is within the standard value (Table 3), [38]. For the same period in the rest of the areas, the annual average varied between 25.1 and 6.0 and is highly polluted; except for the year 2013, zone 7 had 0.8 on the PI. As of 2014, in all towns, the PI increased and ranged between 13.5 and 34.1, exceeding the standard value between 1250 and 3310%, with a WPI belonging to class VI (Table 3), which means the water is highly polluted in all sampling areas of the basin. During 2016 and 2018, in some towns, the PI decreased; however, it is above the standard value. From 2017 to 2019, PI values are high and similar, implying that the contribution rate of pollutant loads for each category showed the highest PI values in recent years and is similar in all towns. This means that, in this section of the river, the load of BOD₅, COD, TSS, FC and TU surpasses the standard value between 1250 and 3310% and is constant, with slight variations. This implies that the river has lost its capacity for self-regeneration and the physical, chemical and biological phenomena that cause biodegradation of matter do not occur, because the oxidation rate of the organic matter by bacteria is greater than the supply of oxygen; therefore, the loads of BOD₅, COD, TSS, FC and TU do not decrease and remain constant (Figure 4). A similar result was obtained by J. Wang (2008) when identifying the impact of population on water quality [32].
In this study, the associations of the temporal variations in surface water quality (2012–2019) with spatial variations in land use and the urbanization process that brought with it an increase in population (2010–2020) by industrialization are seen (Table 2). The results indicate that in the Alto Atoyac basin, the impact of human activities is positively correlated with the decrease in water quality and coincides with the research of Chamara P. Lianage et al., 2017 [35]. The increase in population leads to an increase in the production and consumption of goods and services that leads to a greater demand for water, as well as a greater generation of wastewater, impacting the quantity and quality of environmental services as well as loss of biodiversity in the basin. This temporal pattern of the integrated pollution index is also similar to other studies [31,32,33,35,36].
Figure 5 presents the relationship between WPI and the level of urbanization in monitoring towns. The level of urbanization in each town was determined, taking as a reference the one with the highest population density by municipality, in this case SMTL in Puebla and SMA in Tepetitla de Lardizabal, Tlaxcala (Table 2). These towns represent 100% urbanization. The WPI increased with the passage of time in all the localities: SLG 0.0 to 25.0; SMTL 25.0 to 29.0; SRT 4.0 to 29.0; VA 6.0 to 30.0; T 3.5 to 24.0 and SMA 4.0 to 27.0 from 2010 to 2020, respectively.
To be more specific, we calculated the correlation coefficients between the five parameters in the six populations (Table 4).
The correlation coefficients between the five parameters (BOD5, COD, CF, TU and TSS) in the six localities were positive with the population. The values that showed a higher correlation with the population were: SLG (FC 0.86), SMTL (BOD5 0.61, COD 0.89, TSS 0.64) and SRT (TU 0.83), that corresponds to highly polluted localities, which generates complex and severe environmental implications due to the unsustainable management of water resources. In general, the values of the correlation coefficients between 1.0 and 0.5 may be considered to indicate a strong correlation [43]. The data used in the study suggested that the five parameters, BOD5, COD, TSS, FC and TU, may be used as a model, given that their correlation coefficient was greater than 0.5. The comparison of the results illustrates the relationship between population, industry and water quality in the basin. Additionally, it is seen in Table 4 that three parameters (BOD5, COD and TSS) of the five have the highest coefficient and belong to the town of SMTL (Figure 4). The highest correlation was seen in the COD parameter, which showed an increase of 31% regarding BOD5, 28% regarding TSS, 3% and 7% regarding the quality of FC and the degree of TU. These findings suggest that the town of SMTL has shown the greatest deterioration in water quality, in the period studied, by urban growth (Table 1 and Table 2).
The contribution of each pollutant to the WPI was calculated according to Equation (2). The results indicated that the main pollutants in the river were BOD5, COD, FC and TU and, to a lower level, the TSS that presents different trends of variation (Figure 4).
The increase in the number of FC and TU indicates considerable pollution from BOD5, which determines the degree of water pollution by biodegradable organic matter, both in domestic and industrial wastewater. During the years 2012–2013, the highest level of BOD5 and COD was 60% in SMTL in 2013 and Villa Alta in 2012, respectively, for underground textile industrial waste [28,37]. The level of FC varied in all areas, except in SMTL, where it was 100%. Since 2014, the level of BOD5 and COD has decreased; however, the level of fecal coliforms increased 80–100%, coinciding with the increase in the human population, which generates large amounts of organic matter susceptible to be degraded by bacteria. The standard WPI values obtained from 2014 to 2019 have remained constant with slight variations, which means, on one hand, that the water quality of the watershed is highly polluted due to the lack of efficient treatment of the municipal and industrial wastewater (Table 3 and Figure 4), making it unacceptable for any use [29,31]; on the other hand, the elevated concentrations of BOD₅, COD, TSS, FC and TU in the river exceed the natural self-cleansing of the ecosystem, and the low oxygen level impedes the biodegradation process of matter, so the river has lost its natural balance and has come to its environmental limit. Additionally, there are extrinsic factors in the basin, such as wastewater discharges characterized by their bacterial content, an increase in phosphate content and the presence of more than 50 toxic compounds (EPT, POC, VOC and PCB) and pathogenic microorganisms in water, sediment and agricultural soil due to the basin from the underground textile, petrochemical and metallurgical industries, among others, located outside of the basin [22,28,34].
Therefore, it is urgent that real measures be implemented that mitigate the environmental problem in the watershed. It is necessary to identify the origin of the pollutants, as well as to identify the origin of pollutants from underground discharges, and that competent authorities apply the laws with no restriction, together with the increase in wastewater treatment infrastructure. In this way, the sanitation processes of the wastewater would allow the reduction of polluted loads, not only by being dumped into natural watersheds, but rather through their reuse as an alternative hydric resource. The active participation of the local organized population is also imperative, with support from public and private institutions and the state. These measures will contribute significantly to achieving the appropriate and rational use of natural resources to achieve optimal and sustained production of these resources, with minimum damage to the environment, for the benefit of those living near the watershed and those linked to it.

3.3. Social, Economic, and Environmental Transformations

The pollution of the Alto Atoyac basin is historic, and the close relationship between society and nature is based on the role the basin has played over time. It has provided the local society with the materials and energy needed for its development. In the 16th to 18th centuries, it was used for textile works in Puebla and Tlaxcala. Then, in the 19th century, its waters were used as a source of energy to drive textile factories, and from the mid-20th century to date, it has been a sewer for all urban, industrial and agricultural waste, exceeding the maximum permissible limits that the river is capable of decomposing [54], as has been shown in this article.
Until the mid-20th century, in the basin, natural resources were controlled by the state or community, or simply were not controlled by anyone because they were understood to be common goods. Since the 1970s, natural resources have been privatized and assigned ownership and can be controlled and transferred, meaning the resource went from being a public good to being an economic good [28,52,53]. This situation favored, on the one hand, accelerated urban growth, together with a series of incentives, such as free access to resources, subsidies and tax extensions, low cost of exploitation concessions and incentives for the import and application of high-yield technologies, but was inadequate to achieve sustainability of natural resources, the application of subsidized exploitation rates and, to further aggravate this problem, we must add the lack of supervision and the application of a defective environmental regulation on the forms of exploitation of natural resources, in the specific case of water [55,56].
On the other hand, this process is characterized by the increasing concentration of the urban population, which operates through the growth of a conurbation that, over time, becomes part of existing urban areas, and/or new urban towns arise. It should be noted that, in 1990, the population in SMT and TL was 100,951 and 12,924 inhabitants, respectively, while in 2020, it reached 164,876 and 24,811, increasing 63.32 and 92%, respectively (Table 2); additionally, a need for food and goods was generated for the population. Consequently, the increase in industries, population and infrastructure increased the production of different products derived from this activity, such as heavy metals, hydrocarbons, pesticides, solvents, etc., which are emptied into the Atoyac River or municipal drains, causing serious problems to human health and the water system [11,12,13,14,15,20,27,28,29].

4. Conclusions

In this research, the impact of anthropogenic activities over eight years on the water quality in the Alto Atoyac watershed in the SMT and TL municipalities was analyzed, using the integrated pollution index, as well as a correlation analysis between the water quality parameters and population growth considering its impact on water resources and the severe transformations that the watershed has undergone.
The standard WPI values obtained from 2014 to 2019 have remained practically constant, which means that the water quality in the watershed is highly polluted, exceeding the natural self-cleansing of the ecosystem, so the river has lost its natural balance and has come to its environmental limit. All the parameters, including: Biochemical Oxygen Demand (BOD5), Chemical Oxygen Demand (COD), Total Suspended Solids (TSS), Fecal Coliforms (FC) and Toxicity Units (TU), were positively correlated with the population, suggesting that they can be used as indicators of urbanization. Three of them—BOD5, COD and TSS—presented a strong correlation in SMTL. This shows that it is the location with the greatest degradation in water quality due to urban growth. The comparison of the results illustrates the relationship between population, industry and water quality in the basin.
Industrial development leads to a strong socioeconomic reactivation and improvements in the individual’s quality of living; on the other hand, it may cause the imbalance of ecosystems, various forms of pollution and other environmental and social problems, such as in the Alto Atoyac watershed in the SMT and TL municipalities, where industrial development has not been compatible with the sustainability of the watershed. The urbanization process has a direct impact on the use of the land, which has shown over time a disorderly land development incongruous with the proper environmental sustainability process. In particular, the results during the period analyzed were the reduction of the agricultural zone and the expansion of the urban and industrial zones, which led to the decline in primary activities for the benefit of the secondary and tertiary sectors. The urbanization process also leads to strong disruptions in the ecosystems and in the water cycle. It eliminates the natural vegetation and impacts biodiversity. Intensive growth of cities may generate more poverty, implying problems of socioeconomic imbalance, going as far as the overexploitation of resources, the inequality of expenses and a severe degradation of the environment.

Author Contributions

A.H.-S. conceived the project, designed the experiments and wrote the paper; A.E.-R. performed the experiments; A.D.F., S.T.M., W.A.G.S., R.C.V., J.L.M.P. and E.C.B. analyzed the data. All authors have read and agreed to the published version of the manuscript.

Funding

This research was funded by Vicerrectoria de Investigación y Estudios de Posgrado (VIEP) 100089811-VIEP2021 of the Benemérita Universidad Autónoma de Puebla (BUAP).

Institutional Review Board Statement

Not applicable.

Informed Consent Statement

Not applicable.

Data Availability Statement

The study did not report any data.

Acknowledgments

Andrés Estrada Rivera thanks the National Council of Science and Technology (CONACYT) for the scholarship awarded (601562). The costs of publishing in open access were covered by the Program for Teacher Professional Development (PRODEP) of the Ministry of Public Education of Mexico (SEP).

Conflicts of Interest

The authors declare they have no conflict of interest.

References

  1. PNUD. Informe Sobre Desarrollo Humano. Sostener el Progreso Humano: Reducir la Vulnerabilidad y Construir Resiliencia. PNUD. Estados Unidos. 2014. Available online: https://www.undp.org/content/undp/es/home/librarypage/hdr/2014-human-development-report.html (accessed on 3 May 2021).
  2. McNeill, J.R. Population and the Natural Environment: Trends and Challenges. Popul. Dev. Rev. 2006, 32, 183–201. [Google Scholar] [CrossRef]
  3. Garrocho, C. Dinámica de las Ciudades de México en el Siglo XXI. Cinco Vectores Clave Para el Desarrollo Sostenible. 2013. Available online: https://www.researchgate.net/publication/297691243_Dinamica_de_las_ciudades_de_Mexico_en_el_siglo_XXI (accessed on 29 April 2021).
  4. SEDATU. Secretaría de Desarrollo Agrario, Territorial y Urbano. Programa Nacional de Desarrollo Urbano y Ordenamiento del Territorio. 2013. Available online: http://www.dof.gob.mx/nota_detalle.php?codigo=5326473&fecha=16/12/2013 (accessed on 29 April 2021).
  5. ONU-Hábitat México. Índice de Prosperidad Urbana en la República Mexicana. Reporte Nacional de Tendencias de la Prosperidad Urbana en México. 2016. Available online: http://www.onuhabitat.org.mx/images/onu-habitat/cpi/CPI-Reporte-Ciudades-Mexico-2016.pdf (accessed on 23 April 2021).
  6. ONU-Hábitat México. Índice de las Ciudades Prósperas. 2018. Available online: http://www.onuhabitat.org.mx/index.php/indice-de-las-ciudades-prosperas-cpi-mexico-2018 (accessed on 23 April 2021).
  7. SEMARNAT, DGEIA. 2010. Available online: http://dgeiawf.semarnat.gob.mx:8080/ibi_apps/WFServlet?IBIF_ex=D2_R_INDUSTRIA01_01&IBIC_user=dgeia_mce&IBIC_pass=dgeia_mce (accessed on 3 May 2021).
  8. SEMARNAT (Secretaría de Marina y Recursos Naturales). Estadísticas del Agua en la Cuenca del Río Balsas. Comisión Nacional del Agua Organismo de Cuenca Balsas. 2010. Available online: http://centro.paot.org.mx/documentos/conagua/RIO_BALSAS_.pdf (accessed on 10 April 2021).
  9. CONAGUA (Comisión Nacional del Agua). Actualización de la Disponibilidad Media Anual del Agua en el Acuífero del Valle de Puebla. Estado de Puebla. 2018. Available online: https://sigagis.conagua.gob.mx/gas1/Edos_Acuiferos_18/puebla/DR_2104.pdf (accessed on 10 April 2021).
  10. Diario Oficial de la Federación (DOF). ACUERDO Por el Que se Dan a Conocer Los Estudios Técnicos de Aguas Nacionales Superficiales de la Región Hidrológica Número 18 Balsas, México. 2010. Available online: http://dof.gob.mx/nota_detalle_popup.php?codigo=5175730 (accessed on 23 May 2021).
  11. Montero, R. La Contaminación en el río Atoyac, Problema Ecológico y Sanitario. Boletín UNAM-DGCS-507. 2012. Available online: https://www.dgcs.unam.mx/boletin/bdboletin/2012_507.html (accessed on 10 April 2021).
  12. Núñez, E. El Atoyac el Segundo Río Más Contaminado de México. La Jornada de Oriente. 2020. Available online: https://www.lajornadadeoriente.com.mx/puebla/el-atoyac-es-el-segundo-rio-mas-contaminado-de-mexico-diagnostica-beatriz-manrique/#:~:text=Econom%C3%ADa%20y%20Ecolog%C3%ADa-,El%20Atoyac%20es%20el%20segundo%20r%C3%ADo,de%20M%C3%A9xico%2C%20diagnostica%20Beatriz%20Manrique&text=Con%208%20mil%20109%20empresas,Guevara%2C%20secretaria%20de%20Medio%20Ambiente (accessed on 29 April 2021).
  13. Castro-González, N.P.; Calderón-Sánchez, F.; Moreno-Rojas, R.; Tamariz-Flores, J.V.; Reyes-Cervantes, E. Nivel de contaminación de metales y arsénico en aguas residuales y suelos en la subcuenca del Alto Balsas en Tlaxcala y Puebla, México. Rev. Int. Contam. Ambie. 2019, 35, 335–348. Available online: https://www.revistascca.unam.mx/rica/index.php/rica/article/viewFile/RICA.2019.35.02.06/46830 (accessed on 29 April 2021). [CrossRef]
  14. Instituto Mexicano de Tecnología del Agua (IMTA). Estudio de Clasificación del río Atoyac, Puebla-Tlaxcala. Informe Final. 2005. Available online: https://www.imta.gob.mx/images/pdf/informes-anuales/informe2005/presentacion.pdf (accessed on 10 April 2021).
  15. Bravo-Inclán, L.; Izurieta-Dávila, J.; Sánchez- Chávez, J.; Saldaña-Fabela, P.; Ordoñez, F.A.; Ruiz, L.A.; Cortés, M.J.; Ruiz, L.A.; Mijangos, C.M.; Sandoval, V.A. Estudio de Clasificación del río Atoyac, Puebla–Tlaxcala. Subcoordinación de Hidrobiología y Evaluación Ambiental. Coordinación de Tratamiento y Calidad del Agua. IMTA, SEMARNAT (Convenio CNA-IMTA-SGT.GRB.MOR-05-004-RF). Jiutepec, Mor. 2005. Available online: http://www.amica.com.mx/issn/archivos/183.pdf (accessed on 14 April 2021).
  16. Muñoz, H.; Suárez, J.; Vera, A.; Orozco, S.; Batlle, J.; Ortiz, A.J.; Mendiola, J. Demanda bioquímica de oxígeno y población en la subcuenca del Río Zahuapan, Tlaxcala, México. Rev. In. Contam. Ambiental. 2012, 28, 27–38. Available online: http://www.scielo.org.mx/pdf/rica/v28n1/v28n1a3.pdf (accessed on 10 April 2021).
  17. Rodríguez, L.; Morales, J.A. Contaminación del Atoyac, Daños Ambientales y Tecnologías de Mitigación, 1st ed.; MA Porrúa: Mexico City, México, 2014; pp. 7–87. ISBN 978-607-28-0329-9. [Google Scholar]
  18. Villasana, S.; María, A.; Pulido-Flores, G.; Monks, S.; Martínez, G.; José, A.; Villareal, V.; Cristina, E. Evaluación fisicoquímica, microbiológica y toxicológica de la degradación ambiental del río Atoyac, México. Interciencia 2009, 34, 880–887. Available online: http://ve.scielo.org/scielo.php?script=sci_arttext&pid=S0378-18442009001200009&lng=es&tlng=es (accessed on 14 April 2021).
  19. Rodríguez, L.; Morales, J.; Zavala, P. Evaluación socioeconómica de daños ambientales por contaminación del Río Atoyac en México. TyCA-RETAC 2012, 3, 143–151. Available online: http://www.redalyc.org/articulo.oa?id=353531980010 (accessed on 10 February 2021).
  20. Montero, R.; Serrano, L.; Araujo, A.; Dávila, V.; Ponce, J.; Camacho, R.; Morales, E.; Méndez, A. Increased cytogenetic damage in a zone in transition from agricultural to industrial use: Comprehensive analysis of the micronucleus test in peripheral blood lymphocytes. Mutagenesis 2006, 21, 335–342. [Google Scholar] [CrossRef]
  21. Martinez, E.; Rodríguez, P.F.; Shruti, V.C.; Sujitha, S.; Morales, S.; Muñoz, N. Monitoring the seasonal dynamics of physicochemical parameters from Atoyac River basin (Puebla), Central Mexico: Multivariate approach. Environ. Earth Sci. 2017, 76, 95. Available online: https://link.springer.com/article/10.1007/s12665-017-6406-2 (accessed on 15 April 2021). [CrossRef] [Green Version]
  22. Programa de Apoyo al Desarrollo Hidráulico de los Estados de Puebla, Oaxaca y Tlaxcala, Reporte final. Instituto de Ingeniería UNAM. México. 2012. Available online: http://www.agua.unam.mx/padhpot/assets/cdh/generales/Reportefinal_formulacion_200812.pdf (accessed on 14 April 2021).
  23. Pérez Castresana, G.; Tamariz Flores, V.; López Reyes, L.; Hernández Aldana, F.; Castelán Vega, R.; Morán Perales, J.L.; García Suastegui, W.A.; Díaz Fonseca, A.; Handal Silva, A. Atoyac River Pollution in the Metropolitan Area of Puebla, México. Water 2018, 10, 267. [Google Scholar] [CrossRef] [Green Version]
  24. Navarro, I.; Flores, E.; Valladares, R. Evaluación Ambiental y Epidemiológica para Identificar Factores de Riesgo a la Salud Por Contaminación del Río Atoyac, México. BVSDE. 2003. Available online: http://www.bvsde.paho.org/bvsAIDIS/PuertoRico29/navarro.pdf (accessed on 10 February 2021).
  25. Novelo, M.; Armando, J.; Tapia, R.; Torres, L.; Francisco, A. Modelo de Contaminación del río Atoyac e Incidencia de Enfermedades en la región Puebla-Tlaxcala. Coordinación de Tratamiento y Calidad del Agua. IMTA, SEMARNAT (Convenio CNA-IMTA-SGT.GRB.MOR-05-004- RF). Jiutepec, Mor. 2005. Available online: http://www.amica.com.mx/issn/archivos/113.pdf (accessed on 14 April 2021).
  26. Pérez Castresana, G.; Castaneda Roldán, E.; García Suastegui, W.A.; Morán Perales, J.L.; Cruz Montalvo, A.; Handal Silva, A. Evaluation of Health Risks due to Heavy Metals in a Rural Population Exposed to Atoyac River Pollution in Puebla, Mexico. Water 2019, 11, 277. [Google Scholar] [CrossRef] [Green Version]
  27. Montero-Montoya, R.D.; López-Vargas, R.; Méndez-Serrano, A.; Galicia-Alonso, I.; García-Vargas, G.; Serrano-García, L.; Beltrán-Portugal, R.; Rosado-Zaidi, S.; Albores-Medina, A.; Oropeza-Hernández, L.; et al. Increased micronucleus frequencies in reticulocytes of children exposed to industrial pollution: Oxidative stress and the OGG1 S326C polymorphism. Mutat. Res./Genet. Toxicol. Environ. Mutagenesis 2020, 853, 503170. [Google Scholar] [CrossRef]
  28. Tomé, G.; Méndez, J.; Ramirez, J.; Pérez, N. Territorial Socioeconomic Transformations in the Municipality of San Martín Texmelucan, México 1980–2010. 2017. Available online: http://www.scielo.org.mx/pdf/ns/v9n18/2007-0705-ns-9-18-00437.pdf (accessed on 5 April 2021).
  29. Ventura, M.T. La industrialización en Puebla, México, 1835–1976. In Proceedings of the XII Encuentro de Latinoamericanistas Españoles, Santander, España, 21–23 September 2006; Consejo Español de Estudios Iberoamericanos. HAL-SHS: Santander, Spain, 2006; pp. 650–652. Available online: https://halshs.archives-ouvertes.fr/halshs-00103437/document (accessed on 3 April 2021).
  30. Groppo, J.D.; de Moraes, J.M.; Beduschi, C.E.; Genovez, A.M.; Martinelli, L.A. Trend analysis of water quality in some rivers with different degrees of development within the São Paulo State, Brazil. River Res. Appl. 2008, 24, 1056–1067. [Google Scholar] [CrossRef]
  31. Tang, Z.; Engel, B.A.; Pijanowski, B.C.; Lim, K.J. Forecasting land use change and its environmental impact at a watershed scale. J. Environ. Manag. 2005, 76, 35–45. [Google Scholar] [CrossRef]
  32. Wang, J.; Da, L.; Song, K.; Li, B.-L. Temporal variations of surface water quality in urban, suburban and rural areas during rapid urbanization in Shanghai, China. Environ. Pollut. 2008, 152, 387–393. [Google Scholar] [CrossRef] [PubMed]
  33. Deng, X.; Xu, Y.; Han, L.; Song, S.; Yang, L.; Li, G.; Wang, Y. Impacts of Urbanization on River Systems in the Taihu Region, China. Water 2015, 7, 1340–1358. [Google Scholar] [CrossRef]
  34. Instituto Nacional de Ecología, Sistema Integrado de Regulación Directa y Gestión Ambiental de la Industria, Segunda Edición, SEMARNAP/INE, México. 1997. Available online: http://centro.paot.org.mx/documentos/ine/taller_internacional_practicas_certificacion_ambiental.pdf (accessed on 3 May 2021).
  35. Liyanage, C.P.; Yamada, K. Impact of Population Growth on the Water Quality of Natural Water Bodies. Sustainability 2017, 9, 1405. [Google Scholar] [CrossRef] [Green Version]
  36. McGrane, S.J. Impacts of urbanization on hydrological and water quality dynamics, and urban water management: A review. Hydrol. Sci. J. 2016, 61, 2295–2311. [Google Scholar] [CrossRef]
  37. Vallejo Román, J. Talleres de Mezclilla y Transformaciones Socioambientales en un Municipio Rural. El caso de Tepetitla de Lardizábal, Tlaxcala, México Sociedad y Ambiente. Available online: https://www.redalyc.org/pdf/4557/455748464005.pdf (accessed on 3 May 2021).
  38. Miljašević, D.; Milanović, A.; Brankov, J.; Radovanović, M. Water quality assessment of the Borska Reka river using the WPI (water pollution index) method. Arch. Biol. Sci. 2011, 63, 819–824. [Google Scholar] [CrossRef]
  39. SEMARNAP. Gestión Ambiental Hacia la Industria. 2000. Available online: http://www.paot.org.mx/centro/ine-semarnat/libro_blanco%20semarnap.pdf (accessed on 3 May 2021).
  40. SEMARNAT. Integración y actualización del Inventario Nacional de Generación de Residuos Peligrosos. 2010. Available online: https://biblioteca.semarnat.gob.mx/janium/Documentos/Ciga/libros2009/CD001026.pdf (accessed on 3 May 2021).
  41. Adimalla, N.; Li, P. Occurrence, health risks, and geochemical mechanisms of fluoride and nitrate in groundwater of the rock-dominant semi-arid region, Telangana State, India. Hum. Ecol. Risk Assess. Int. J. 2019, 25, 81–103. [Google Scholar] [CrossRef]
  42. Tyagi, S.; Sharma, B.; Singh, P.; Dobhal, R. Water quality assessment in terms of water quality index. Am. J. Water Resour. 2013, 1, 34–38. [Google Scholar] [CrossRef]
  43. Comisión Nacional de Agua (CONAGUA). Red Nacional de Monitoreo (RNM) de La Calidad de Las Aguas. México. 2016. Available online: http://catalogo.datos.gob.mx/dataset/red-nacional-de-monitoreo-de-lacalidad-de-las-aguas-nacionales (accessed on 25 April 2021).
  44. Comisión Nacional de Agua. Atlas del Agua en México. 2016. Available online: http://201.116.60.25/publicaciones/AAM_2016.pdf (accessed on 8 April 2021).
  45. INEGI (Instituto Nacional de Geografía e Informática). San Martín Texmelucan Cuaderno Municipal. 1993. ISBN: 970-13-0038-6. Available online: http://internet.contenidos.inegi.org.mx/contenidos/productos/prod_serv/contenidos/espanol/bvinegi/productos/historicos/181/702825921903/702825921903.pdf (accessed on 5 August 2021).
  46. Mapawi. Información Sobre la Ciudad en San Cristobal Tepatlaxco. 2020. Available online: https://es.wikipedia.org/w/index.php?title=San_Crist%C3%B3bal_Tepatlaxco&action=edit&redlink=1 (accessed on 14 April 2021).
  47. Instituto Nacional de Estadística y Geografía. Directorio Estadístico Nacional de Unidades Económicas 2020, Datos a Noviembre de 2020. Available online: https://www.inegi.org.mx/rnm/index.php/catalog/587 (accessed on 3 May 2021).
  48. Instituto Nacional de Estadística y Geografía. Censo de Población y Vivienda 2020. Available online: https://inegi.org.mx/programas/ccpv/2020/ (accessed on 13 May 2021).
  49. Instituto Nacional de Estadística y Geografía. Informe 2010 Actividades y Resultados. Available online: https://www.snieg.mx/contenidos/espanol/inegi_coord/Informe/INFORME2010.pdf (accessed on 13 May 2021).
  50. Definición de Población Urbana y Rural Utilizadas en los Censos de los países Latinoamericanos. CEPAL. Available online: https://www.cepal.org/sites/default/files/def_urbana_rural.pdf (accessed on 13 May 2021).
  51. Lyulko, I.; Ambalova, T.; Vasiljeva, T. To Integrated Water Quality Assessment in Latvia. MTM (Monitoring Tailor-Made) III. In Proceedings of the International Workshop on Information for Sustainable Water Management, Nunspeet, The Netherlands, 25–28 September 2000; pp. 449–452. [Google Scholar]
  52. Sobrino, J. La Urbanización en el México Contemporáneo, En: Reunión de Expertos Sobre: Población Territorio y Desarrollo Sostenible. Santiago, 16–17 de Agosto 2011. Naciones Unidas. CEPAL/CELADE. Available online: https://www.cepal.org/sites/default/files/events/files/jaime_sobrino.pdf (accessed on 30 June 2021).
  53. Castree, N. Neoliberalising Nature: The Logics of Deregulation and Reregulation. Environ. Plan. A 2008, 40, 131–152. [Google Scholar] [CrossRef] [Green Version]
  54. Juárez-Santacruz, L.; García-Nieto, E.; Costilla-Salazar, R.; García-Gallegos, E.; Coronel-Olivares, C.; Gómez-Camarillo, A.M.; Gaytán-Oyarzún, J.C. Soil and Sediment Contamination: An International Journal. Soil Sediment Contam. 2013, 22, 288–300. [Google Scholar] [CrossRef]
  55. Pérez, C.E. Hacia una Nueva Visión de lo Rural. En ¿Una Nueva Ruralidad en América Latina? Compilado por Norma Giarracca, 17–29. Colección Grupos de Trabajo de CLACSO. Desarrollo Rural, CLACSO, Buenos Aires. 2001. Available online: http://biblioteca.clacso.edu.ar/clacso/gt/20100929125458/giarraca.pdf (accessed on 8 May 2021).
  56. Handal-Silva, A.; Pérez-Castresana, G.; Morán-Perales, J.L.; García Suastegui, W. Historia de la Contaminación Hídrica del Alto Balsas. Revista del Desarrollo Urbano y Sustentable. 2017. Available online: https://www.ecorfan.org/bolivia/researchjournals/Desarrollo_Urbano_y_Sustentable/vol3num9/Revista_del_Desarrollo_Urbano_y_Sustentable_V3_N9_2.pdf (accessed on 3 May 2021).
Figure 1. Alto Atoyac hydrological basin with water sampling area [43,47].
Sustainability 14 00667 g001
Figure 2. Increase in the urban area in the study area from 1985 to 2020. Own elaboration.
Sustainability 14 00667 g002
Figure 3. Temporal pattern of the integrated pollution index to urbanization level.
Sustainability 14 00667 g003
Figure 4. Annual average WPI (Water Pollution Index) and relative contributions of each pollutant to WPI in the Atoyac River.
Sustainability 14 00667 g004
Figure 5. Relation between the integrated pollution index and the level of urbanization [47,48]. considering the increment of population in 2010 and 2020.
Sustainability 14 00667 g005
Table 1. Industrial density in the localities of the hydrological basin.
StateLocalitySampling
Areas
Area
(km2)
Industry TypeNumber of
Industries
[47]
Industrial
Density
FoodMetallurgyPaper industryChemical industryTextile
PueblaSan Lucas el GrandeZ1, Z25.87111-26457.8
San Martín Texmelucan L.Z3, Z471.451310237111663294.6
TlaxcalaVilla AltaZ55.6729227223.9
San Mateo AyecacZ61.17-21-121512.8
San Rafael TenanyecacZ71.77-3--464927.7
TepetitlaZ83.55-21-16195.4
Table 2. Population and its density in the municipalities of the Atoyac River basin.
StateLocSampling AreasArea (km2)Pop.
(1980)
Density (1980)Pop. (1990)Density (1990)Pop. (2000)Density (2000)Pop.
(2010)
Density (2010)Pop. (2020) [46].Density (2020)
PueblaSLGZ1-Z25.8SISI64801117.271831238.485461473.491381575.5
SMTLZ3-Z471.4579,5041112.794,4711322.2121,0711694.5141,1221975.1155,7382179.7
TlaxcalaVAZ55.67SISI2844501.63937694.359741053.677561367.9
SMAZ61.17SISI18961620.523522010.33366287744013762
SRTZ71.7SISI19571105.624631391.52699152530481722
TZ83.55SISI62271754.174052085.98316234296062706
Note: Loc = Locality. SLG = San Lucas el Grande. SMTL = San Martín Texmelucan Labastida. T = Tepetitla. VA = Villa Alta. SMA = San Mateo Ayecac. SRT = San Rafael Tenanyecac. Pop = Population. SI = Without information. Density = Inhabitants/km2.
Table 3. Water quality classification according to WPI.
ClassCharacteristicsWPI
IVery pure≤0.3
IIPure0.3–1.0
IIIModerately polluted1.0–2.0
IVPolluted2.0–4.0
VImpure4.0–6.0
VIHeavily impure>6
Table 4. Correlation coefficients of quality parameters and population.
ParametersCorrelation Coefficients (p < 0.01)Locality Number
BOD50.612
COD0.892
TSS0.642
FC0.861
TU0.835
1 SLG = San Lucas el Grande; 2 SMTL = San Martín Texmelucan Labastida; 5 SRT = San Rafael Tenanyecac.
Publisher’s Note: MDPI stays neutral with regard to jurisdictional claims in published maps and institutional affiliations.

