Article

An Optimized Clustering Approach to Investigate the Main Features in Predicting the Punching Shear Capacity of Steel Fiber-Reinforced Concrete

by
Shaojie Zhang
1,
Mahdi Hasanipanah
2,*,
Biao He
3,
Ahmad Safuan A. Rashid
4,
Dmitrii Vladimirovich Ulrikh
5 and
Qiancheng Fang
6,*
1
School of Teaching and Research Office, ZhengZhou Industry Technicians College, Zhengzhou 451100, China
2
Institute of Research and Development, Duy Tan University, Da Nang 550000, Vietnam
3
Department of Civil Engineering, Faculty of Engineering, Universiti Malaya, Kuala Lumpur 50603, Malaysia
4
Faculty of Civil Engineering, Universiti Teknologi Malaysia, Johor Bahru 81310, Johor, Malaysia
5
Department of Urban Planning, Engineering Networks and Systems, Institute of Architecture and Construction, South Ural State University, 454080 Chelyabinsk, Russia
6
Institute of Architecture Engineering, Huanghuai University, Zhumadian 463000, China
*
Authors to whom correspondence should be addressed.
Sustainability 2022, 14(19), 12950; https://doi.org/10.3390/su141912950
Submission received: 3 September 2022 / Revised: 30 September 2022 / Accepted: 5 October 2022 / Published: 10 October 2022

Abstract

:
We developed an optimized system for solving engineering problems according to the characteristics of data. Because data analysis includes different variations, the use of common features can increase the performance and accuracy of models. Therefore, this study, using a combination of optimization techniques (K-means algorithm) and prediction techniques, offers a new system and procedure that can identify and analyze data with similarity and close grouping. The system developed using the new sparrow search algorithm (SSA) has been updated as a new hybrid solution to optimize development engineering problems. The data for proposing the mentioned techniques were collected from a series of laboratory works on samples of steel fiber-reinforced concrete (SFRC). To investigate the issue, the data were first divided into different clusters, taking into account common features. After introducing the top clusters, each cluster was developed using three predictive models, i.e., multi-layer perceptron (MLP), support vector regression (SVR), and tree-based techniques. This process continues until the criteria are met. Accordingly, the K-means–artificial neural network 3 structure shows the best performance in terms of accuracy and error. The results also showed that the structure of hybrid models with cluster numbers 2, 3, and 4 is higher than the baseline models in terms of accuracy for assessing the punching shear capacity (PSC) of SFRC. The K-means–ANN3-SSA generated a new methodology for optimizing PSC. The new proposed model/procedure can be used for a similar situation by combining clustering and prediction methods.

1. Introduction

Reinforced concrete slabs can be used in different civil engineering projects such as office blocks, residential buildings, and parking stations; the structure produced by two-way poured-in-place concrete slabs can offer an economical structural system for architects and also engineers [1,2]. Rebar as well as formwork can be installed easily by different features of the reinforced concrete slabs such as flat soffit [3]. In addition, the total height of the story can be reduced due to these structures. Several researchers have worked on the reactions of such structures in experimental and theoretical studies due to the benefits of flat slabs produced from the reinforced concrete [4,5,6]. The available literature shows that the slab–column connections have a striking shear capacity, as the highest strength of a reinforced concrete flat slab is usually determined [1]. On the other hand, a slab has a significantly lower residual strength after punching than the punching load. Thus, after the slab is punched at one of the columns, one can overload the adjacent columns rapidly, and the failure state can be developed once it is punched, resulting in the increasing breakdown of buildings using flat slab components [1]. Several building collapses were reported due to the failure of punching, leading to deaths and also significant economic loss. For instance, Schousboe [7] reported the collapse of a 24-story building in 1973 in Virginia once it was constructed. The investigations of the incident reported that a shear failure in the slab component used on one of the top floors caused the collapse. In addition, King and Delatte [8] reported that a building complex with 16 stories in the U.S. broke down due to the very low punching shear strength of the flat slab component. These cases of collapse can be prevented, as shown in several studies that recently focused on the failure mechanism of such structures for improvement of the PSC of slabs and improvement of the design process of flat slabs, as shown in the conventional empirical equations. On the other hand, the popularity of steel fibers has increased in structural engineering [9]. Hence, the PSC of concrete flat slabs can be improved using fibers with such reinforcement in them [10,11,12]. It is also worth noting that some experimental studies (e.g., [3]) have shown that the PSC can be improved by using steel fibers to reinforce concrete flat slabs. As a result, steel fiber-reinforced concrete flat slabs have been applied widely in different engineering building projects. However, the slab–column connection has one important issue: the initial creation of the design codes which are presently followed for such structures (e.g., the ACI 318-11 standard [13]) for conventional concrete buildings. For that reason, the current codes should be modified to comply with the design process related to the steel fiber-reinforced concrete (SFRC) slabs. In this respect, an equation was proposed by Narayanan and Darwish [14] based on the strength of the compressive zone on the sloping cracks. The pull-out shear forces were applied on the steel fibers along such cracks, and the shear forces were also applied by actions of membrane for determination of the PSC of the concrete slabs reinforced by the steel fiber. In addition, a design equation was proposed by Harajli et al. [15] using linear regression to analyze the effect of using the concrete and the fibers on the total punching shear strength. On the other hand, a theoretical study was performed by Choi et al. [16] to evaluate the effectiveness of a design equation based on the assumption of the response of tensile reinforcement before punching shear failure occurred. Furthermore, Maya et al. [3] acquired the empirical data in the literature by evaluating and contrasting three different prediction equations for the calculation of the punching shear capacity. Furthermore, an experimental study by Gouveia et al. [17] focused on how the steel fiber-reinforced concrete flat slabs behaved due to failure during the focused loading. In addition, a kinematic theory was proposed by Kueres and Hegger [18] in reinforced concrete slabs without shear reinforcement using two different parameters for the punching shear. Einpaul et al. [19] proposed a new experimental approach to record how cracks were created and progressed in punching test samples. Furthermore, the measurements were analyzed by Simões et al. [20] for the crack development and the kinematics corresponding to the punching failures. A mechanical model was established using the results obtained from this analysis to better understand the punching shear failures. Reviewing the related literature shows that the PSC of steel fiber-reinforced concrete is predicted using simple statistical methods and modified design equations, and it is necessary to assess the relationship between the PSC of concrete reinforced by steel fiber and the factors affecting it using theoretical prediction models. It is necessary to note that a complex phenomenon, punching shear behavior, necessitates evaluating other estimation and approximation methods. Since there are several effective variables in the dominant mechanism of PSC of flat slabs, other sophisticated data-based approaches should be investigated to improve the accuracy of the prediction and contribute significantly to the available literature. Since structural and civil engineers more commonly use machine learning [21,22,23,24,25,26,27,28,29,30,31,32,33,34,35,36,37,38,39,40,41], this sophisticated data analysis approach is proposed in the present study to estimate the shear punching capacity. An artificial neural network (ANN) method is a highly effective method for nonlinear modeling [42,43,44,45,46,47,48,49,50], but one cannot easily explain and understand its configuration as a black-box model.
It is possible to become familiar with the application of a variety of prediction models for data analysis by reading the works that came before it. On the other hand, the findings of this research present a novel strategy for data analysis that is based on the selection of dataset attributes. In this work, the clustering technique, which is one of the data selection techniques based on closely related features, was utilized to give a system for the solution of problems requiring more accurate analysis and evaluation. The machine learning models that were discussed earlier can be trained and validated utilizing a dataset that contains 140 experimental data samples taken from the works that have come before this one. The dataset contains six features (inputs), namely the effective depth of the slab, the reinforcement ratio, the length of the column, the depth of the slab, the fiber volume, and the compressive strength of the concrete used for the assessment of the measured punching shear force. All of these features are used to determine the punching shear force that was measured. This research presents this methodology, analyzes it in comparison with various models of artificial intelligence, and, as a last step, demonstrates how well the models function.

2. Experimental Setup

2.1. Governing Equations

The critical shear crack theory can be used to estimate the PSC of SFRC. Slabs without any transverse reinforcement are considered in [51], and slabs with transverse reinforcement are described in [52]. Fernández and Muttoni [52] stated that one can express the PSC for reinforced concrete slabs without transverse reinforcement as:
V R , C = 3 4 b 0 d f c 1 1 + 15 ψ d d g 0 + d g
where   d represents the effective depth of the slab and Ψ denotes the maximal rotation of the slab. In addition, b o denotes the control perimeter at a distance of d / 2 from the column face. Furthermore,   d g denotes the aggregate size and d g 0 denotes the reference aggregate size, set as 16   mm . The following equation can be used to obtain the PSC:
V R = V R , C + V R , f
where   V R ,   f denotes the contribution of the fibers while V R ,   C shows the contribution of the concrete. Moreover, a formulation was presented by Voo and Foster [53] to quantify the tensile strength of the fibers generated on a plane with the unit area. One can express this equation as:
σ tf = K f . α f . ρ f . τ b
where ρ f denotes the fiber volume, K f represents the factor of global orientation, τ b is the bond stress between the concrete mix and the fibers, and finally, to define the aspect ratio for the steel fibers, α f is used. The following equation shows that the fibers contribute to the total punching shear computed as follows [3]:
V R , f = A P   σ tf ψ , ξ dA P
In addition to the concept of the kinematic assumption and average bridging stress [54], for computing the effect of the fiber, the equation presented below can be used [3]:
V R , f = A P σ tf ψ d 6
A simplified equation was proposed by Maya et al. [3] to compute the contribution from the concrete using the above equation. One can express this equation as follows by considering 1.5 for   γ c (the partial safety factor of the concrete):
V R , C = 2 b 0 d f C 3 γ c 1 1 + 20 ψ d d g 0 + d g

2.2. Dataset Study

The machine learning models can be trained and verified using a dataset with 140 test specimens and six features of the PSC, i.e., the reinforcement ratio ( ρ ), the effective depth of the slab (d), the depth of the slab (h), the compressive strength of the concrete (fc), the fiber volume ( ρ f ), and the length of the column (bc). As summarized by [3], the experimental studies in the literature described the data points in this dataset.
Figure 1 and Figure 2 provide statistical information and data distribution. The parameters ρ and ρ f   have the lowest values among the data. The ranges of these data are ρ = 0 2   and ρ f = 0.37 2.53 . Changes in the data cause different relationships between input and output parameters. The more varied these changes are, the more complex it is to derive a relationship between them and it is necessary to use appropriate and flexible techniques. In the figures, it can be seen that the data dimensions of this issue are highly varied, so we tried to create the best performance for these data using intelligent models.

3. Methodology

3.1. K-Means

In some datasets, features can be extracted that do not initially have a clear structure, which can be explored by unsupervised learning. This technique shows that significant information can be obtained from variables with which appropriate structures can be designed. One of these methods is data clustering. Clustering means dividing data into groups that are most compatible with each other so that groups with similar characteristics can be examined and analyzed together. Clustering is one of the most important techniques in data mining and is used to group, cluster, or split data using distance functions.
K-means has become one of the most popular methods of unsupervised learning used to cluster data. This technique creates a simple path for segmenting the dataset by considering a specific number of clusters (k clusters). The main goal is to define k centers for each cluster that must be determined so that the best performance can be achieved. The best performance is when the centers are the farthest apart. In the next step, the points that are closer to the centers are assigned to that section. Once all the points have been determined, this step is completed. This process is repeated until the specified criteria are reached so that there is no change in the location of the center k. It should be noted that this process does not always need to achieve the best or the most optimal solution, and this algorithm is sensitive to the initial choices of the centers. The K-means algorithm can be summarized as follows:
(1)
Placing the points of centers (k) in the computing space so that the primary centers can be determined by them.
(2)
Assigning the points that have the most similarity (in terms of proximity or distance) to these defined points.
(3)
Recalculating the positions of the centers after the end of the point allocation process.
(4)
Stages (2) and (3) will continue until there is no change in the centers. This process seeks to find better groups or clusters.
Considering the idea of using the closeness that exists between different features in the data, we attempted to create a new analysis to increase the accuracy of predictive models. Therefore, we used the three models ANN, SVR, and Random Tree, which are described below, to examine the changes in each model.

3.2. Multi-Layer Perceptron (MLP)

MLP is one of the most common artificial neural networks (ANNs). ANN, inspired by the biological neural network, was first developed in 1949 [55]. ANN is prominently superior, relying on the fact that the nonlinear mapping can be performed over a dataset when using it [56]. The MLP neural network has been successfully applied in different research fields owing to its merit [23,45,57,58]. The implementation of an ANN generally uses two types of data, i.e., training and testing sets. The training data can be used to fit the neural networks; after that, the testing data can be used to assess the quality of the neural networks. The back-propagation (BP) [59] method is a common way to carry out the training procedure. The main role of BP is to minimize the predictive errors (i.e., the differences between the estimated and actual outputs) through a backward propagation algorithm. Mastering the iterations of ANN can have its parameters generate a more compatible output. Moreover, three factors, i.e., activation function, the number of epochs, and learning law, also control the performance of ANN. More details of MLP are given in [60,61].

3.3. Random Tree (RT)

The RT approach, first suggested by Breiman [62], is utilized according to ensemble learning, for example, the random forest (RF). In the RT approach, several learners work independently. In order to provide a collection of samples, a decision tree is built based on the idea of bagging. Due to the different nodes’ splitting, the RF and standard trees differ significantly. This splitting in the RF is based on the best predictor among a selection of predictors. However, the elite split is used in the common tree across all variables. The RT can deal with classification and regression applications. The input data are delivered to the tree classifier as a result of the RT algorithm being run. Finally, the system will produce the highest frequency class. The performance of the training phase is calculated without the need for bootstraps or cross-validation due to the internal computation of the training error. The results obtained for the output of the models of the studied problems are based on the mean response of all members [63].

3.4. Support Vector Regression (SVR)

Support Vector Regression (SVR) is one of the leading algorithms in the field of machine learning and has various applications in the field of engineering [45,64,65,66]. The SVR model is widely used to solve classification and regression problems. Data are generally mapped for SVR with an f(x) function to transform a low-dimensional nonlinear dataset to a high-dimensional linear problem in feature space. In this research, the SVR model is used to solve a regression problem.
Assume that a training dataset is T = x 1 , y 1 , x 2 , y 2 , , x k , y k   , where yi and xi represent the output and input, respectively, then   y i R and   x i R n , and k signifies the training observations. The SVM model for the regression problem can be represented as follows:
f x = a . δ x + b
where a . δ x indicates the kernel function. Table 1 contains a set of common kernels for the SVR model. The task of these kernels is to transform the data from the lower dimension to the higher dimension so that analysis and relationship extraction can be conducted more effectively.
Then, the following problem must be solved:
max i = 1 k y i (   ε ^ i ε i ) η   ε ^ i ε i 1 2 i = 1 k j = 1 k (   ε ^ i ε i )   ε ^ j ε j δ x i , x j
Here,
i = 1 k (   ε ^ i ε i ) = 0 0 ε i ,   ε ^ i C ,   i = 1 , 2 , k
where the penalty factor (C) coefficient is defined to determine the model with proper performance. To map the dataset, the conditions of Karush–Kuhn–Tucker should be met by Equation (10) [67] as:
ε i f x i y i η ω i = 0   ε ^ i y i f x i ε   ω ^ i = 0 ε i   ε ^ i = 0 ;   ω i   ω ^ i = 0 C ε i ω i = 0 ;   C   ε ^ i   ω ^ i = 0
Finally, according to the following equations, the SVM model is implemented for regression problems:
f x = i = 1 k (   ε ^ i ε i ) . δ x i , x j + b
b = y i + η i = 1 k (   ε ^ i ε i ) . δ x i , x j + b

3.5. Sparrow Search Algorithm (SSA)

The idea of this algorithm is based on sparrows, which are generally found in most places where humans live. This type of bird, which has different varieties, uses seeds as its main source of food. Sparrows are classified as intelligent birds into two types: domestic producers and scroungers. The first group seeks food sources, and the second group collects food identified by the first group. There is reciprocal behavior between these two groups, and they always act according to a suitable and flexible strategy.
Obtaining a mathematical pattern between these behaviors leads to the development of a new algorithm to find solutions to various problems. Mathematical models adhere to the following basic assumptions and rules.
(1) The first group (producers), due to their high energy, identify susceptible areas that have high food sources for the second group (scroungers). The energy level is determined according to the specific characteristics of the suitable conditions.
(2) Once the hunter is identified, the other group is alerted to go to safer areas. A criterion is defined for the risk limit.
(3) In general, the ratio of producers and scroungers in the whole process remains constant. However, any sparrow can act as a producer to reach better resources.
(4) A group of producers who have higher energy and starving scroungers search for food to gain more energy.
(5) The scroungers generally follow the first group to obtain the best answers and resources. Some scroungers may just be spectators and compete with other groups after identifying the source. This is to increase the chance of predation.
(6) In general, when in danger, the sparrows at the edge of the group move quickly to safe areas, while the middle members of the group walk randomly to draw closer to others.
Figure 3 summarizes the process that this algorithm performs to find food sources and the interactions that exist between group members.
With the above rules, the relations to describe this algorithm are as follows.
First, the position of the sparrow, which is denoted by the number n and the size of the variables d, is represented by the following matrix:
X =   x 11   x 12   x 1 d     x 21   x 22   x 2 d     x n 1   x n 2   x nd    
Similarly, the fitness value of each row of the sparrow is defined as the following matrix:
Fx =   f ( [   x 11   x 12   x 1 d   ] ) f ( [   x 21   x 22   x 2 d   ] )   f ( [ x n 1   x n 2   x nd   ] )  
In any search, the appropriate iteration (t) is required to run this algorithm so that each producer’s position can be updated for new responses. Equation (15) provides this according to Rules (1) and (2):
X i , j t + 1 = X i , j t . exp i α . iter max ,             if   R 2 < ST   X i , j t + Q . L                                         if   R 2 ST
where Xti,j specifies the jth dimensions of the ith row, α is a constant coefficient that is selected randomly in the range from 0 to 1, and itermax is known as the maximum repetition limit. L is a 1 × d matrix in which each element is equal to 1. Q randomly follows the normal distribution and J changes from 1 to d. R2 and ST, which are used for the alarm value and safety limit, are defined as between 0 and 1 and between 0.5 and 1, respectively. Finally, the position of the scrounger and the initial position of the sparrows are given in the following mathematical formula:
X i , j t + 1 = Q . exp X worst t X i , j t i 2 ,                                                         if   i > n / 2   X p t + 1 + X i , j t X p t + 1 . A + . L                                         Otherwise
X i , j t + 1 = X best t + β .     X i , j t X best t                                                                   if   f i > f g   X i , j t + K . X i , j t X worst t f i f w + ε                                                               if   f i = f g

4. Simulation

This section describes the various steps taken to develop hybrid models to evaluate the punching shear capacity. This research aims to provide a common system for better data analysis by combining two different systems called K-means and intelligent models (ANN, Tree, and SVR). Each section needs to be developed separately so that it can be well developed with greater accuracy. Therefore, each model performs different implementations to achieve the desired results. The repetition of trends indicates an increase in accuracy and a decrease in computational error performed by various researchers [57,68,69]. Finally, to better compare the models, various statistical criteria are used to provide and obtain the performance and flexibility of these systems. In this study, three criteria of RMSE, MAE, and R2 were allocated to study this issue, and are presented in the following formulas [70,71,72,73,74,75,76]:
RMSE = i = 1 N P i M i 2 N
MAE = 1 N t = 1 N M i P i
R 2 = 1 i = 1 N P i M i 2 i = 1 N M i M i ¯ 2
where M   i   and   P   i represent the measured and predicted values of the PSC for this research. Moreover, N and M   i ¯   signify the number of data and average of measured values. The general steps of this research are illustrated in Figure 4.

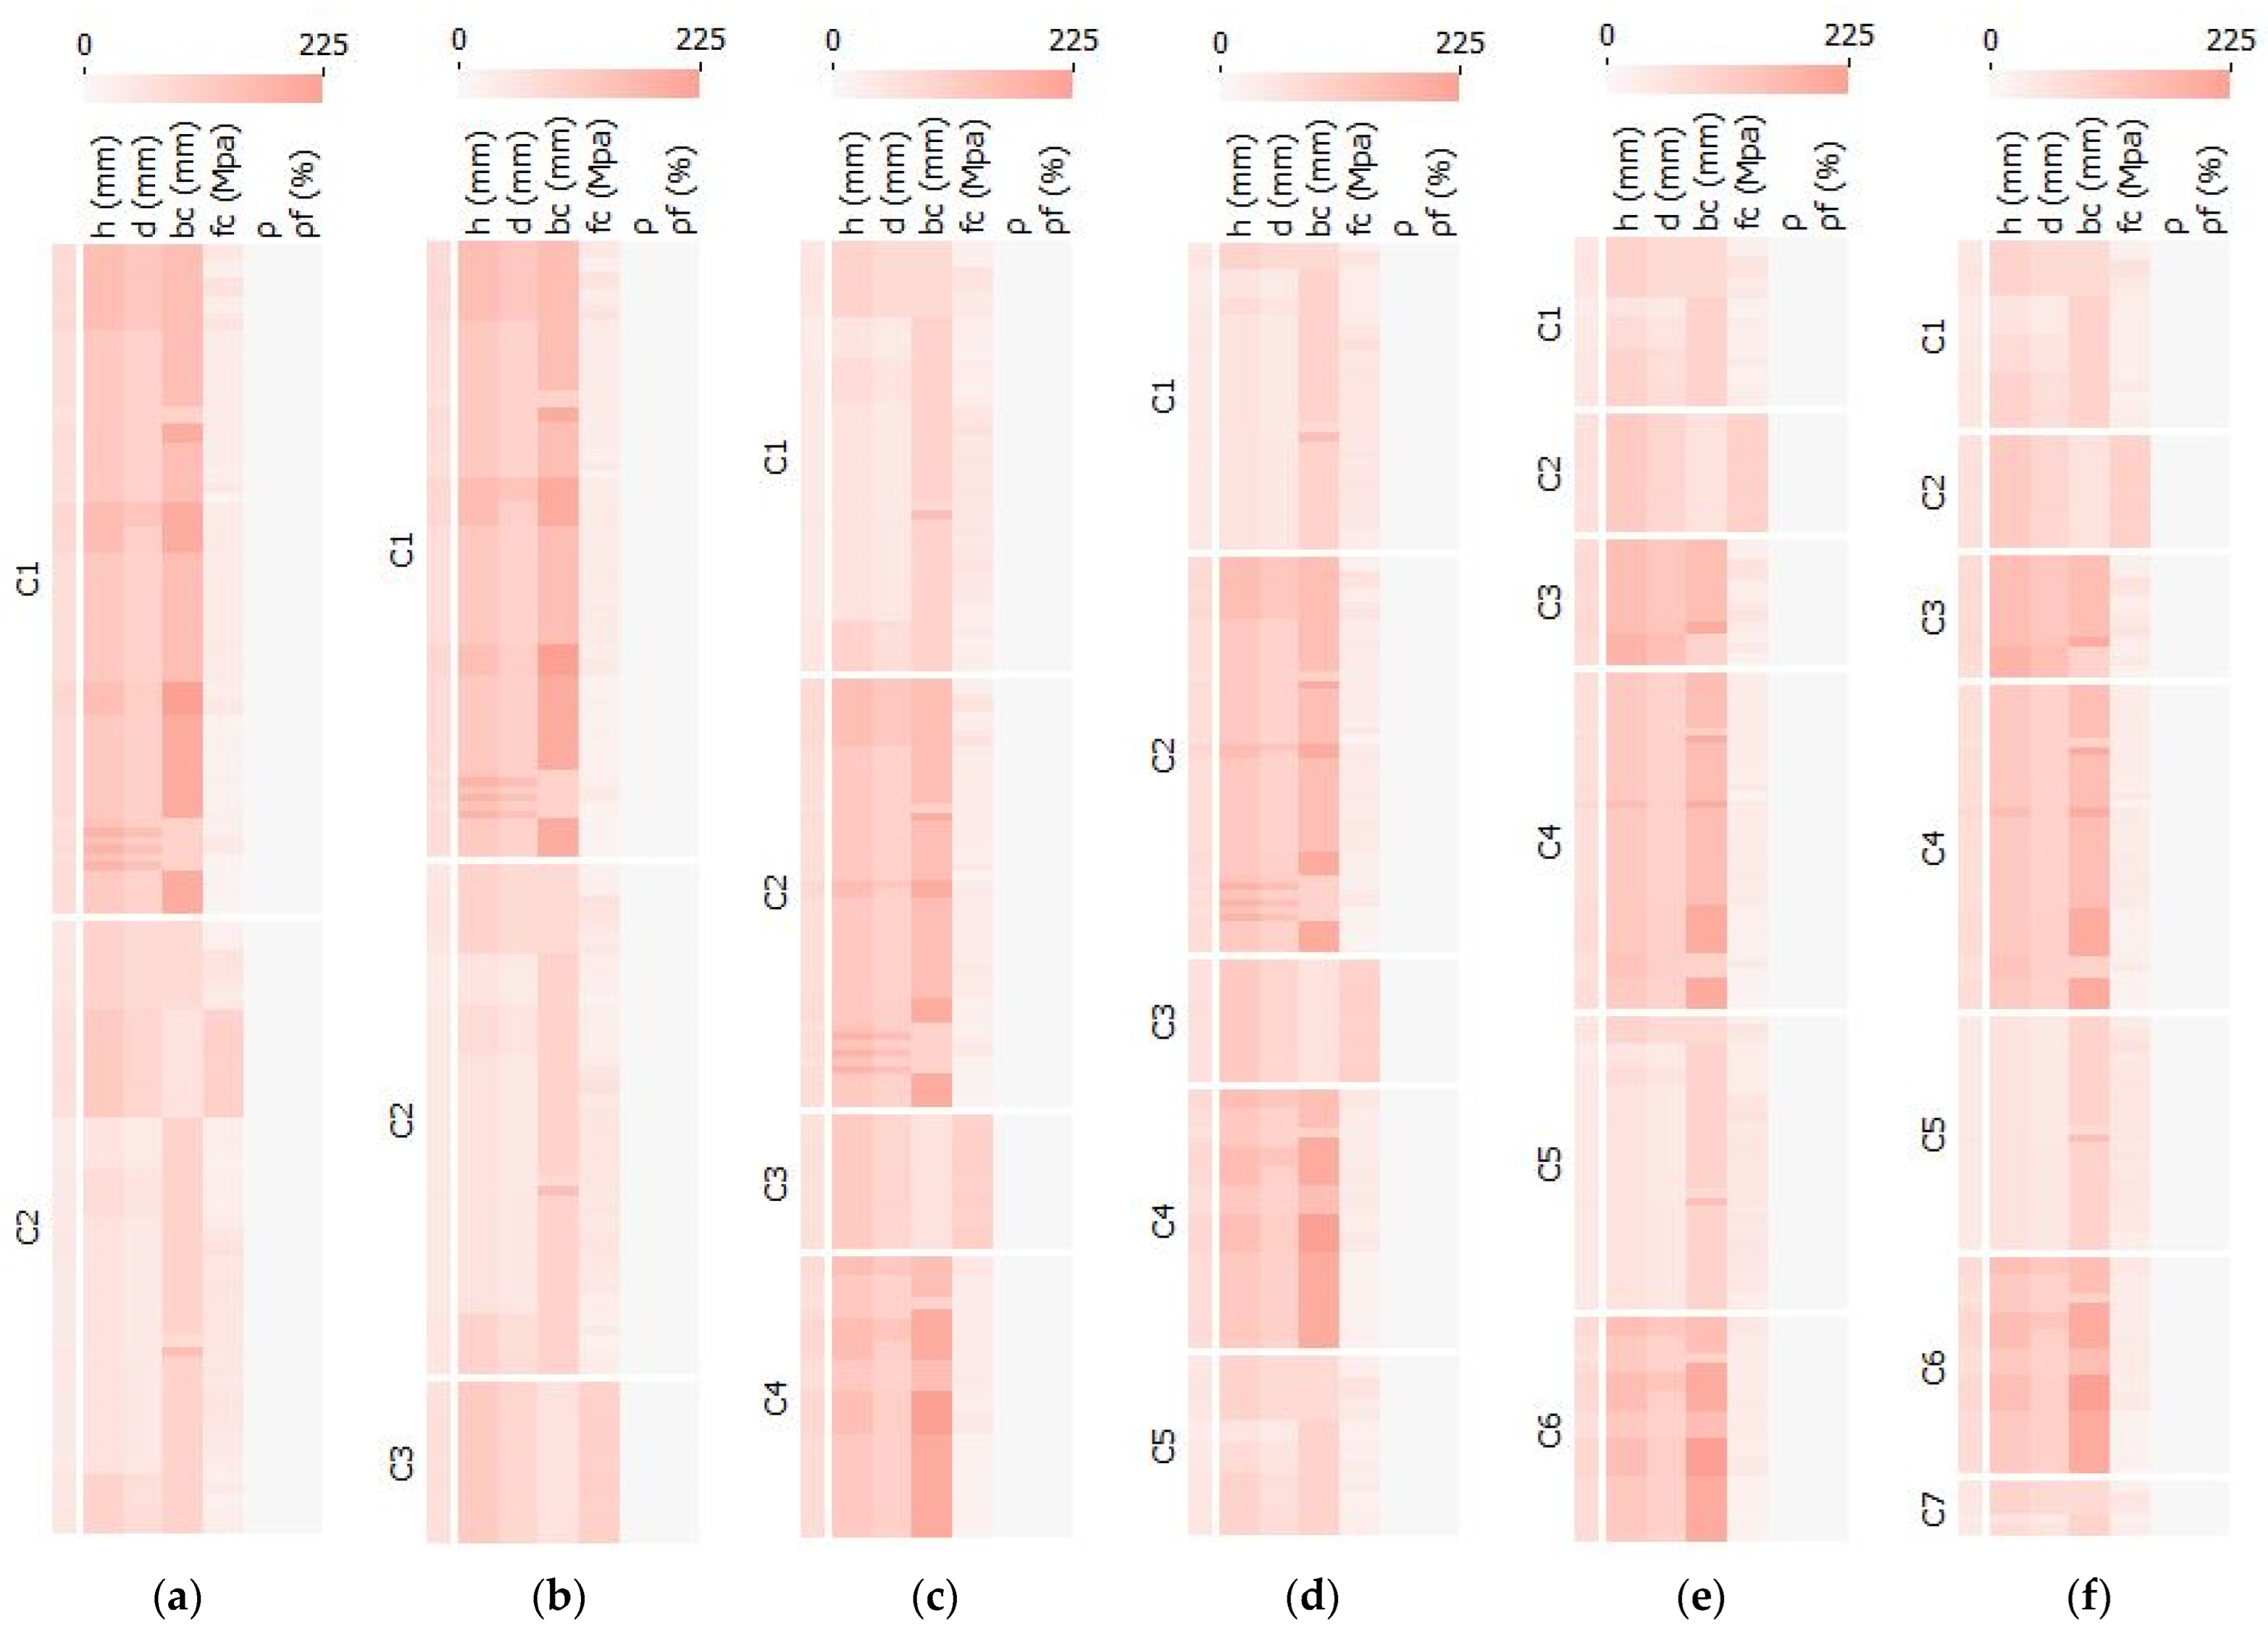
4.1. Clustering Step

To develop K-means-based hybrid models, the input data are evaluated in the first step. The data that are introduced to the system as features are divided into different clusters by K-means. Clustering has the advantage of putting the most compatible data together to develop models that fit the same cluster with closely related features. For this issue, six features that are introduced as input data to the system are examined in this study. To determine different clusters, different values of k from two to seven clusters were used for the data of this study. Figure 5 shows the different views obtained based on clusters. According to this figure, the range of changes for each cluster and the mean of each are obtained. If the interference area can be expressed less and the changes can be expressed more simply, the importance and superiority of the cluster can be shown. It can be seen in all figures that the two parameters ρ f and ρ have little change and with different clusters, they can not be separated well. As the number of clusters increases, it becomes more difficult to distinguish between them, as can be seen in clusters 5, 6, and 7. This makes the problem more difficult and complicates the achievement of the desired result and convergence. Figure 6 also shows a presentation of the division based on the heat map. In this figure, it is also clear that the elementary clusters 2, 3, and 4 can provide the best segmentation for the data so that they can be analyzed with less complexity.
The Silhouette analysis method was used to select the best classes. Given that the value of k was examined between 2 and 7, each cluster has its own characteristics. These features make it easy to divide the features used. With Silhouette analysis, it is possible to find out how much each point or feature is related to its respective cluster and how well the clusters are divided. Figure 7 shows the results of this scoring. As can be seen, the best performance is obtained for the values k = 2, 3, and 4. To determine the PSC data of SFRC used in this study, these three classes are used to further develop the models. Each of these three selected categories divides the data into categories with a specified number. Figure 8 shows how many data points each category contains for model development. The number of data points in each category varies in responses and analysis. As can be seen, in the Class 3 section, the third category of data is obtained from the second category in the Class 2 section. The same thing occurs in Class 4, where category 4 is produced from the first category in Class 2 or 3. This creates a correlation in data segmentation, which indicates that the data are divided into appropriate segments with the least complexity.

4.2. K-Means Models

This section develops predictive models to determine the PSC of SFRC. As mentioned earlier, the three basic models as the primary system for this research are Tree, SVR, and ANN. In the first step of designing this system, the data, which included six different features, were divided into different clusters by k-means and scored. The top three clusters for these data were k = 2, 3, and 4. Scoring showed that the data for these three items have the highest level of coordination; thus, these three models were used to evaluate the parameters of the models. After this step, each of these clusters was entered into the base models, and the prediction model was developed separately. This process continues until the best performance of each model is achieved. Therefore, the process was subjected to numerical analysis to find the model with high accuracy and less error. Table 2 provides the output of the developed hybrid models, which are divided into K-means–Tree, K-means–SVR, and K-means–ANN categories. As can be observed in this table, the models were developed based on the number of clusters and their subdivisions.
The results show that the performance of the models is generally acceptable for determining the PSC of SFRC. The ranges are presented in Table 3 as the average for each cluster. In general, K-means–ANN hybrid models provide higher performance for all three clusters. Following are the K-means–SVR and K-means–Tree models. Cluster 3, for the K-means–ANN model, is less accurate than Cluster 4, but the error results show that it performed better. The MAE and RMSE error values of the K-means–ANN models for Cluster 3 were 3.343 and 5.518, respectively, which are less than the K-means–ANN model for Cluster 4 with MAE = 3.516 and RMSE = 5.757. This indicates that these conditions can almost be accepted and coordinated with the scoring of the previous step to determine the clusters and their effect on obtaining predictive models for more accurate evaluation and with less error for PSC of SFRC. Using the same dataset and the same input data, Hoang [77] developed sequential piecewise multiple linear regression (SPMLR) models to predict PSC of SFRC. The results of the best model are R2 = 0.96, MAE = 15.76, and RMSE = 20.78. By comparing this research, we can point out the acceptable results and the improvement of PSC prediction.

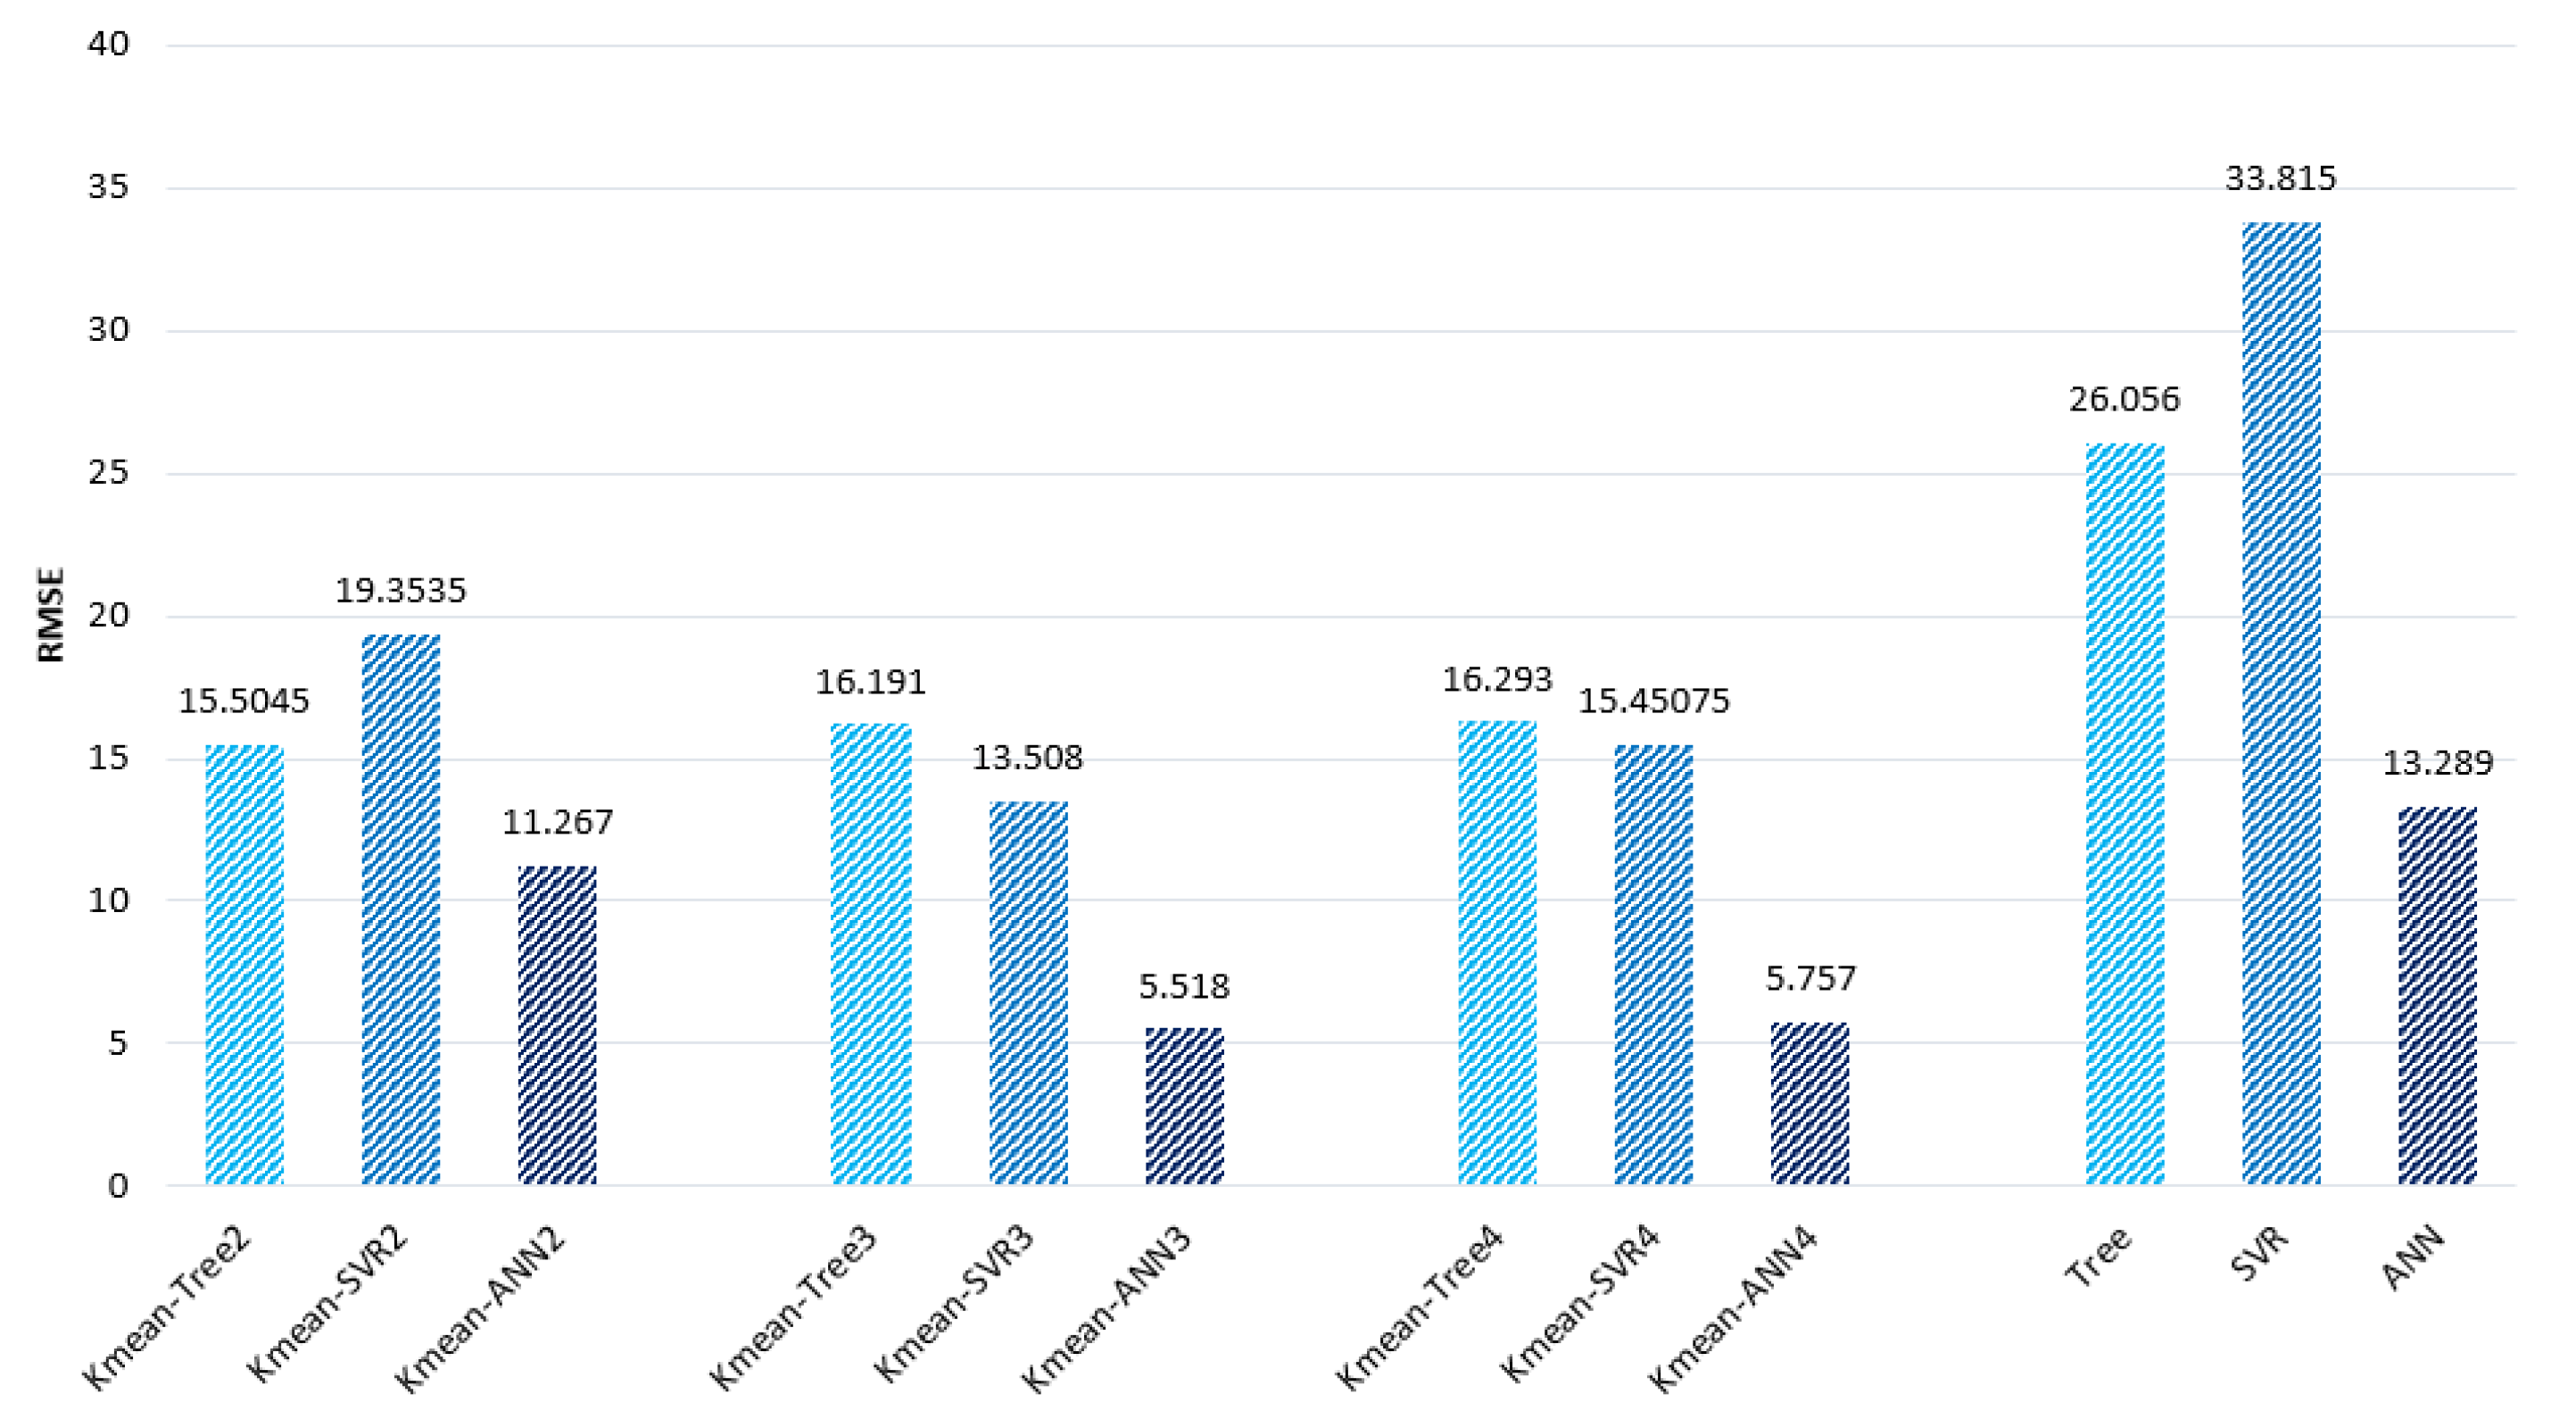
4.3. Comparison Step

Hybrid models based on K-means clusters have been shown to provide acceptable and accurate PSC of SFRC for forecasting and evaluation. For comparison, the three base models, Tree, SVR, and ANN, were developed based on similar data as in the previous step. These models were compared based on three criteria, R2, MAE, and RMSE, to determine their performance in forecasting and their capabilities. Figure 9, Figure 10 and Figure 11 present the results of six models, which include three basic models and three hybrid models developed in this research. All models show adequate performance for these data in general. Using the data clustering process, acceptable growth is seen in the results of ANN and SVR models. The biggest impact on SVR hybrid models is that the results of the base model for R2 = 0.905 increased to more than R2 = 0.95. According to Figure 9 and Figure 10, it can be concluded that in all hybrid models that used clusters, the error was reduced. In addition, ANN hybrid models have undergone the most changes and have been able, for example, to reduce the base model MAE from 9.034 to 3.34. This suggests that the performance of hybrid models that have used K-means to evaluate the PSC of SFRC is acceptable and can be used in a variety of other ways.
Finally, Figure 12 shows a graph of the impact of parameter changes on hybrid models. For example, the K-means–ANN3 model was used to investigate the changes. To significantly investigate this issue, the effect of each of the input parameters on the result was changed between 0 and 1. Using this diagram, the impact of each parameter, the number of changes, and important ranges can be identified. For example, the three parameters ρ f , fc, and d are almost linearly effective in the model, while the other three parameters have nonlinear changes in the model. This can help provide the best design conditions according to the developed model and input parameters for the PSC of SFRC.

4.4. Optimization Step

In this section, the SSA optimization algorithm is connected to the K-means–ANN3 model, and the optimal results and corresponding parameters are identified. For this process, the K-means–ANN3 model is performed as a function, and then, according to the initial parameters, the results are searched by SSA to find the optimal points. To use SSA, parametric analysis was performed to obtain the best structure for SSA. The two main parameters of this algorithm, namely the number of iterations and the number of population, were obtained by trial and error. This process is performed for the initial optimization of the algorithm. For this problem, the number of iterations was 800 and the optimal number of population was 60. The dimensions of this problem have six different variables, determined in the SSA algorithm, which seeks the best conditions by considering all of them simultaneously. Other important coefficients were fixed: ST = 0.8 and SD = 15%. The optimal values for PSC of SFRC were determined according to Table 4. As can be seen, this table contains the best of the PSC of the SFRC and the parameters considered in accordance with the K-means–ANN3 function. By increasing the accuracy of the previous step function, more accurate results can be achieved by the optimization algorithm. Using this methodology to optimize engineering issues can reduce costs and increase design accuracy.

5. Conclusions

We presented here a new system combining clustering methods and intelligent models. The purpose of this work was to increase accuracy and reduce errors to solve engineering problems. In this study, a dataset consisting of 140 data points and six features (inputs) was used to evaluate the punching shear capacity (PSC) of steel fiber-reinforced concrete (SFRC). In the first step of this system, the K-means algorithm divided the studied data into clusters with the most similar features. The clusters that had the best performance were selected. The selected clusters in the next step acted as filters for intelligent models (ANN, SVR, and Tree), and various structures were used to predict the parameters. Each structure was trained separately so that the sub-sections could be well represented for the performance of the models. The main results of this research are as follows:
The performance of all hybrid models implementing clusters 2, 3, and 4 were improved. Moreover, K-mean–ANN structures obtained accuracy up to R2 = 0.992 to predict SFRC flat slabs.
The error of the models was significantly reduced compared to the base models, which confirms that the common data perform better with each other.
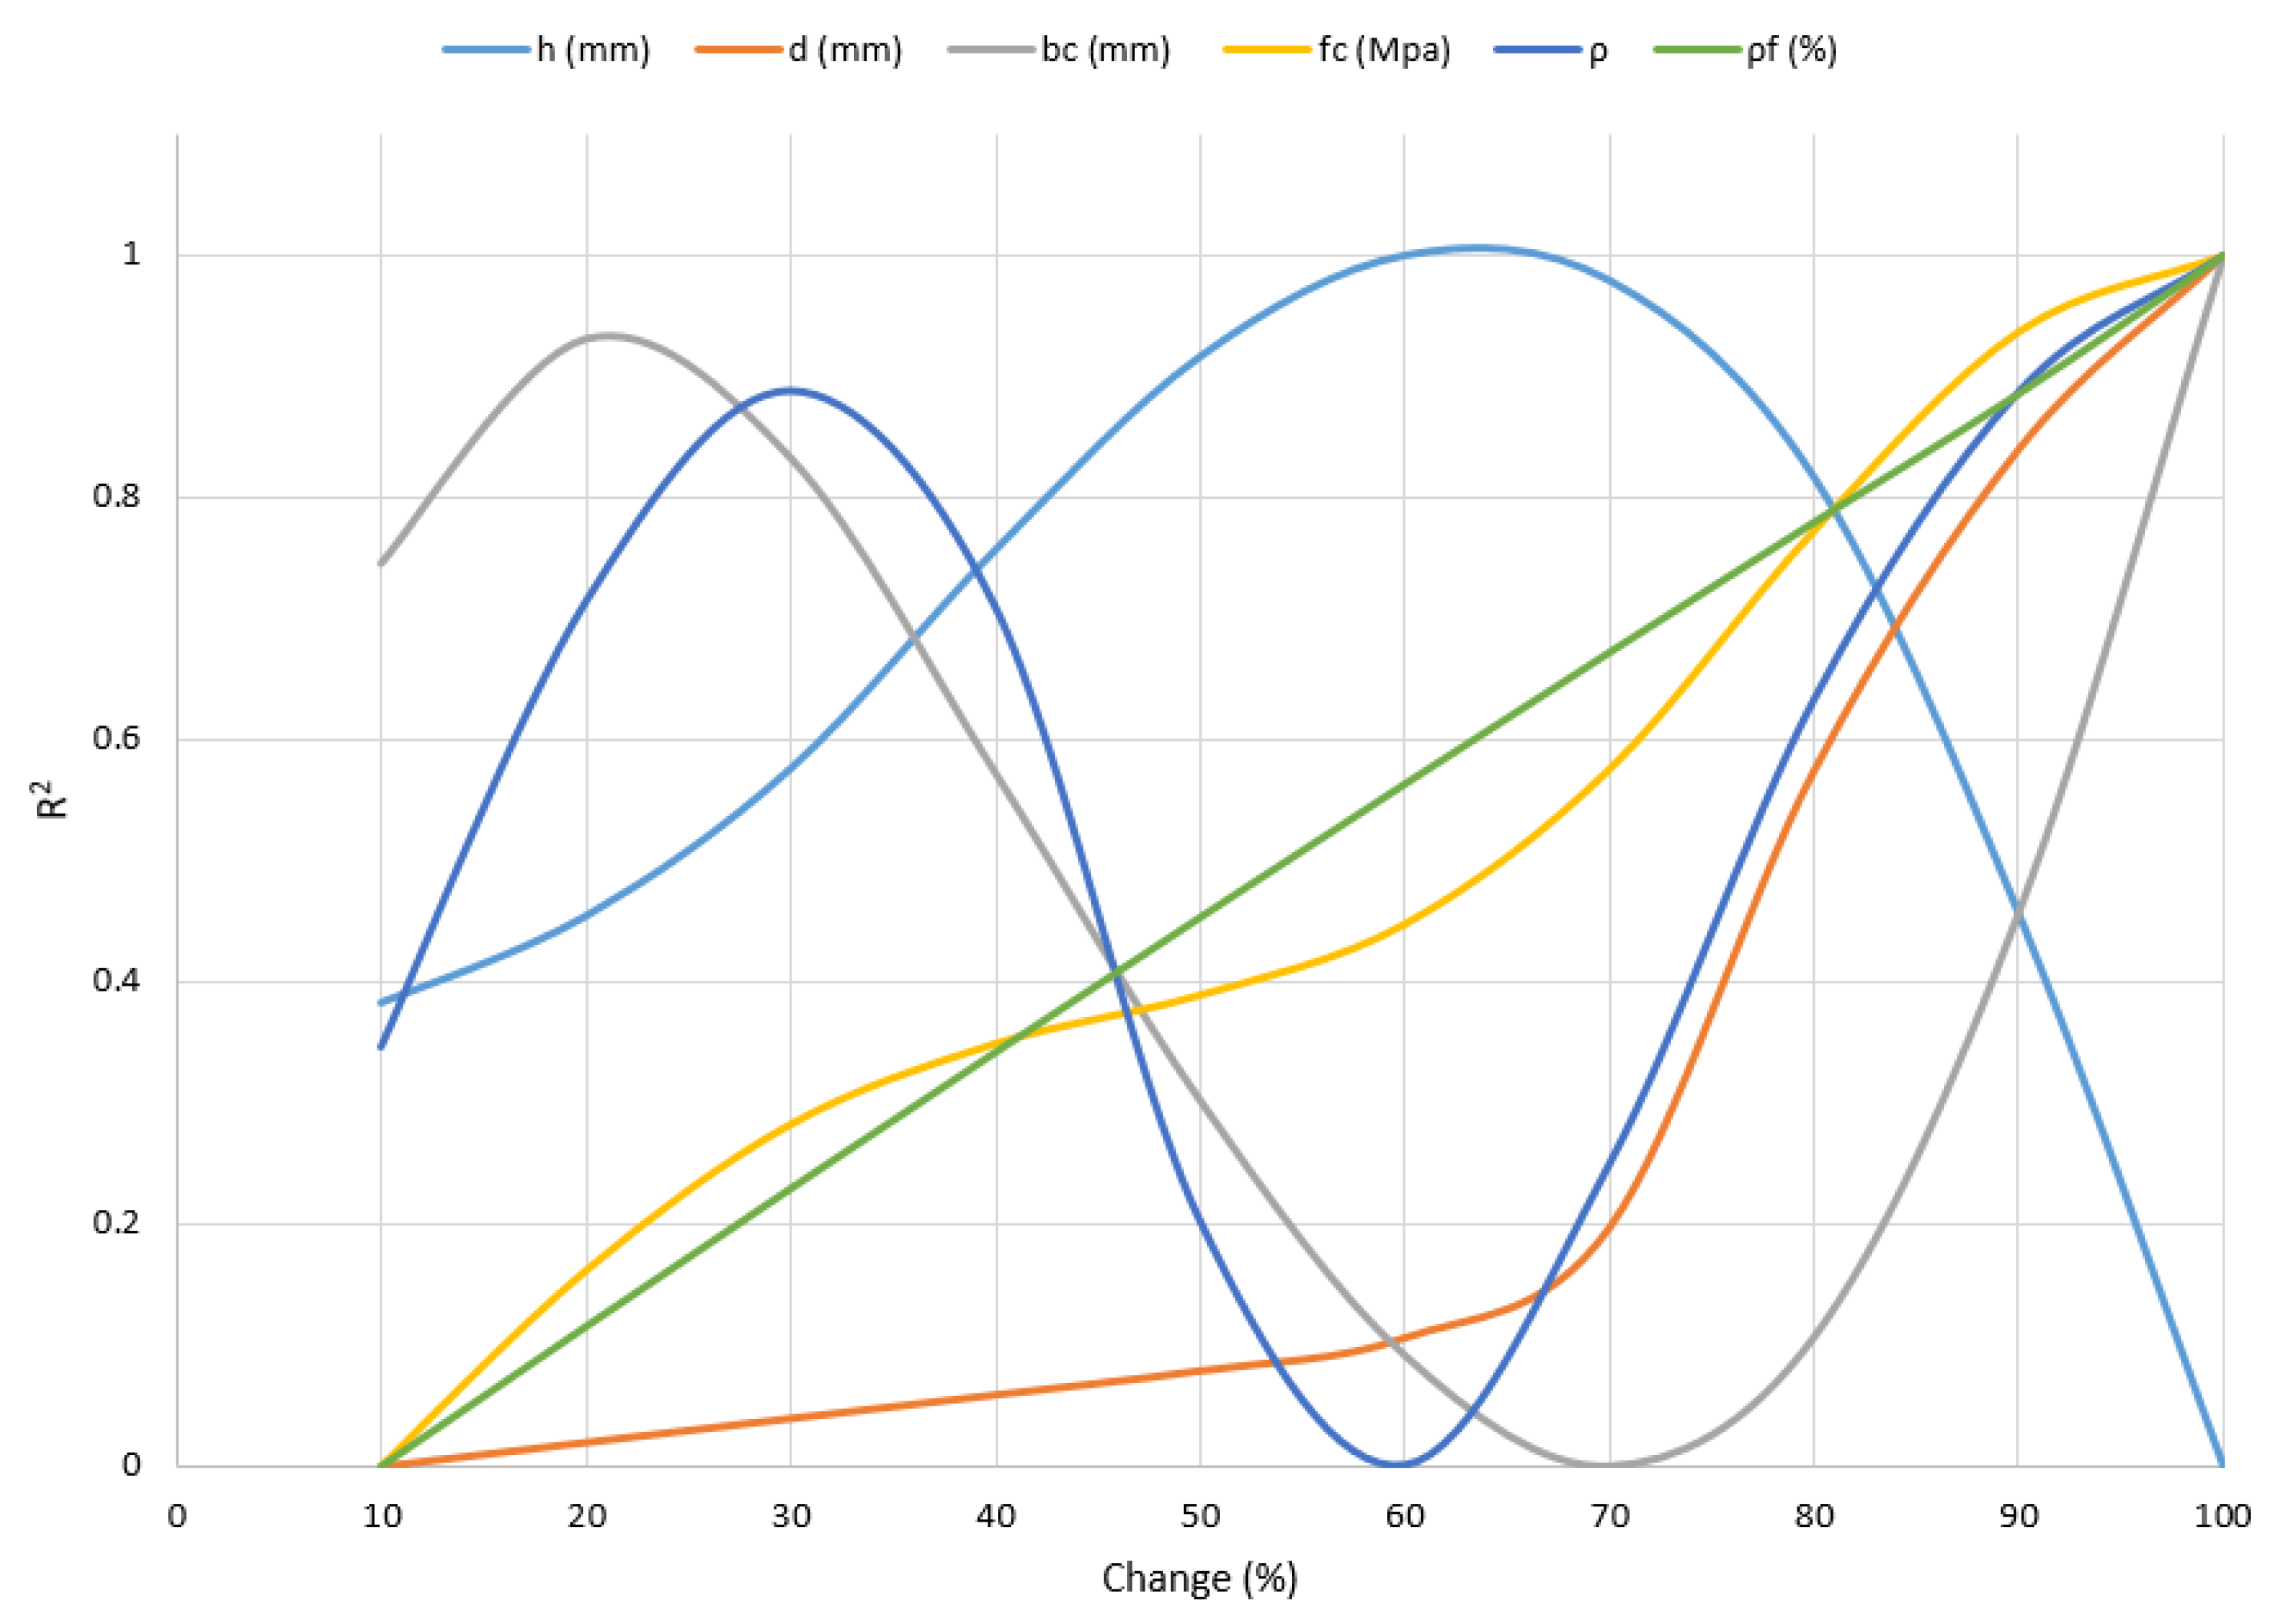
Finally, a diagram was presented showing the effect of input parameters on the K-mean–ANN3 structure that performed the best among all models. Using it, the effects of linearity and nonlinearity of the data on the structure of this selected model were determined.
This study presents a new methodology for a specific engineering problem. Different methods of clustering, classification, and basic predictive models including deep learning can be used to develop this methodology in future research.

Author Contributions

Conceptualization, S.Z., M.H., B.H. and D.V.U.; methodology, S.Z., M.H., B.H., Q.F. and A.S.A.R.; software, S.Z., M.H., B.H., Q.F. and A.S.A.R.; formal analysis, S.Z., M.H., B.H., Q.F. and A.S.A.R.; writing—original draft preparation, S.Z., M.H., B.H., Q.F., D.V.U. and A.S.A.R.; writing—review and editing, S.Z., M.H., B.H., Q.F., D.V.U. and A.S.A.R.; supervision, M.H., D.V.U. and A.S.A.R. All authors have read and agreed to the published version of the manuscript.

Funding

This research was funded by the Project of Tackling Key Problems of Science and Technology in Henan Province (222102320164) and the Key Scientific Research Project Plan of Henan Province Colleges and Universities (22B560009).

Data Availability Statement

The data are available from the corresponding author upon reasonable request.

Conflicts of Interest

The authors declare no conflict of interest.

References

  1. Fernández Ruiz, M.; Mirzaei, Y.; Muttoni, A. Post-punching behavior of flat slabs. ACI Struct. J. 2013, 110, 801–812. [Google Scholar]
  2. Habibi, F.; Redl, E.; Egberts, M.; Cook, W.D.; Mitchell, D. Assessment of CSA A23. 3 structural integrity requirements for two-way slabs. Can. J. Civ. Eng. 2012, 39, 351–361. [Google Scholar] [CrossRef]
  3. Maya, L.F.; Ruiz, M.F.; Muttoni, A.; Foster, S.J. Punching shear strength of steel fibre reinforced concrete slabs. Eng. Struct. 2012, 40, 83–94. [Google Scholar] [CrossRef] [Green Version]
  4. Genikomsou, A.S.; Polak, M.A. 3D finite element investigation of the compressive membrane action effect in reinforced concrete flat slabs. Eng. Struct. 2017, 136, 233–244. [Google Scholar] [CrossRef]
  5. Russell, J.M.; Owen, J.S.; Hajirasouliha, I. Nonlinear behaviour of reinforced concrete flat slabs after a column loss event. Adv. Struct. Eng. 2018, 21, 2169–2183. [Google Scholar] [CrossRef]
  6. Marí, A.; Cladera, A.; Oller, E.; Bairán, J.M. A punching shear mechanical model for reinforced concrete flat slabs with and without shear reinforcement. Eng. Struct. 2018, 166, 413–426. [Google Scholar] [CrossRef]
  7. Schousboe, I. Bailey’s crossroads collapse reviewed. J. Constr. Div. 1976, 102, 365–378. [Google Scholar] [CrossRef]
  8. King, S.; Delatte, N.J. Collapse of 2000 Commonwealth Avenue: Punching shear case study. J. Perform. Constr. Facil. 2004, 18, 54–61. [Google Scholar] [CrossRef] [Green Version]
  9. Shah, A.A.; Ribakov, Y. Recent trends in steel fibered high-strength concrete. Mater. Des. 2011, 32, 4122–4151. [Google Scholar] [CrossRef]
  10. Tian, Y.; Jirsa, J.O.; Bayrak, O. Strength evaluation of interior slab-column connections. ACI Struct. J. 2008, 105, 692. [Google Scholar]
  11. Tan, K.H.; Venkateshwaran, A. Punching Shear in Steel Fibre Reinforced Concrete Slabs Without Traditional Reinforcement. In Proceedings of the IOP Conference Series: Materials Science and Engineering, Birmingham, UK, 13–15 October 2017; IOP Publishing: Bristol, UK, 2017; Volume 246, p. 12025. [Google Scholar]
  12. Cheng, M.-Y.; Parra-Montesinos, G.J. Evaluation of Steel Fiber Reinforcement for Punching Shear Resistance in Slab-Column Connections--Part I: Monotonically Increased Load. ACI Struct. J. 2010, 107, 101–109. [Google Scholar]
  13. Committee, A.C.I. Building Code Requirements for Structural Concrete (ACI 318-05) and Commentary (ACI 318R-05); American Concrete Institute: Indianapolis, IN, USA, 2005. [Google Scholar]
  14. Narayanan, R.; Darwish, I.Y.S. Punching shear tests on steel-fibre-reinforced micro-concrete slabs. Mag. Concr. Res. 1987, 39, 42–50. [Google Scholar] [CrossRef]
  15. Harajli, M.H.; Maalouf, D.; Khatib, H. Effect of fibers on the punching shear strength of slab-column connections. Cem. Concr. Compos. 1995, 17, 161–170. [Google Scholar] [CrossRef]
  16. Choi, K.-K.; Taha, M.M.R.; Park, H.-G.; Maji, A.K. Punching shear strength of interior concrete slab–column connections reinforced with steel fibers. Cem. Concr. Compos. 2007, 29, 409–420. [Google Scholar] [CrossRef]
  17. Gouveia, N.D.; Fernandes, N.A.G.; Faria, D.M.V.; Ramos, A.M.P.; Lúcio, V.J.G. SFRC flat slabs punching behaviour–Experimental research. Compos. Part B Eng. 2014, 63, 161–171. [Google Scholar] [CrossRef]
  18. Kueres, D.; Hegger, J. Two-parameter kinematic theory for punching shear in reinforced concrete slabs without shear reinforcement. Eng. Struct. 2018, 175, 201–216. [Google Scholar] [CrossRef]
  19. Einpaul, J.; Fernández Ruiz, M.; Muttoni, A. Measurements of internal cracking in punching test slabs without shear reinforcement. Mag. Concr. Res. 2018, 70, 798–810. [Google Scholar] [CrossRef]
  20. Simões, J.T.; Fernández Ruiz, M.; Muttoni, A. Validation of the Critical Shear Crack Theory for punching of slabs without transverse reinforcement by means of a refined mechanical model. Struct. Concr. 2018, 19, 191–216. [Google Scholar] [CrossRef] [Green Version]
  21. Vu, D.-T.; Hoang, N.-D. Punching shear capacity estimation of FRP-reinforced concrete slabs using a hybrid machine learning approach. Struct. Infrastruct Eng. 2016, 12, 1153–1161. [Google Scholar] [CrossRef]
  22. Xu, C.; Gordan, B.; Koopialipoor, M.; Armaghani, D.J.; Tahir, M.M.; Zhang, X. Improving Performance of Retaining Walls Under Dynamic Conditions Developing an Optimized ANN Based on Ant Colony Optimization Technique. IEEE Access 2019, 7, 94692–94700. [Google Scholar] [CrossRef]
  23. Yang, H.; Koopialipoor, M.; Armaghani, D.J.; Gordan, B.; Khorami, M.; Tahir, M.M. Intelligent design of retaining wall structures under dynamic conditions. STEEL Compos. Struct. 2019, 31, 629–640. [Google Scholar]
  24. Koopialipoor, M.; Murlidhar, B.R.; Hedayat, A.; Armaghani, D.J.; Gordan, B.; Mohamad, E.T. The use of new intelligent techniques in designing retaining walls. Eng. Comput. 2019, 36, 283–294. [Google Scholar] [CrossRef]
  25. Sun, L.; Koopialipoor, M.; Armaghani, D.J.; Tarinejad, R.; Tahir, M.M. Applying a meta-heuristic algorithm to predict and optimize compressive strength of concrete samples. Eng. Comput. 2019, 37, 1133–1145. [Google Scholar] [CrossRef]
  26. Cai, M.; Koopialipoor, M.; Armaghani, D.J.; Thai Pham, B. Evaluating Slope Deformation of Earth Dams due to Earthquake Shaking using MARS and GMDH Techniques. Appl. Sci. 2020, 10, 1486. [Google Scholar] [CrossRef]
  27. Yang, H.; Liu, J.; Liu, B. Investigation on the cracking character of jointed rock mass beneath TBM disc cutter. Rock Mech. Rock Eng. 2018, 51, 1263–1277. [Google Scholar] [CrossRef]
  28. Yang, H.; Wang, Z.; Song, K. A new hybrid grey wolf optimizer-feature weighted-multiple kernel-support vector regression technique to predict TBM performance. Eng. Comput. 2020, 38, 2469–2485. [Google Scholar] [CrossRef]
  29. Yang, H.; Song, K.; Zhou, J. Automated Recognition Model of Geomechanical Information Based on Operational Data of Tunneling Boring Machines. Rock Mech. Rock Eng. 2022, 55, 1499–1516. [Google Scholar] [CrossRef]
  30. Zhou, J.; Qiu, Y.; Zhu, S.; Armaghani, D.J.; Khandelwal, M.; Mohamad, E.T. Estimation of the TBM advance rate under hard rock conditions using XGBoost and Bayesian optimization. Undergr. Sp. 2021, 6, 506–515. [Google Scholar] [CrossRef]
  31. Zhou, J.; Dai, Y.; Khandelwal, M.; Monjezi, M.; Yu, Z.; Qiu, Y. Performance of Hybrid SCA-RF and HHO-RF Models for Predicting Backbreak in Open-Pit Mine Blasting Operations. Nat. Resour. Res. 2021, 30, 4753–4771. [Google Scholar] [CrossRef]
  32. Zhou, J.; Qiu, Y.; Khandelwal, M.; Zhu, S.; Zhang, X. Developing a hybrid model of Jaya algorithm-based extreme gradient boosting machine to estimate blast-induced ground vibrations. Int. J. Rock Mech. Min. Sci. 2021, 145, 104856. [Google Scholar] [CrossRef]
  33. Zhou, J.; Chen, C.; Wang, M.; Khandelwal, M. Proposing a novel comprehensive evaluation model for the coal burst liability in underground coal mines considering uncertainty factors. Int. J. Min. Sci. Technol. 2021, 31, 799–812. [Google Scholar] [CrossRef]
  34. Asteris, P.G.; Lourenço, P.B.; Roussis, P.C.; Adami, C.E.; Armaghani, D.J.; Cavaleri, L.; Chalioris, C.E.; Hajihassani, M.; Lemonis, M.E.; Mohammed, A.S. Revealing the nature of metakaolin-based concrete materials using artificial intelligence techniques. Constr. Build. Mater. 2022, 322, 126500. [Google Scholar] [CrossRef]
  35. Asteris, P.G.; Rizal, F.I.M.; Koopialipoor, M.; Roussis, P.C.; Ferentinou, M.; Armaghani, D.J.; Gordan, B. Slope Stability Classification under Seismic Conditions Using Several Tree-Based Intelligent Techniques. Appl. Sci. 2022, 12, 1753. [Google Scholar] [CrossRef]
  36. Mahmood, W.; Mohammed, A.S.; Asteris, P.G.; Kurda, R.; Armaghani, D.J. Modeling Flexural and Compressive Strengths Behaviour of Cement-Grouted Sands Modified with Water Reducer Polymer. Appl. Sci. 2022, 12, 1016. [Google Scholar] [CrossRef]
  37. Koopialipoor, M.; Asteris, P.G.; Mohammed, A.S.; Alexakis, D.E.; Mamou, A.; Armaghani, D.J. Introducing stacking machine learning approaches for the prediction of rock deformation. Transp. Geotech. 2022, 34, 100756. [Google Scholar] [CrossRef]
  38. Barkhordari, M.; Armaghani, D.; Asteris, P. Structural Damage Identification Using Ensemble Deep Convolutional Neural Network Models. Comput. Model. Eng. Sci. 2022, 134, 835–855. [Google Scholar] [CrossRef]
  39. Shan, F.; He, X.; Armaghani, D.J.; Zhang, P.; Sheng, D. Success and challenges in predicting TBM penetration rate using recurrent neural networks. Tunn. Undergr. Sp. Technol. 2022, 130, 104728. [Google Scholar] [CrossRef]
  40. Li, C.; Zhou, J.; Tao, M.; Du, K.; Wang, S.; Armaghani, D.J.; Mohamad, E.T. Developing hybrid ELM-ALO, ELM-LSO and ELM-SOA models for predicting advance rate of TBM. Transp. Geotech. 2022, 36, 100819. [Google Scholar] [CrossRef]
  41. Asteris, P.G.; Mamou, A.; Ferentinou, M.; Tran, T.-T.; Zhou, J. Predicting Clay Compressibility Using a Novel Manta Ray Foraging Optimization-Based Extreme Learning Machine Model. Transp. Geotech. 2022, 37, 100861. [Google Scholar] [CrossRef]
  42. Mohamad, E.T.; Koopialipoor, M.; Murlidhar, B.R.; Rashiddel, A.; Hedayat, A.; Armaghani, D.J. A new hybrid method for predicting ripping production in different weathering zones through in-situ tests. Measurement 2019, 147, 106826. [Google Scholar] [CrossRef]
  43. Koopialipoor, M.; Tootoonchi, H.; Jahed Armaghani, D.; Tonnizam Mohamad, E.; Hedayat, A. Application of deep neural networks in predicting the penetration rate of tunnel boring machines. Bull. Eng. Geol. Environ. 2019, 78, 6347–6360. [Google Scholar] [CrossRef]
  44. Zhou, J.; Guo, H.; Koopialipoor, M.; Armaghani, D.J.; Tahir, M.M. Investigating the effective parameters on the risk levels of rockburst phenomena by developing a hybrid heuristic algorithm. Eng. Comput. 2020, 37, 1679–1694. [Google Scholar] [CrossRef]
  45. Armaghani, D.J.; Koopialipoor, M.; Bahri, M.; Hasanipanah, M.; Tahir, M.M. A SVR-GWO technique to minimize flyrock distance resulting from blasting. Bull. Eng. Geol. Environ. 2020, 79, 4369–4385. [Google Scholar] [CrossRef]
  46. Koopialipoor, M.; Noorbakhsh, A.; Noroozi Ghaleini, E.; Jahed Armaghani, D.; Yagiz, S. A new approach for estimation of rock brittleness based on non-destructive tests. Nondestruct. Test. Eval. 2019, 34, 354–375. [Google Scholar] [CrossRef]
  47. Huang, L.; Asteris, P.G.; Koopialipoor, M.; Armaghani, D.J.; Tahir, M.M. Invasive Weed Optimization Technique-Based ANN to the Prediction of Rock Tensile Strength. Appl. Sci. 2019, 9, 5372. [Google Scholar] [CrossRef] [Green Version]
  48. Asteris, P.G.; Kolovos, K.G. Self-compacting concrete strength prediction using surrogate models. Neural Comput. Appl. 2019, 31, 409–424. [Google Scholar] [CrossRef]
  49. Asteris, P.G.; Nikoo, M. Artificial bee colony-based neural network for the prediction of the fundamental period of infilled frame structures. Neural Comput. Appl. 2019, 31, 4837–4847. [Google Scholar] [CrossRef]
  50. Armaghani, D.J.; Asteris, P.G. A comparative study of ANN and ANFIS models for the prediction of cement-based mortar materials compressive strength. Neural Comput. Appl. 2020, 33, 4501–4532. [Google Scholar] [CrossRef]
  51. Muttoni, A. Punching shear strength of reinforced concrete slabs without transverse reinforcement. ACI Struct. J. 2008, 4, 440–450. [Google Scholar]
  52. Fernández Ruiz, M.; Muttoni, A. Applications of the critical shear crack theory to punching of R/C slabs with transverse reinforcement. ACI Struct. J. 2009, 106, 485–494. [Google Scholar]
  53. Voo, J.Y.L.; Foster, S.J. Tensile-fracture of fibre-reinforced concrete: Variable engagement model. In Proceedings of the 6th International RILEM Symposium on Fibre Reinforced Concretes, Varenna, Italy, 20–22 September 2004; RILEM Publications SARL: Paris, France, 2004; pp. 875–884. [Google Scholar]
  54. Muttoni, A.; Fernández Ruiz, M. MC2010: The critical shear crack theory as a mechanical model for punching shear design and its application to code provisions. FIB Bull. 2010, 57, 31–60. [Google Scholar]
  55. Hebb, D.O. The Organization of Behavior: A Neuropsychological Theory; J. Wiley: Hoboken, NJ, USA; Chapman & Hall: London, UK, 1949. [Google Scholar]
  56. Simpson, P.K. Artificial Neural Systems; Pergamon Press: New York, NY, USA, 1989; ISBN 0080378943. [Google Scholar]
  57. Zhou, J.; Koopialipoor, M.; Li, E.; Armaghani, D.J. Prediction of rockburst risk in underground projects developing a neuro-bee intelligent system. Bull. Eng. Geol. Environ. 2020, 79, 4265–4279. [Google Scholar] [CrossRef]
  58. Lu, S.; Koopialipoor, M.; Asteris, P.G.; Bahri, M.; Armaghani, D.J. A Novel Feature Selection Approach Based on Tree Models for Evaluating the Punching Shear Capacity of Steel Fiber-Reinforced Concrete Flat Slabs. Materials 2020, 13, 3902. [Google Scholar] [CrossRef] [PubMed]
  59. Erb, R.J. Introduction to backpropagation neural network computation. Pharm. Res. 1993, 10, 165–170. [Google Scholar] [CrossRef]
  60. Beale, R.; Jackson, T. Neural Computing–An Introduction; CRC Press: Boca Raton, FL, USA, 1990; ISBN 1420050435. [Google Scholar]
  61. Gurney, K. An Introduction to Neural Networks; CRC Press: Boca Raton, FL, USA, 1997; ISBN 1857285034. [Google Scholar]
  62. Breiman, L. Some properties of splitting criteria. Mach. Learn. 1996, 24, 41–47. [Google Scholar] [CrossRef] [Green Version]
  63. Pfahringer, B. Random Model Trees: An Effective and Scalable Regression Method; The University of Waikato: Hamilton, New Zealand, 2010. [Google Scholar]
  64. Cortes, C.; Vapnik, V. Support vector machine. Mach. Learn. 1995, 20, 273–297. [Google Scholar] [CrossRef]
  65. Wen, L.; Cao, Y. Influencing factors analysis and forecasting of residential energy-related CO2 emissions utilizing optimized support vector machine. J. Clean. Prod. 2020, 250, 119492. [Google Scholar] [CrossRef]
  66. Peng, X. A spheres-based support vector machine for pattern classification. Neural Comput. Appl. 2019, 31, 379–396. [Google Scholar] [CrossRef]
  67. Wu, H.-C. The Karush–Kuhn–Tucker optimality conditions in an optimization problem with interval-valued objective function. Eur. J. Oper. Res. 2007, 176, 46–59. [Google Scholar] [CrossRef]
  68. Koopialipoor, M.; Armaghani, D.J.; Hedayat, A.; Marto, A.; Gordan, B. Applying various hybrid intelligent systems to evaluate and predict slope stability under static and dynamic conditions. Soft Comput. 2018, 23, 5913–5929. [Google Scholar] [CrossRef]
  69. Tang, D.; Gordan, B.; Koopialipoor, M.; Jahed Armaghani, D.; Tarinejad, R.; Thai Pham, B.; Huynh, V. Van Seepage Analysis in Short Embankments Using Developing a Metaheuristic Method Based on Governing Equations. Appl. Sci. 2020, 10, 1761. [Google Scholar] [CrossRef] [Green Version]
  70. Mahdiyar, A.; Jahed Armaghani, D.; Koopialipoor, M.; Hedayat, A.; Abdullah, A.; Yahya, K. Practical Risk Assessment of Ground Vibrations Resulting from Blasting, Using Gene Expression Programming and Monte Carlo Simulation Techniques. Appl. Sci. 2020, 10, 472. [Google Scholar] [CrossRef] [Green Version]
  71. Zhou, J.; Li, C.; Koopialipoor, M.; Jahed Armaghani, D.; Thai Pham, B. Development of a new methodology for estimating the amount of PPV in surface mines based on prediction and probabilistic models (GEP-MC). Int. J. Min. Reclam. Environ. 2020, 35, 48–68. [Google Scholar] [CrossRef]
  72. Koopialipoor, M.; Nikouei, S.S.; Marto, A.; Fahimifar, A.; Armaghani, D.J.; Mohamad, E.T. Predicting tunnel boring machine performance through a new model based on the group method of data handling. Bull. Eng. Geol. Environ. 2018, 78, 3799–3813. [Google Scholar] [CrossRef]
  73. Zhou, J.; Asteris, P.G.; Armaghani, D.J.; Pham, B.T. Prediction of ground vibration induced by blasting operations through the use of the Bayesian Network and random forest models. Soil Dyn. Earthq. Eng. 2020, 139, 106390. [Google Scholar] [CrossRef]
  74. Li, Z.; Yazdani Bejarbaneh, B.; Asteris, P.G.; Koopialipoor, M.; Armaghani, D.J.; Tahir, M.M. A hybrid GEP and WOA approach to estimate the optimal penetration rate of TBM in granitic rock mass. Soft Comput. 2021, 25, 11877–11895. [Google Scholar] [CrossRef]
  75. Parsajoo, M.; Armaghani, D.J.; Asteris, P.G. A precise neuro-fuzzy model enhanced by artificial bee colony techniques for assessment of rock brittleness index. Neural Comput. Appl. 2021, 34, 3263–3281. [Google Scholar] [CrossRef]
  76. Liao, J.; Asteris, P.G.; Cavaleri, L.; Mohammed, A.S.; Lemonis, M.E.; Tsoukalas, M.Z.; Skentou, A.D.; Maraveas, C.; Koopialipoor, M.; Armaghani, D.J. Novel Fuzzy-Based Optimization Approaches for the Prediction of Ultimate Axial Load of Circular Concrete-Filled Steel Tubes. Buildings 2021, 11, 629. [Google Scholar] [CrossRef]
  77. Hoang, N.-D. Estimating punching shear capacity of steel fibre reinforced concrete slabs using sequential piecewise multiple linear regression and artificial neural network. Measurement 2019, 137, 58–70. [Google Scholar] [CrossRef]
Figure 1. Boxplot of all data.
Sustainability 14 12950 g001
Figure 2. Distribution of data.
Sustainability 14 12950 g002
Figure 3. The process of SSA for finding food sources; (A): searching for food, (B): when an individual detects a predator, gives a chirp to other, (C): entire group files away and get food.
Sustainability 14 12950 g003
Figure 4. The general steps of this research.
Sustainability 14 12950 g004
Figure 5. The investigation of the cluster effect for determining features. (a) k = 2. (b) k = 3. (c) k = 4. (d) k = 5. (e) k = 6. (f) k = 7.
Sustainability 14 12950 g005aSustainability 14 12950 g005bSustainability 14 12950 g005cSustainability 14 12950 g005d
Figure 6. The investigation of the cluster effect based on the heat map method. (a) k = 2. (b) k = 3. (c) k = 4. (d) k = 5. (e) k = 6. (f) k = 7.
Sustainability 14 12950 g006
Figure 7. Scoring different classes based on Silhouette analysis.
Sustainability 14 12950 g007
Figure 8. The number of divided parameters based on classes 2, 3, and 4.
Sustainability 14 12950 g008
Figure 9. Comparison of 6 models based on R2.
Sustainability 14 12950 g009
Figure 10. Comparison of 6 models based on MAE.
Sustainability 14 12950 g010
Figure 11. Comparison of 6 models based on RMSE.
Sustainability 14 12950 g011
Figure 12. Investigating the effect of input parameters on the structure of the selected K-means–ANN3 model.
Sustainability 14 12950 g012
Table 1. A set of common kernels for SVR models.
KernelFunctionParameter
LinearX, Y-
Polynomial(gX.Y + c)dg, c, d
Radius basis function (RBF)exp(−g X Y 2 ) g
Sigmoidtanh(gX.Y + c)g, c
Table 2. Results of various hybrid K-means models.
Number of ClassSub-SectionModelsR2MAERMSE
21Tree0.95914.83618.638
SVR0.91618.6126.584
ANN0.9739.32715.118
2Tree0.9799.15612.371
SVR0.987.93312.123
ANN0.9924.8937.416
31Tree0.85119.42421.643
SVR0.985.4547.951
ANN10.0140.018
2Tree0.9566.0918.292
SVR0.9773.7795.989
ANN0.9990.6891.418
3Tree0.95914.83618.638
SVR0.91618.6126.584
ANN0.9739.32715.118
41Tree0.95914.25917.677
SVR0.92814.58523.343
ANN0.9943.0386.458
2Tree0.96612.75717.56
SVR0.93414.66524.52
ANN0.97510.32115.134
3Tree0.85119.42421.643
SVR0.985.4547.951
ANN10.0140.018
4Tree0.9566.0918.292
SVR0.9773.7795.989
ANN0.9990.6891.418
Table 3. Average results of various hybrid K-means models.
ClassModelsAverage
R2MAERMSE
2Tree0.96911.99615.505
SVR0.94813.27219.354
ANN0.9837.1111.267
3Tree0.92213.45016.191
SVR0.9589.28113.508
ANN0.9913.3435.518
4Tree0.93313.13316.293
SVR0.9559.62115.451
ANN0.9923.5165.757
Table 4. The optimum result of SFRC.
Optimum ParametersOptimum Function
hdbcfc ρ ρ f
74.2078 130.7832 109.6579 50.2084 1.7756 1.6347 854.7517
Publisher’s Note: MDPI stays neutral with regard to jurisdictional claims in published maps and institutional affiliations.

