1. Introduction
Industrial green transformation (IGT) means that industries adopt resource-intensive utilization and environment-friendly production modes, and actively carry out technological innovation to realize the sustainable utilization of resources and environment-friendly production modes in the whole process of production, so as to achieve both economic and environmental benefits [
1,
2,
3]. For example, the application of desulfurization and denitrification technology in the thermal power industry can be considered as a green transformation. The goal of IGT is to achieve the sustainable use of energy resources, reduce pollution emissions and environmental damage, and enhance labor productivity. In China, data released by the Ministry of Industry and Information Technology (MIIT) show that IGT has achieved remarkable results during the 13th Five-Year Plan period (2016–2020). The backward production capacity of electrolytic aluminum and the cement industry—production equipment, production processes and other production capacities with technical levels lower than the average level of the industry—have been withdrawn. Energy consumption per unit of added value in industries above scale has been reduced by approximately 16% and the emission intensity of major pollutants in key industries has been reduced by more than 20%. Furthermore, 171 green industrial parks have been built in China and nearly 20,000 types of green products have been promoted. These products are characterized by their energy-saving, pollution-free and renewable qualities, such as zinc air batteries and powder coating. In 2021, MIIT released the “14th Five-Year Plan for Industrial Green Development”, which set higher requirements for IGT in terms of industrial structure, energy consumption, the production process, resource utilization and product supply [
4].
On the one hand, in the process of promoting IGT, enterprises have been able to improve productivity, reduce costs and improve product quality. At the same time, energy-saving and environmental protection industries and high-tech industries (e.g., new energy automobile manufacturing and bioengineering) with low energy consumption and low emissions have received more support and increased employment opportunities [
5,
6]. Therefore, IGT has a positive impact on regional economic development. On the other hand, the development of green industrial technologies requires a large amount of continuous investment [
7], but it takes a long time to generate an investment return. The closure of high-energy-consuming and high-emission enterprises due to the elimination of backward production capacity can increase the unemployment rate in the short term, which negatively impacts regional economic development. Due to the significant differences in the industrial foundation and industrial structure of each region in China, the complexities of IGT are varied and so is its role across the regions. Existing studies have mostly focused on the measurement indicators or influencing factors of IGT, while quantitative analyses of the relationship between IGT and regional economic development are lacking. Therefore, it is of great significance for China to thoroughly study the impact of IGT on regional economic development by analyzing the direction of IGT under different regional economic development stages and by promoting its positive effect on regional economic development.
2. Literature Review
The academic research on IGT originated from the concept of the “green economy”. Green economy refers to protecting the environment while achieving economic development [
8]. IGT is one of the most important ways to realize the green economy [
9]. From the perspective of production input, IGT means that it no longer depends on the increase in resources and environment input, so as to realize the decoupling of industrial development from resources and the environment [
10]. From the perspective of the development mode, IGT is a process of industrial development from extensive to intensive and from high pollution to low pollution [
11].
In addition, most research on IGT has focused on the measurement methods and on analyzing the influencing factors.
Studies have mainly used a single indicator, industrial green total factor productivity (GTFP) and a comprehensive indicator to measure IGT. A single indicator generally uses the output value ratio of the clean industry to the total industrial output value to calculate the industrial transformation and upgrading [
12,
13]. In this paper, clean industry refers to the industries with low resource consumption and low emissions that adopt energy-saving and environmental protection technologies. Calculating total factor productivity is a common evaluation model that is used in efficiency evaluation. However, the traditional data envelopment analysis (DEA) overestimates the efficiency [
14], while the slack-based model (SBM) cannot compare and rank multiple evaluation units with efficiency values of one [
15]. More and more studies have considered using the super-SBM model to measure industrial GTFP [
16], which can overcome the shortcomings of the traditional DEA and SBM models. The comprehensive indicator grasps the situation as a whole and establishes an indicator system according to the connotation of IGT [
17], including the sustainable utilization of resources in industrial production, reducing emissions from industrial production, productivity improvement, industrial structure optimization and the industry’s sustainable development. Some indicator systems include residents’ lives [
18,
19]. Through the above consideration of the measurement of IGT, we can see that most studies have used DEA to measure GTFP, to evaluate IGT. Compared with a single indicator, GTFP considers pollution emission and resource utilization; however, with the increasing requirements for IGT, the measurement of IGT needs to consider not only production efficiency, pollution emission and resource utilization, but also industrial structure upgrading, sustainable development and other factors.
The research on the influencing factors of IGT has increased in recent years. The role of technological innovation cannot be ignored as it can promote the sustainable improvement of IGT [
20,
21]. The calculated results showed that the contribution rate of technological innovation to industrial GTFP reaches 47.7% [
22]. The impact of environmental regulation—which aims to protect the environment and regulate various behaviors that pollute the public environment—on IGT shows a U-shaped trend. At present, China is in the left half of the U-shaped curve [
23,
24]. There are some scholars who have used other perspectives, including price mechanism [
25] and consumer behavior [
26]. Most studies have shown that they have promoted the green transformation of industry.
Finally, few existing studies have investigated the relationship between IGT and economic development in China. By comparing the costs and benefits of IGT in economic sectors to judge its impact on economic development, the results have shown that the benefits are much higher than the costs. From the perspective of a specific industry, the green transformation in the sulfuric acid industry has lower costs and more benefits [
27]. If the macroeconomic variables affected by the IGT are measured, the results also show that the benefit is higher than the cost [
28]. IGT can significantly promote the quality of urban economic growth by optimizing factor input and factor quality [
29]. Through the analysis of the coupling coordination degree, the results have shown that there is a high-level coupling relationship between IGT and economic development [
30]. Moreover, the spatial model calculation has shown that there is a positive spatial correlation in the IGT [
31,
32,
33]. Therefore, whether or not there is economic spillover in IGT is worth discussing. At the same time, as the carrier of technological innovation, more than half of the innovation activities rely on industry [
34], and technological innovation is also an important driving force in promoting economic development [
35]. With the promotion of IGT, the dependence of transformation on technology is also strengthened. Whether or not the impact of IGT on regional economic development is affected by technological innovation is also worth considering.
With the full spread and deepening of IGT across China, its impact on regional economic development will become increasingly important. This paper has used the provincial panel data of China from 2005 to 2019, has improved the theoretical and empirical studies on the impact of IGT on regional economic development, and has provided a reference for policymaking to prompt the positive effect of IGT on regional economic development.
3. Mechanism Analysis
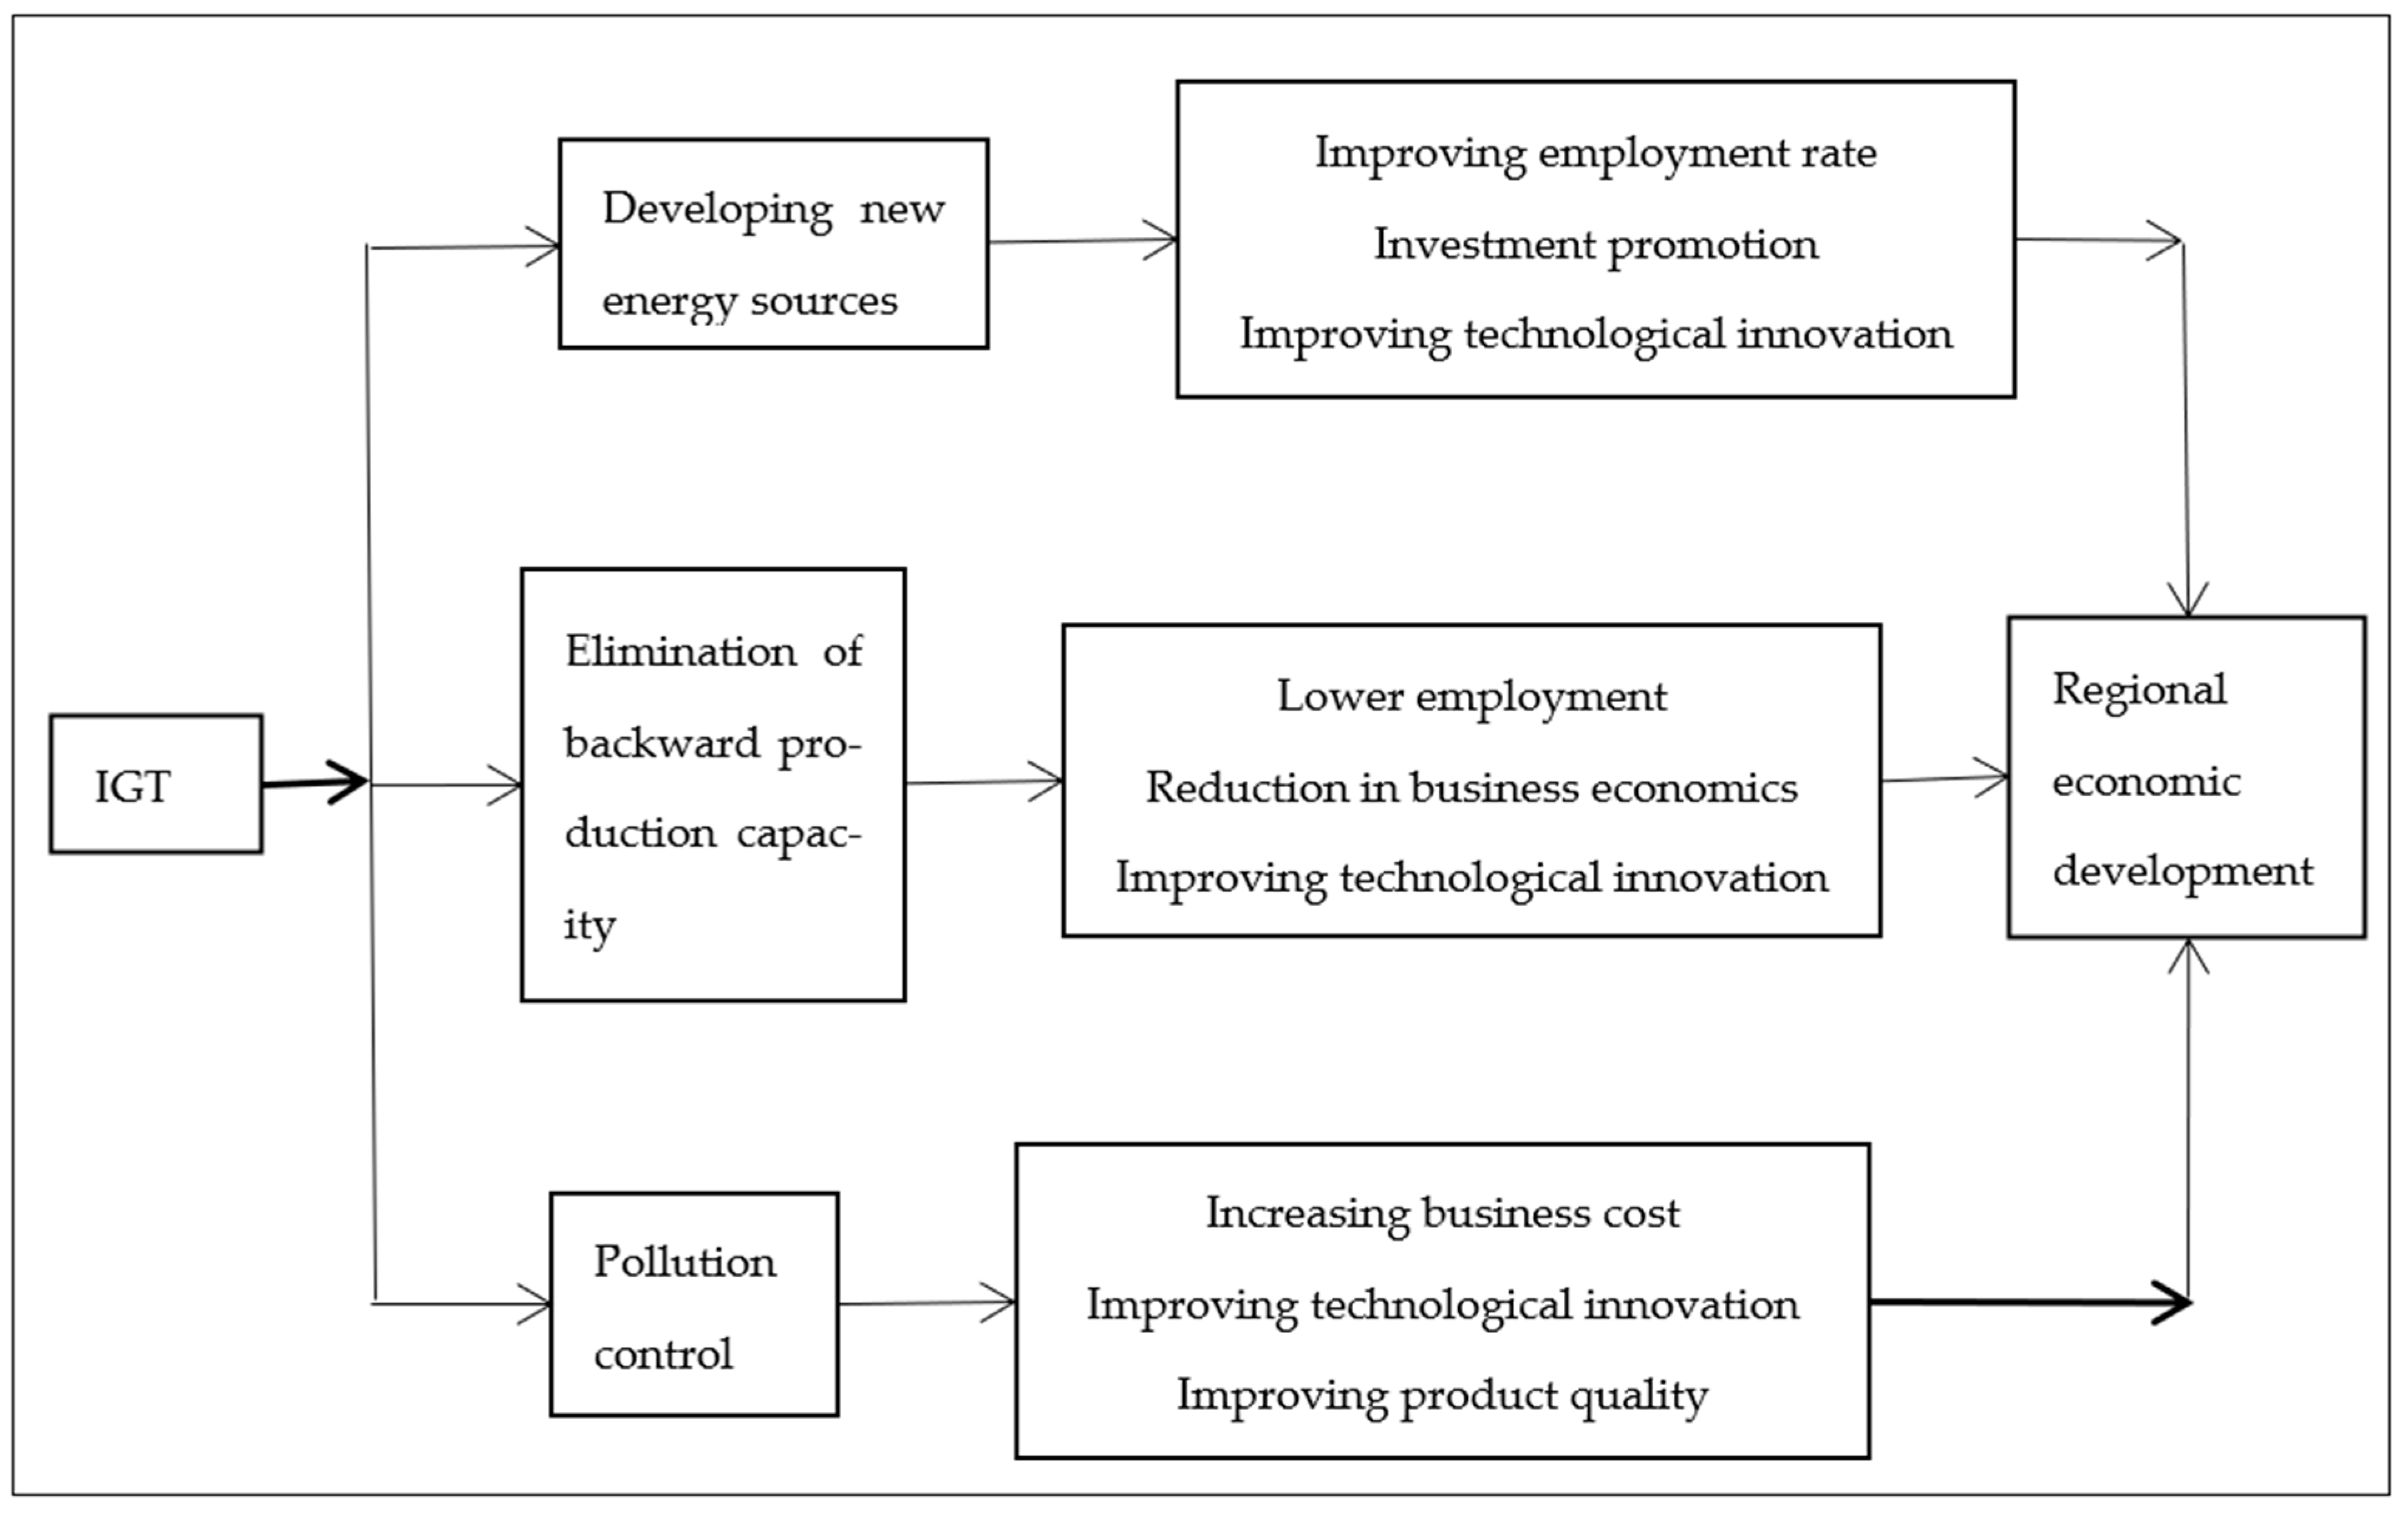
As shown in
Figure 1, this paper has illustrated the impact of IGT on regional economic development by considering the following three aspects: the development of new energy, the elimination of backward production capacity and pollution control.
The primary purpose of developing new energy is to reduce the pressure of the environmental emissions caused by traditional fossil energy usage [
36]. New energy refers to various forms of energy other than traditional energy, which are clean, less polluting and renewable—mainly including solar energy, wind energy and biomass energy [
37]. On the one hand, as an emerging high-tech industry, the new energy industry can attract investment and increase employment. After completion, the resource consumption and pollutant emissions during operations are far less than those of traditional fossil energy, thus improving the resource utilization rate and reducing the environmental pressure. At the same time, the development of new energy increases the innovation investment of enterprises, promoting technological innovation and regional economic development [
38]. On the other hand, many new energy investments have impacted the traditional energy industry. The new energy industry has enormous infrastructure costs, high investment in technology research and a long investment return cycle, which may negatively impact the development of the regional economy in a certain period [
39].
Eliminating backward production capacity is one of the primary measures to promote IGT [
40]. Many high-polluting and inefficient traditional energy and heavy chemical enterprises have been shut down, negatively impacting the economy and leading to significant unemployment. However, in order to reduce the backward production capacity, the technical standards of the industry have been continuously improved, thus, promoting technological innovation. It also forces resources to flow to more efficient industries, prompts the unemployed populace to move to newer occupations and generates re-employment, which, in turn, promotes the development of other low-pollution and high-efficiency industries and positively impacts the economy.
The key to IGT is to combat all kinds of pollution that is generated in the production process [
41]. The costs of combating pollution and the taxes paid for emissions increase the production costs of enterprises, which inhibits the expansion of enterprises; however, this also motivates enterprises to pay attention to research, to introduce green technologies and to improve product quality [
42], so as to increase the export of products, improve the competitiveness of enterprises, and drive the regional economic development [
43].
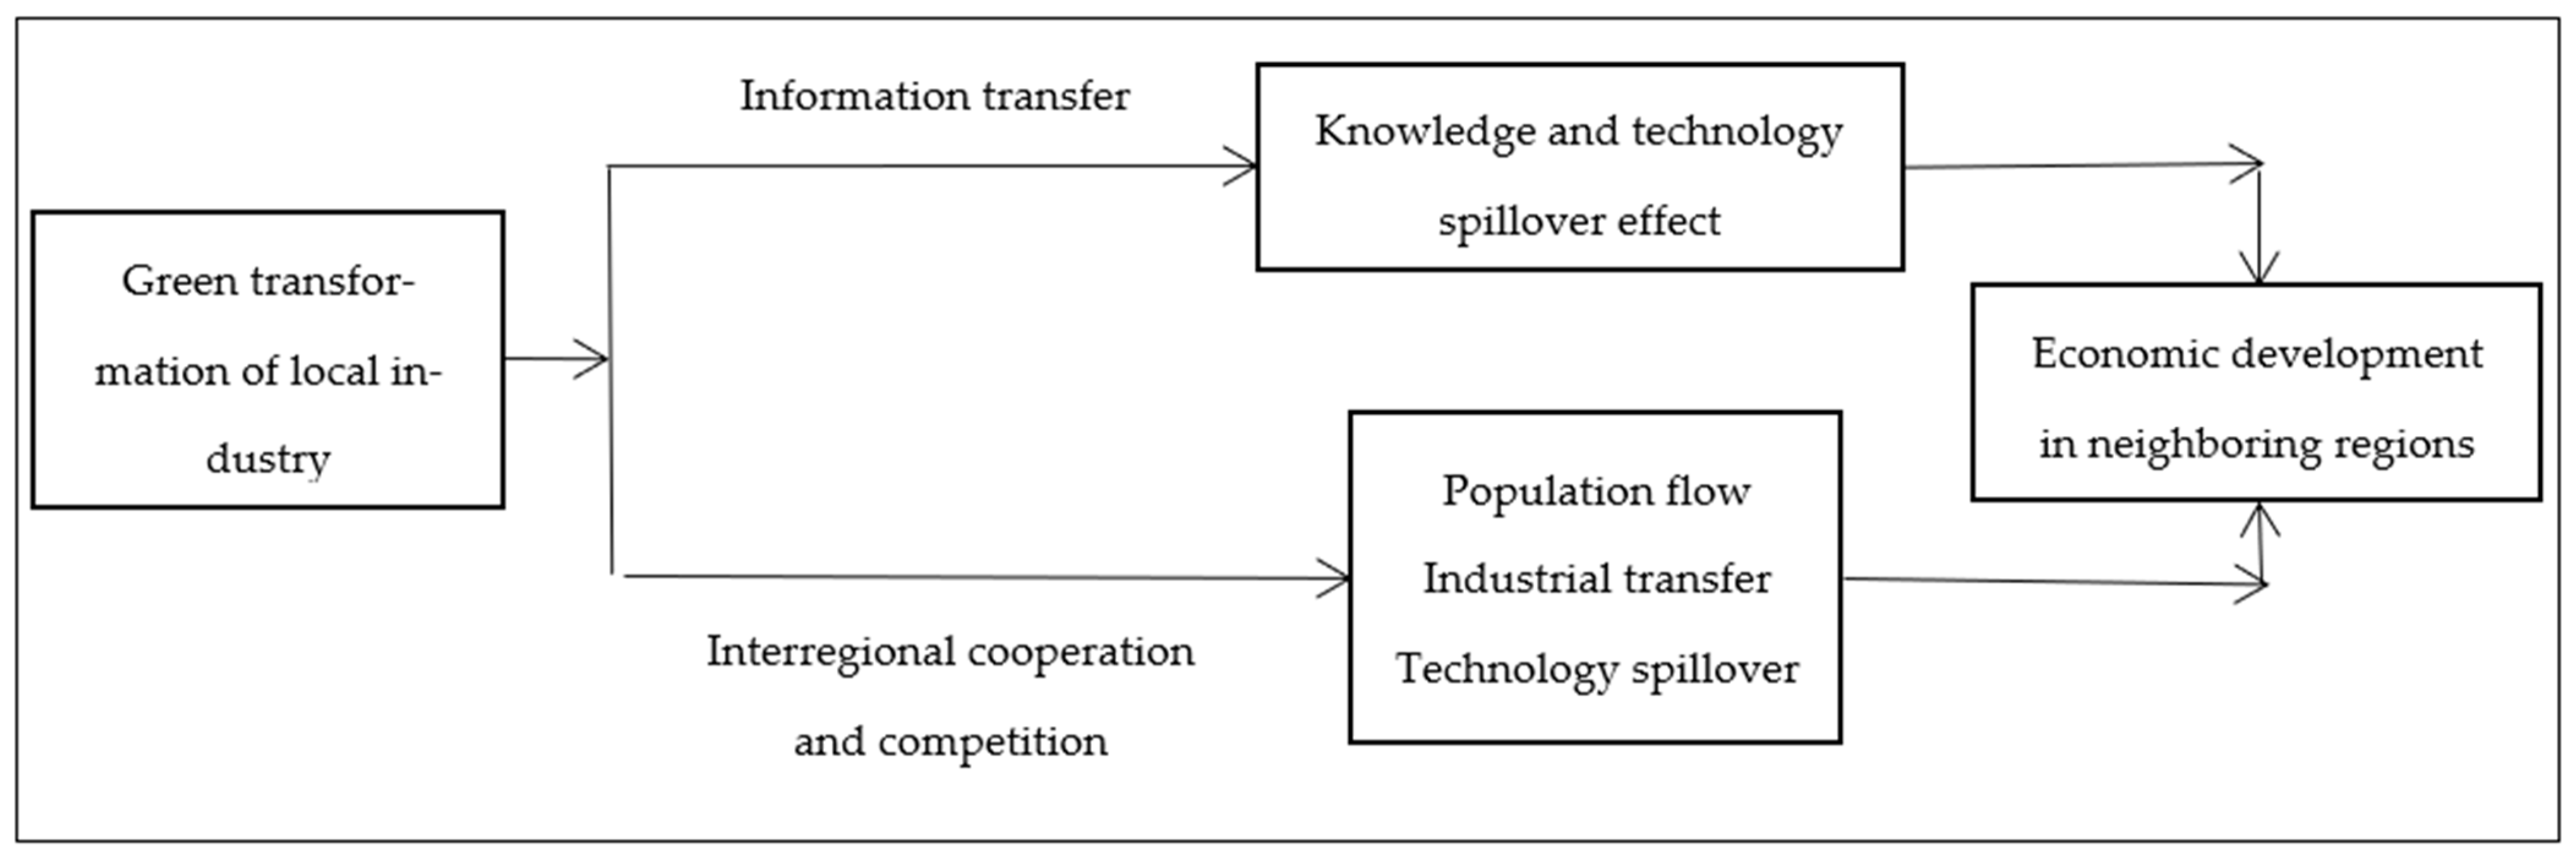
Based on the above analysis, this paper believes that IGT has an impact on regional economic development. Nowadays, with the development of information networks, the impact of informatization on IGT cannot be ignored [
44], as it has significant knowledge and technology spillover effects [
45]. In the process of information transmission, knowledge and technology are also transmitted. Moreover, due to different degrees of cooperation or competition among regions, the population flow, industrial transfer and technology spillover of IGT may also cause the economic spillover of IGT, as shown in
Figure 2.
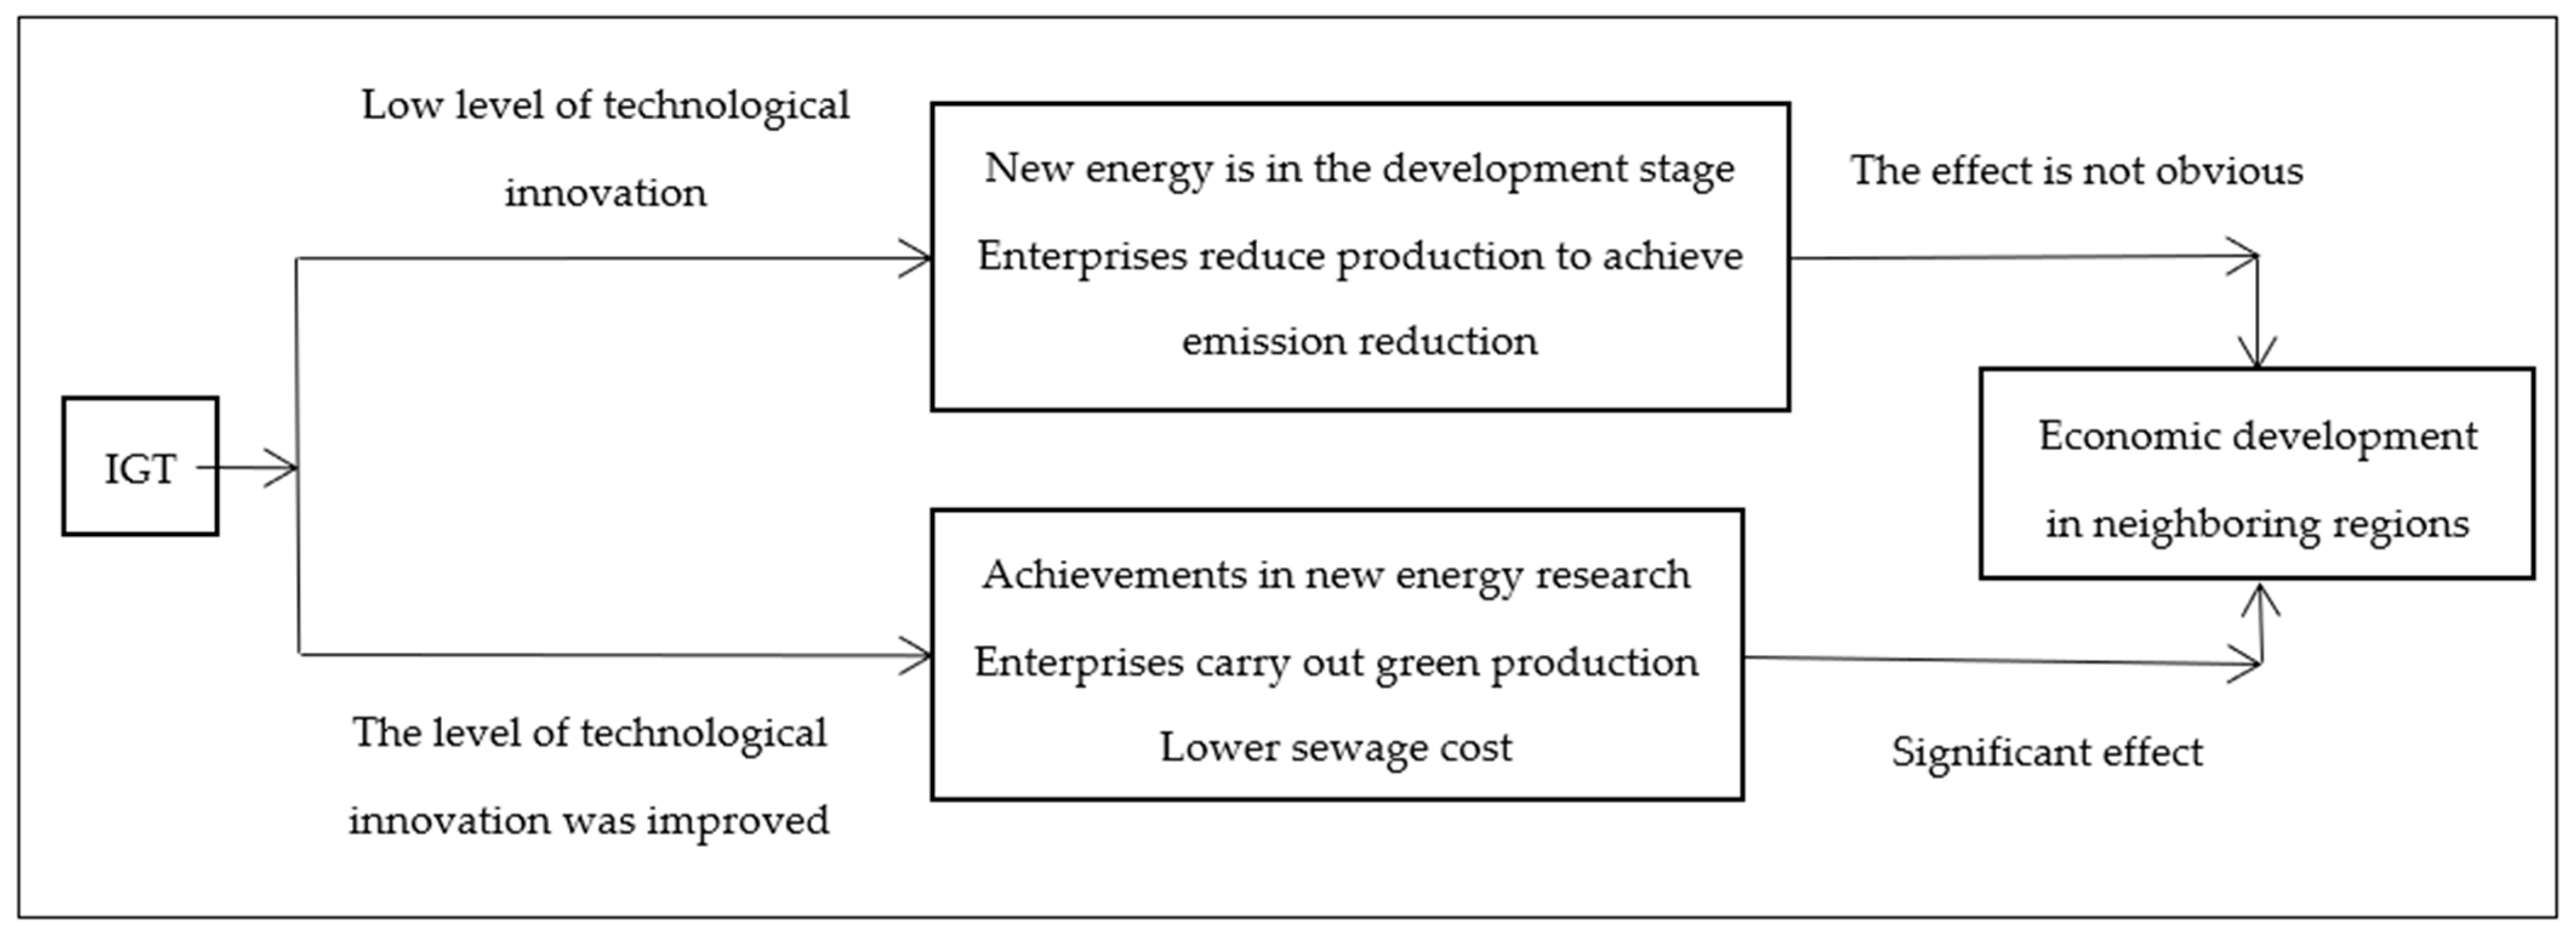
It is worth noting that technological innovation is always indispensable for the development of new energy, the elimination of backward production capacity or the treatment of pollution. In the early stage of industry, China mainly obtained foreign technology by imitation and introduction [
46]. With the process of industrialization, China began to dispense with technology dependence and to master the core technology independently [
47]. While China’s technological innovation is still at a low level and new energy is still under research, backward production capacity has been reduced, but the problem of low-capacity utilization has not been fundamentally solved, and the pollution control of enterprises still requires high costs. Therefore, when technological innovation is at a low level, IGT depends more on reducing production to achieve its goals, and its contribution to regional economic development is not obvious. With the continuous strengthening of China’s independent research and development capacity, more and more core technologies are in its own hands, and the level of technological innovation has been improved. The development of new energy has achieved remarkable achievements: total factor productivity has been improved [
48] and pollution has also been controlled. At this time, with the improvement of technological innovation, more and more independently created green innovative technologies are used in production. IGT relies more on green production and on technology to reduce emissions and to reduce enterprise costs. The transformation quality is constantly optimized. So IGT has a significant role in promoting regional economic development, as shown in
Figure 3.
Based on the above analysis, this study proposes the following hypotheses:
Hypothesis 1. IGT has spatial relevance and a spatial spillover effect on regional economic development in China.
Hypothesis 2. IGT promotes regional economic development in China, and the level of technological innovation influences this utility.
4. Research Design
This paper focused on the impact of IGT on regional economic development in China, as measured by constructing a five-dimensional indicator system and applying the entropy method. In terms of research methodology, this article used the Moran index to verify whether the IGT is spatially relevant, used a spatial model to examine whether there is a spatial spillover effect on the impact of IGT on regional economic development, selected technological innovation as the threshold variable and used a threshold model to study the impact of the IGT on regional economic development, under different levels of technological innovation.
4.1. Variables and Data
Based on the relevant theory and analyses above, the basic econometric model is as follows:
where,
is the region, and
is the year.
is the level of economic development and
is the level of industrial green transformation,
is human capital,
is industrial structure,
is government expenditure,
is urbanization level,
is foreign investment,
is technological innovation and
is the random error term.
4.1.1. Calculation of IGT
Based on the availability of data, this paper selected 2005 as the starting time of the study. This paper used the panel data of 30 provincial administrative regions in China (excluding Tibet, Taiwan, Hong Kong and Macao Special Administrative Regions) from 2005 to 2019 and selected an indicator system, which included the level of intensive use of energy resources, the degree of environmental pollution reduction, the level of industrial structure upgrading, the degree of productivity enhancement and sustainable development (see
Table 1 for the meaning of the indicator system). The entropy method was used to comprehensively determine each indicator’s weight to evaluate the development quality of IGT.
Table 1 presents data on industrial energy consumption from the China Energy Statistics Yearbook. Data on industrial water consumption, industrial SO
2 emissions, industrial wastewater emissions, and the comprehensive utilization rate of industrial solid waste were from the China Environment Statistics Yearbook. Among them, industrial solid waste refers to the solid waste generated in industrial production activities. The comprehensive utilization of industrial solid waste refers to the extraction of valuable components from bulk solid waste for the production of building materials, environmental protection materials and other materials, and the production of fertilizers, etc. In this paper, we defined the proportion of the comprehensive utilization of solid waste in production as the ratio of the amount of recycled industrial solid waste to the amount of total industrial solid waste. The data were obtained from the statistical yearbook [
49]. The provincial industrial CO
2 emission data were from the Carbon Emissions Accounts and Database. Due to the lack of data on the total output value of various industries over the years, this paper calculated the level of industrial structure upgrading based on the proportion of the assets of high-energy consumption industries in the assets of industrial enterprises above the scale, using data from the China Industrial Statistics Yearbook. The industrial added-value data involved in calculating the growth rate of total factor productivity came from the National Bureau of Statistics. The numbers of employees and fixed assets of the industrial enterprises above scale were obtained from the China Industrial Statistics Yearbook and provincial statistical yearbooks. The missing data in a few of the years were filled by linear interpolation or by the median method.
4.1.2. Variables
The indicators corresponding to the variables covered in this paper are shown in
Table 2 and can be explained as follows.
Explanatory variable: regional economic development. Regional economy refers to the complex production that is produced by the interaction between internal factors and the external conditions of economic development in a certain region. It is a regional development entity that takes a certain region as the scope and closely combines with economic factors and their distribution. As an important indicator to measure regional economic development, the Gross Domestic Product (GDP) is widely recognized in academic research as an effective indicator of regional economies [
50]. This paper selected regional GDP as the proxy variable for regional economic development.
Core explanatory variable: industrial green transformation (IGT). Based on the comprehensive indicator measurement system described in
Section 4.1.1, this paper obtained the comprehensive index of IGT for 30 provincial administrative regions in China, from 2005 to 2019.
Control variables: Many factors influence regional economic development. This paper selected the following control variables from existing studies: human capital, industrial structure, government expenditure, urbanization level, foreign investment and technological innovation [
51,
52,
53].
Human capital (HC): The demand for human capital is rising rapidly across all industries in China. The continuous accumulation of HC drives technology’s absorption and promotion and innovation, promoting regional economic development. This paper takes the proportion of college students in the permanent population as the proxy variable of HC.
Industrial structure (IS): At present, the secondary industry still dominates the industrial structure of most regions in China. The industrial structure adjustment has gradually shifted the focus from the secondary to the tertiary industry. High-technology industries replace traditional high-energy consumption industries, thereby having an impact on regional economic development. In this paper, we used the ratio of the tertiary industry’s added value to the secondary industry’s added value as a proxy variable for the IS [
54].
Government expenditure (GOV): As an essential macro-control instrument, the role of government expenditure in economic development cannot be ignored. It is mainly composed of expenditures on national defense, education, medical care, social security and others. The scale of expenditure has constantly been expanding, with different effects on the economic development of each area. This paper took the general budget expenditure of government finance as the proxy variable of government expenditure.
Urbanization level (UL): People tend to gather in areas with a high UL, which leads to a concentration of labor and a broadening of the consumer market. Simultaneously with the improvement of urbanization, the productivity of social labor also improves, with a consequent impact on regional economic development. This paper used the proportion of the urban population in the resident population as a proxy variable for UL.
Foreign investment (FI): Introducing advanced technology and abundant capital from abroad can increase local employment, change the IS and improve the export trade structure, thus, playing an essential role in regional economic development. This paper used the total investment of foreign-invested enterprises as a proxy variable for FI.
Technological innovation (TI): The application of technological innovation achievements can improve labor productivity, thus, significantly improving the profitability of enterprises and further driving the development of the regional economy. This paper used the sum of patent application authorizations for domestic inventions and utility models as a proxy variable for TI.
This paper conducted an empirical study, using the panel data of 30 provincial administrative regions (excluding Tibet, Taiwan, Hong Kong and Macao Special Administrative Regions) in China, from 2005 to 2019, as the sample. The data were mainly obtained from the China Industrial Statistical Yearbook, the China Environmental Statistical Yearbook, the China Energy Statistical Yearbook and the statistical yearbooks of each province. Some variables were logarithmised in this paper to eliminate data heteroscedasticity when conducting the regression analysis.
Table 3 presents the descriptive statistics of the variables.
From
Table 3, the mean value of IGT in the 30 provincial administrative regions was 0.655, the minimum value was 0.223, the maximum value was 0.928 and the standard deviation was 0.132, which indicates that there are differences in IGT among the regions, but that the development is stable. The large standard deviations indicate that China’s regional economic development, government expenditure and FI and TI are unbalanced, with significant disparities between regions. The standard deviation was small for HC, IS and UL, suggesting relatively stable development in various regions of China.
4.2. Models
4.2.1. Spatial Econometric Model
This paper used the spatial Durbin model (SDM) to test hypothesis one, which enabled an analysis of the direct effects of the variables on the region and the indirect effects on the neighboring regions, as follows:
where
is the spatial matrix that is set at a 0–1 spatial adjacency matrix.
is the elasticity coefficient of the spatial lag term of the explanatory variable and
denote the elasticity coefficient of each variable.
denote the coefficient of the effect of each variable on the economic development of neighbouring regions.
is the individual effect,
is the time effect and
is the random error term.
4.2.2. Panel Threshold Model
The panel threshold model can test whether there are one or more threshold values for a variable. When the threshold value is reached, the effect of other variables on the explained variable changes significantly or changes its development form; the variable’s threshold value is called the threshold. This paper selected TI (
) as the threshold variable to examine the non-linear relationship that exists between IGT and regional economic development, and the threshold model is as follows:
where
is a constant term,
is an indicator function taking the value 0 or 1 and
is the threshold to be estimated.
5. Results and Discussion
5.1. Measurement of IGT
5.1.1. Analysis of Measurement Results
Based on the provincial panel data of China from 2005 to 2019, the IGT index of each region in China was measured by Stata16 software (see
Table 4 and
Figure 4).
Table 4 presents the measurement results, where some years’ data were selected and sorted according to the mean value to observe the change in the IGT index. The “id” column in the table represents the number of the provincial administrative regions.
Table 4 and
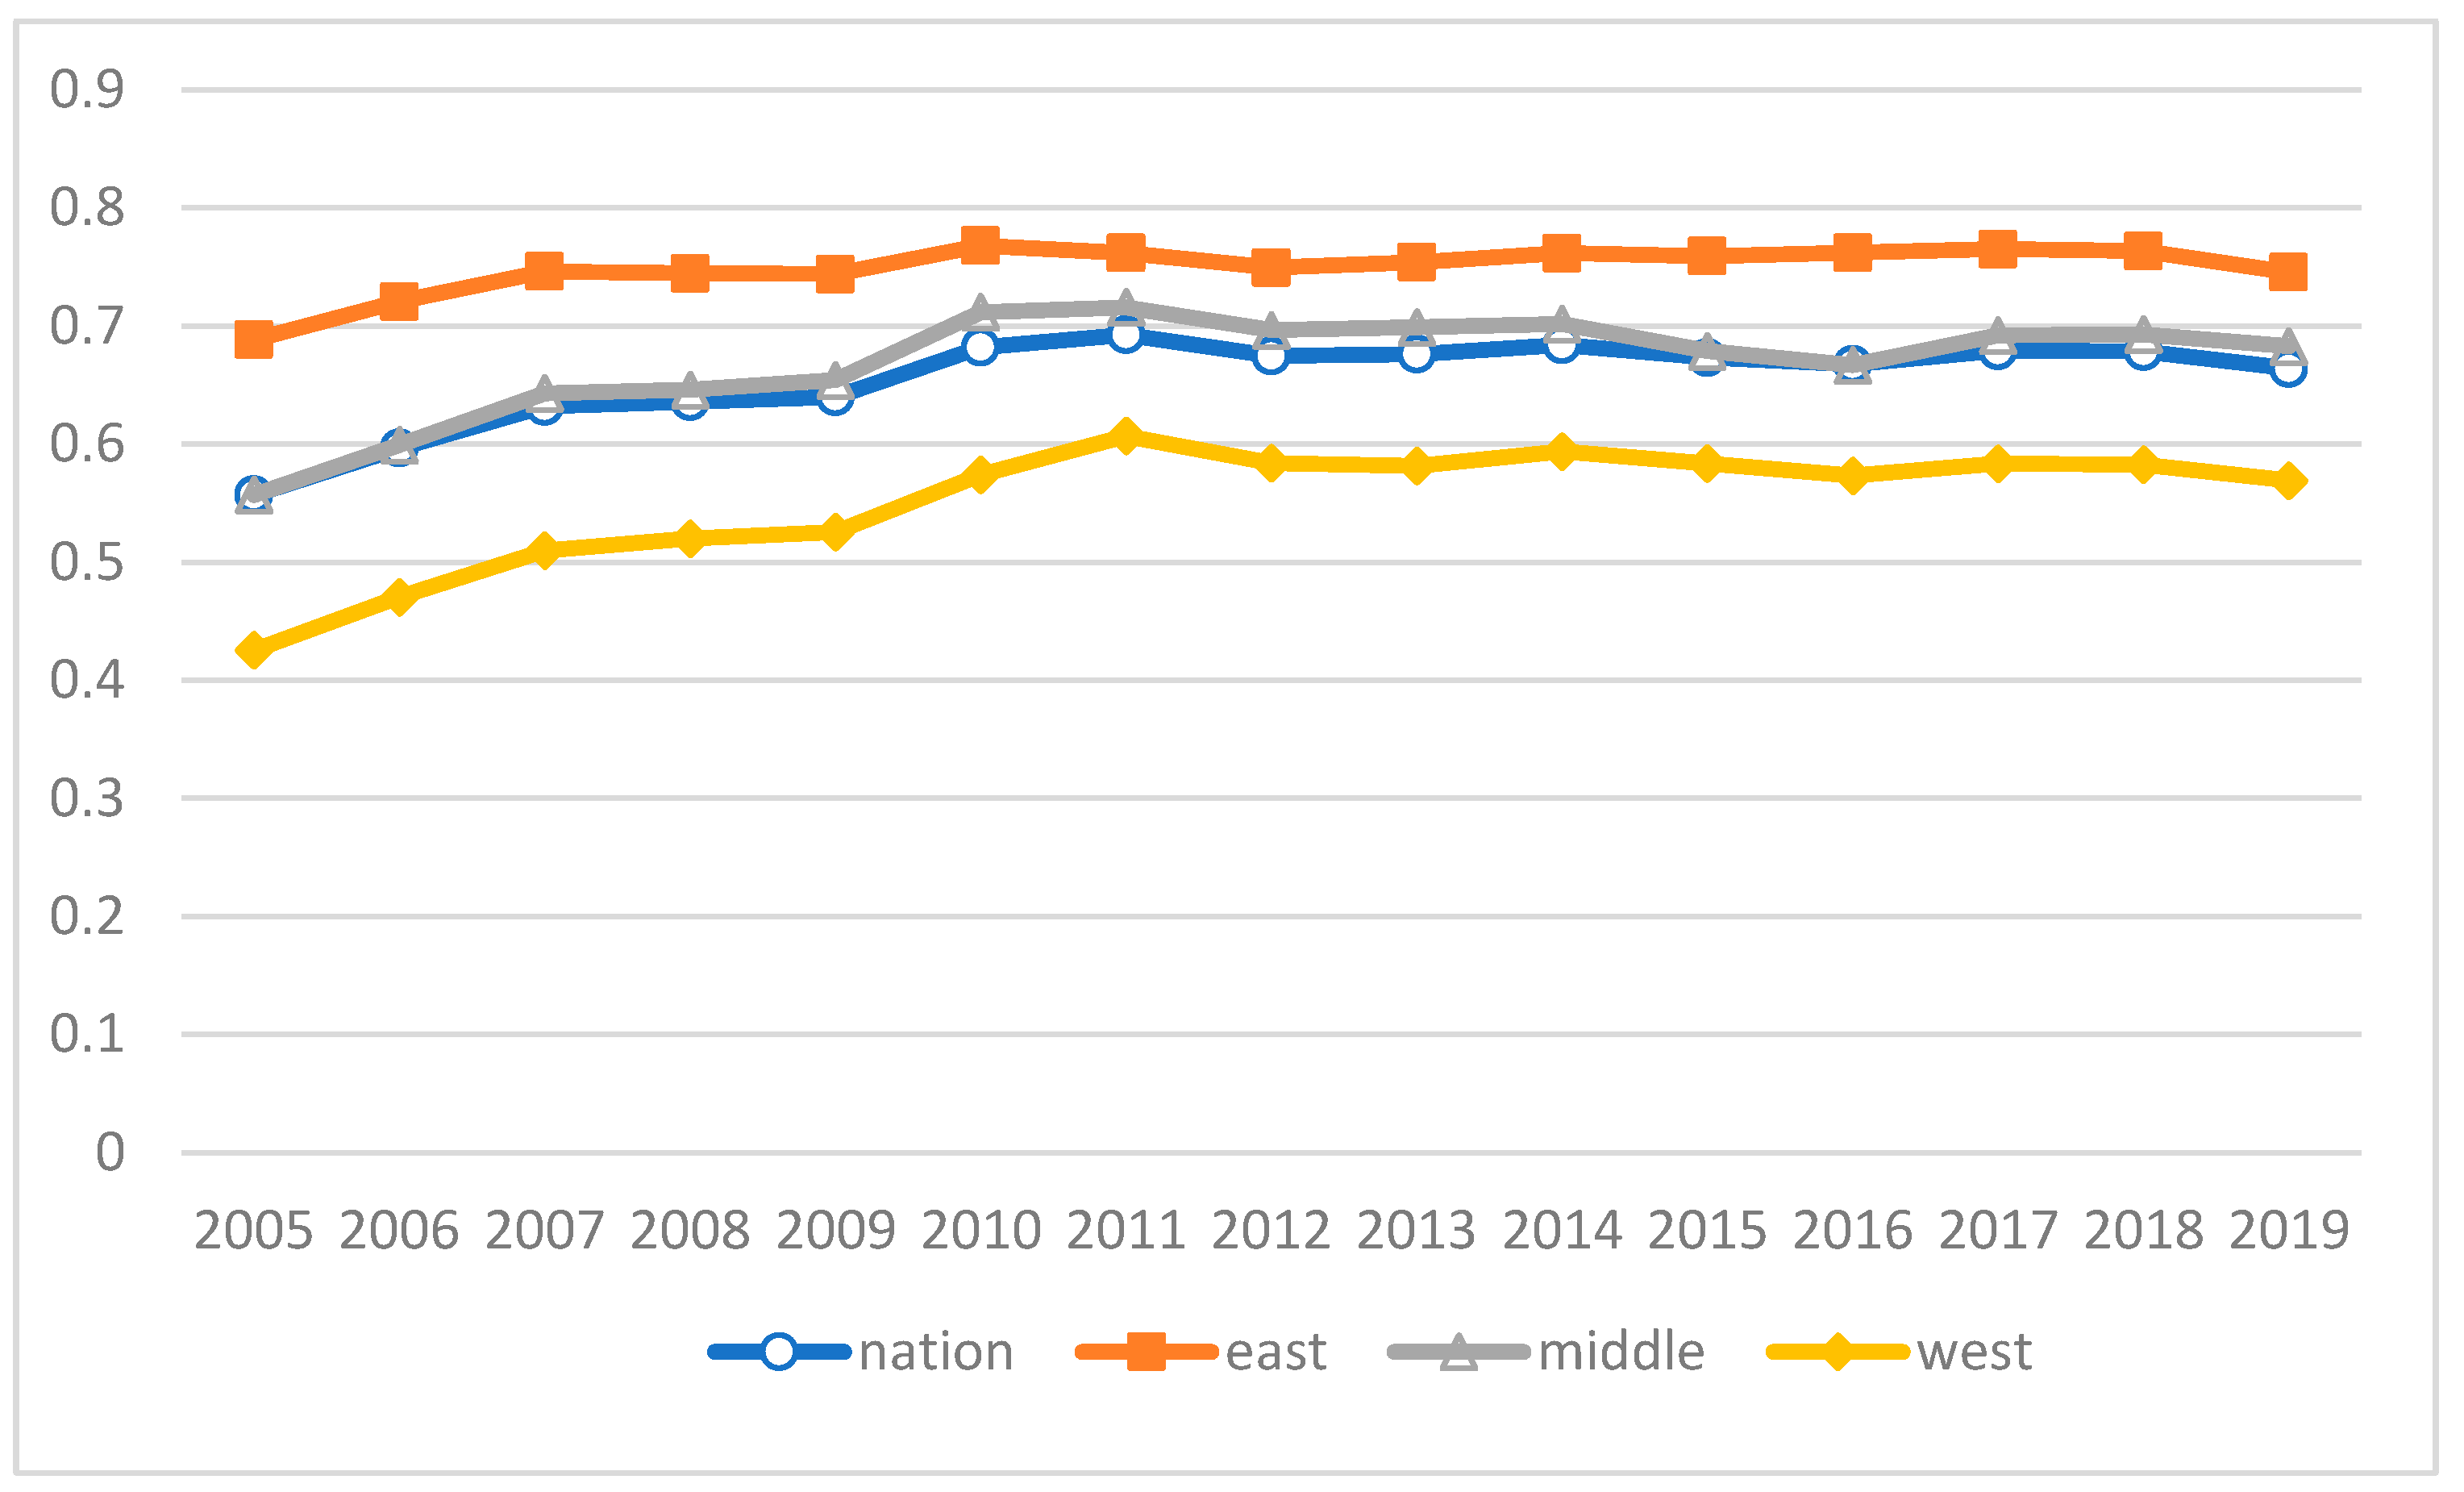
Figure 4 indicate significant differences in the level of IGT in different regions of China. From 2005 to 2019, Jiangsu, Tianjin, Shanghai, Shandong and Zhejiang ranked in the top five in the annual average IGT index, while the bottom five provinces were Qinghai, Ningxia, Gansu, Guizhou and Yunnan. China is divided into eastern, central and western regions by China’s National Bureau of Statistics. The eastern region of China includes Beijing, Tianjin, Hebei, Liaoning, Shanghai, Jiangsu, Zhejiang, Fujian, Shandong, Guangdong and Hainan. The central region includes Shanxi, Jilin, Heilongjiang, Anhui, Jiangxi, Henan, Hubei and Hunan. The western region includes Inner Mongolia, Guangxi, Chongqing, Sichuan, Guizhou, Yunnan, Shaanxi, Gansu, Qinghai, Ningxia and Xinjiang. According to this study’s calculation, the average value of IGT in the eastern region is 0.7489, which is significantly higher than 0.6691 and 0.5522 in the central and western regions, respectively. Capital-intensive and technology-intensive industries are concentrated in the eastern region, while the central and western regions receive a large number of energy-intensive and labor-intensive industries that are transferred from the eastern region. Most of the energy-intensive industries are transferred to the western region [
55]. As a result, in the eastern region, high-tech industries with low pollution and high efficiency have replaced traditional industries with high pollution and inefficiency as the center of the industrial structure and, thus, the level of IGT in this region is higher. The low-end manufacturing industry is concentrated in the central region, and the development of green industrial technology is slow, which makes the transformation level lower than that in the eastern region. After implementing the strategies of “Western Development” and “Revitalizing the old industrial base in Northeast China” in the western region, the speed of economic development has significantly increased; however, the rapid growth in energy consumption and the lagging development of green industrial technology have not achieved the expected effect on environmental protection. Therefore, there is still much room for improvement in IGT in the central and western regions.
5.1.2. Moran Index
This paper used Stata16 software to calculate the global Moran index of 30 provinces in China to analyze the spatial correlation of China’s IGT.
Table 5 presents the results.
The global Moran index of IGT under the spatial adjacency matrix ranged from 0.366 to 0.549. Both the p-values and z-values passed the significance test at the 1% level, indicating that IGT shows a positive spatial correlation between the regions. It can be seen that IGT among the 30 provinces has spatial agglomeration, which is consistent with the existing research conclusions. There is a widespread phenomenon of high-value areas being adjacent to high-value areas, and of low-value areas being adjacent to low-value areas. Through regional coordinated development, the frequent commercial and trade exchanges and close cooperation between neighboring provinces—especially in city clusters such as Beijing–Tianjin–Hebei, the Yangtze River Delta and the Pearl River Delta—promote energy-saving and environmental protection technology exchange and in-depth industrial cooperation among regions. Provinces can also jointly control industrial pollution, forming a spatial agglomeration of IGT.
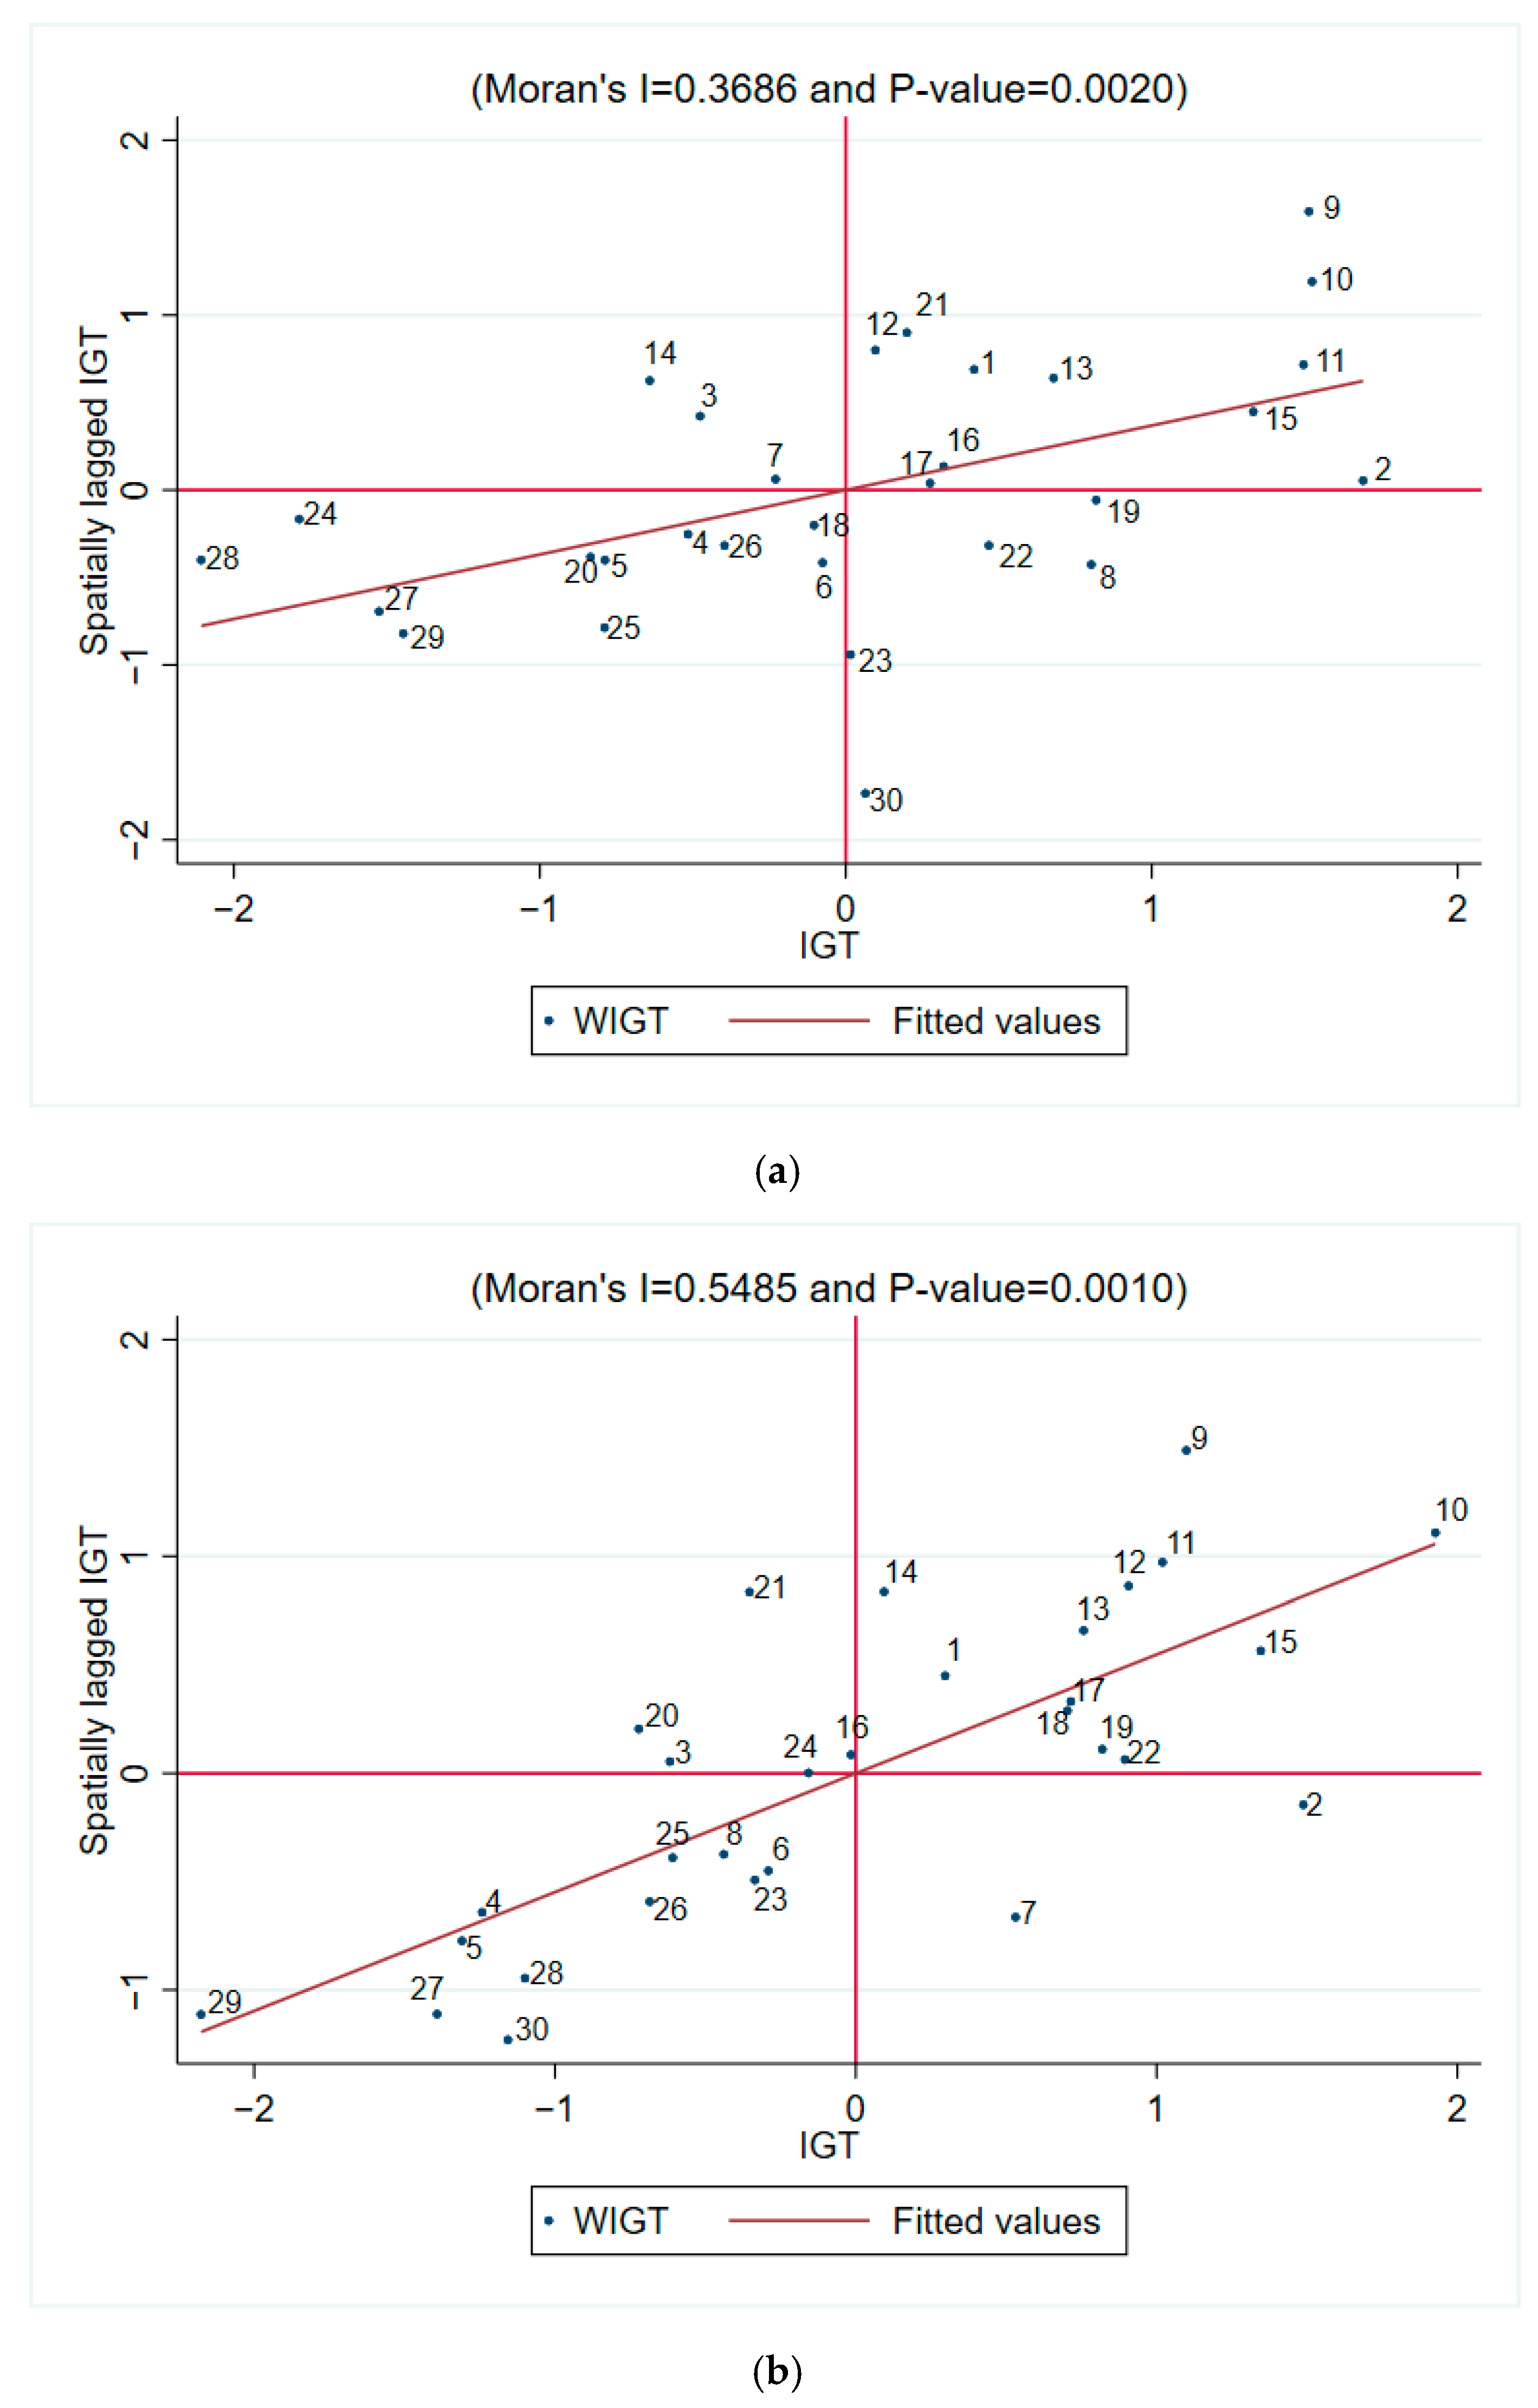
This paper also used Stata16 software to obtain local Moran scatter plots of the IGT in 2005 and 2019 for examining regional differences in the IGT in local space, as shown in
Figure 5 (the figures are the id columns in
Table 4 and represent the region numbers).
The points in
Figure 5 are generally concentrated in the first and third quadrants, with significant positive spatial correlation that is consistent with the global Moran index results. The first quadrant is the “high value–high value” agglomeration area, mostly in the eastern region, where the level of IGT is relatively high and promotes the IGT of the surrounding areas. The third quadrant is the “low value–low value” agglomeration area, mainly in the western region, where IGT is relatively low and cannot play a prominent radiating role to the neighboring regions. The second quadrant is the “low value–high value” agglomeration, where the level of IGT is lower than that of neighboring areas and is not driven by neighboring areas. The fourth quadrant is the “high value–low value” agglomeration, where the level of IGT is higher than that of neighboring areas, but the driving effect on neighboring areas is limited.
Comparing the local Moran index scatter plots of IGT in 2005 and 2019, introduces some observations and findings. First, most provinces in the eastern region have been in the first quadrant for a long time. Hainan has shifted from the high-value to the low-value zone, probably because the province focused on tourism development; therefore, its industrial green governance process is slower than Gangdong and other surrounding places. Hebei is in the second quadrant, indicating that its level of IGT is lower than the neighboring regions, probably because the industrial transfer from Beijing and Tianjin has increased heavy industrialization in Hebei, making industrial governance more difficult. Guangdong has played a better radiating role in driving the IGT of its neighboring regions, so it has shifted from the fourth quadrant to the first quadrant. Second, among the central regions, Anhui, Henan and Hubei, have long been driven by Shandong and Jiangsu and, thus, have been in the high-value zone. The level of IGT in Jiangxi and Hunan has improved under the influence of the surrounding regions, from low-value areas to high-value areas. The IGT in Heilongjiang has developed slowly, gradually at the same level as the neighboring regions, moving from a high-value to the low-value area. The IGT of Jilin has developed rapidly, from a low-value to a high-value area. As a significant coal province, the long-term development of the traditional energy industry has intensified the difficulty of the IGT in this province, so Shanxi has been in the low-value area. Lastly, most provinces in the western region have been in the third quadrant for a long time. The process of IGT in Xinjiang has gradually slowed down under the influence of the surrounding regions, from a high-value to a low-value area. In general, the IGT in the eastern region has a significantly higher driving effect on the surrounding regions than in other regions. Some central provinces have accelerated their IGT under the driving force of the eastern region. In contrast, the IGT in the western region has received limited radiation influence, and its development level is significantly lower than that of the central and western regions.
5.2. Spatial Spillover Effect Results
The analysis of the Moran index showed that China’s IGT has a positive spatial correlation. The spatial model should be tested to verify whether the IGT has a spatial spillover effect on regional economic development.
The Lagrange multiplier test results showed that two of the three tests for the spatial error model rejected the original hypothesis of “no spatial autocorrelation”. The two tests for the spatial lag model also rejected the original hypothesis, suggesting that a spatial econometric analysis should be conducted. The area, time and double-fixed effect were tested separately, and the results indicated that the original hypothesis was rejected at the 1% significance level, therefore, the time–space double fixed model was chosen. The Hausman test showed a negative test value, meaning that the original hypothesis is not valid, so the fixed-effect model was chosen. The likelihood ratio test showed that the original hypothesis was rejected, indicating that the SDM has a better spatial fit and was more suitable for this paper. After combining the above tests, the fixed-effect and time–space double fixed effect of the SDM were selected for the spatial econometric analysis of IGT and regional economic development.
Table 6 presents the model regression results.
From the results in
Table 6, in the non-spatial panel model, IGT has a significant positive role in promoting regional economic development. When the explained variable used lnperGDP to represent regional economic development, the regression result of the model was the same as the original model, and other variables have the same impact on regional economic development. There were only slight differences in the size and significance of the coefficient. It showed that the model is robust. The R
2 of SDM was 0.9898, and the log-likelihood value was 759.8107, indicating that the model has a good fit and a high degree of confidence. The spatial lag term coefficient rho was 0.249 and passed the significance test at the 1% level, indicating a significant positive spatial correlation between the economic development of adjacent regions. In addition, regional economic development is significantly and positively influenced by the local IGT, government expenditure, UL and TI. Furthermore, regional economic development is driven by IGT, IS, government expenditure, FI and TI in neighboring regions.
In terms of the core explanatory variable, both the non-spatial panel model and the SDM indicated the boosting effect of IGT on regional economic development in China. Next, according to the value of IGT, it was divided into two groups for fixed effect regression. The results showed that the IGT of the top 15 regions has a significant positive effect on regional economic development, indicating that the IGT of these regions has developed well and can bring economic benefits. However, the IGT of the 15 regions ranked behind inhibits regional economic development, but the effect is not significant, which indicates that the IGT measures in these regions need to be improved. In addition, the IGT and the spatially weighted term passed the significance test at the 5% level, indicating that IGT has a significant spatial spillover effect on regional economic development. In other words, IGT promotes economic development in neighboring regions. The possible reason is that most new industries involved in IGT are high-tech industries, which contribute more to economic development than the eliminated high-energy consumption industries. In addition, green technology reduces environmental impact and production costs and improves product quality, so it is more popular with consumers. Neighboring developed regions have more experience in coordinated development. In this process, the development of new industries and green technologies in the region drives the development of industries and technologies in the neighboring regions. As the number of technology-intensive and capital-intensive industries in the developed areas increase, the originally labor-intensive industries move to the neighboring undeveloped areas, promoting the economic development of the neighboring regions. With the transfer of industries, the undeveloped areas also take on some green technology in the process, which positively impacts economic development [
56].
In terms of the control variables, HC, government expenditure, FI and TI play a catalytic role in regional economic development. Furthermore, they have a significant positive effect on the economic development of neighboring regions through the competitive and demonstration effects. The UL promotes the region’s economic development, but it inhibits the economic development of neighboring regions. The possible reason is that the improvement of UL in this region attracts high-tech personnel resources and advanced technological resources from neighboring regions, thus, exerting a dampening effect on the economic development of neighboring regions. The IS has a suppressive effect on the region’s economic development; however, it has a positive economic spillover effect on neighboring regions. The current ratio structure of the tertiary industry to the secondary industry in China is still unreasonable. The economic base of some regions is not yet sufficient to support the region’s vigorous development of the tertiary industry, which does not match the consumer market. Furthermore, there is an imbalance in the allocation of resources, resulting in a negative impact on local economic development. The IS indirectly contributes to the economic development of neighboring regions, which may lead to the flow of resources to neighboring regions [
57].
This paper decomposed the SDM using partial differentiation to obtain the direct and indirect effects of the explanatory variables. The direct effect represents the impact of each explanatory variable on the region’s economic development, the indirect effect represents the impact of each explanatory variable on the economic development of neighboring regions and the total effect is the sum of the two, reflecting the impact of each explanatory variable on the regional economic development, as a whole.
Table 7 presents the results.
The sign of the coefficients in
Table 7 is consistent with
Table 6, excluding the difference in the size and significance of the coefficients, indicating that the model estimation results are robust. In addition, comparing the magnitude of the coefficients of the non-spatial panel model with the SDM, indicated that a fixed-effect model, which does not consider spatial effect, can overestimate or underestimate the impact of the explanatory variables on regional economic development. Regarding the core explanatory variable, IGT, the coefficient in the non-spatial panel model was 0.239, while the direct effect coefficient in the SDM was 0.240, indicating that the non-spatial panel model underestimated the impact of IGT on regional economic development. Among the control variables (excluding the utility of HC and IS, which were underestimated), the effects of government expenditure, UL, FI and TI on regional economic development were overestimated. Therefore, the SDM considers the spatial effect, which is more realistic.
5.3. Panel Threshold Effect Results
The previous section analyzed the spatial spillover effect of IGT on regional economic development in China. A panel threshold model was used to test the non-linear relationship between IGT and regional economic development. TI was chosen as the threshold variable to examine whether the level of TI constrains the impact of IGT on regional economic development. The variable’s threshold number was tested by Stata16 software.
Table 8 presents the results.
The results indicated that TI’s double and triple threshold did not pass the test. The single threshold passed the significance test at the 5% level, indicating a single threshold effect of TI on the impact of IGT on regional economic development in China. The regression analysis was conducted by the single threshold model and the results are shown in
Table 9. The threshold value for lnTI was 9.8801, which had a 95% confidence interval of [9.8552, 9.8822].
The threshold regression results showed that the influence of IGT on regional economic development varies under different TI levels. When the level of TI is below the threshold, the IGT has a facilitating effect on regional economic development, with a coefficient of 0.126, which does not pass the significance test. When the level of TI was greater than the threshold, the coefficient of the impact of IGT on regional economic development was 0.221, passing the significance test at the 1% level. This result showed that the level of TI influences the role of IGT on regional economic development in China. As TI continues to improve, the impact of IGT on regional economic development is significantly enhanced. This finding indicates that, with the development of TI, IGT relies more on technology, and the quality of transformation is continuously optimized, promoting regional economic development. At present, the TI level in China mainly reaches above the threshold value in the eastern and central regions. As of 2019, the level of TI in Shanxi, Jilin, Heilongjiang and Hainan had not yet reached the threshold, and their IGT was lower than in other eastern and central regions. Therefore, the contribution of the IGT in the areas mentioned above to regional economic development was limited. Among the western regions, Sichuan, Shaanxi and Chongqing all reached the TI threshold after 2015. The IGT in these three provinces is also higher than in other western provinces; therefore, it has a more significant role in promoting regional economic development.
6. Conclusions and Policy Implications
This paper used the panel data of 30 provincial administrative regions in China (excluding Tibet, Taiwan, Hong Kong and Macao Special Administrative Regions) from 2005 to 2019 to empirically test the impact of IGT on regional economic development, by constructing a spatial model and a threshold model. The spatial model study showed a spatial spillover effect of IGT, promoting the region’s economic development and having economic spillover on adjacent regions. The result of the threshold model showed that when the level of TI increases and exceeds the threshold, it will promote IGT, which plays a positive role in promoting regional economic development.
Based on the above conclusions, this paper makes the following recommendations to promote the green transformation of industry in all regions of China and to give full play to IGT in promoting regional economic development.
First, the eastern region should drive the central and western regions to accelerate IGT. The eastern, central and western regions have different IGT development levels, and IGT between adjacent regions is highly correlated. Most of the eastern regions have a higher level of IGT; therefore, in driving the central and western regions to conduct IGT, the eastern region should consider the demand for funds and focus on providing technical and talent support and related green production technology while transferring industries.
Second, we should actively promote TI and IGT. The result of the threshold model showed that the level of TI affects the role of IGT on regional economic development. At the same time, the level of TI also has an obvious driving effect and a spatial spillover effect on regional economic development. The eastern region should rely on its existing technological level and the advantage of talent inflow, to increase technological investment, strengthen inter-regional technological cooperation, reasonably allocate resources and coordinate economic development. As for the central and western regions, the government could adopt relevant welfare or subsidy policies to retain talent in universities, attract enterprises with innovative capabilities, introduce advanced technological equipment and improve the research environment. At the same time, foreign investment projects could be appropriately introduced to acquire advanced green technology and enterprise management methods. These can be adjusted in conjunction with China’s production model to effectively manage pollution emissions.
Third, reasonably arrange industrial transfer and promote the rationalization of industrial structure. In the process of industrial transfer, all regions should consider the subsequent transfer of pollution, technology and resources. At the same time, the government should try to promote corresponding technologies to improve resource utilization and reduce pollution. As a region undertaking industrial transfer, in addition to considering whether its own conditions can accept industrial migration, its own needs cannot be ignored. The regional governments should not only consider the economic benefits and expansion effects, but also give full play to the optimization effect of industrial transfer, improve the industrial structure of the moved-out and undertaken areas, and promote the overall structural rationalization.
Fourth, we should adapt to local conditions, strengthen cooperation and promote the synergistic development of regional economies. There are significant disparities in the economic development of the different regions in China. Each region should consider its characteristics and the spatial spillover effects of elements—such as IGT, government expenditure, FI and TI—formulate better policies, strengthen inter-regional cooperation, rationally allocate resources and promote synergistic economic development. For example, China’s uneven energy distribution has led to a shortage of electricity in the eastern coastal areas, while the northwest is rich in coal resources and the southwest is abundant in water resources. Therefore, since 2001, the eastern and western regions have started regional energy cooperation. The western regions have transmitted power to the eastern regions, and the number of regions participating in this project has been increasing. The eastern regions can provide capital investment and technical assistance to the western regions.


