1. Introduction
The Olympic Games are the most watched sports event in the world. The fierce battle for a better reputation among the hosts makes all of them invest large expenditures into Olympic infrastructure [
1]. The government attaches great importance to new connections built for mega-events, which are expected to bring benefits to host cities, including economic benefits, stimulation of consumption, and enhancement of the image of the host country [
2]. Indeed, mega-events can also bring direct convenience and benefit [
3]. For example, the Shinkansen, mostly built for the 18th Olympic Games in Tokyo, provided a great boost to the coordinated development of Tokyo, Nagoya, and Osaka. The Shinkansen provided a new stimulus for Japan’s economic growth and social development, while also setting a new model for the economic and sustainable utilization of Olympic infrastructure, which accords with the sustainable development the IOC proposed. However, academic opinion is divided regarding the sustainability and rationality of mega-events, such as the Olympic Games. Some scholars consider that “mega-events are windows of opportunity and political levers”, which could make the host and surrounding cities’ governments work towards the common goal, and promote upgrades in the cross-regional infrastructure [
4]. On the other hand, some scholars consider that construction with a strong purpose (for the Olympics) [
5], produced over a short time (i.e., a short construction period) may count against the overall host city’s infrastructure, without completely testing its rationalization and optimization. Heavy expenditure to meet a two week period of peak demand may result in severe over-construction [
6].
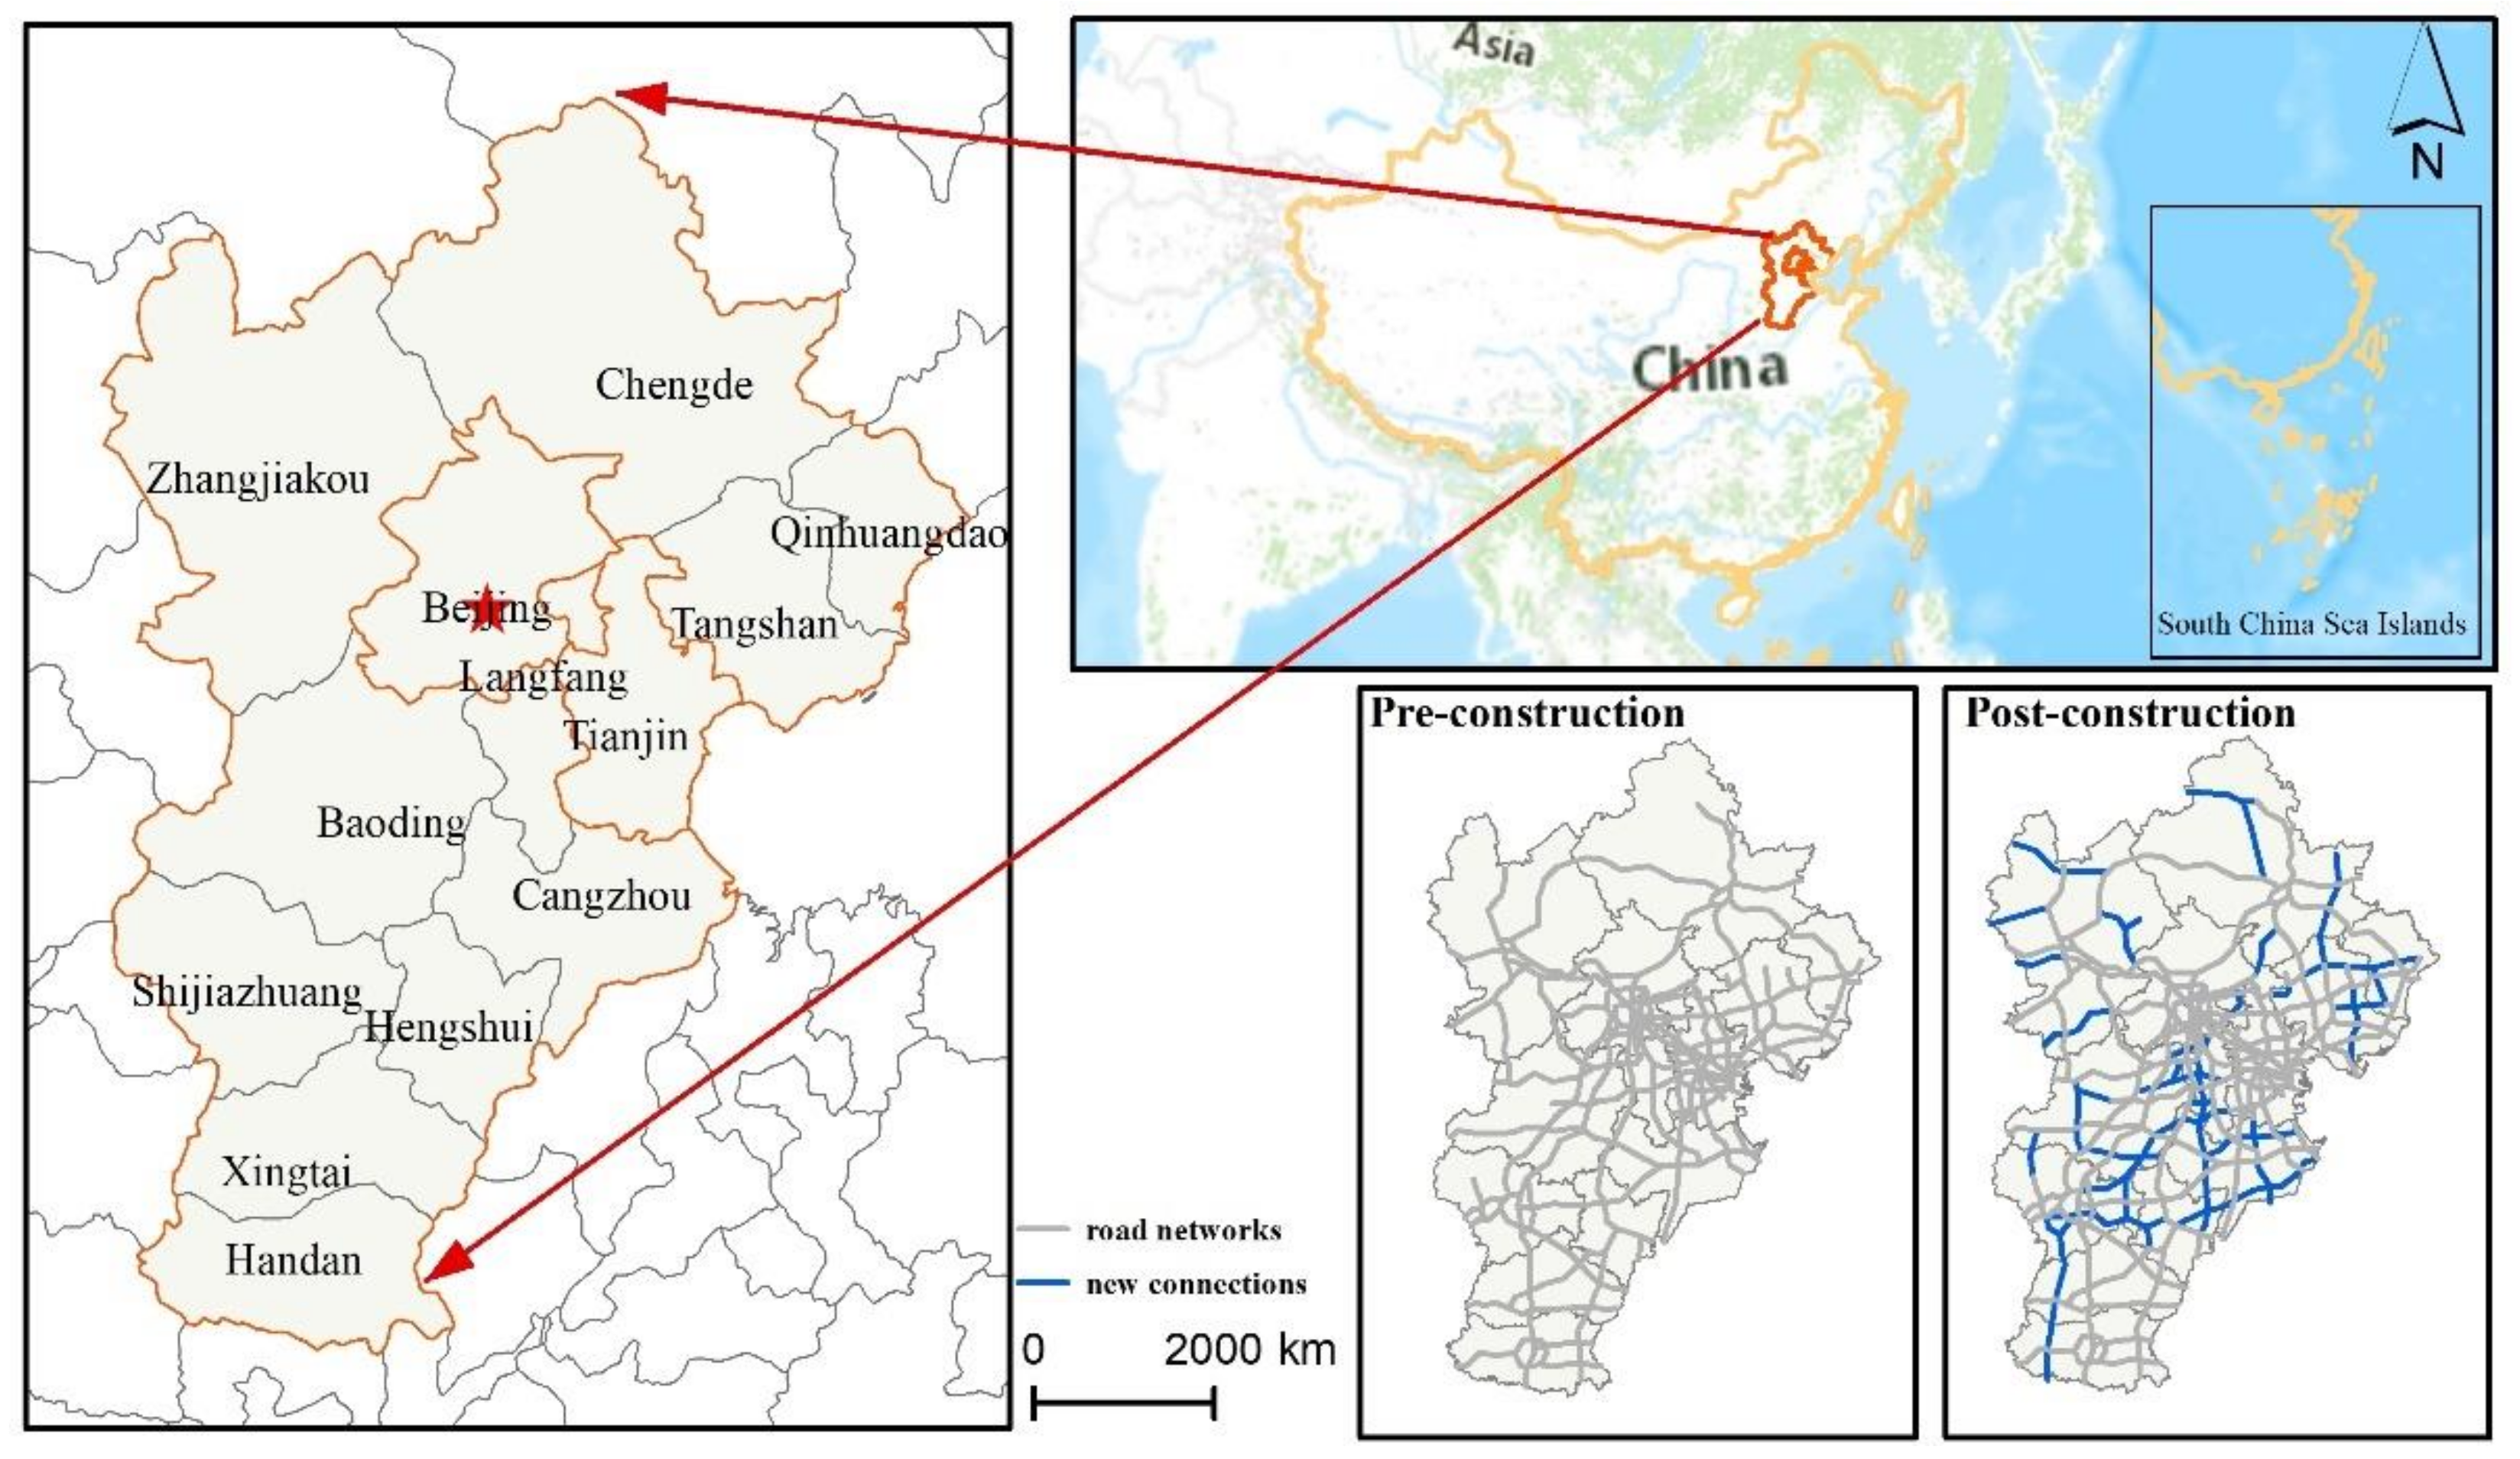
The Beijing–Tianjin–Hebei region is the largest economic region in Northern China, and its coordinated development strategy is of vital importance. By hosting the Olympic Winter Games, Beijing and Zhangjiakou align the Olympics with the national development strategy, aiming to accelerate regional coordinated development and benefit more people along the way [
7]. The Chinese government attaches great importance to the preparations for the Beijing 2022 Winter Games and is creating new connections built for Olympic Games to link Beijing, Yanqing, and Zhangjiakou (
Figure 1). However, it is still not clear that how the construction of the connections will impact the overall Beijing–Tianjin–Hebei spatial structure and whether it is beneficial to sustainable development.
Regarding the research questions addressed in this study, two streams of the literature are most relevant, namely the research on evaluating the impact of the connections’ construction for the Olympic Games or mega-events on regional transportation, as well as investigating the impact of connections on regional economic development. The research on evaluating the impact of connections built for the Olympic Games or other mega-events on regional transportation mainly focuses on traffic impact prediction [
8] and traffic contingency plans. For example, Yang, JS et al. developed a short-term traffic signal timing adjustment solution for the high-volume traffic movements associated with special events so that progression is as efficient as possible [
9]. Shen, L et al. constructed a mixed-integer linear programming model to explore the emergency resource location and allocation in a traffic contingency plan for sports mega-events [
10]. In terms of methodology, current scholars are more likely to use simulation models and evacuation time algorithm models to research the control of large-scale event traffic systems, such as Hu Hong et al. formulating emergency traffic evacuation plans for the 2008 Olympics Games in Beijing, based on a link-node road network simulation to improve the service guarantee level of large-scale event road systems [
11]. Existing research has mostly focused on traffic regulation in and around the venues. However, there is less research on systematically evaluating the impact of new connections built for mega-events on regional transportation. Research on the impact of the road on regional economic development is currently focused on the interaction between regional economies and transport [
12]. For example, Wang et al. analyzed the road density and passenger proportion, and build an evaluation model for transportation and economic coordinated development [
13]. Likewise, Chen et al. simulate the accessibility of the city network and its influence on regional development patterns based on an integrated land transport system [
14].
Although many models have been utilized to evaluate transport system construction, the existing studies mainly evaluated it through statistical indicators that ignored the generic form of the road which enhances the efficiency of the transportation, such as the topology [
15]. Moreover, the current research methods are limited in their ability to evaluate the regional transportation construction with multi-level and multi-node pattern. This may lead to over-construction, increasing road density while reducing overall efficiency and increasing construction costs [
16].
In this paper, we evaluate the impact of new connections built for the 2022 Winter Olympics on regional network spatial structure and, in doing so, bring the transport foreground to light using spatial design network analysis (sDNA) with exploratory spatial data analysis (ESDA). This research is of great practical significance in terms of keeping the connections running with long-term stability and constantly creating better economic effects.
This paper is organized as follows.
Section 2 reviews the related literature.
Section 3 describes the models. Then,
Section 4 evaluates the new connections, analyses the impact on the spatial structure of roads and cities and brings the foreground network to light. Finally,
Section 5 concludes the results and presents further discussions on the region’s sustainable development.
2. Materials and Methods
2.1. Spatial Design Network Analysis, sDNA
Different methods have been proposed to quantitatively evaluate road morphology, and most of the existing quantitative methods calculate from a mathematical and theoretical perspective. However, space syntax attempts to examine the relationship between behavior and space by examining behavior not merely concerning its local setting (in which the perceptual typically dominates) but also concerning the global setting in which it occurs, where the cognitive dimension of behavior comes into play by necessity [
17]. Therefore, space syntax can reflect the complex relationships between spaces, all of which are interrelated in an overall spatial structure [
18].
The sDNA improved the space syntax, and was selected because the weight used in the model offers an advantage in transportation with multi-level and multi-node characteristics. Furthermore, sDNA focuses on urban networks and transport systems, namely networks for vehicles, pedestrians (indoors and out), cyclists, and public transport. A mixture of distance and angle measurements is used to model the real road, making it closer to reality.
The
NQPDA (
X) equation is used to predict the potential of to-movement, centrality, which refers to the movement passing through on the shortest routes from all points to all other points in the layout [
18]. The roads with a higher
NQPDA (
X) represents that the roads are more clustered and have a stronger attraction to the surrounding roads. The
NQPDA (
X) equation is calculated by the following formula:
In Equation (1), P (y) denotes the weight of node y in the search radius. When analyzing continuous space, P (y) ϵ [0, 1]. When analyzing discrete space, P (y) takes the value of 0 or 1; d (x,y) denotes the shortest topological distance from node x to node y, and NQPDA (X) is the integration degree.
In the sDNA,
TPBt (
X) is used to predict the through-movement, potential accessibility, which is defined as the movement passing through on the shortest path from all points to all other points in the layout. The road with a higher
TPBt (
X) reveals that its accessibility is better.
TPBt (
X) is calculated by the following formula:
In Equation (2), OD (y,z,x)denotes the shortest topological path between nodes y and z through node x within the search radius. In Equation (3), TPBt (X) denotes the degree of penetration of node x.
2.2. Gravity Model
An individual moves to a place which attracts it or satisfies its need, and the aggregation of these movements emerges to create a collective behavior called mobility [
19]. When hosting mega-events, such as the Olympic Games, increased mobility to near the host is expected to boost the local economy and sustain the host city’s brand [
20]. The gravity model was used for various real-world networks, such as the world trade network [
21] and the collaboration network [
22]. In this paper, we applied the gravity model to predict the flows changed by the construction of new connections. The calculation formula is as follows:
In Equation (4), Rij is the strength of gravitational linkage between regions i, j, while Gi, Gj is the regional GDP of regions i, j; Dij is the travel time distance between regions i, j, based on the shortest path of the road network.
2.3. Spatial Sustainability
Spatial sustainability focuses on the geometric and configurational ordering of space in the city. The generic spatial form of the city in and of itself contributes to sustainability. The generic form of the city, which is reflected by sDNA as a foreground network of linked centers at all scales set into a background network of large space, seems already to be created by the interaction of economic and social factors, against a background network of the minimization of the energy required for movement through the creation [
23]. Moreover, Getis-Ord Gi* and Moran’s I are usually used to further identify agglomeration types and areas. Moran’s I is selected to verify whether road indicators are spatially correlated. Getis-Ord Gi* can be used to help and bring the transport foreground to light. The foreground of transportation contributes to regional coordinated development.
The result of Moran’s I is calculated as the z-score; the lower the score, the tighter the low-value clustering and, vice versa, the tighter the high-value clustering.
In Equation (5), is the spatial weight between elements
i and
j;
zi (
zj) is the deviation of the attribute of element
i (
j) from its mean; n is the total number elements in Equation (6), and S
0 is the aggregation of all spatial weights.
In Equation (7), is the spatial weight between elements i and j; n is the total number of spatial elements; is the mean value of spatial elements. In Equation (8), S is the standard deviation of spatial elements, and is the attribute value of spatial element j.
3. Results
3.1. In Pre-Construction
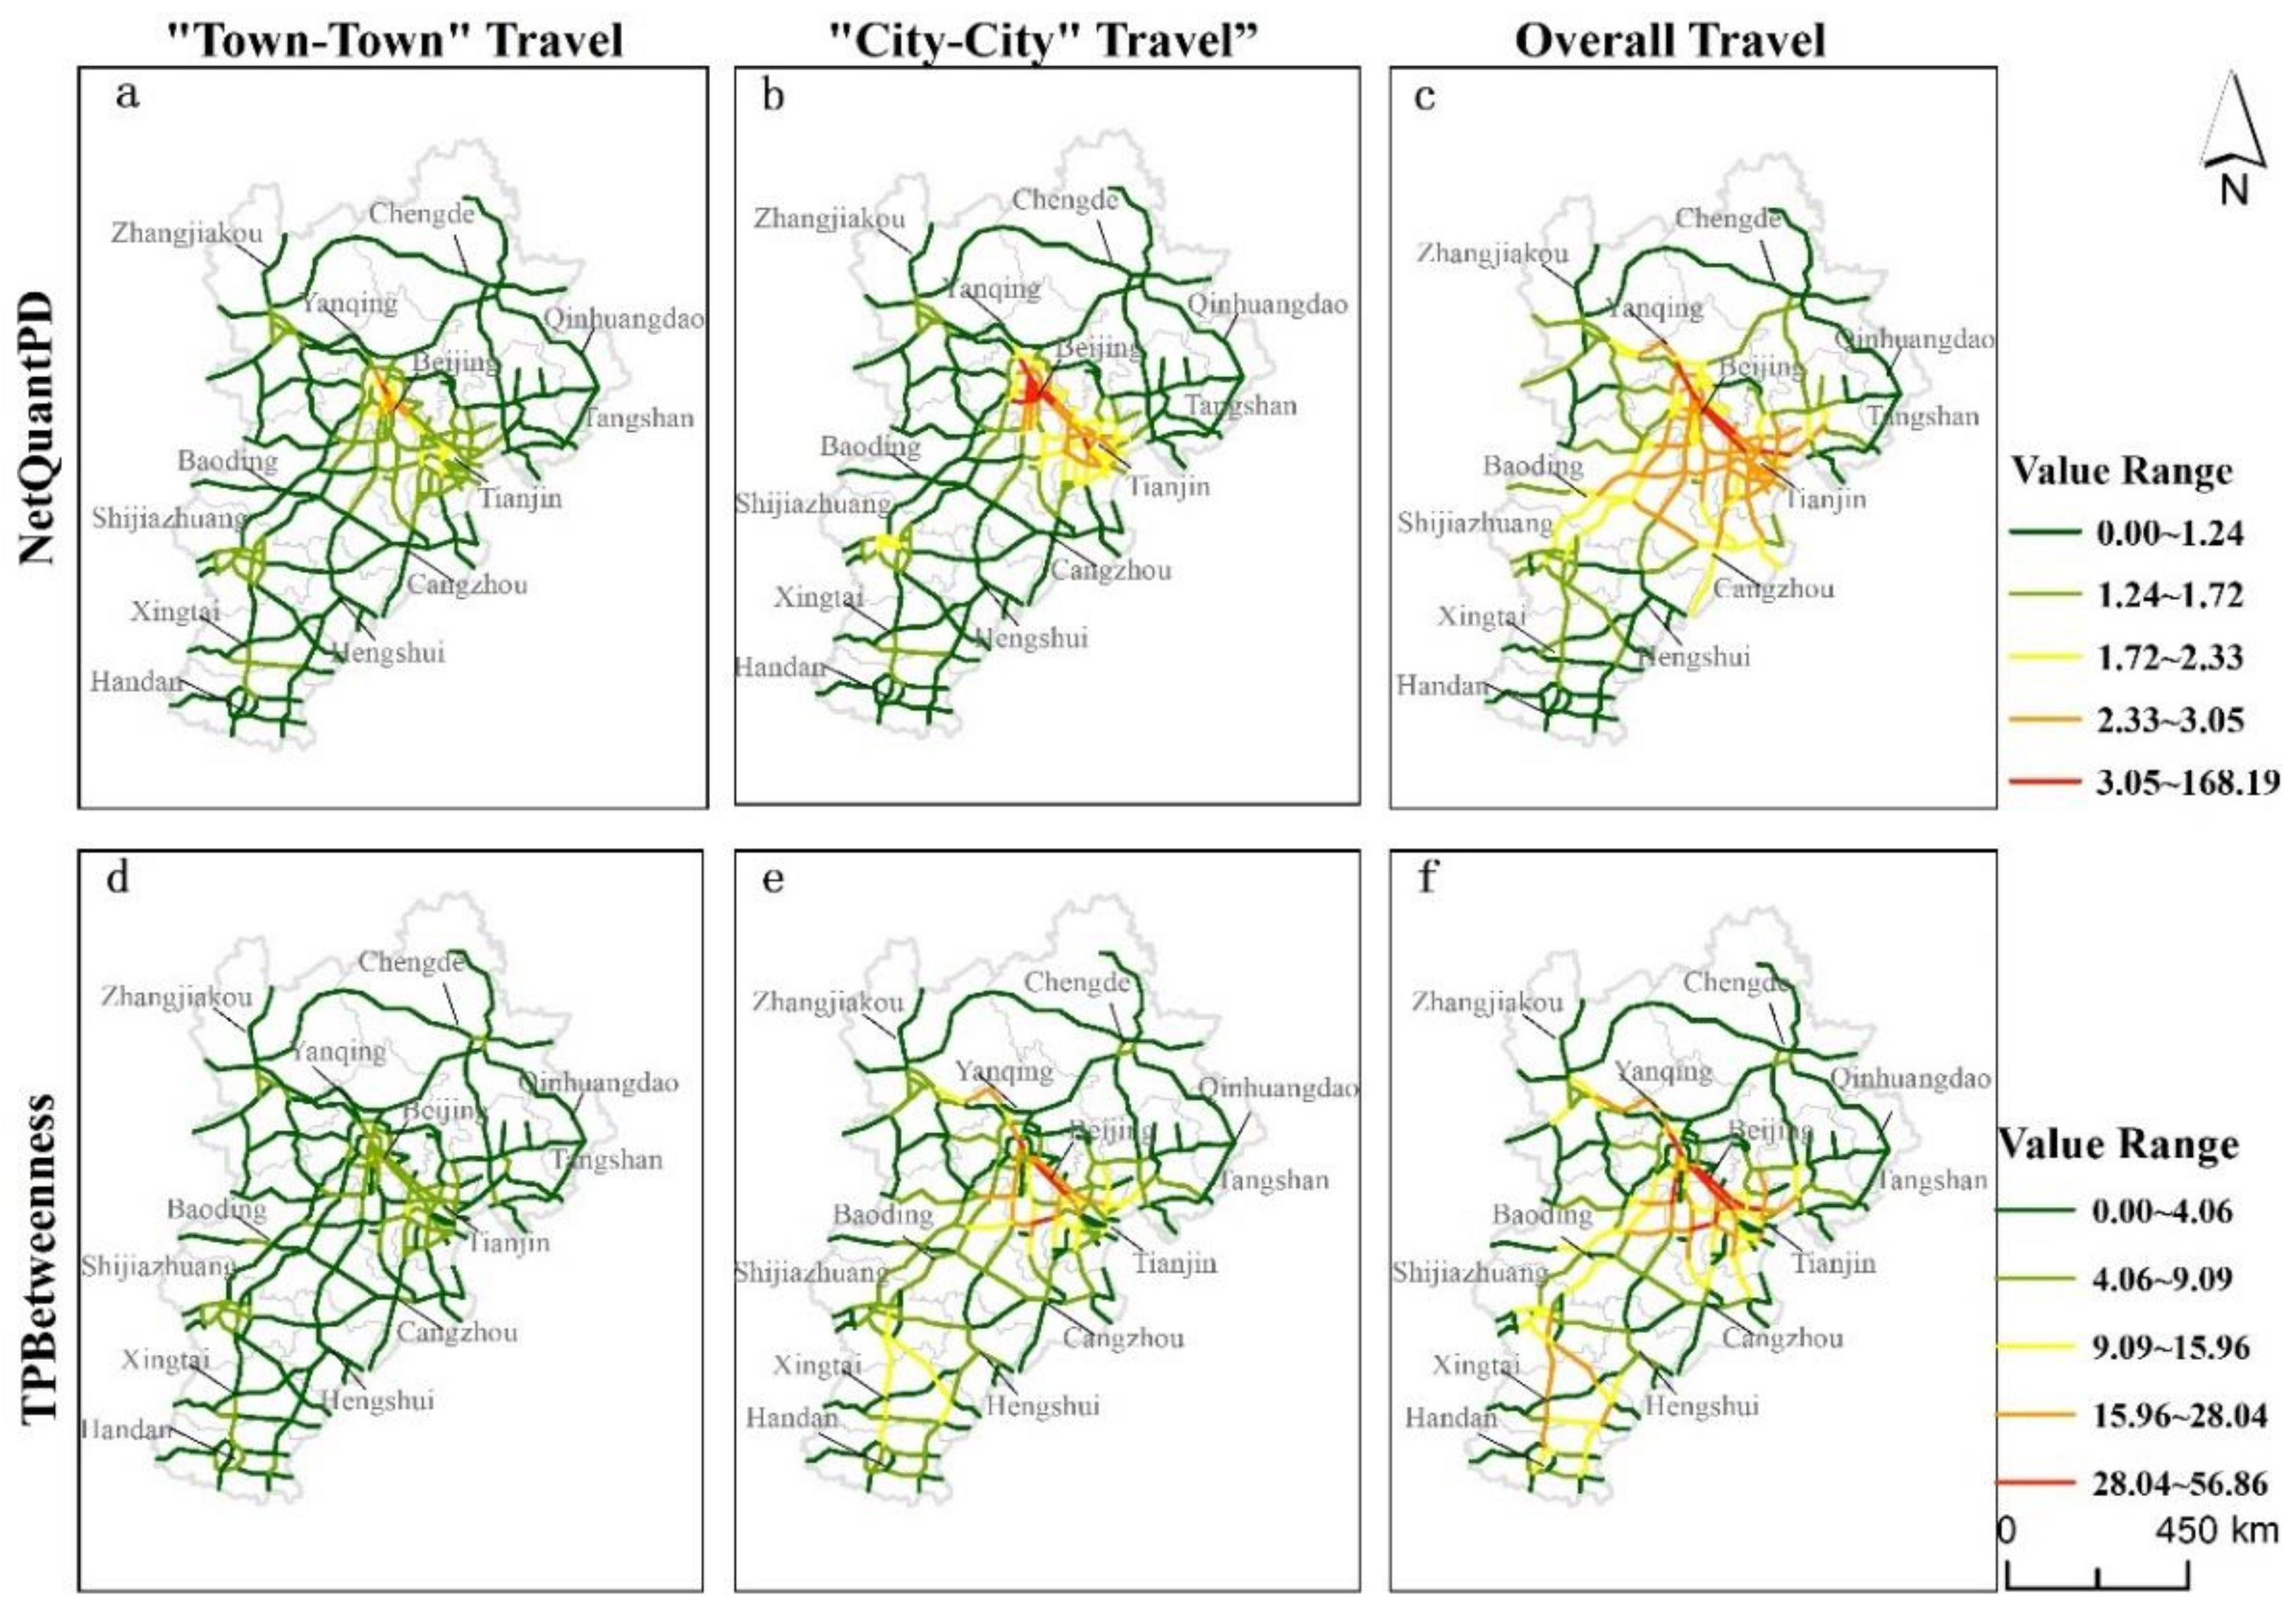
The radius of the sDNA can directly model the travel characteristics. We selected 50 km, 200 km, and km to model the town–town travel, city–city travel, and overall transportation travel, and used these to create an OD matrix between the cities.
Figure 2 shows the
TPBt (
X) and
NQPDA (
X) at selected radii. From the “town–t own travel” perspective (radius = 50 km), the Beijing–Tianjin–Hebei area is poorly integrated, as low scores (<5) point out areas where the potential accessibility among all the cities is at a low level. Cross-region transportation has not yet been formed. Considering the “city–city travel” (radius = 200 km), the low- and medium-low access predominates in the maps. The centrality reaches the maximum in the core cities, namely Beijing and Tianjin. It quickly decreases towards the south and north as a result of the low
NQPDA at the sub-centers of Shijiazhuang and Tangshan. In the “overall travel” (radius = n) scale, the G4 (the Beijing–Hong Kong–Macau Expressway), the G3 (the Beijing–Taipei Expressway), and the G2502 (the Seashore New District of Tianjin–Baoding Expressway) have high potential accessibility, as they originally formed the north–south core corridor. Beijing and two sub-centers, Tianjin and Shijiazhuang, are aligned along the corridor. Medium scores (2.33 <
NQPDA < 3.05) point out that Langfang, Baoding, and Tangshan benefit from the high centrality of the core areas.
Overall, before the new connections were constructed, poorly integrated routes among all cities strongly constrained accessibility and centrality at different spatial scales.
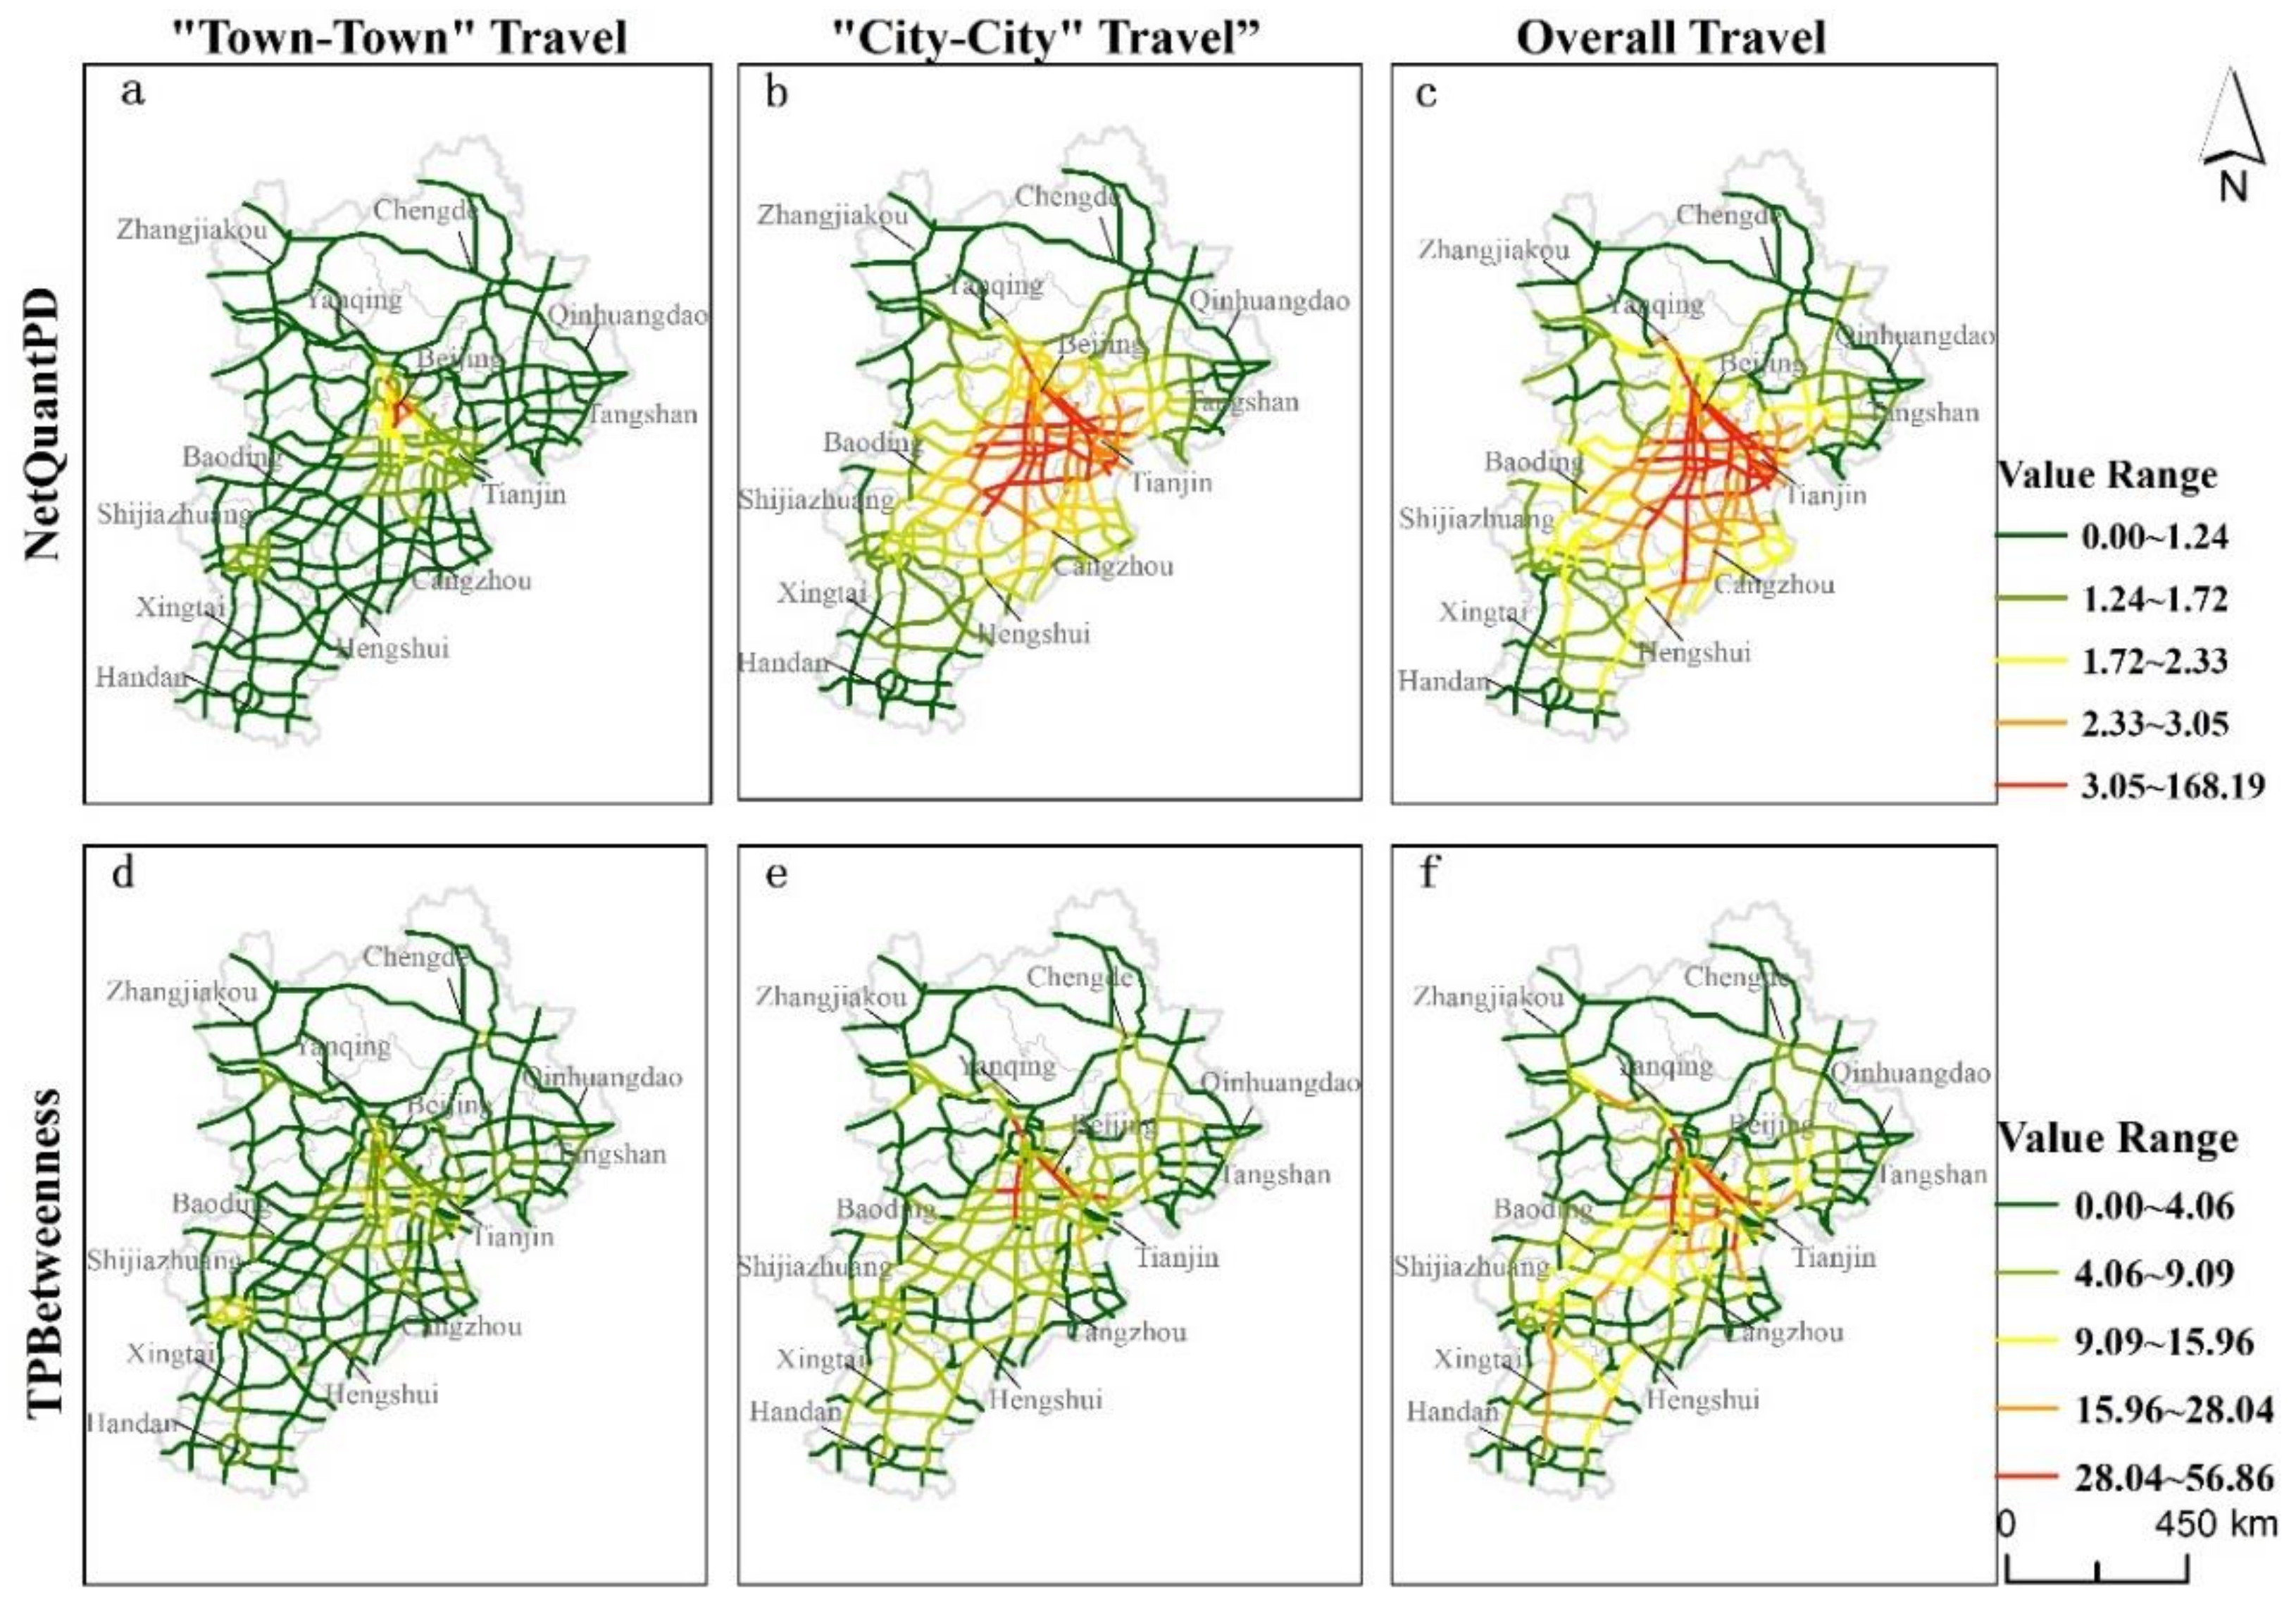
3.2. In Post-Construction
New connections are built for the Winter Olympic Games, such as the 174 km long Beijing–Zhangjiakou high-speed railway, completed in 2019 with a maximum speed of 350 km per hour. The HSR connects downtown Beijing with the Yanqing District and Zhangjiakou within a 1 h travel time. The regional pattern is also impacted by these connections.
Figure 3 shows accessibility and centrality patterns after the new connections were constructed. Accessibility and centrality are relatively improved at different spatial scales. Among the towns, the mean centrality slightly increased to 2.07. Although the area still shows low-medium access, the new connections provide a chance to strengthen the existing relatively high core area towards the northwest. From the “city–city travel” perspective (radius = 200 km), the roads surrounding Beijing and Tianjin are highly integrated. High centrality benefits surrounding areas and extends integration. The highest accessibility road is that which connected Beijing and Tianjin, reaching a maximum of 167.81. It could promote the gathering of traffic flows. The G6 (Tianjin–Tibet Expressway), G7 (Tianjin–Xinjiang Expressway),and inter-city railway connected Beijing and Zhangjiakou underwent a construction upgrade the network of Beijing and Zhangjiakou in the “overall travel” (radius = n) scale. As one of the host cities, roads to Zhangjiakou cause attention. The score of
TPBt is 1.5 times higher than before. The Beijing–Zhangjiakou high-speed railway forms a core corridor of the northeast area. In Zhangjiakou, which is a weaker area in terms of transport, capacity was nevertheless enhanced.
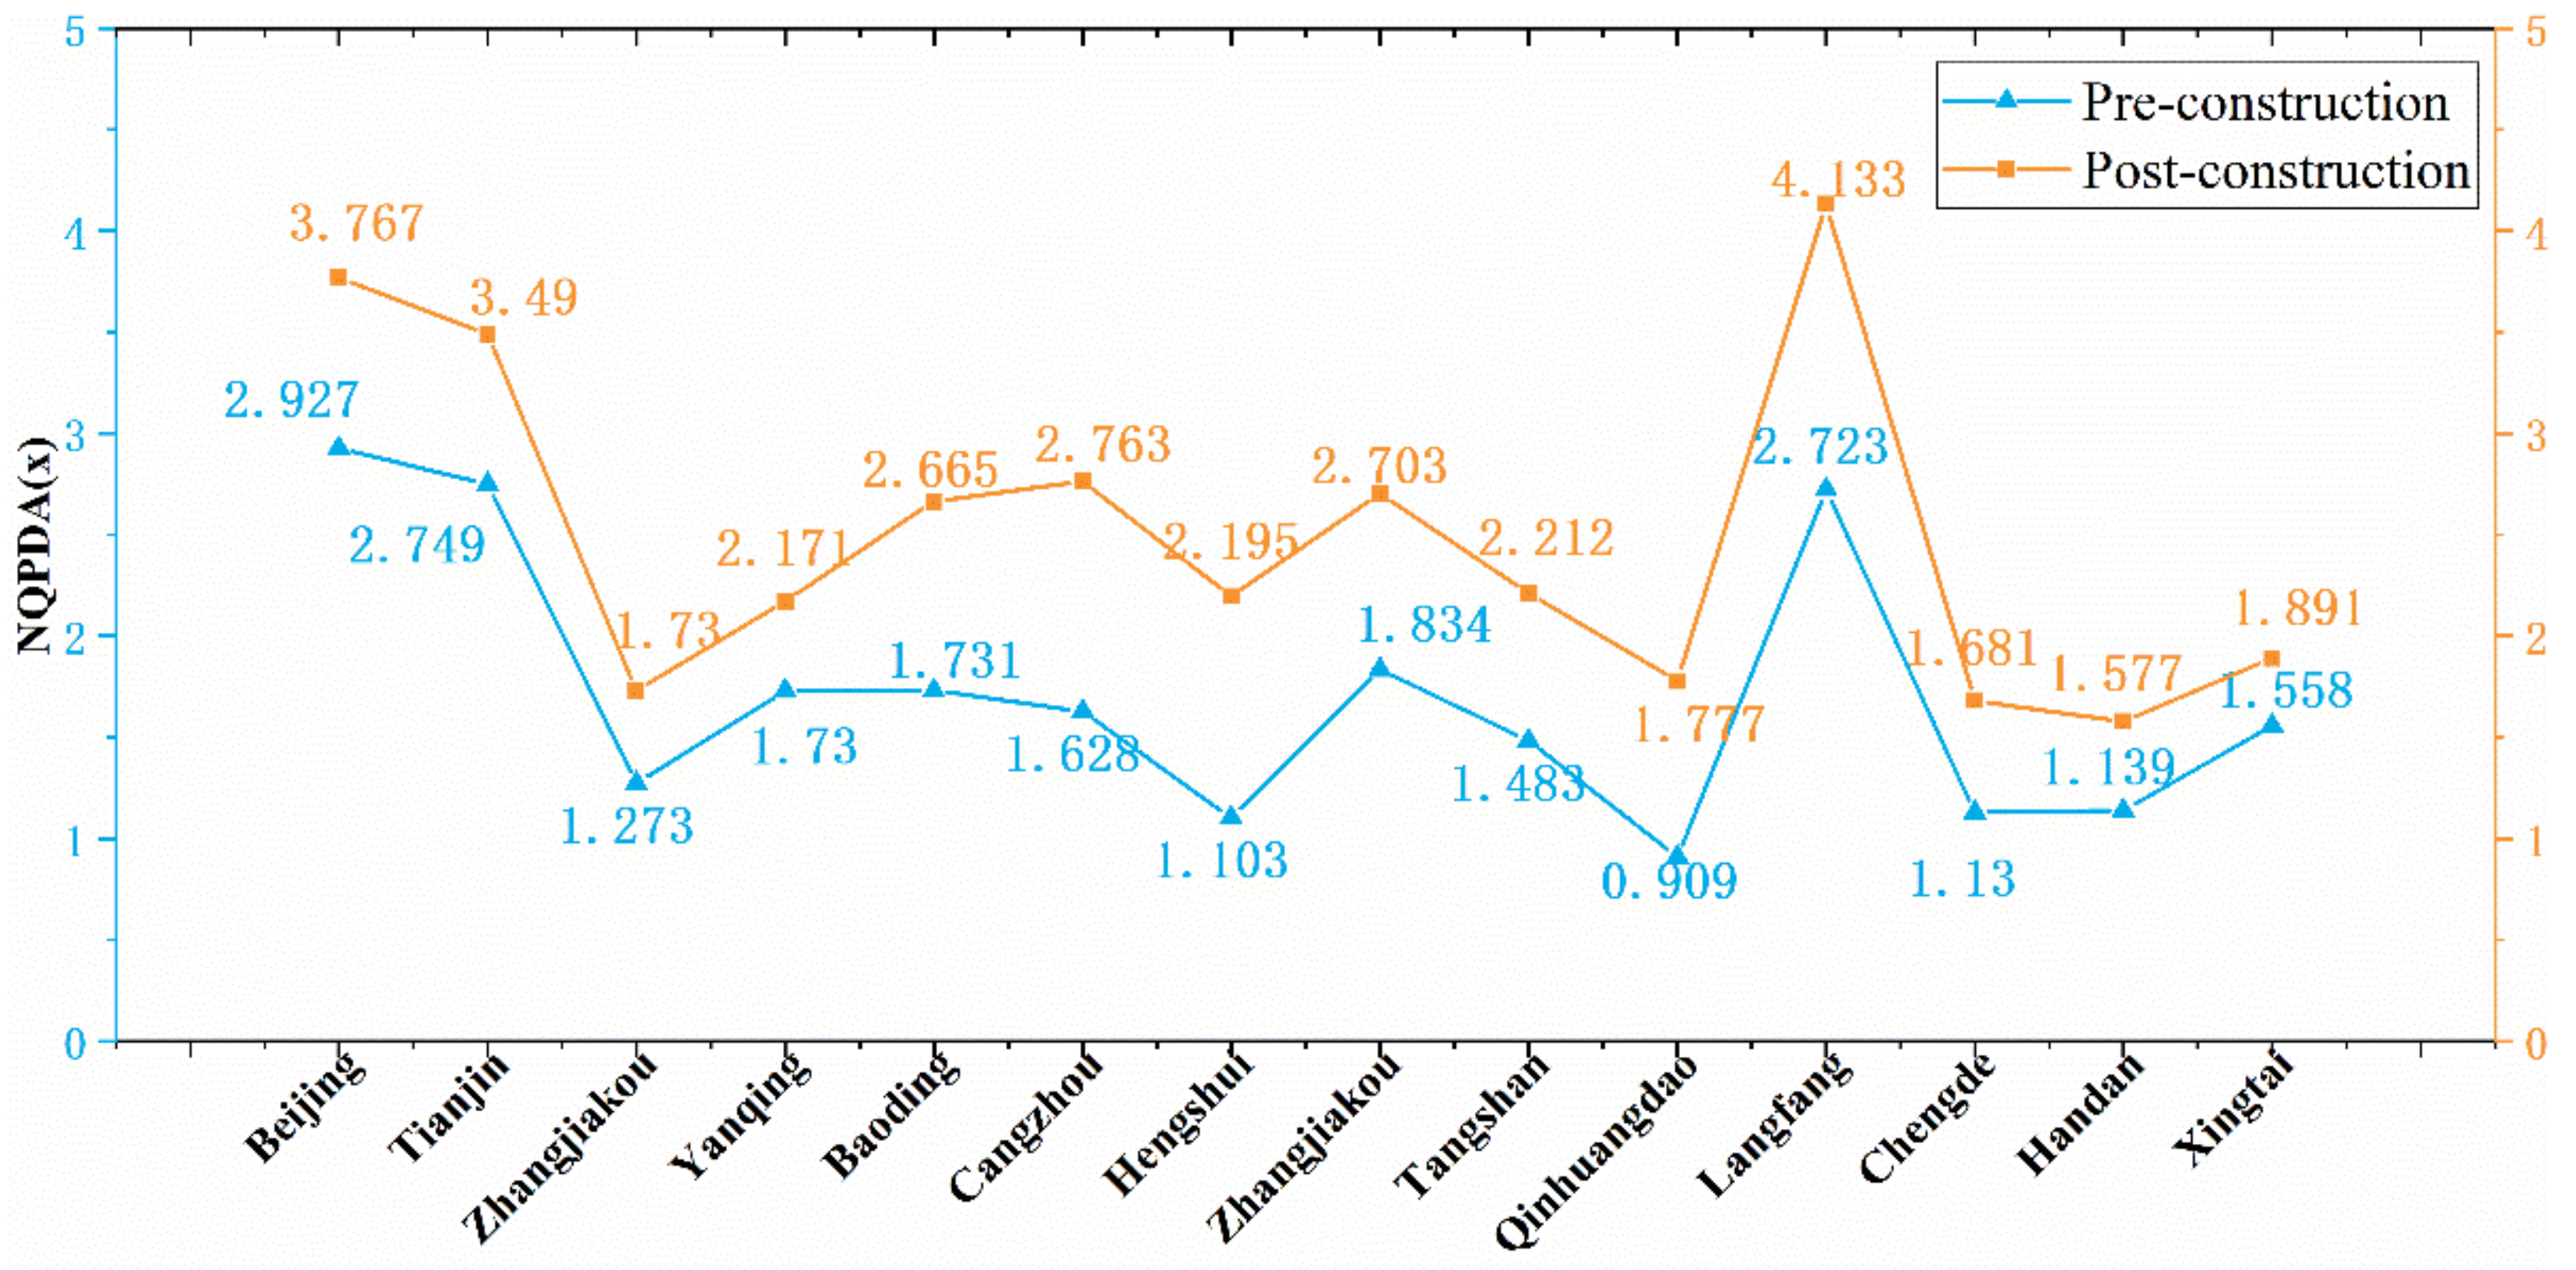
3.3. Impact on Cities
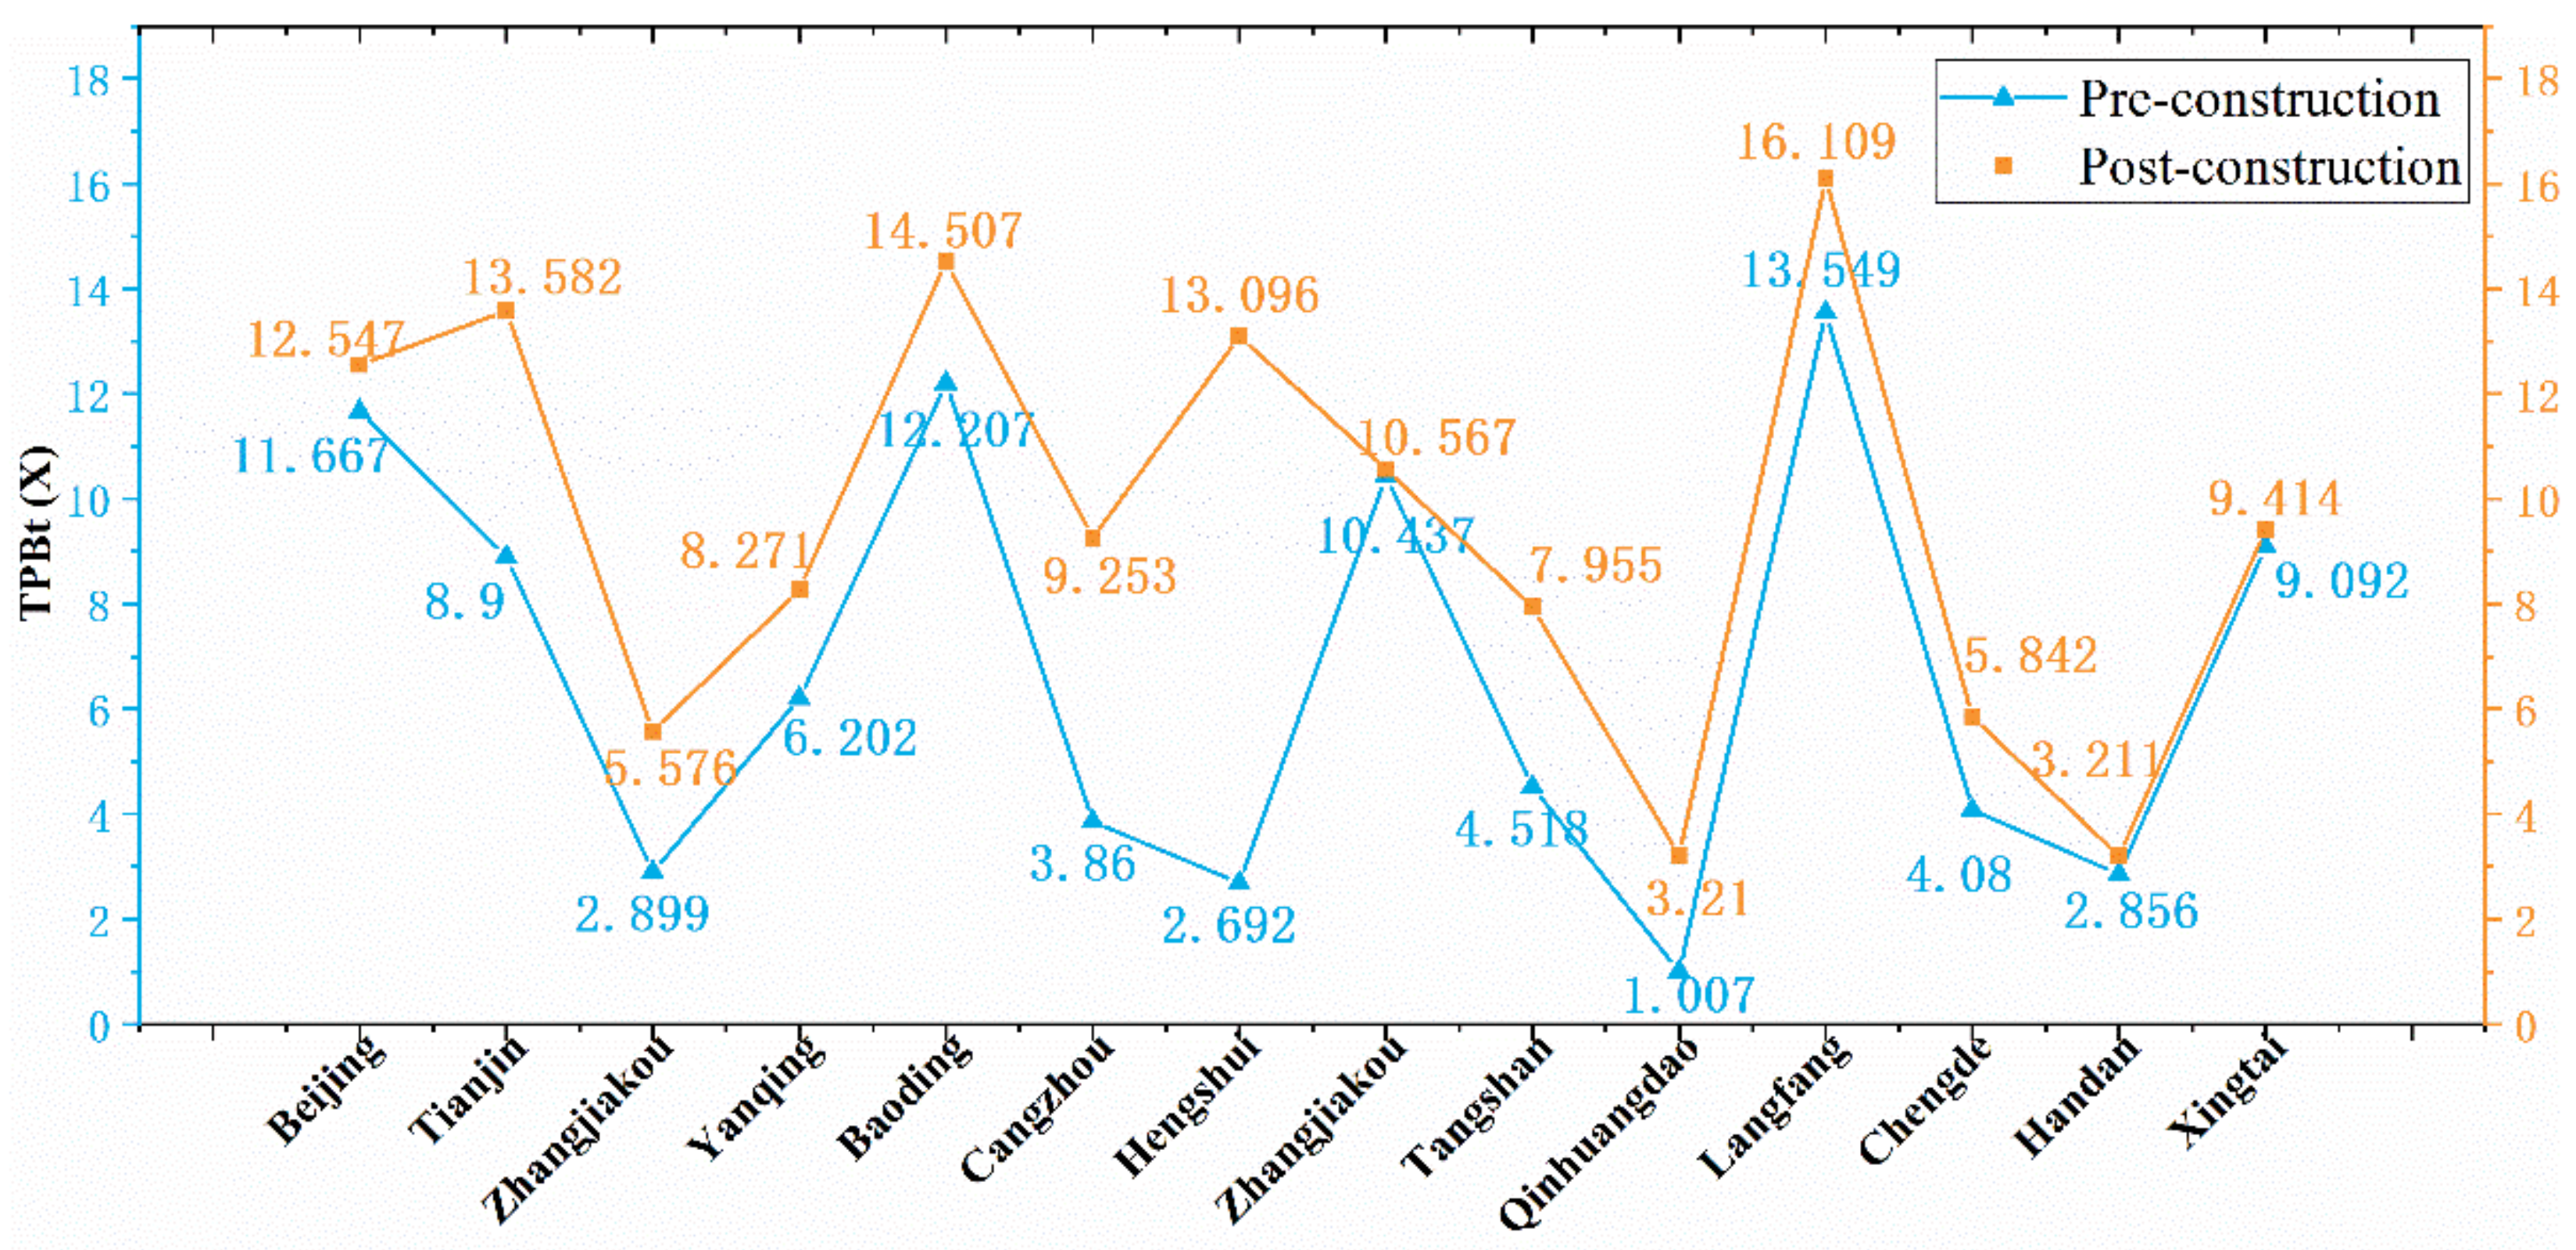
The attraction of the local city affects network formation, while the network affects the attraction of the local city. The accessibility and centrality of the local city are shown in
Figure 4. All the cities accessibility relatively improved. Hengshui, Qinhuangdao, Cangzhou, and Zhangjiakou were significantly enhanced, as the score of
NQPDA is 1.5 times greater than before. These cities benefitted from the G45 Expressway and the roads around Shijiazhuang, and Hengshui became a core city with high accessibility, 4 times greater than before. It promotes the development of the area in south Hebei. Owing to the network being upgraded in north Hebei by the new connections, Yanqing and Zhangjiakou further were integrated, moving up three and two places in the region, separately. Zhangjiakou became the emerging pole that benefits from the high centrality.
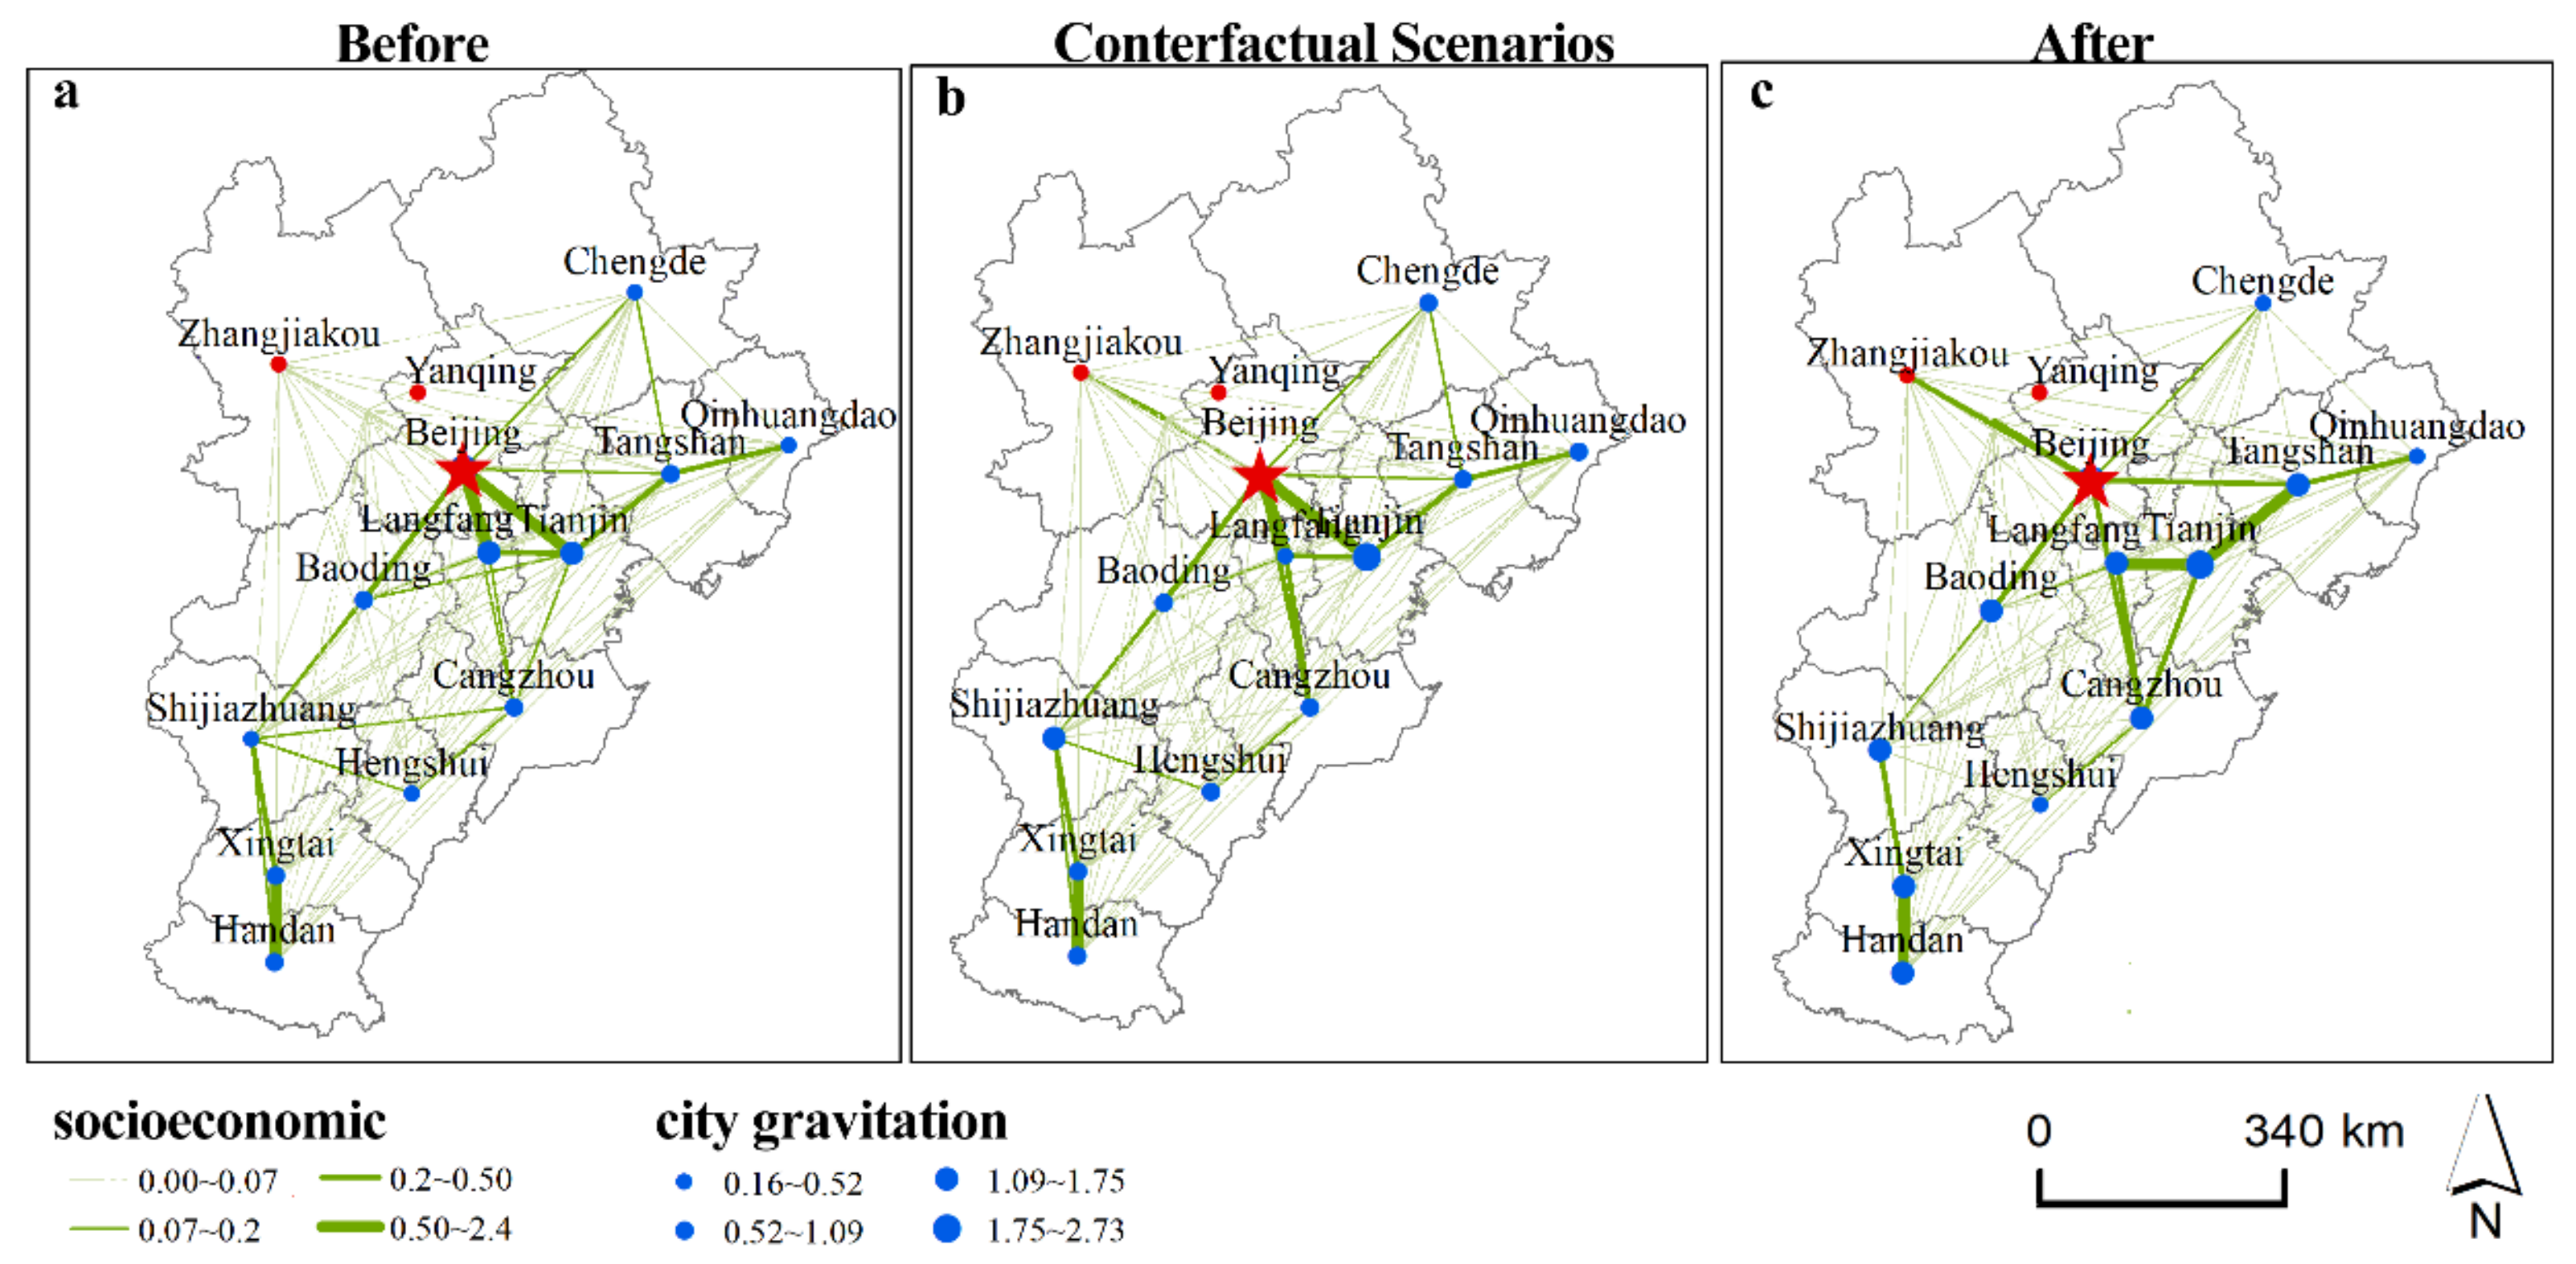
Gravity model analysis for the networks before the new connections constructed (
Figure 5). The mean travel distance is 370.3 km, and the distance of Zhangjiakou and Yanqing reaches a maximum of 395.66 km and 386.87 km. The connection between cities is weak, and the flow accessibility is poor. Beijing and Tianjin are the most attractive cities in the region, as the cities’ gravitation are only 2.73 and 1.75, respectively. As the host city, Zhangjiakou and Yanqing are merely 0.32 and 0.16, respectively, which is far below the mean score of the region, 1.007.
We evaluate impacts of the connections with counterfactual scenarios.
Figure 5b shows that the gravitation could not improve significantly without the connections. The mean score increased from 1.007 to 1.04, and the core connection between Zhangjiakou and the core area could not be closed. After the new connections were constructed, there was more potential access to the area of north Hebei, including Zhangjiakou and Chengde (
Figure 5c). Cities’ gravitation was one times greater than it was without new connections. Yanqing and Zhangjiakou increased by two times. The flow pattern shows the alignment of Beijing–Zhangjiakou and Beijing–Tangshan. It strengthens the connection between the weak area and core area, will improve efficiency, and reduces the transportation cost of the whole network.
3.4. Foreground Network and Development Trend
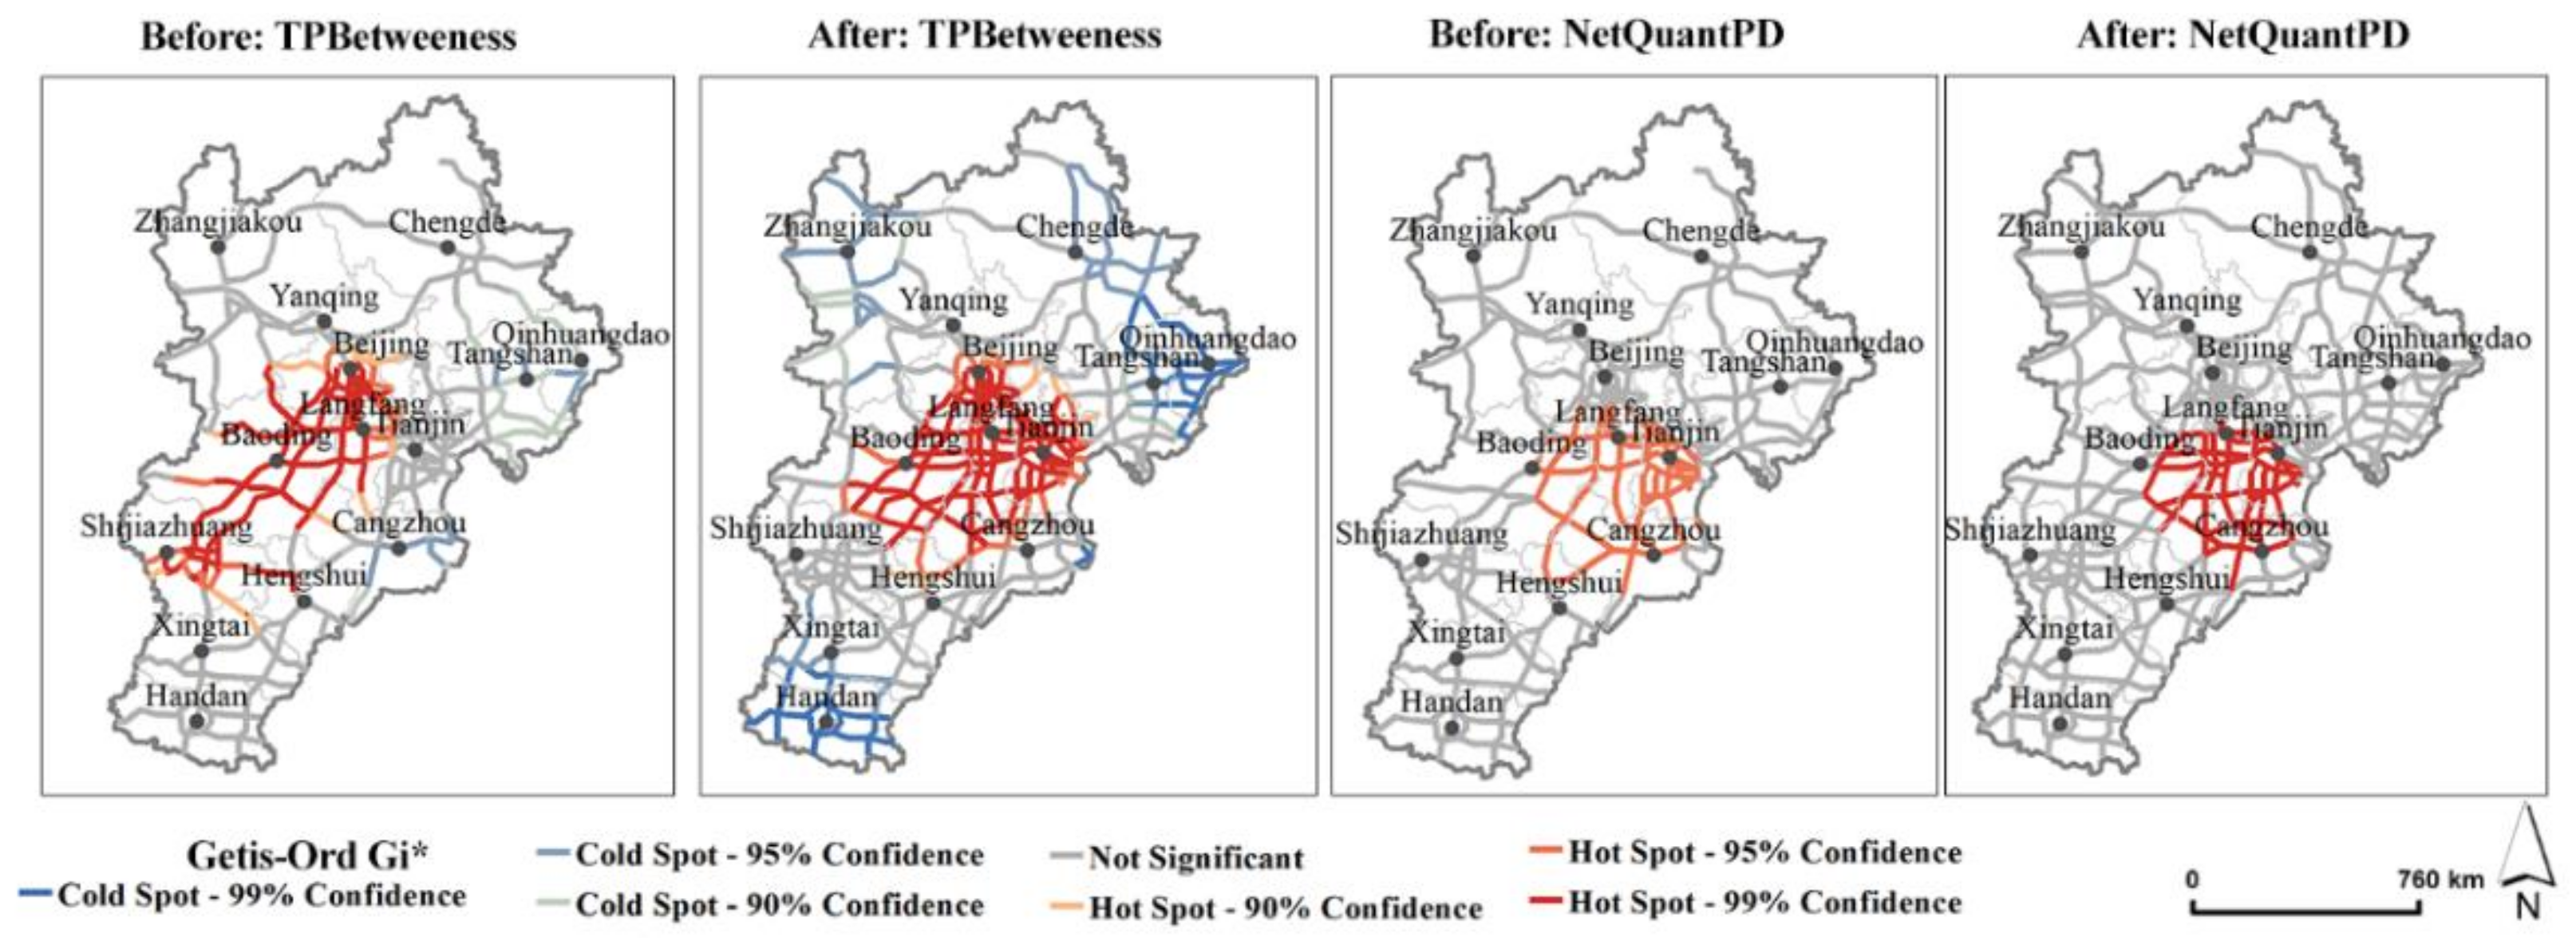
With the combined effect of the accessibility and centrality at different spatial scales, agglomeration patterns were extended towards the south and west (
Figure 6). The foreground network shifted from the area of Beijing–Shijiazhuang–Baoding to the area of Beijing–Tangshan–Qinhuangdao, deep into the Bohai Rim region. The area will benefit more from the integration of airports, inland ports, and harbors.
Current policies are mostly focused on the area around the core city. However, Handan and Chengde, far away from the core area, lack good accessibility, and the connection between the other cities is weak. This may constrain the network’s further integration.
4. Discussion
The Olympic Games, an urban mega-project with large expenditure and exceptional political leverage, presented a chance to implement regional transformations. Some cases show that mega-events, especially the Olympic Games, always leave a lasting impact on the host city or region [
24]. Transport is the largest and most complex Olympic legacy, but there are few studies to evaluate its impact [
3]. Previous studies mainly use physical dynamics and relational analysis to find the impact. Regarding transport network extension, all Olympic Games host cities since 2001 (Athens, Beijing, London, and Rio) have been able to enjoy positive transport legacies [
25]. From the perspective of the spatial transformations, the new lines implemented for the 2016 Olympic Games ended up causing the segmentation of the territory along the corridor [
2]. From the urban growth perspective, the transport legacy can accelerate urban development three times faster than usual. The transport sector of the Olympic Games can impact the urban and regional development [
26]. We use the sDNA model, gravity model, and GIS to evaluate the lanes on the view of the regional transport development pattern. Our analysis reveals that this is the case in the road spatial structure and cities, as well as in terms of regional transformation.
However, despite the belief that the Olympic Games can transform the host cities or region [
27], the transport legacy can be considered as positive or negative [
28]. There has a variety of different outcomes according to cities’ own value and needs. In fact, the impact is manifold. Our analysis shows that understanding the impact and finding how to use the impact to make further sustainable effect is essential.
5. Conclusions
The Olympic Games and other mega-events work as triggers for local development. Large expenditures were invested and many infrastructures, such as new connections, were built. It could be an opportunity to promote upgraded infrastructure, or it could result in over-construction. The impact on spatial structure and sustainability should be accurately evaluated owing to the heavy expenditures.
This paper aims to systematically evaluate the impact of the new connections built for mega-events on the road spatial structure, and to provide an analysis of the foreground network of the region. The Beijing 2022 Winter Games was chosen as a case study, and we applied the sDNA model and gravity model quantitatively to evaluate the impact on the roads and cities, respectively. We find that the new connections bring direct benefits to the Beijing–Tianjin–Hebei transport coordinated development. The Beijing–Zhangjiakou high-speed railway forms a core corridor of the northeast area, where accessibility is 1.5 times higher than before. Zhangjiakou becomes the emerging pole that benefits from the high centrality. It provides a great boost to Beijing–Tianjin–Hebei coordinated development. Then, the ESDA model is applied to explore the foreground network and development trend after the Winter Olympics. The agglomeration patterns of accessibility and centrality were extended toward the south and west, as well as the foreground network deep into the Bohai Rim region. Handan and Chengde, far away from the core area, will further constrain the network integration.
The new connections have benefits and convenience, which will promote the flow across different regions and close the link between regions. To improve the efficiency and further enhance the sustainability of the Olympic infrastructures, it is important to model and evaluate the impact before construction, while analysis of the foreground after construction should also receive enough attention. While benefiting from the core area with high accessibility and centrality, the poorly integrated marginal areas will strongly constrain further development. In doing so, we might open the windows of opportunity, which could lead to infrastructure upgrades, maintain the connections running with long-term stability, and constantly create better economic effects.
For scholars, this study offers a model for systematically evaluating the transport system of humankind’s largest and most expensive event. For decision-makers, it provides a decision basis, answering the question of how the new connections affect transportation and how to contribute to sustainability goals. The limitation of this research is that we evaluate the new connections effect on the spatial structure and foreground network. Unfortunately, the connections are complex, as road forming is a combination of all factors. Therefore, more complete studies on the impact on the road network should be the focus of future research.


