Article

Phenol Biodegradation and Bioelectricity Generation by a Native Bacterial Consortium Isolated from Petroleum Refinery Wastewater

1
Botany & Microbiology Department, Faculty of Science, Alexandria University, Alexandria 21500, Egypt
2
Medical Laboratory Technology Department, Faculty of Applied Health Sciences Technology, Pharos University in Alexandria, Alexandria 21500, Egypt
3
Biochemistry Department, Faculty of Science, Alexandria University, Alexandria 21500, Egypt
4
Nucleic Acid Research Center, City of Scientific Research and Technology Applications, Alexandria 21934, Egypt
5
Chemical and Petrochemical Department, Faculty of Engineering and Technology, Arab Academy for Science, Technology and Maritime Transport, Alexandria 1129, Egypt
6
Zoology Department, Faculty of Science, Alexandria University, Alexandria 21500, Egypt
*
Author to whom correspondence should be addressed.
Sustainability 2022, 14(19), 12912; https://doi.org/10.3390/su141912912
Submission received: 8 August 2022 / Revised: 28 September 2022 / Accepted: 30 September 2022 / Published: 10 October 2022

Abstract

:
Phenolic compounds are highly toxic, along with being one of the most persistent substances in petroleum refinery effluents. The most potent solution is through phenol bioremediation to produce demi-water and bioenergy, which are two effective outcomes for a single process. Fifteen genetically identified native bacterial strains were isolated from the effluents of the petrochemical industry plant (AMOC, Egypt) and were investigated for potential phenol biodegradation activity and energy bioproduction individually and as a consortium in a batch culture. Successful and safe phenol biodegradation was achieved (99.63%) using a native bacterial consortium after statistical optimization (multifactorial central composite design) with bioelectricity generation that reached 3.13 × 10⁻⁶ mW/cm3. In conclusion, the native consortium was highly potent in the bioremediation process of petroleum refinery wastewater, protecting the environment from potential phenol pollution with the ability to generate an electrical current through the bioremediation process.

1. Introduction

Phenol and its derivatives were extensively distinguished as environmental pollutants due to their prevalence in many industrial processes’ effluents, including oil refineries, petrochemical plants, coal conversion processes, steel plants ceramic plants, and phenolic resin industries [1]. Wastewater contaminated with phenolic compounds or phenol derivatives needs careful treatment before being discharged [2].
Phenol in wastewater that reaches domestic water could pose a great danger to health. Acute (short-term) animal tests, such as LD50 tests in rats, mice, and rabbits, demonstrated the high acute toxicity of phenols upon oral exposure [2].
Although physicochemical methods were employed for the removal of phenols and their compounds, biological methods are preferred. Physicochemical methods usually have a large cost and often produce other undesirable products that are toxic, which leads to the urgent need for further processing steps [3]. Several other toxic compounds are formed during industrial processes, giving the known multicomponent composition of wastewaters. Therefore, the strains used for decontamination should not only be highly active against one of the contaminants but they should also be resistant to different toxic pollutants or possess different biodegradation abilities [4].
The global energy demand is increasing with the exponential growth of the population. The unsustainable supply of fossil fuels and environmental concerns such as water pollution are acting as major drivers for research into alternative renewable energy technologies. A microbial fuel cell (MFC) is a promising technology for the simultaneous treatment of organic wastewater and bioenergy recovery in the form of direct electricity, which has gained much interest in recent years [5]. Microbial fuel cells (MFCs) are devices that use microorganisms as catalysts to oxidize organic and inorganic matter and generate electricity [6].
The aim of the present investigation was to isolate and identify the native phenol degraders in a petroleum refinery plant’s effluent to produce demi-water with the simultaneous generation of bioelectricity.

2. Materials and Methods

2.1. Sample Collection

Wastewater effluents loaded with phenol were collected from Alexandria Mineral Oils Co “AMOC” (which had been in continuous operation for several years in Egypt). The effluent was analyzed weekly (over 6 months) and the phenol concentration was estimated to be around 14 ppm.

2.2. Isolation, Purification, and Screening of Phenol Degraders

Phenol-containing nutrient broth and nutrient agar media (P-NB and P-NA, respectively) were prepared. The pour plate method was used to isolate the native phenol degraders using the P-NA medium [7]. Only the single colonies grown on the P-NA medium were transferred independently to a fresh medium and stored for future investigations.

2.3. Phenol Estimation

The phenol concentration in AMOC’s wastewater effluents and the residual concentrations were measured spectrophotometrically using the HACH® phenol kit according to the manufacturer’s instructions [8].

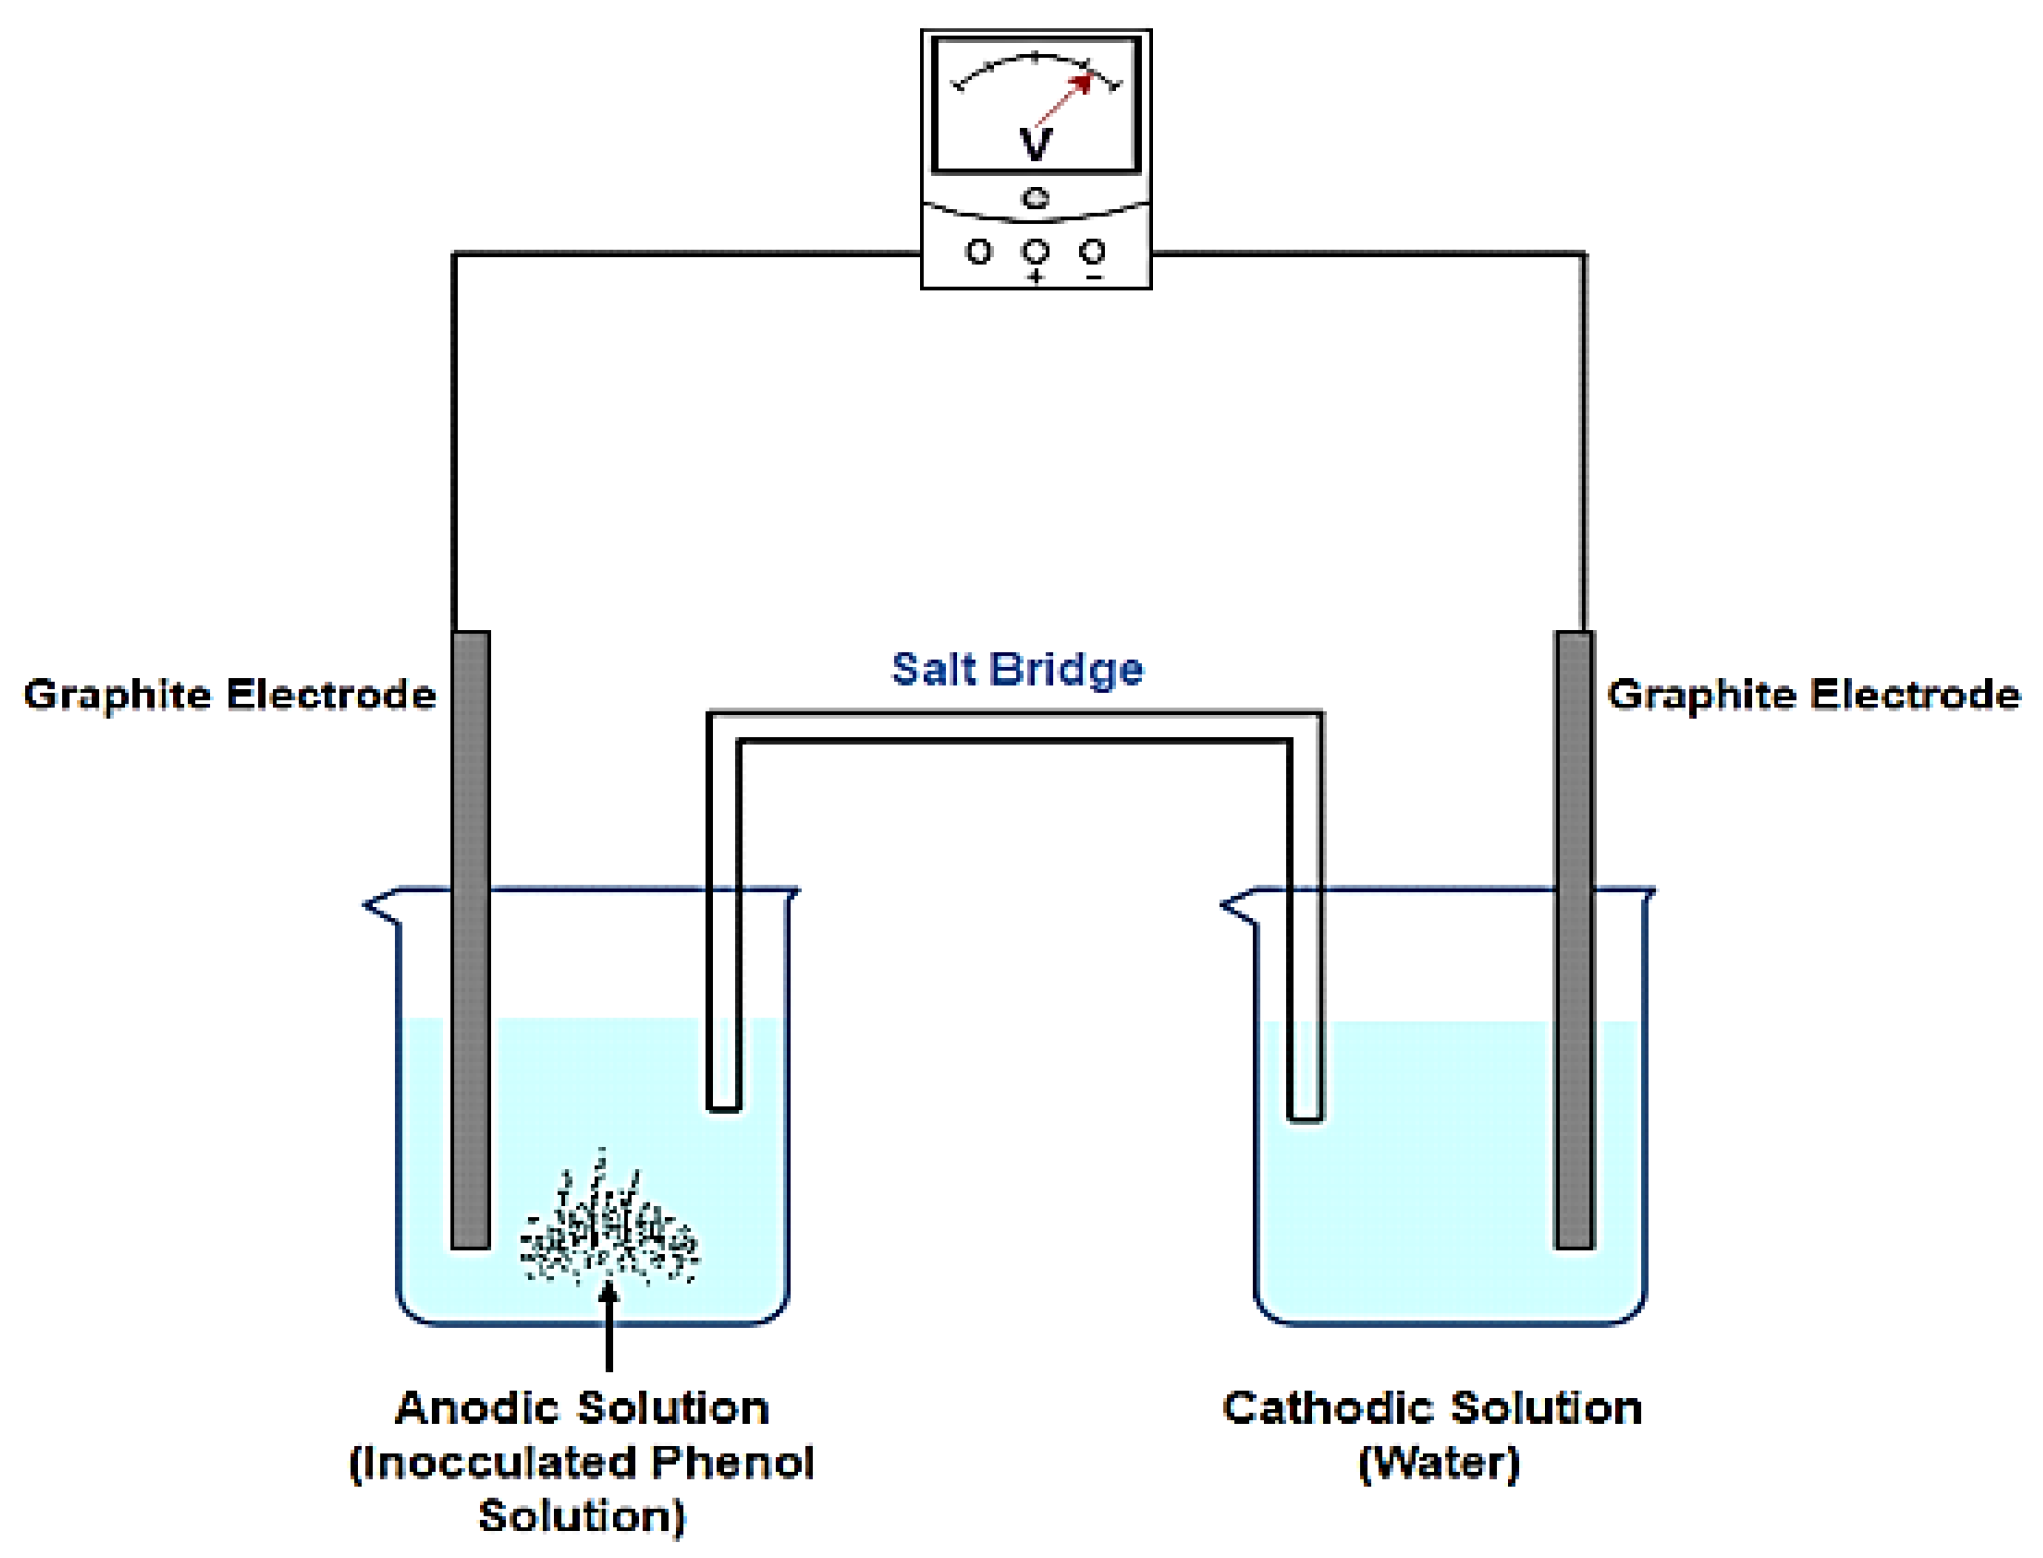
2.4. Bioelectricity Estimation

Bioelectricity generated from an MFC (Figure 1) was quantified in terms of the power output, and the open circuit voltage (OCV) was measured with a voltmeter. The anodic and cathodic solutions were connected via graphite electrodes and a salt bridge.
The MFC voltage was recorded versus time and expressed in terms of the overpotentials associated with different phenomena using Equation (1):
E cell = E c η act , c η conc , c E a η act , a η conc , a η ohm
where Ec and Ea were the open circuit potentials (OCPs) for the cathodic and anodic reactions, respectively; ηact was the charge transfer overpotential and ηconc was the concentration overpotential of the anode or cathode; and ηohm was the ohmic overpotential.
The power P generated from the MFC was calculated using Equation (2):
P = V × I ,   in   W  
where V was the cell voltage (V) and I was the current (A). The power density PD was calculated in terms of the anode surface area A (m2) or the anodic solution volume U (m3) using Equations (3) and (4), respectively:
P D = V × I A ,   in   W / Cm 2
P D = V × I U ,   in   W / Cm 3

2.5. Phenol Degraders Identification

McFarland standards were used as a reference to adjust the turbidity of bacterial suspensions (from 16 to 24 h old cultures) so that the number of bacteria was standardized in sterile saline or a nutrient broth (1.5 × 10⁻⁶ CFU/mL) [9]. Identification of the most promising phenol degraders was done using 16S rDNA sequencing. Genomic DNA was extracted according to Hassen et al. [10] from an overnight-grown culture and PCR amplification was performed using these primers: forward primer (5′-AGAGTTTGATCMTGGCTCAG-3′) and reverse primer (3′-TACCTTG TTACGACTT-5′). The 16S rRNA sequences obtained were added to publicly available bacterial 16S rRNA sequences, and the sequences were integrated into the database with the automatic alignment tool. The phylogenetic tree was generated by performing distance matrix analysis using the NT system. A database search and comparisons were done with the BLAST search using the National Center for Biotechnology Information (NCBI) database and accession numbers were received.

2.6. Optimization of Nutritional and Environmental Factors

The present investigation aimed to study and optimize the most effective variables that affect phenol biodegradation and bioelectricity generation. Optimization was achieved by applying two statistical designs, namely, the Plackett–Burman design (PBD), followed by the central composite design (CCD), as applied by Boudraa et al. [11] and Du et al. [12].

2.6.1. Plackett–Burman Design (PBD)

In the present study, 12 factors that may influence the phenol biodegradation and bioelectricity generation at a 95% confidence level were investigated by applying a Plackett–Burman design using a bacterial consortium. These independent factors (including physical and nutritional factors) were as follows: inoculum size (A), culture volume (B), phenol concentration (C), pH (D), incubation period (E), KH2PO4 concentration (F), K2HPO4 concentration (G), (NH4)2SO4 (H), NaCl (I), FeCl3.6H2O (J), MgSO4.7H2O (K), and CaCl2.2H2O (L). For the mathematical modeling, the following first-order polynomial model was used (Equation (5)):
Y = β 0 +   β i X i
where Y was the predicted response (percentage of phenol degradation), β0 was the model intercept, βi was the linear coefficient, and Xi was the level of the independent variable.
In the present study, the model fitting and effect of all parameters were investigated in the form of an analysis of variance (ANOVA) according to a t-test and p-values. Pareto charts were produced to illustrate the arrangement of parameters under test in terms of their effect on the phenol biodegradation (response 1) and bioelectricity generation (response 2).
Each independent variable was evaluated at three levels −1, 0, and +1 (Table 1) for phenol biodegradation (response 1) and bioelectricity generation (response 2). The phenol removal rate (µ) was calculated to evaluate the phenol degradation capacity of the consortium according to Wu et al. [13]
Factors with a significant effect on the phenol biodegradation were considered for further optimization using a central composite design (CCD) and the response surface methodology (RSM). The CCD and RSM were performed to obtain information about not only the interaction between significant effects but also the exact optimal values of each parameter for the maximum phenol biodegradation and bioelectricity generation.

2.6.2. Central Composite Design (CCD)

The most effective parameters and their interactions, namely, incubation time, KH2PO4, K2HPO4, FeCl3.6H2O, and CaCl2.2H2O, were optimized by employing response surface methodology (RSM) statistical multifactorial modeling with five levels (−2, −1, 0, 1, 2) (Table 2). Moreover, exact values of the optimal conditions were calculated using perturbation curves for the maximum phenol biodegradation (response 1) and bioelectricity generation (response 2).
The mathematical relationship of the response of these parameters was illustrated using a quadratic (second-degree) polynomial (Equation (6)), where y was the response value; b0 was the constant; x1, x2, x3, x4, and x5 were the independent parameters; b1, b2, b3, b4, and b5 were the linear coefficients; b12, b13, b14, b15, b23, b24, b25, b34, b35, and b45 were the cross product coefficients; and b11, b22, b33, b44, and b55 were the quadratic coefficients. A total of 50 runs were processed to estimate the coefficients of the model using multiple linear regressions. The design of experiments was carried out using Design Expert 12.0®.
y = b 0 + b 1 x 1 + b 2 x 2 + b 3 x 3 + b 4 x 4 + b 5 x 5 + b 11 x 1 2 + b 22 x 2 2 + b 33 x 3 2 + b 44 x 4 2 + b 55 x 5 2 + b 12 x 1 x 2 + b 13 x 1 x 3 + b 14 x 1 x 4 + b 15 x 1 x 5 + b 23 x 2 x 3 + b 24 x 2 x 4 + b 25 x 2 x 5 + b 34 x 3 x 4 + b 35 x 3 x 5 + b 45 x 4 x 5

2.6.3. High-Performance Liquid Chromatography (HPLC)

The estimation of the residual phenol was further confirmed using high-performance liquid chromatography (HPLC), where 1.5 mL of non-inoculated and inoculated (the optimized consortium) culture medium was centrifuged at 12,000× g at 4 °C for 10 min, and the supernatant was collected for residual phenol estimation. Phenol was measured using an HPLC system (Model 515 pump, Waters, MA, USA) equipped with a UV-Vis (Model 2487, Waters, Wilmslow, UK) detector operating at 270 nm. Samples (20 µL) were injected and analyzed using a symmetry C-18 column (4.6 × 150 mm, 5 µm particle size). The mobile phase was composed of 55% (v/v) distilled water and 45% (v/v) acetonitrile, and the flow rate was set at 1 mL/min [14]. The phenol concentration was calculated using the regression equation (Equation (7)) according to Bai et al. [15]:
y = 13,587.0x − 67,610
where x and y (mg/L) represented the peak area and the concentration of phenol, respectively

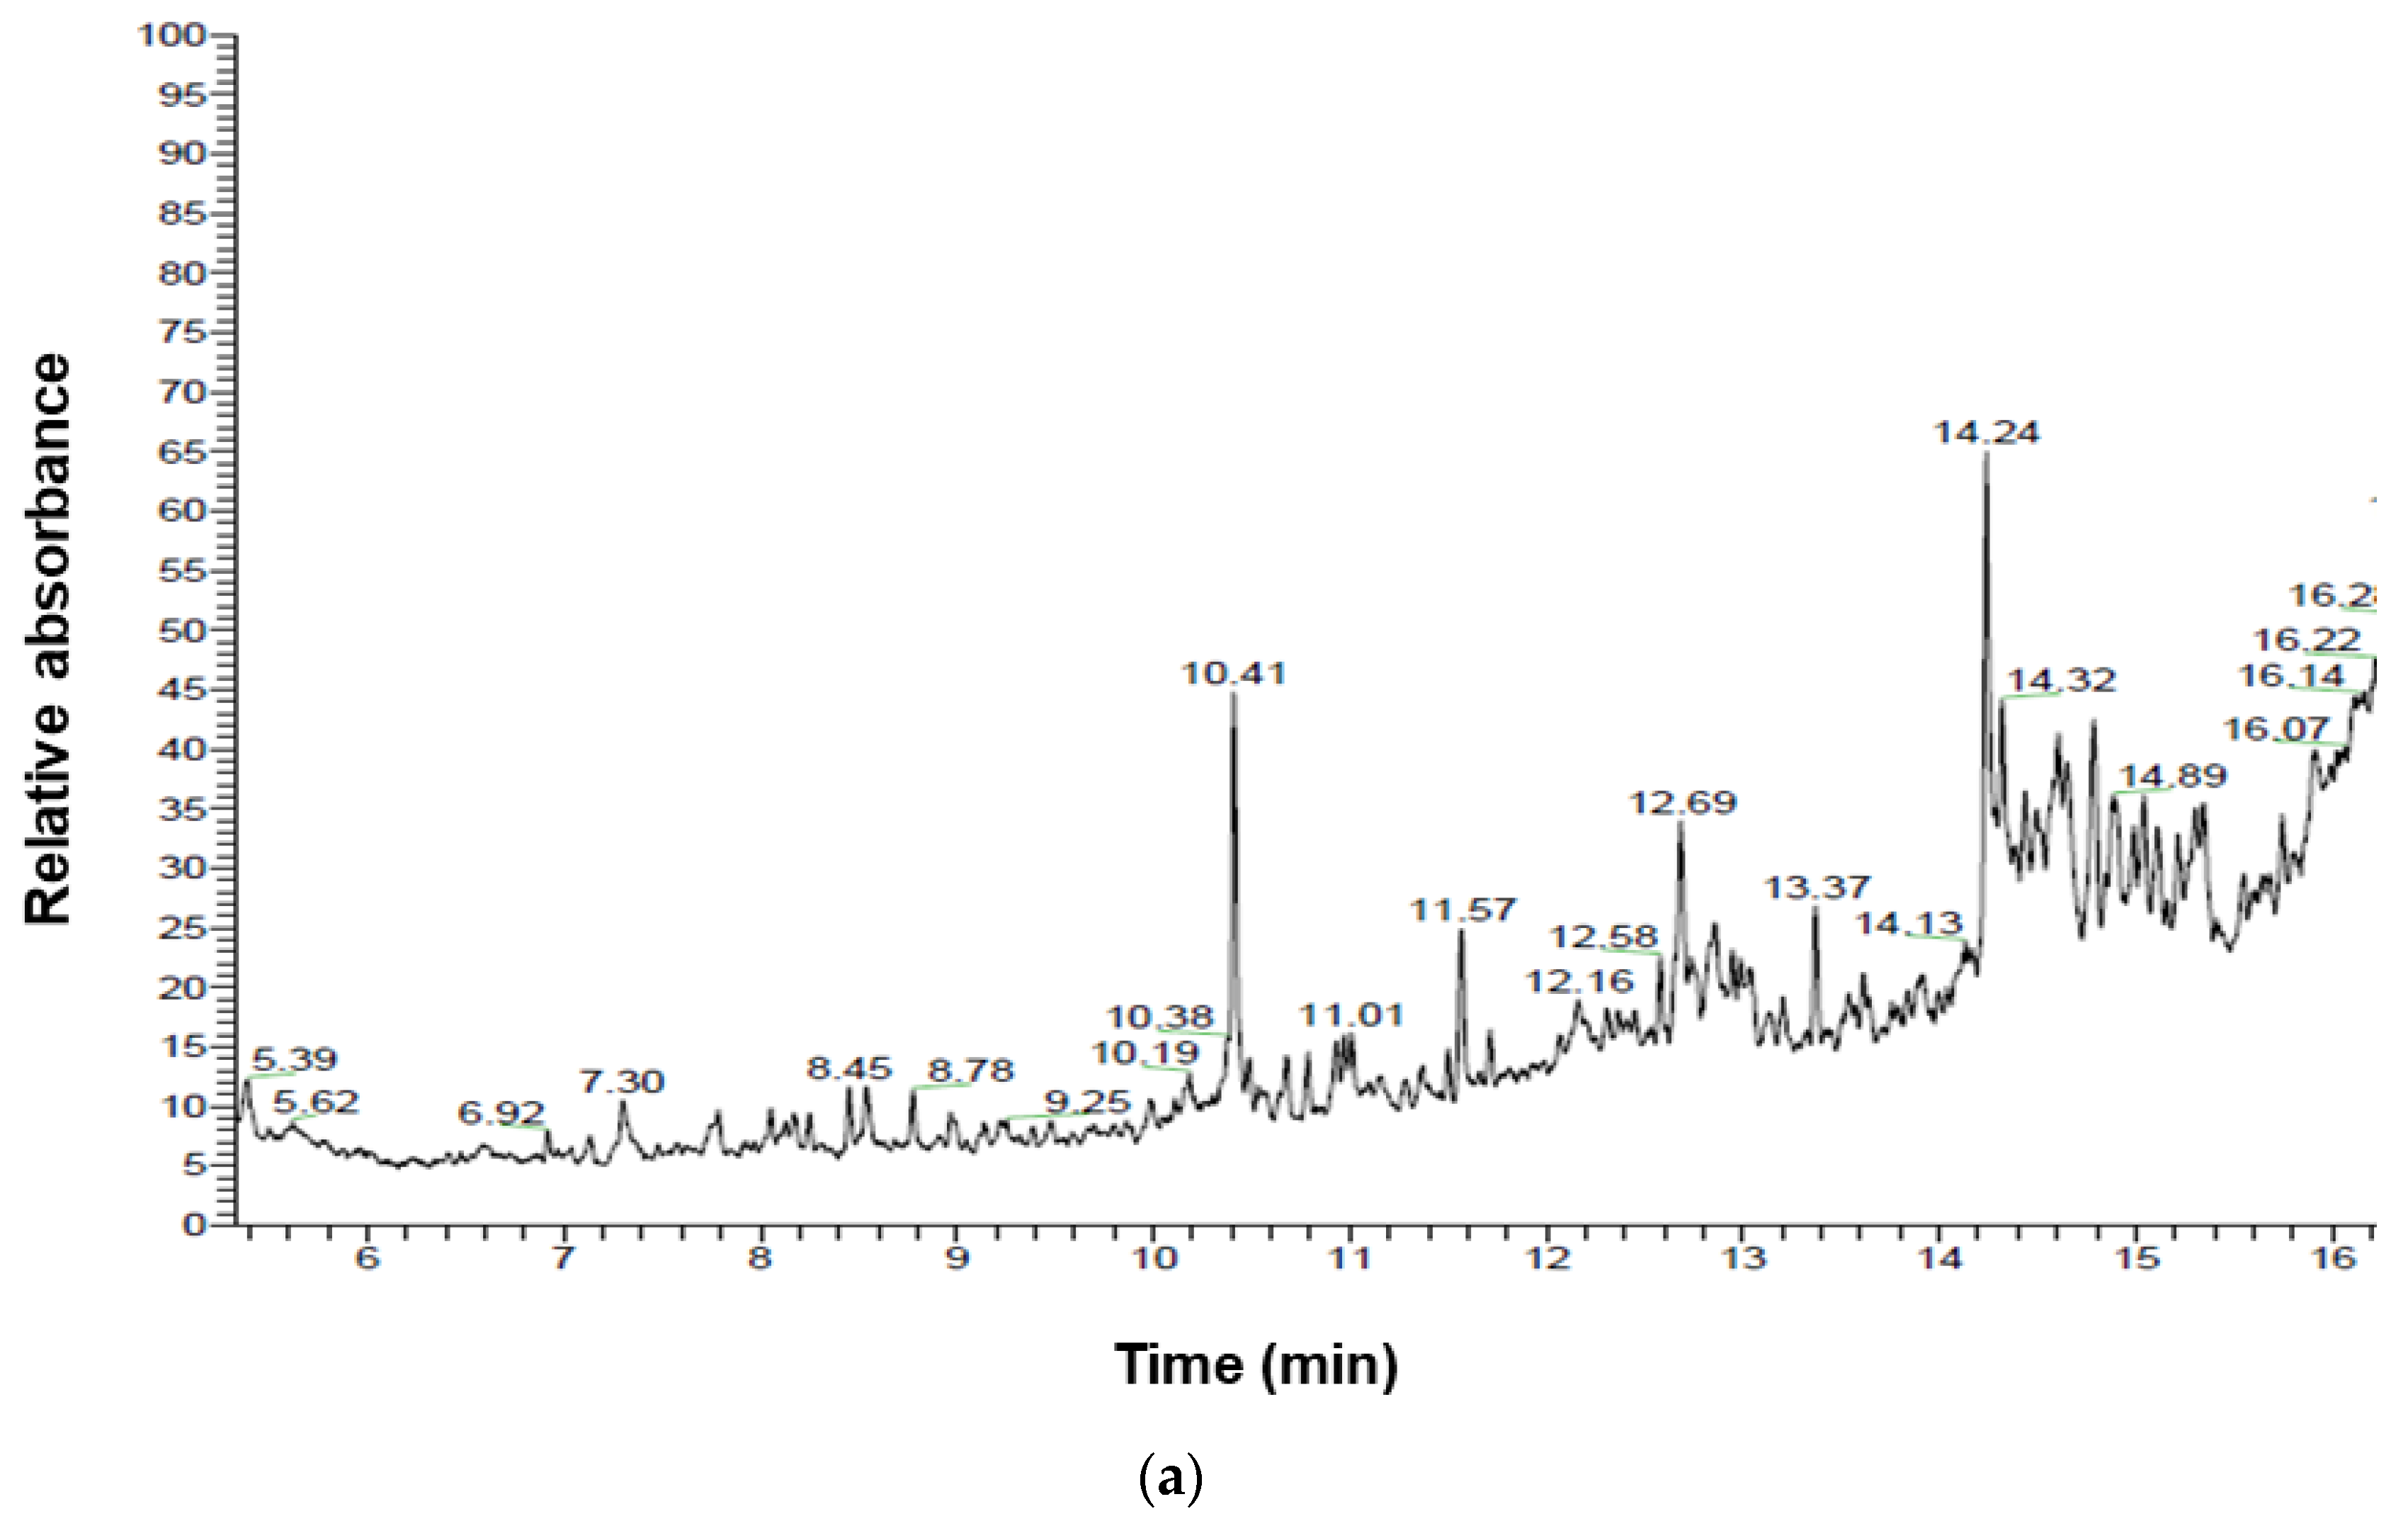
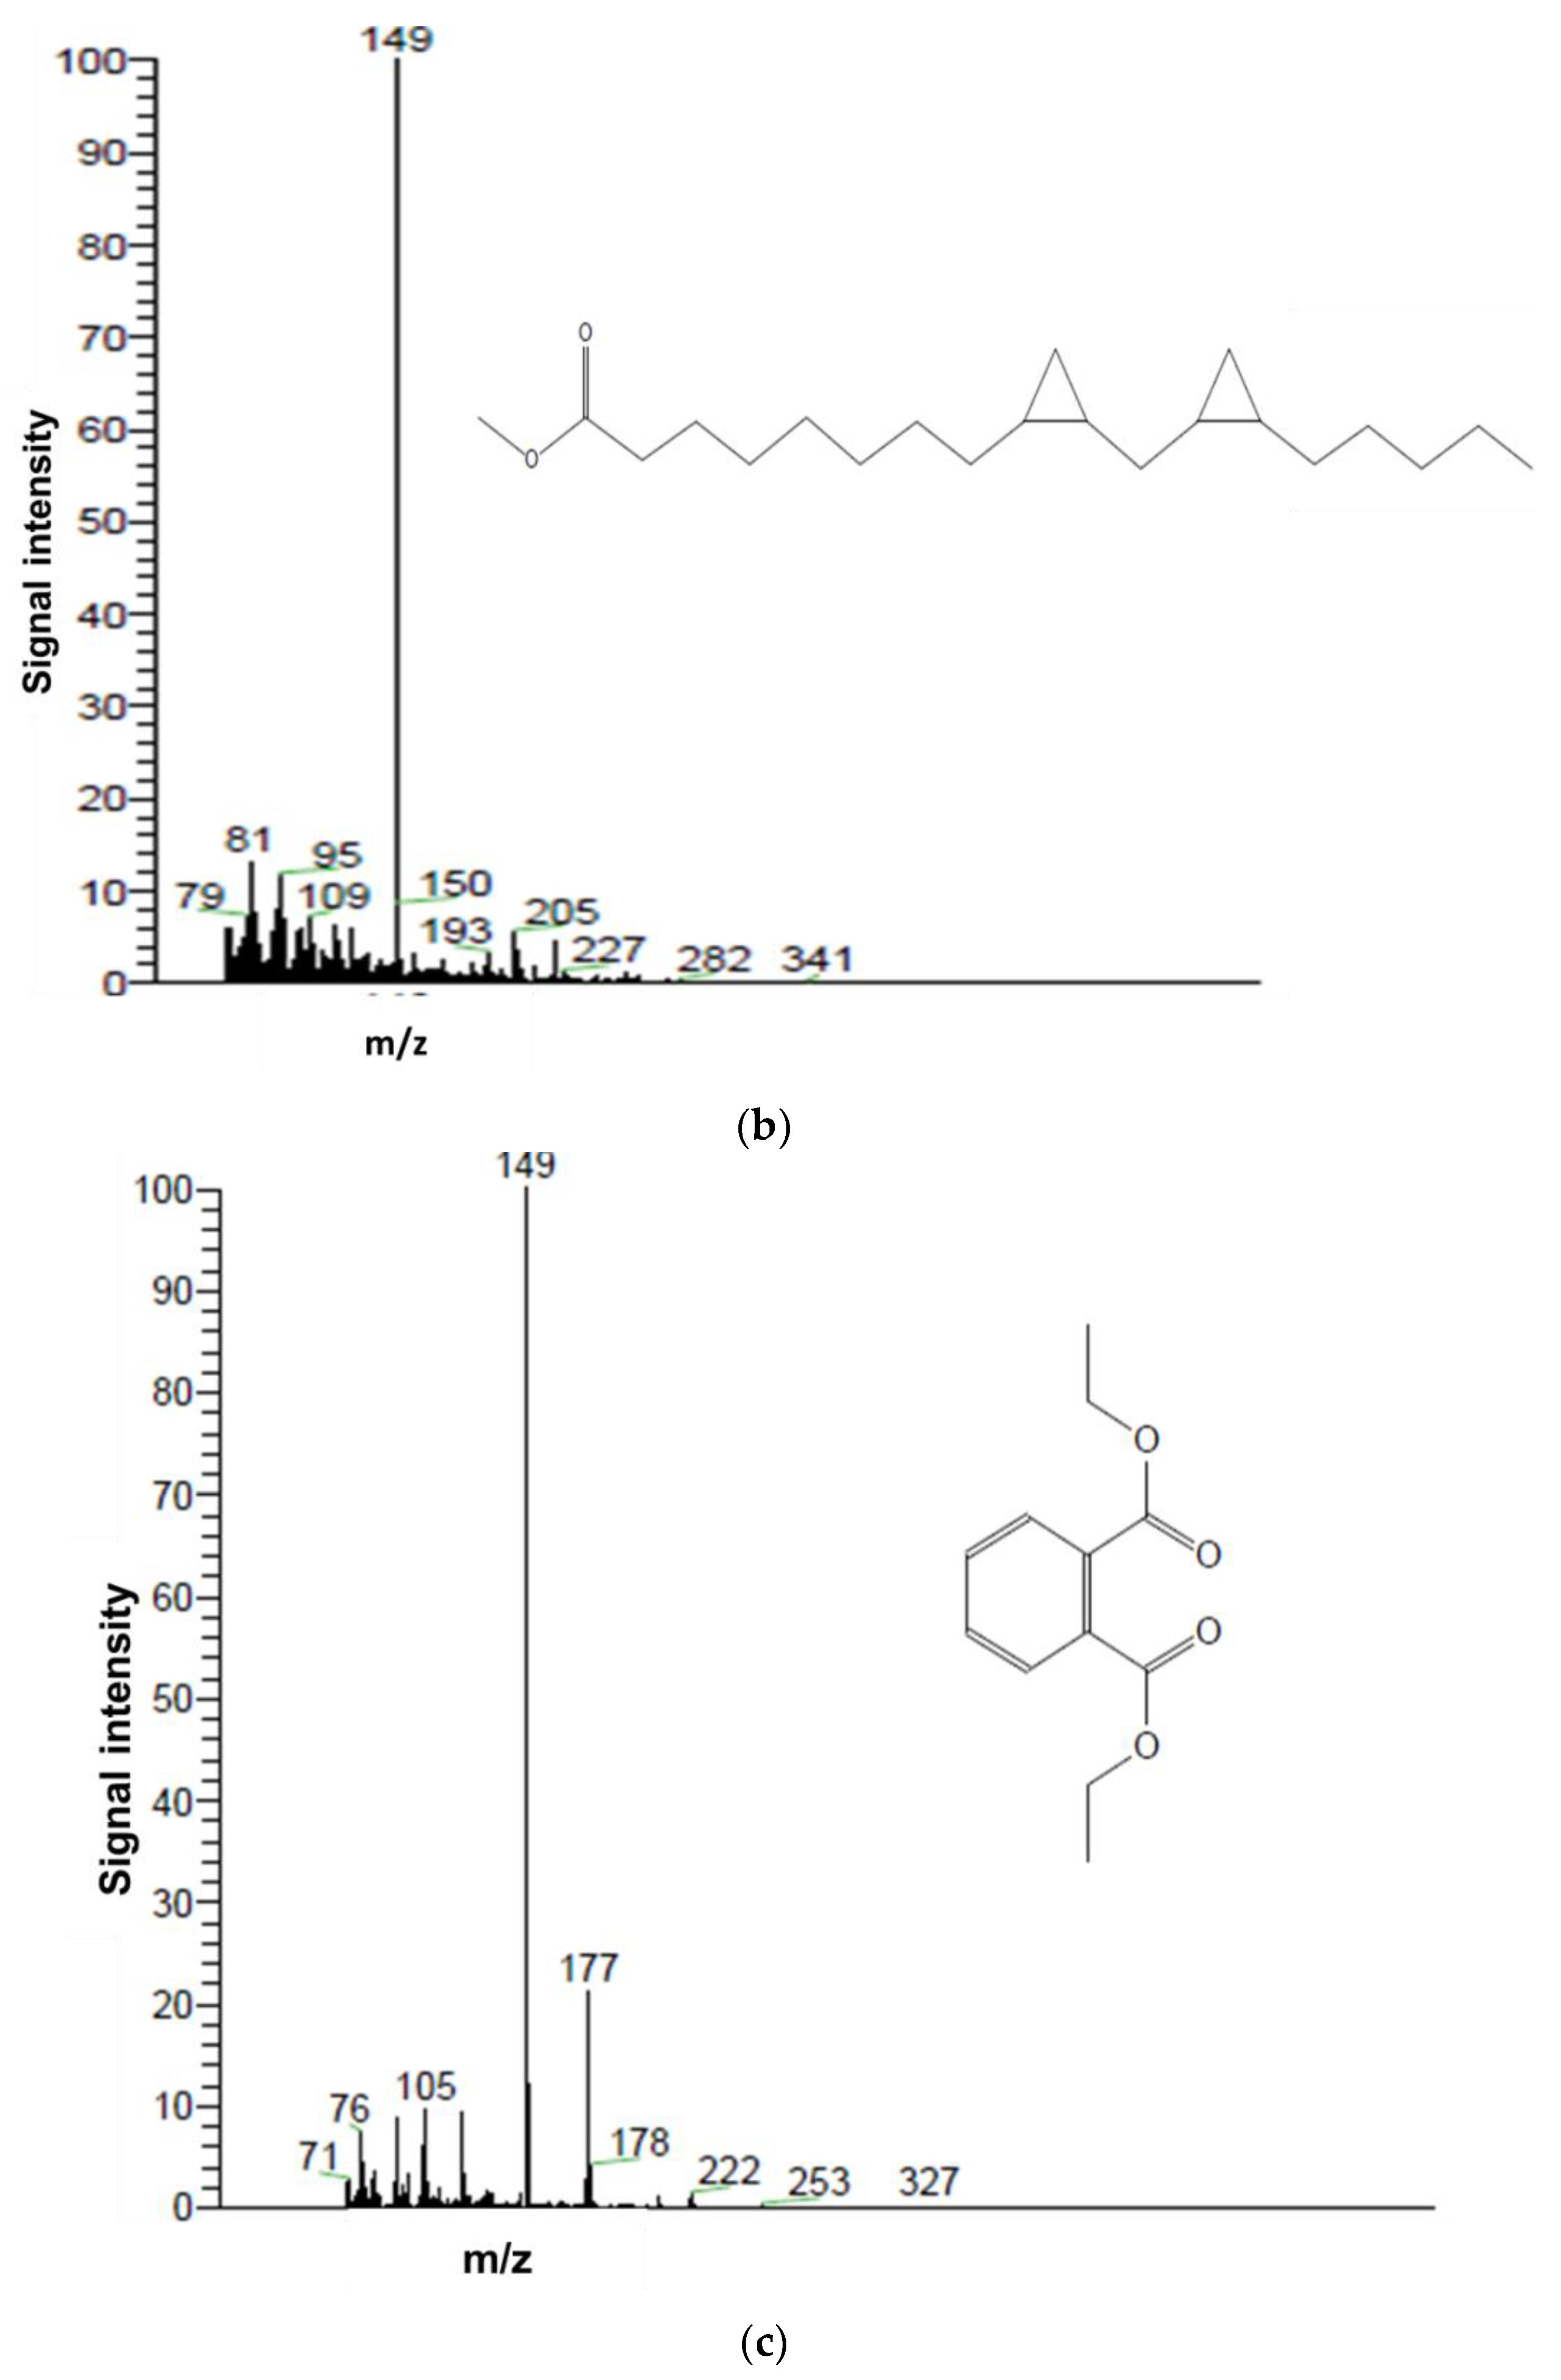
2.7. Detection of Phenol Degradation Metabolites via Gas Chromatography–Mass Spectroscopy (GC-MS)

The same extracted samples mentioned in the above section were used for GC-MS analysis for a qualitative estimation of phenol and its metabolites or degradation derivatives after the optimized cultural conditions. For the GC-MS analysis, 2 µL of control and degraded samples were injected into the GC-MS device equipped with a splitless injector and a PE Auto system XL gas chromatograph interfaced with a Turbo-mass spectrometric mass selective detector system. The MS was operated in the EI mode (70 eV) with helium as the carrier gas (flow rate 1 mL/min) and an analytical column HP (length 30 m × 0.20 mm, 0.11 mm film thickness). The MS was operated in the total ion current (TIC) mode, scanning from m/z 30 to 400. The metabolic intermediates were derived from phenol degradation identified by comparing their retention time (RT in min) and mass spectra with the library of the National Institute of Standard ad Technology (NIST), USA, or by comparing the RT with those authentic standards available [16].

3. Results and Discussion

3.1. Isolation and Purification of Phenol Degraders

A total of 15 bacterial isolates were selected from the phenol- and petroleum-hydrocarbon-contaminated wastewater that showed phenol-degrading ability and were selected for further investigations. Mixed species (consortia) were more efficient degraders than single strains. The rationale for using mixed culture populations was that the microbial consortia can perform more complicated tasks and endure more changeable environments than monocultures [17].

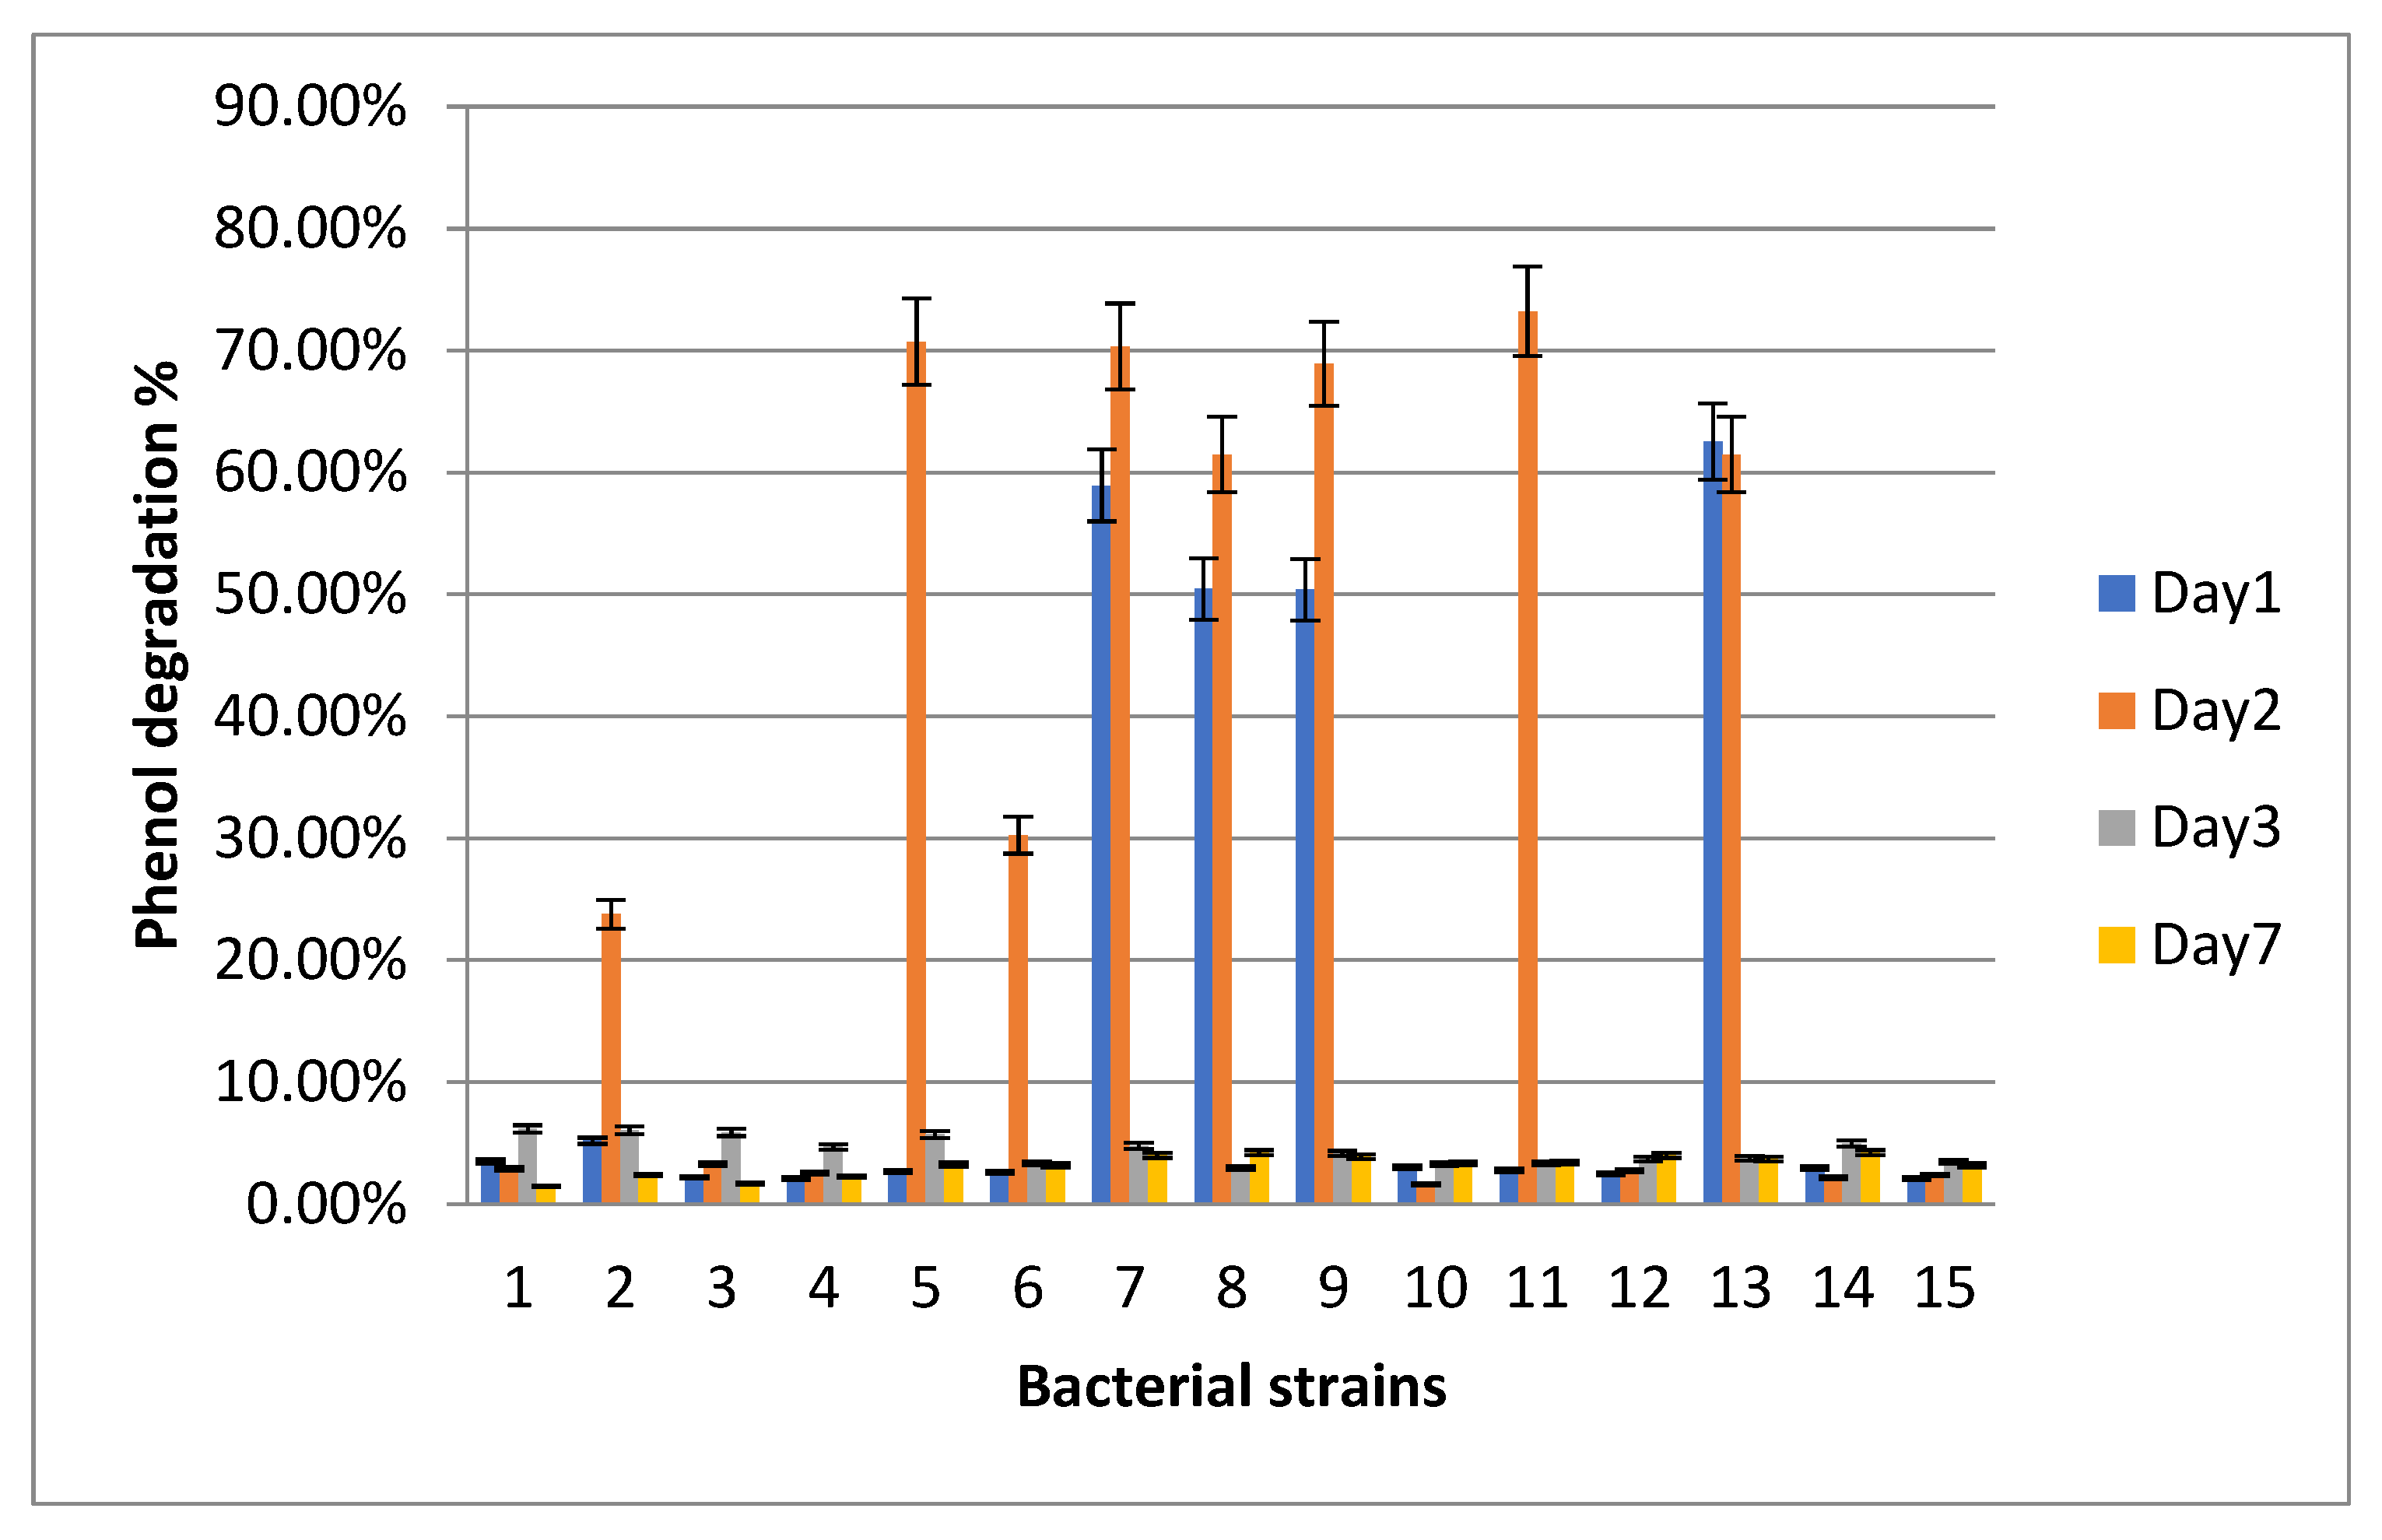
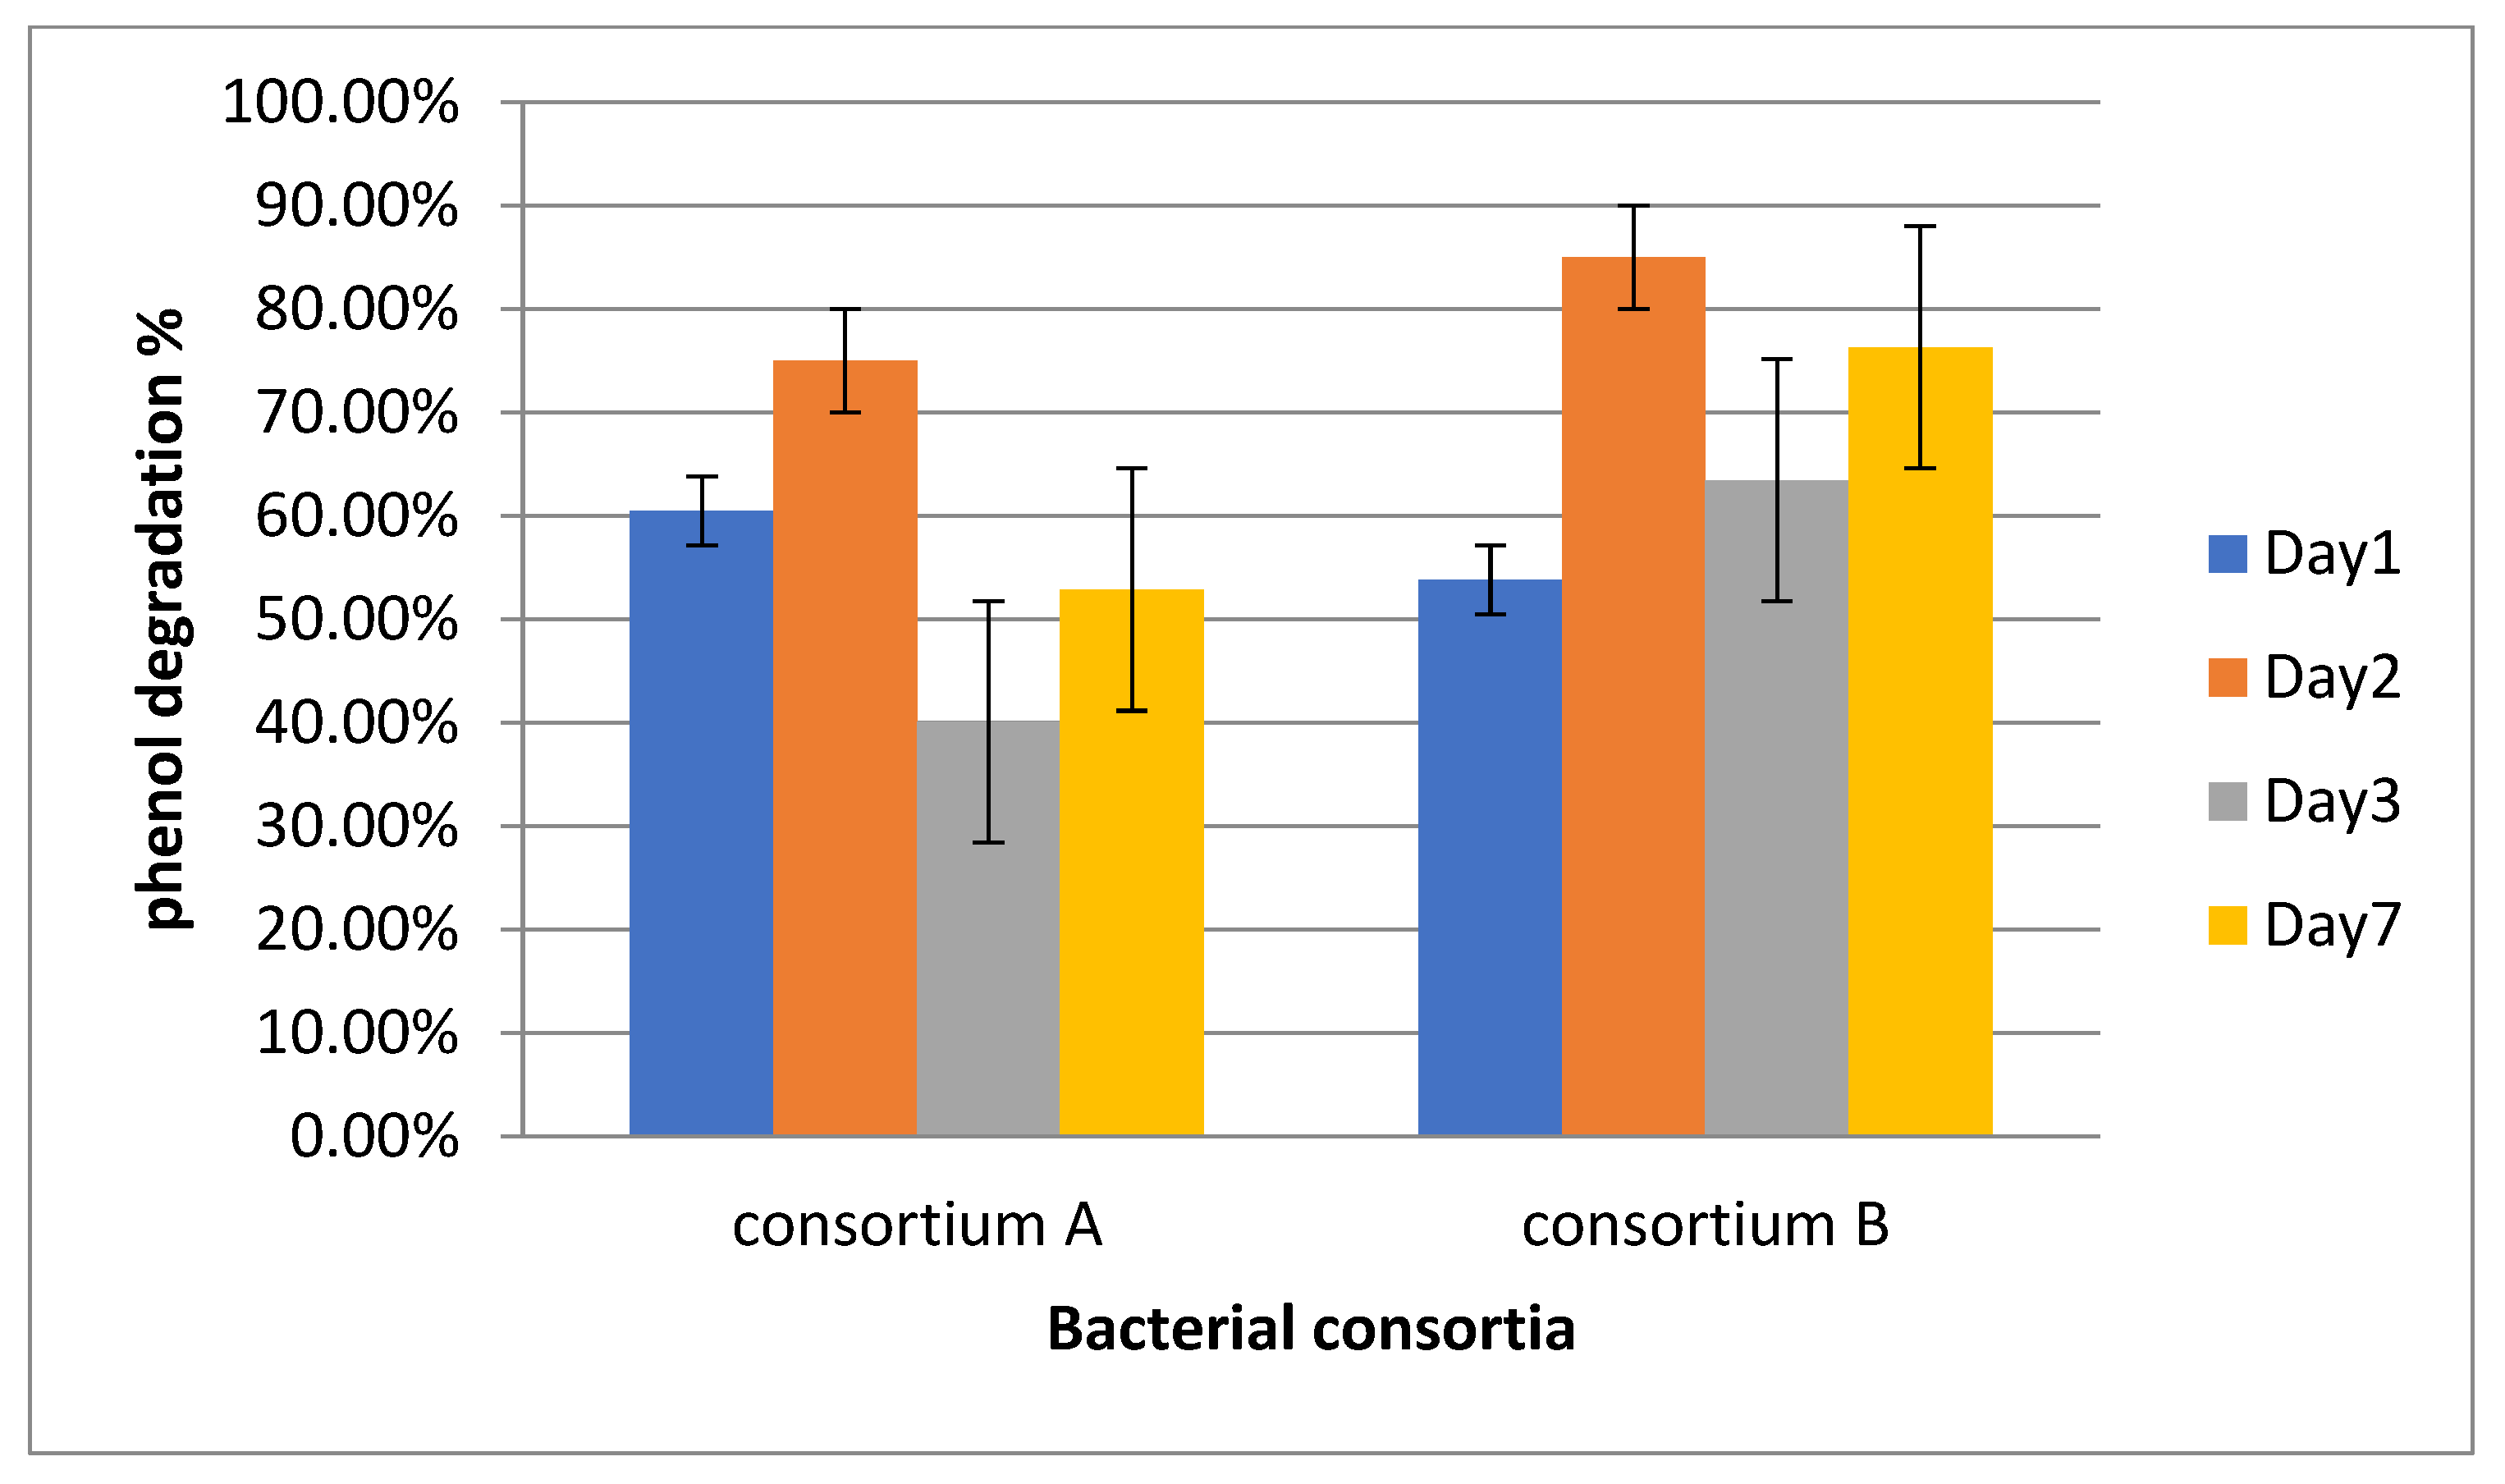
3.2. Screening for Phenol Biodegradation

Individual bacterial isolates showed a high affinity for phenol biodegradation. However, strain nos. 11, 5, 7, 9, 8, and 13 showed the highest promising results with a degradation percentage that reached 75% with strain 11 (Figure 2). Consortium A (composed of equal volumes of the six most promising isolates numbered 5, 7, 8, 9, 11, and 13) was compared with consortium B (consisting of equal volumes of all the fifteen isolated bacterial strains) (OD600 nm ≈ 1.00 ± 0.40 was prepared by mixing the purified isolates to a final concentration of 10.0% (v/v)). The results showed that consortium B was more efficient at phenol biodegradation, reaching 85% after 48 h incubation (Figure 3). The results of the present work were highly promising compared with that proposed by Ammeri et al. [18], who showed that the phenol degradation by bacterial consortia B1 and B2, respectively (B1 contained Citrobacter freundii, Klebsiella variicola, Staphylococcus equorum, and Micrococcus lylae, and B2 contained Leclercia adecarboxylata, Leclercia adecarboxylata, Klebsiella sp., and Klebsiella oxytoca) isolated from petroleum refineries in Egypt were 62.2 and 85.5%, respectively.

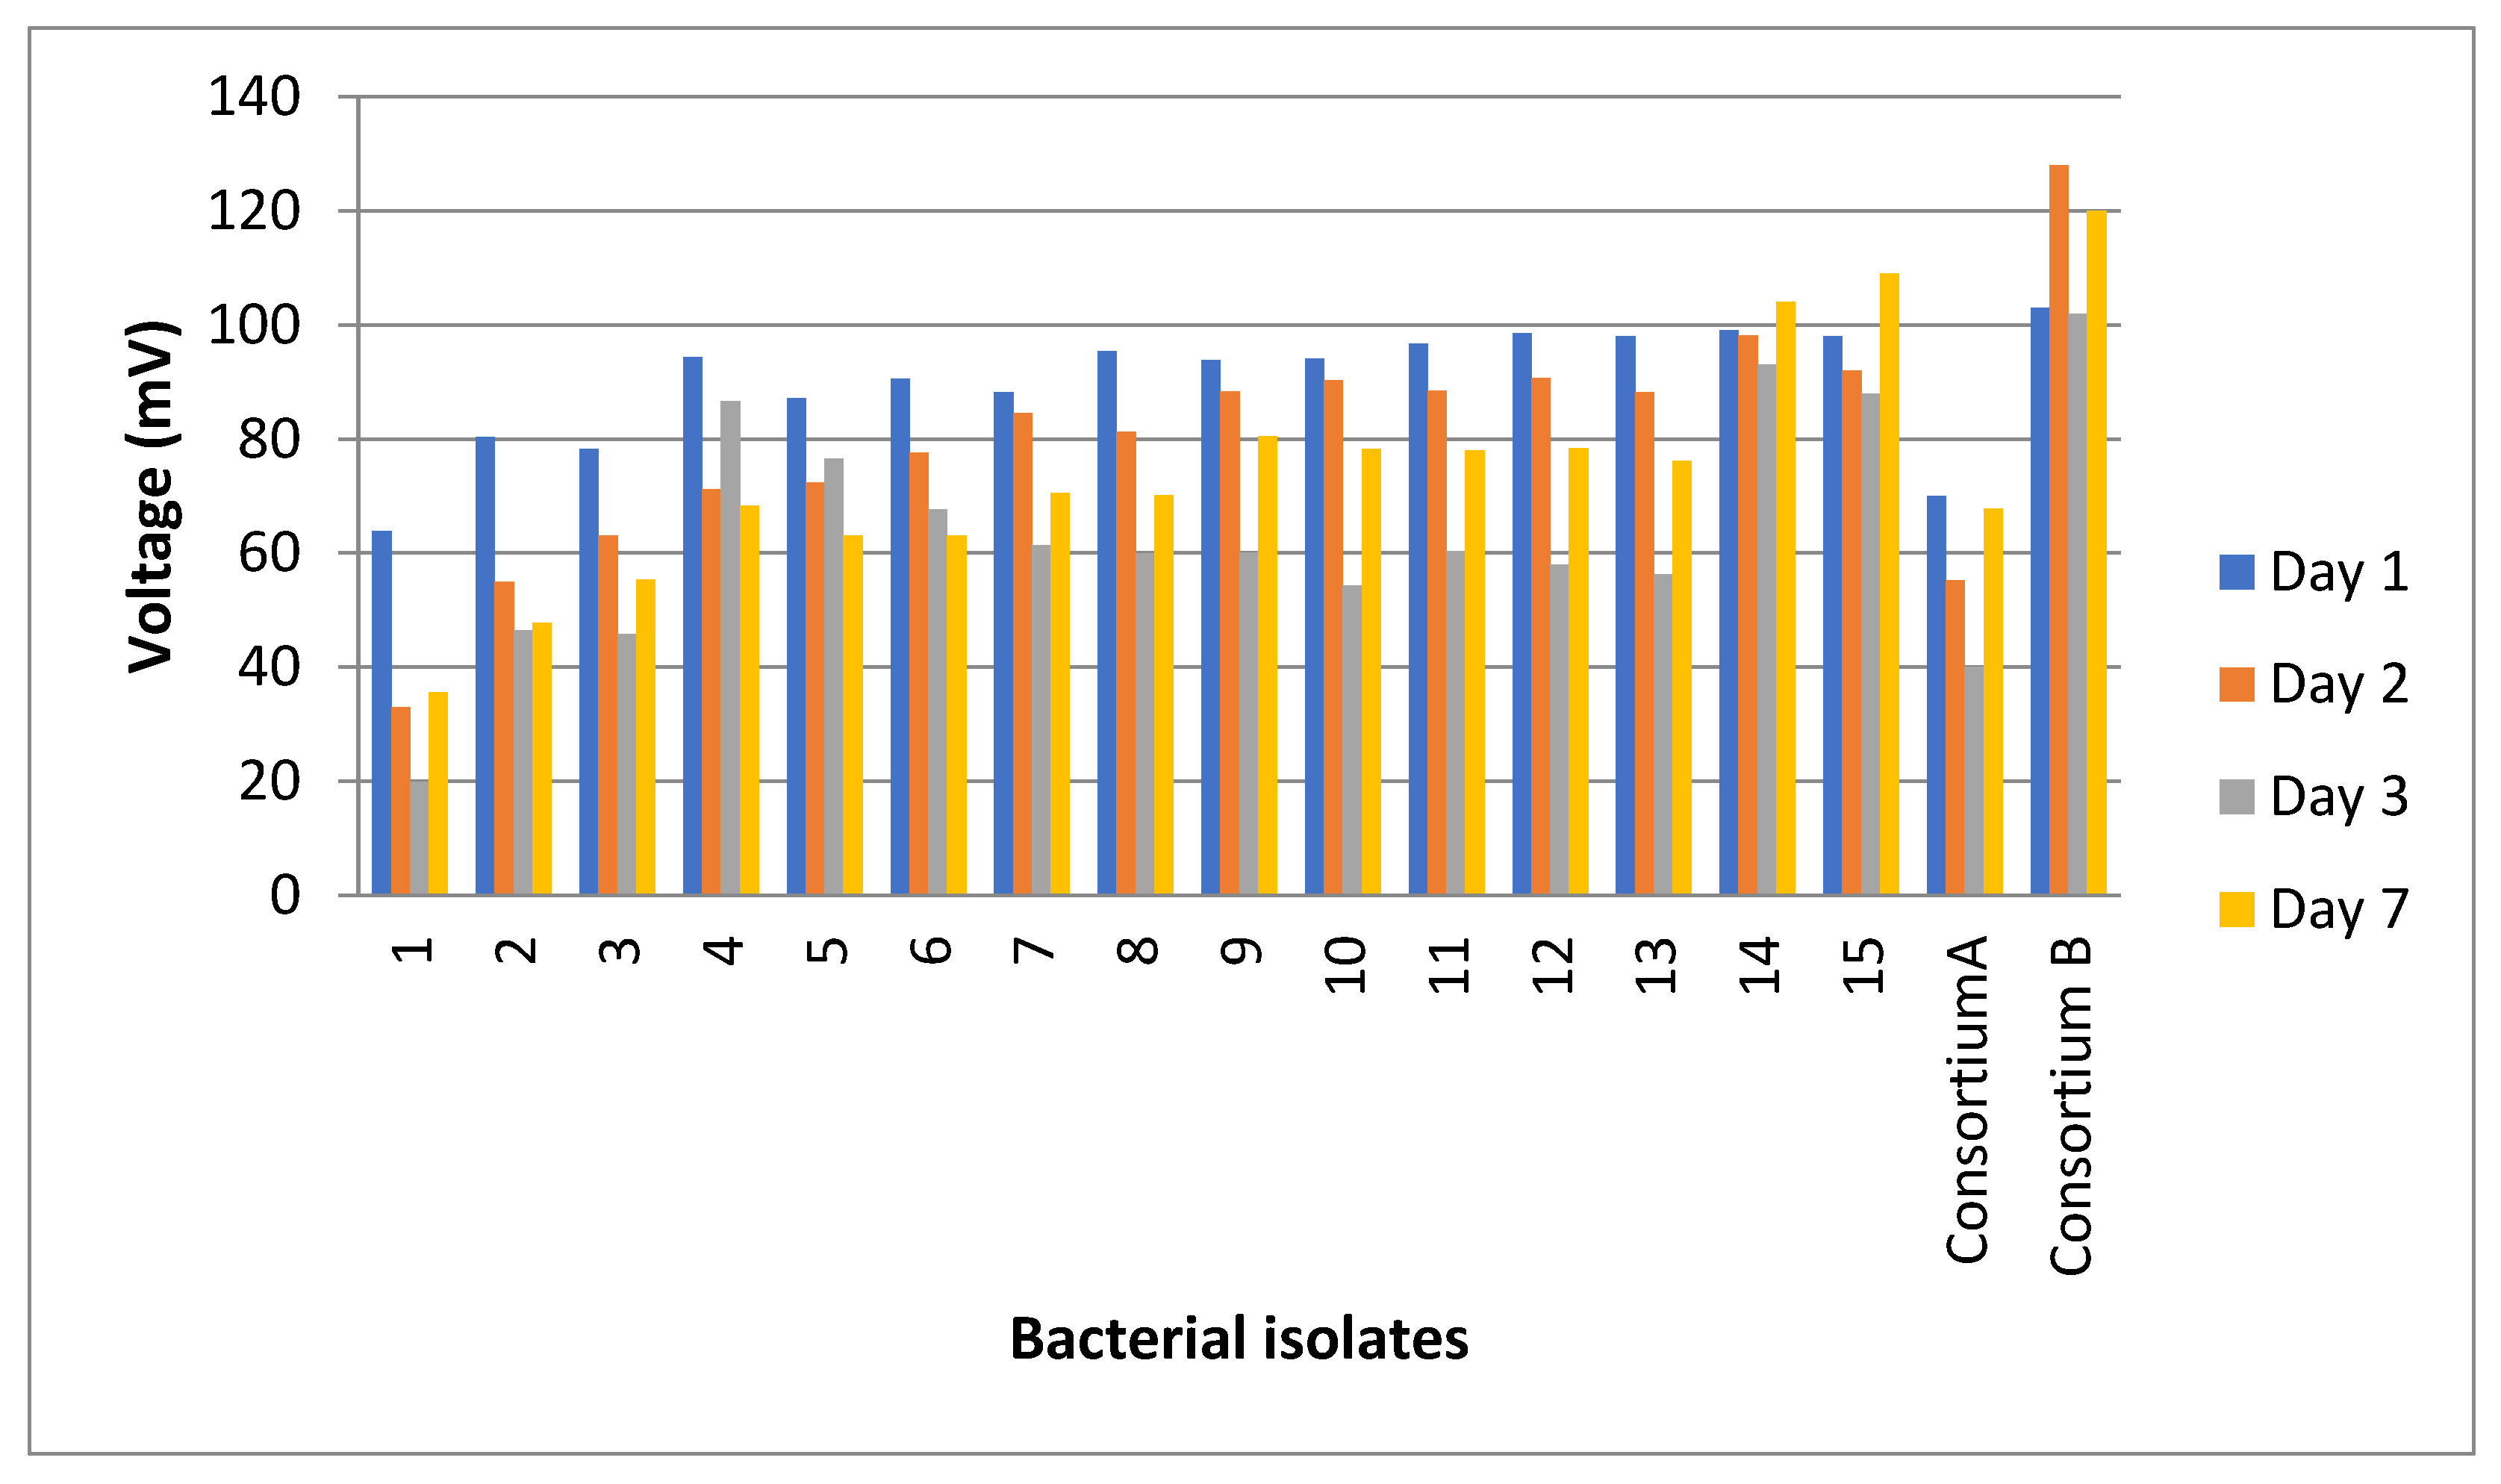
3.3. Bioelectricity Estimation

Bacterial isolates were tested for their bioelectricity generation capacity, both individually and in consortia A and B (mentioned above). The voltage was recorded through the MFC using the voltmeter, whereas the power density was calculated using Equation (4), knowing that the net anodic chamber volume was 80 mL. Bacterial isolate no. 15 showed the maximum bioelectricity generation after 7 days of incubation, followed by isolate no. 14, with cell voltages of 109 and 104 mV, respectively (Figure 4). On the other hand, consortium B showed the most promising results by generating 128 mV after 48 h, while consortium A showed inferior results across all time intervals. Similarly, Naik et al. [19] reported that bioelectricity generation occurred in response to phenol degradation when using a microbial biofilm that had been isolated from wastewater.

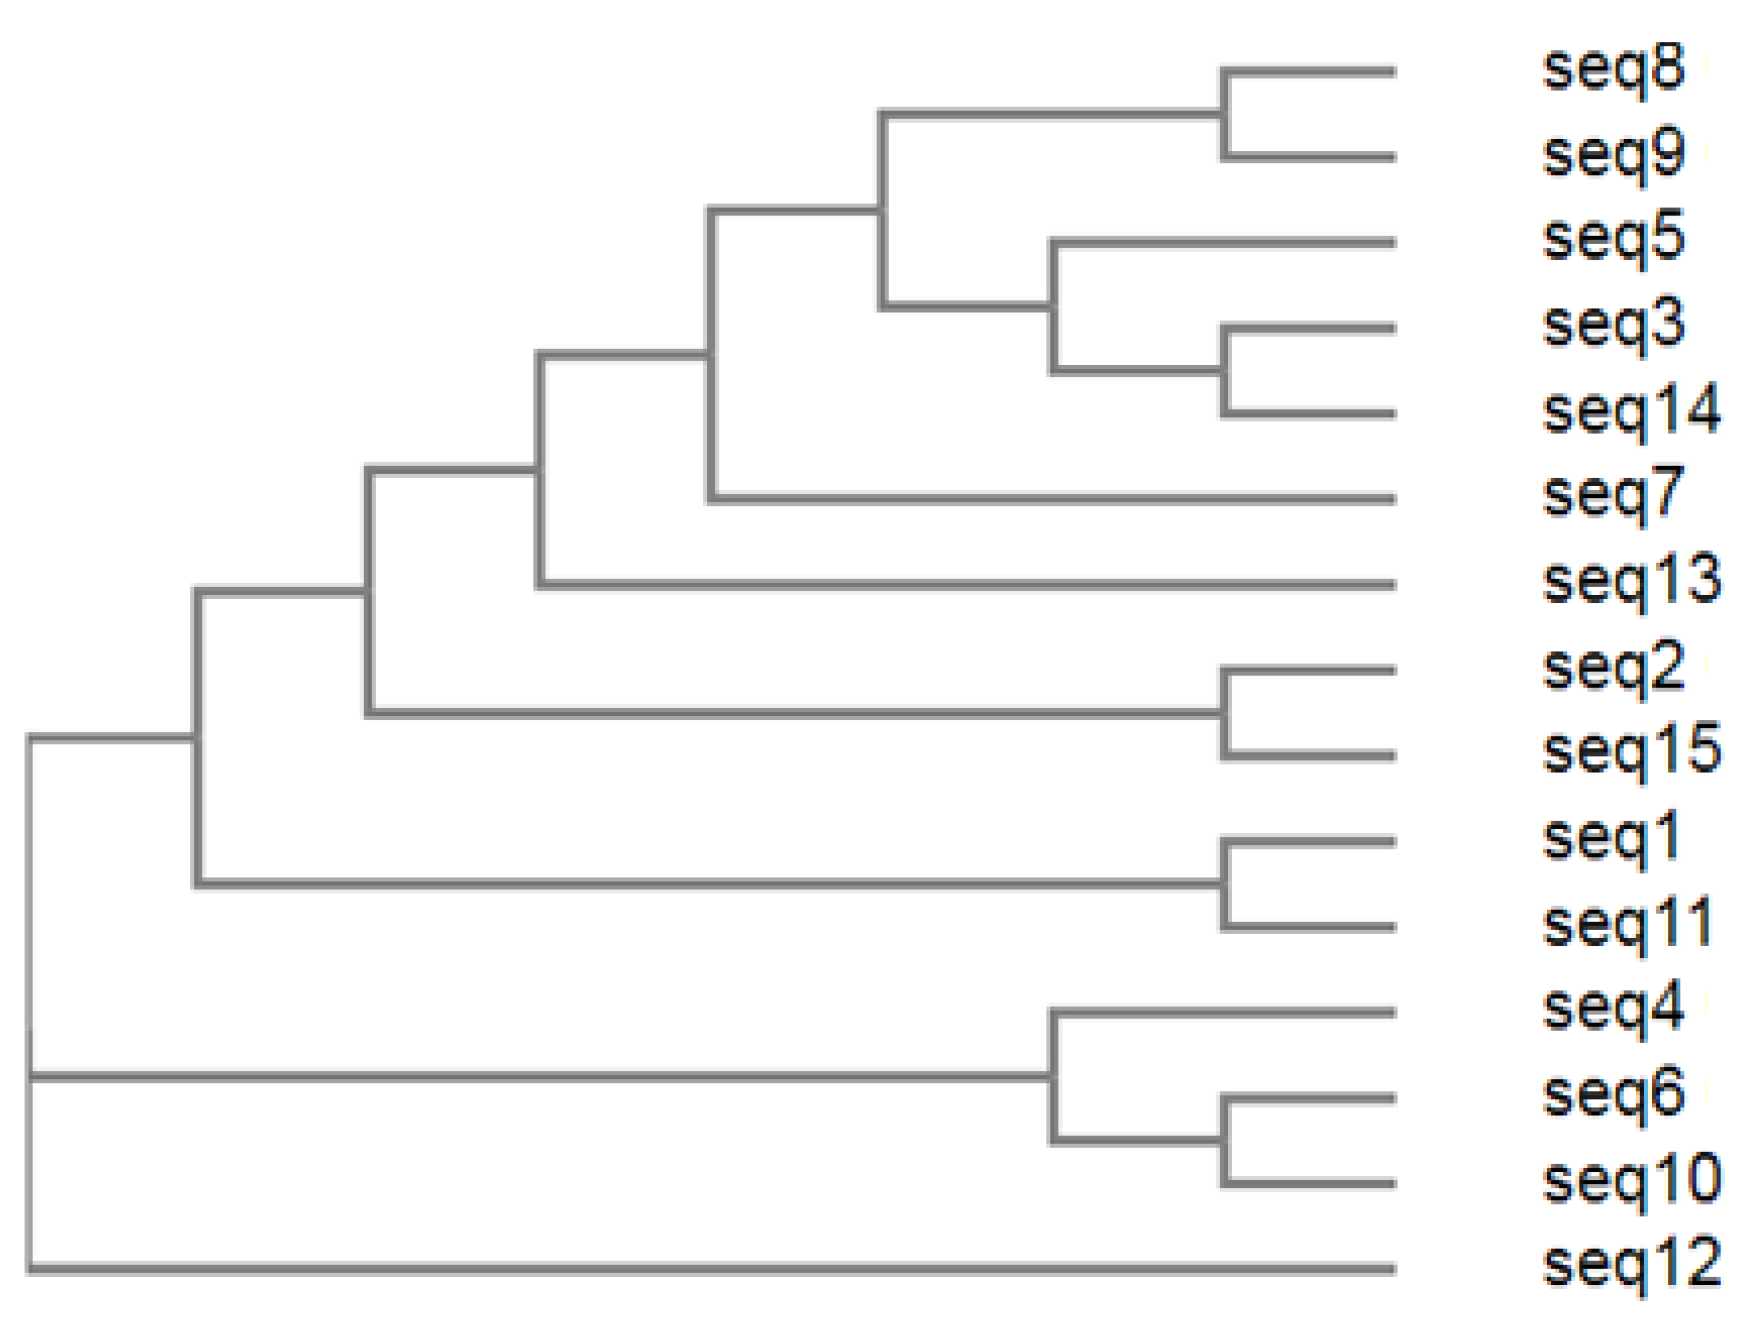
3.4. Phenol Degraders Identification

In the current study, fifteen strains were isolated from petroleum refinery plant wastewater. The bacterial isolates were identified using 16S rDNA sequencing after DNA extraction with purity levels in the range of 1.79–1.9. The sequences obtained were compared with the nucleotide sequences of the international database and the molecular analysis of the different bacterial isolates revealed that strain 1 was identified as Pseudomonas aeruginosa I with 100% similarity, while the rest of the isolates, namely, Klebsiella pneumonia I, Bacillus cereus, Pseudomonas monteilii, Bacillus subtilis, Pseudomonas mosselii, Staphylococcus equorum, Bacillus benzoevorans, Bacillus circulans, Pseudomonas fulva, Pseudomonas aeruginosa II, Pseudomonas putida, Burkholderia cepacia, Bacillus cereus, and Klebsiella pneumonia II, showed 97.33, 99.35, 98.4, 97.9, 98, 99.7, 97.9, 97.8, 96.2, 97.3, 99, 97.25, 99.6, and 96.4% similarities, respectively (Table 3). The 16S rRNA sequence was deposited in the NCBI Gene Bank nucleotide sequence database under certain accession numbers (Table 3). Furthermore, the 16S rRNA sequence obtained was added to publicly available bacterial 16S rRNA sequences, and the phylogenetic tree was generated by performing distance matrix analysis using the NT system (Figure 5). In other similar studies, Al-Shaikh et al. [20] reported the isolation of a bacterial consortium of Ochrobactrum sp., Marinobacter sp., Pseudomonas sp., and Stenotrophomonas maltophilia from petroleum-contaminated wastewater from a different place in the Red Sea, Jeddah coast, Saudi Arabia.

3.5. Optimization of Nutritional and Environmental Factors

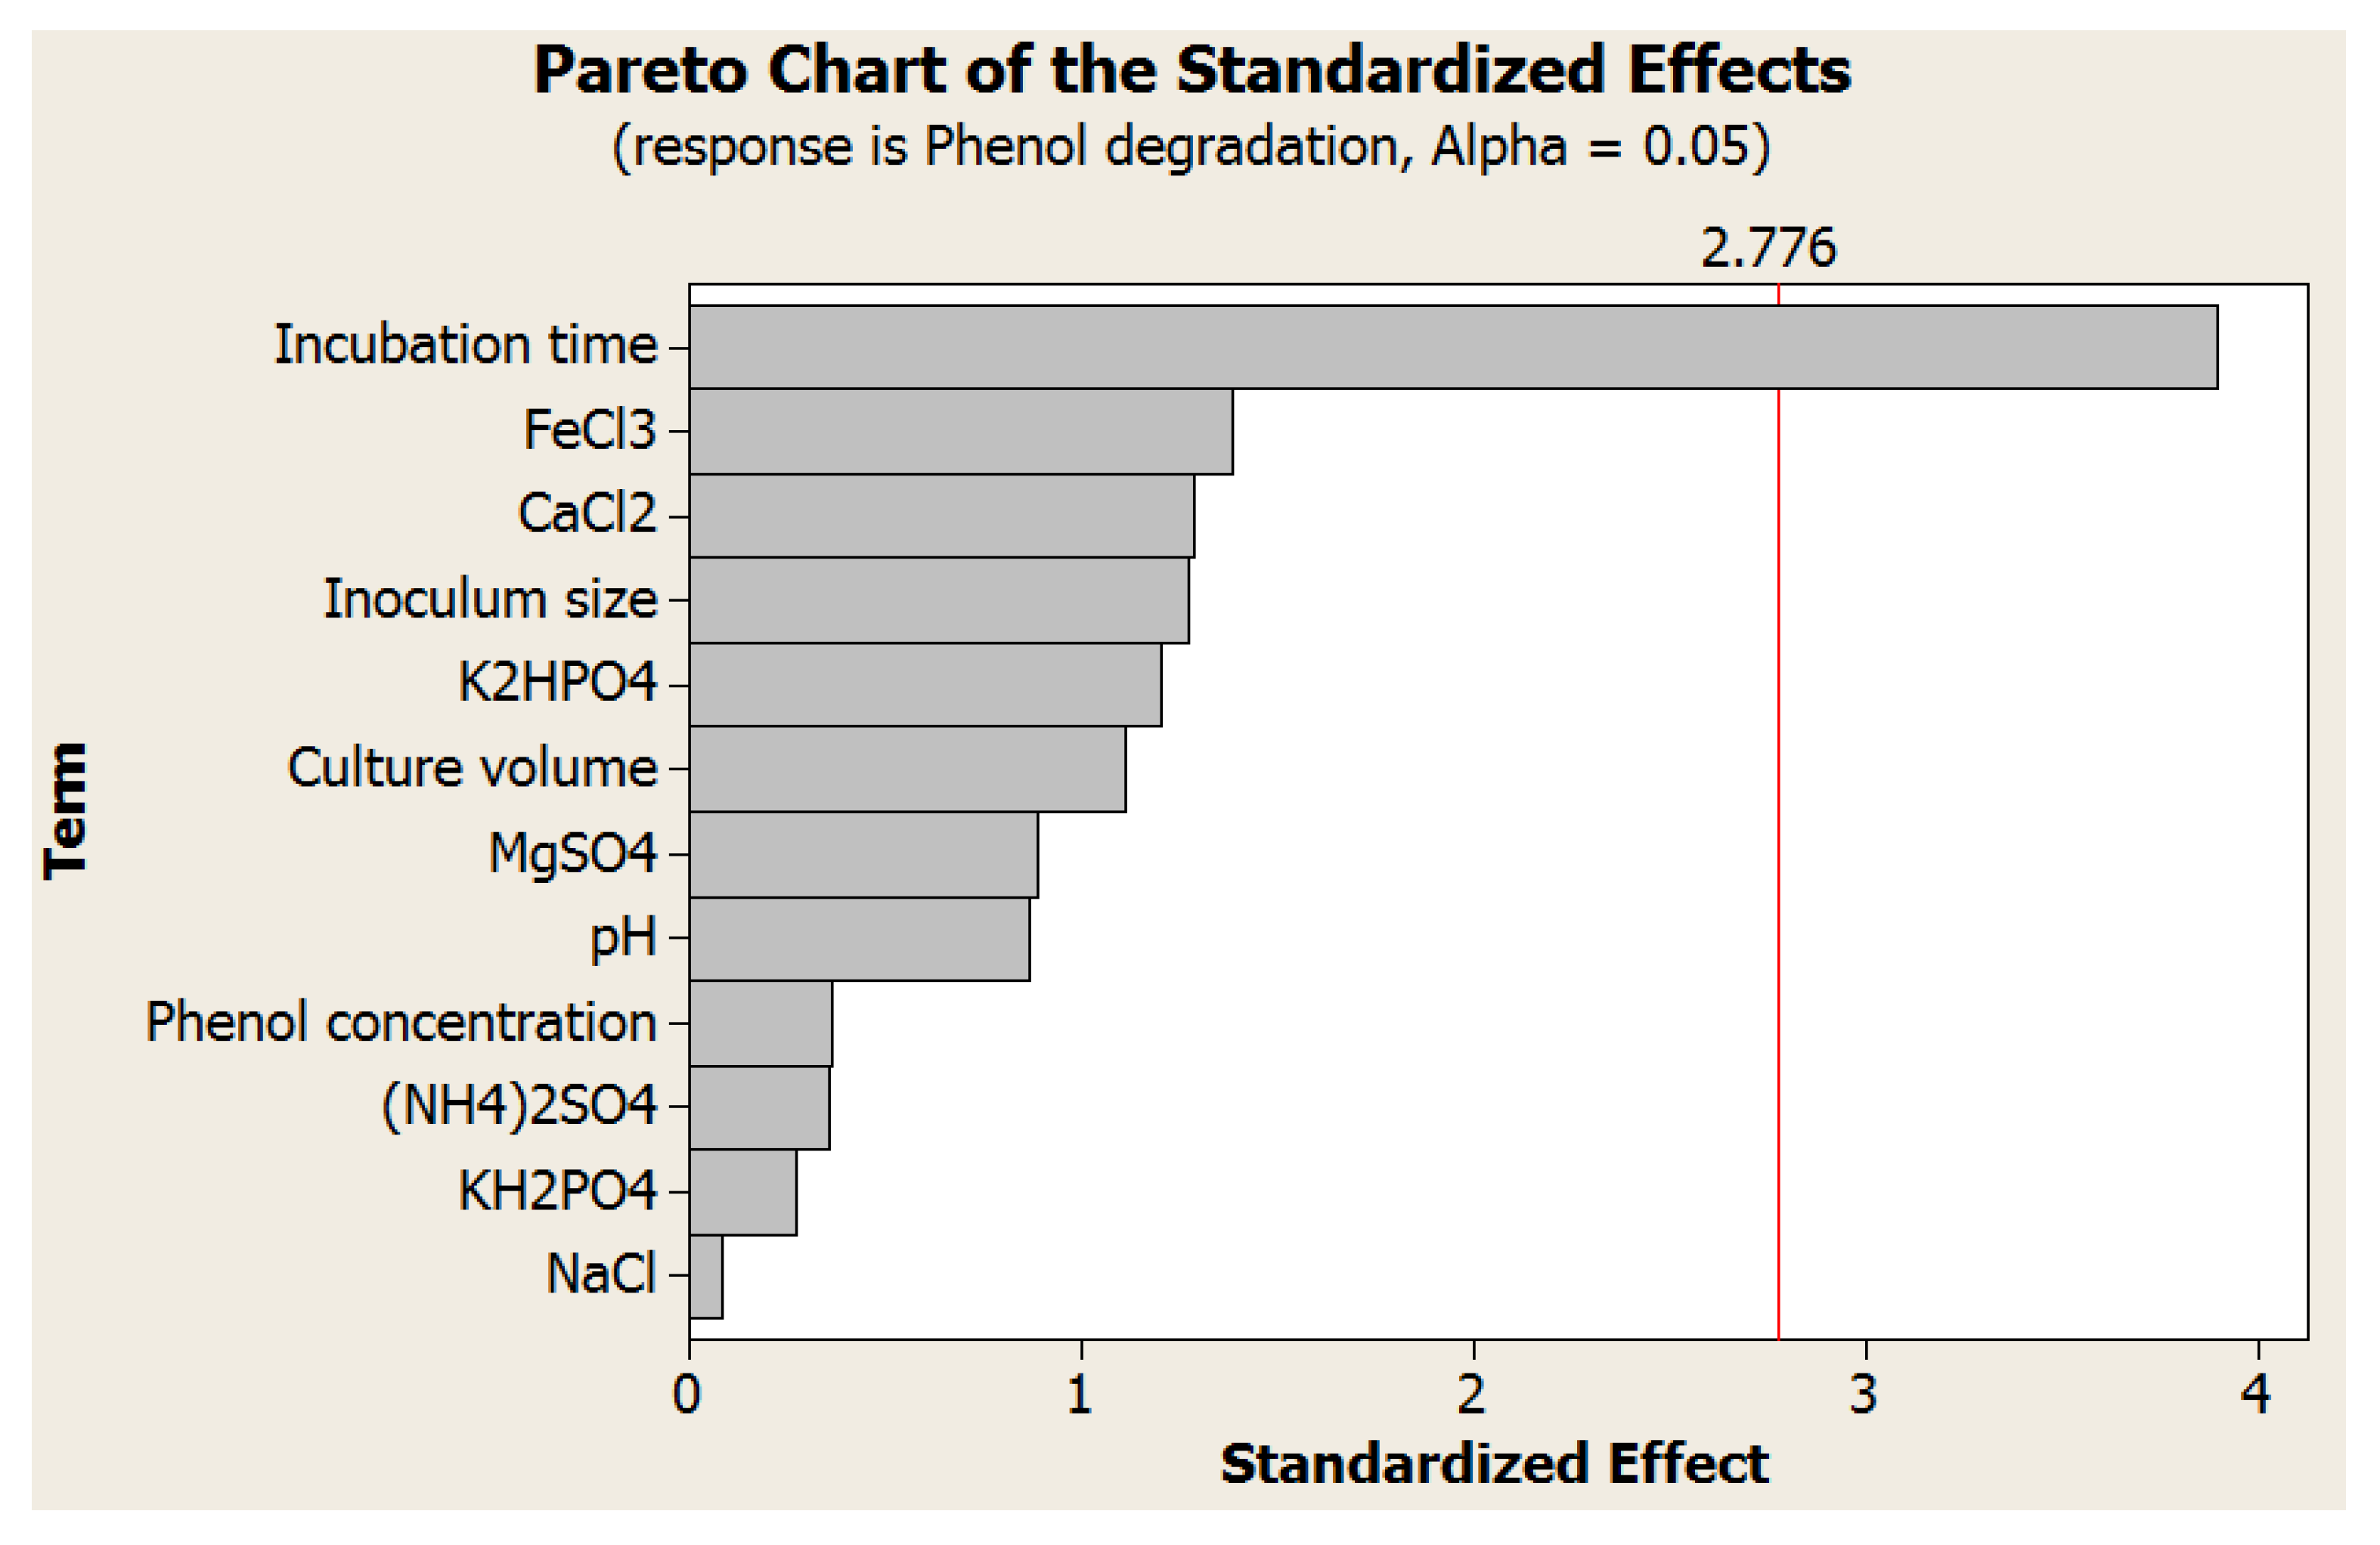
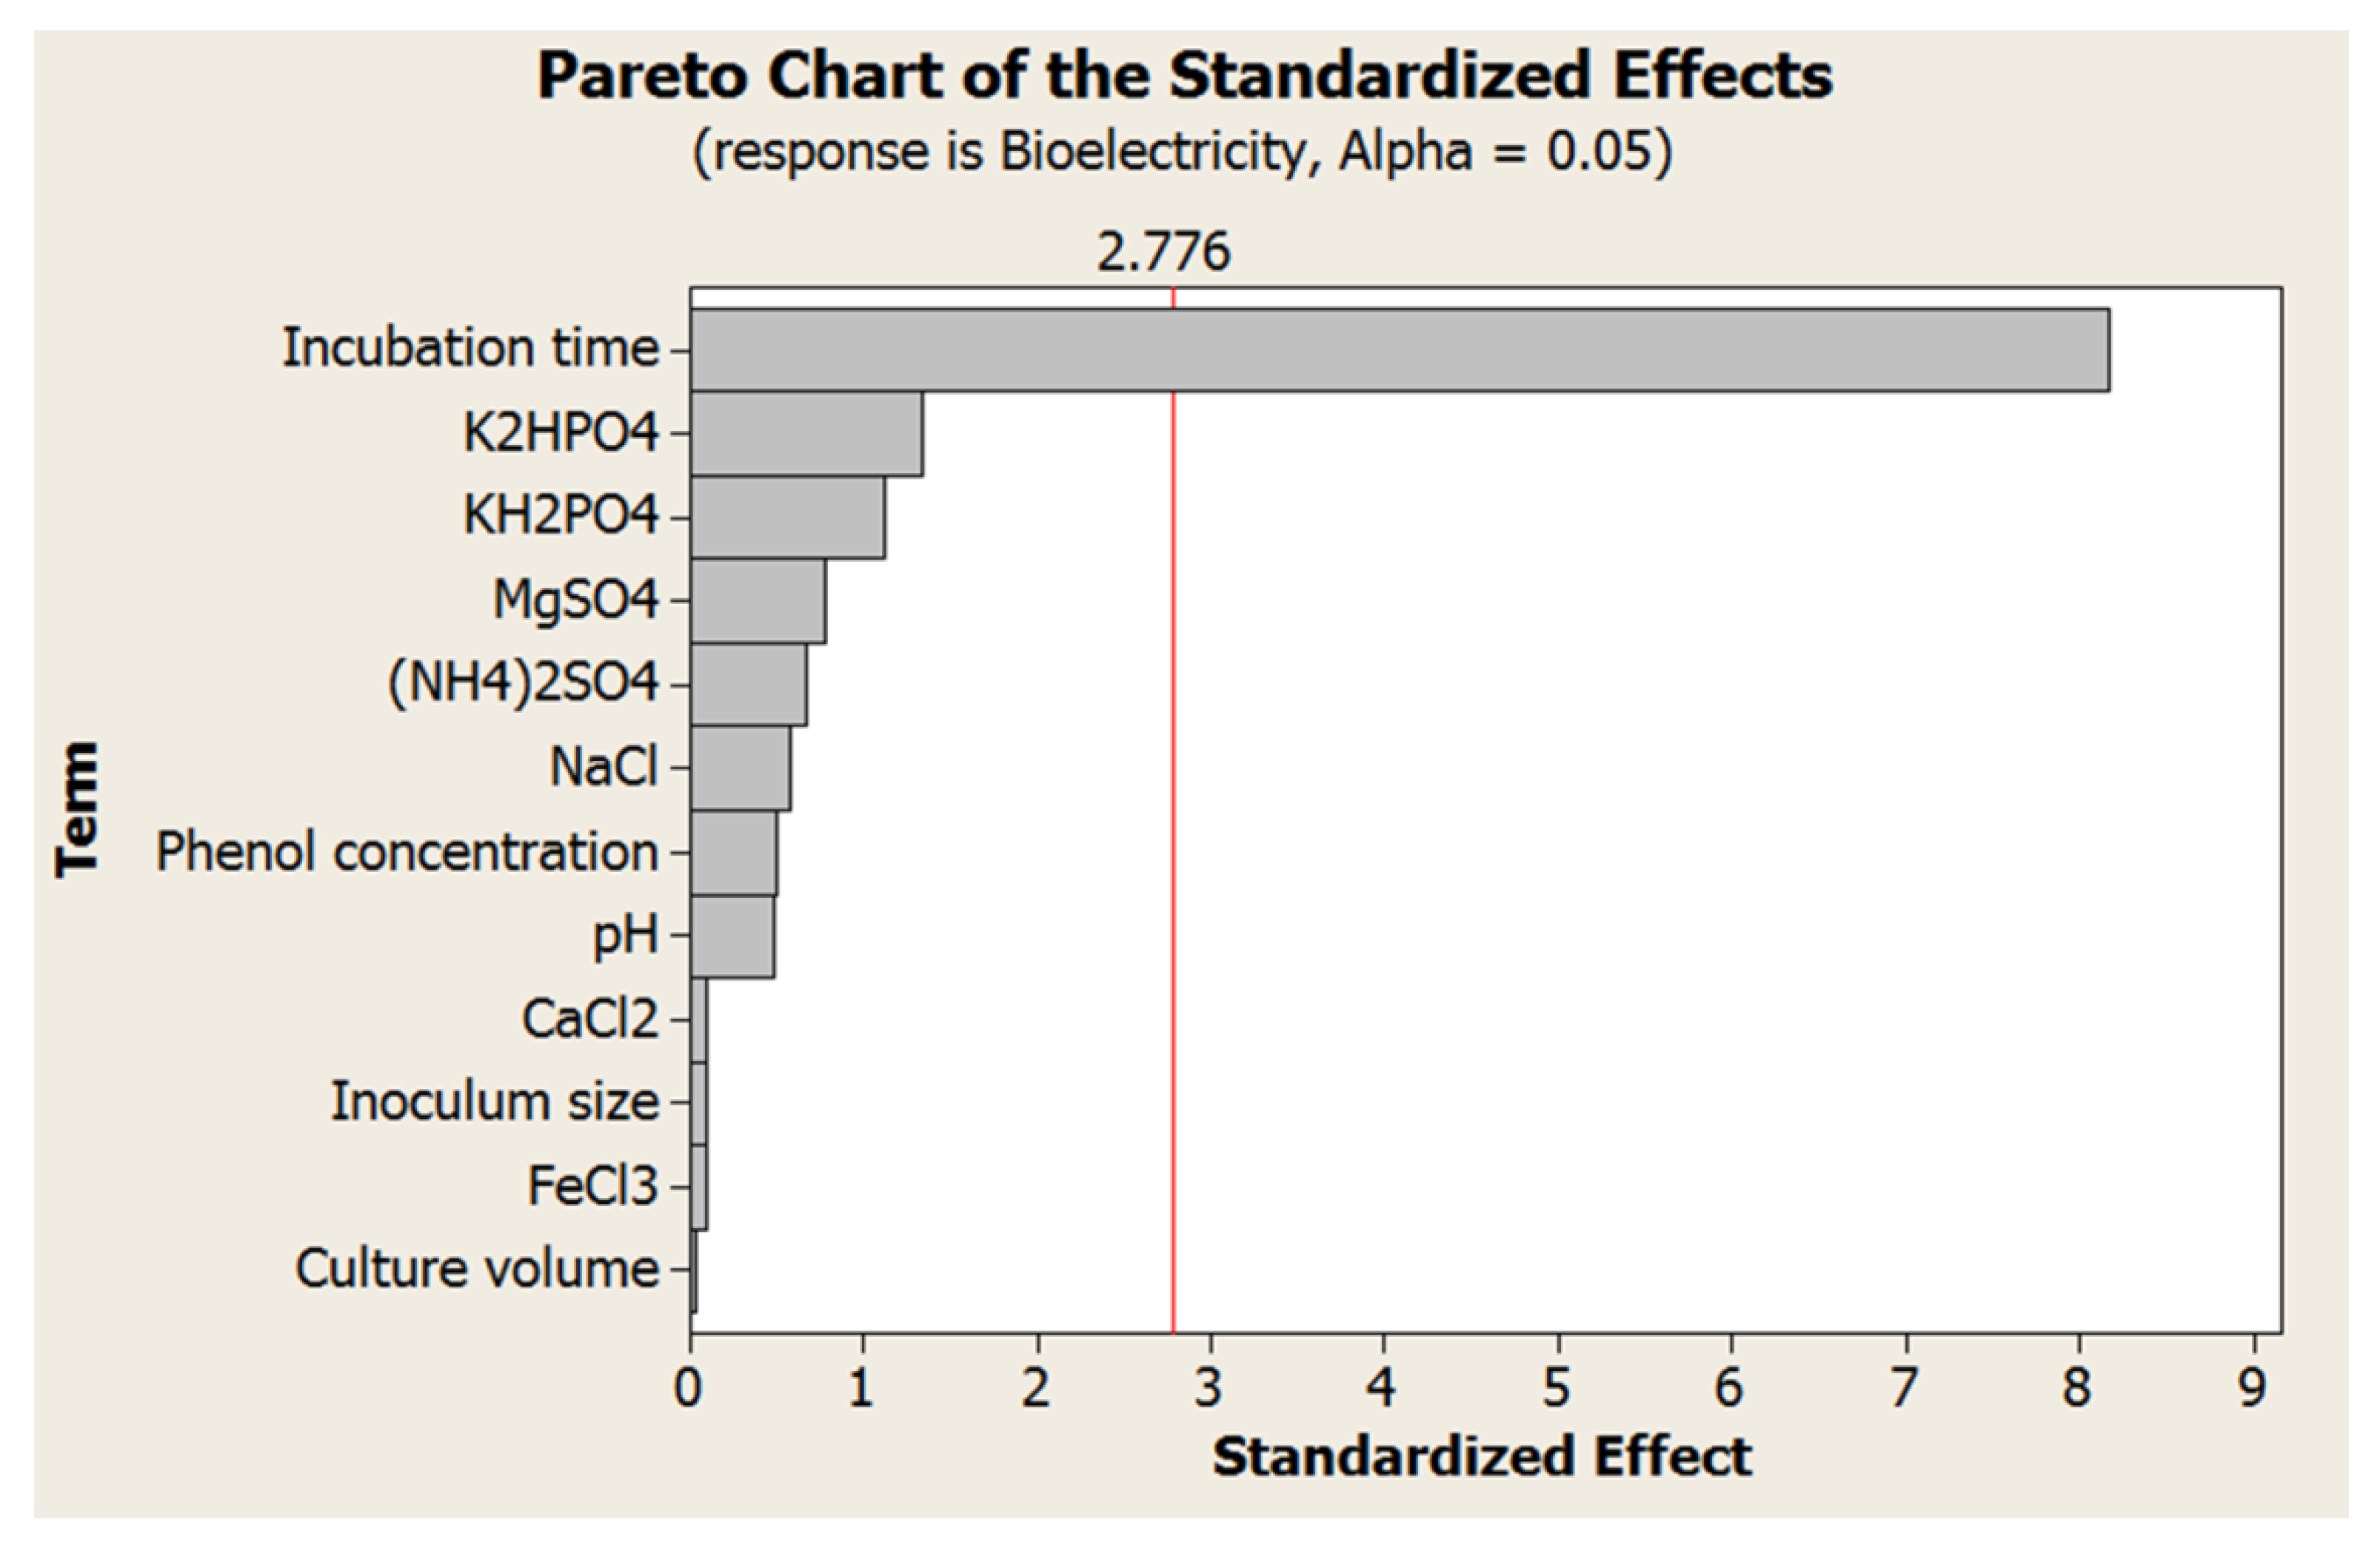
3.5.1. Placket–Burman Design (PBD)

Consortium B contained the isolated and purified 15 bacterial phenol degraders and was subjected to optimization of the nutritional and environmental conditions across twelve factors using a Plackett–Burman Design (PBD). Their effect on phenol biodegradation (response 1) and bioelectricity generation (response 2) were statistically analyzed using Minitab 19® (Table 4). Each proposed factor had a coefficient in the regression equations (Equations (8) and (9)) and the significance of each coefficient was determined using a t-test and p-values of an ANOVA (Table 5 and Table 6).
Some variables, namely, incubation time, FeCl3, and CaCl2, were found to be the most significant for phenol biodegradation. On the other hand, incubation time, K2HPO4, and KH2PO4 were found to be significant for bioelectricity generation, which was further confirmed using Pareto charts (Figure 6 and Figure 7). Therefore, incubation time, K2HPO4, KH2PO4, FeCl3, and CaCl2 were selected for further optimization at five coded levels (−2, −1, 0, 1, 2) for a deeper analysis of the whole process using consortium B by applying a CCD, as they were confirmed to have a tremendous effect on both the phenol biodegradation and bioelectricity generation.
% Phenol degradation = 1.671 − 0.0723 Inoculum size + 0.00684 Culture volume + 0.02167 Phenol concentration − 0.2194 pH − 0.0162 Incubation time − 0.254 KH2PO4 + 0.945 K2HPO4 + 0.584 (NH4)2SO4 + 5.50 NaCl − 8.83 FeCl3.6H2O − 2.10 MgSO4.7H2O − 2.18 CaCl2.2H2O
Power = 1.7538 − 1.0488 Inoculum size − 6.74 Culture volume − 1.764 Phenol concentration − 4.846 pH + 3.273 Incubation time − 2.987 KH2PO4 + 6.966 K2HPO4 − 5.271 (NH4)2SO4 + 5.143 NaCl + 2.915 FeCl3.6H2O + 5.0159 MgSO4.7H2O − 3.678 CaCl2.2H2O

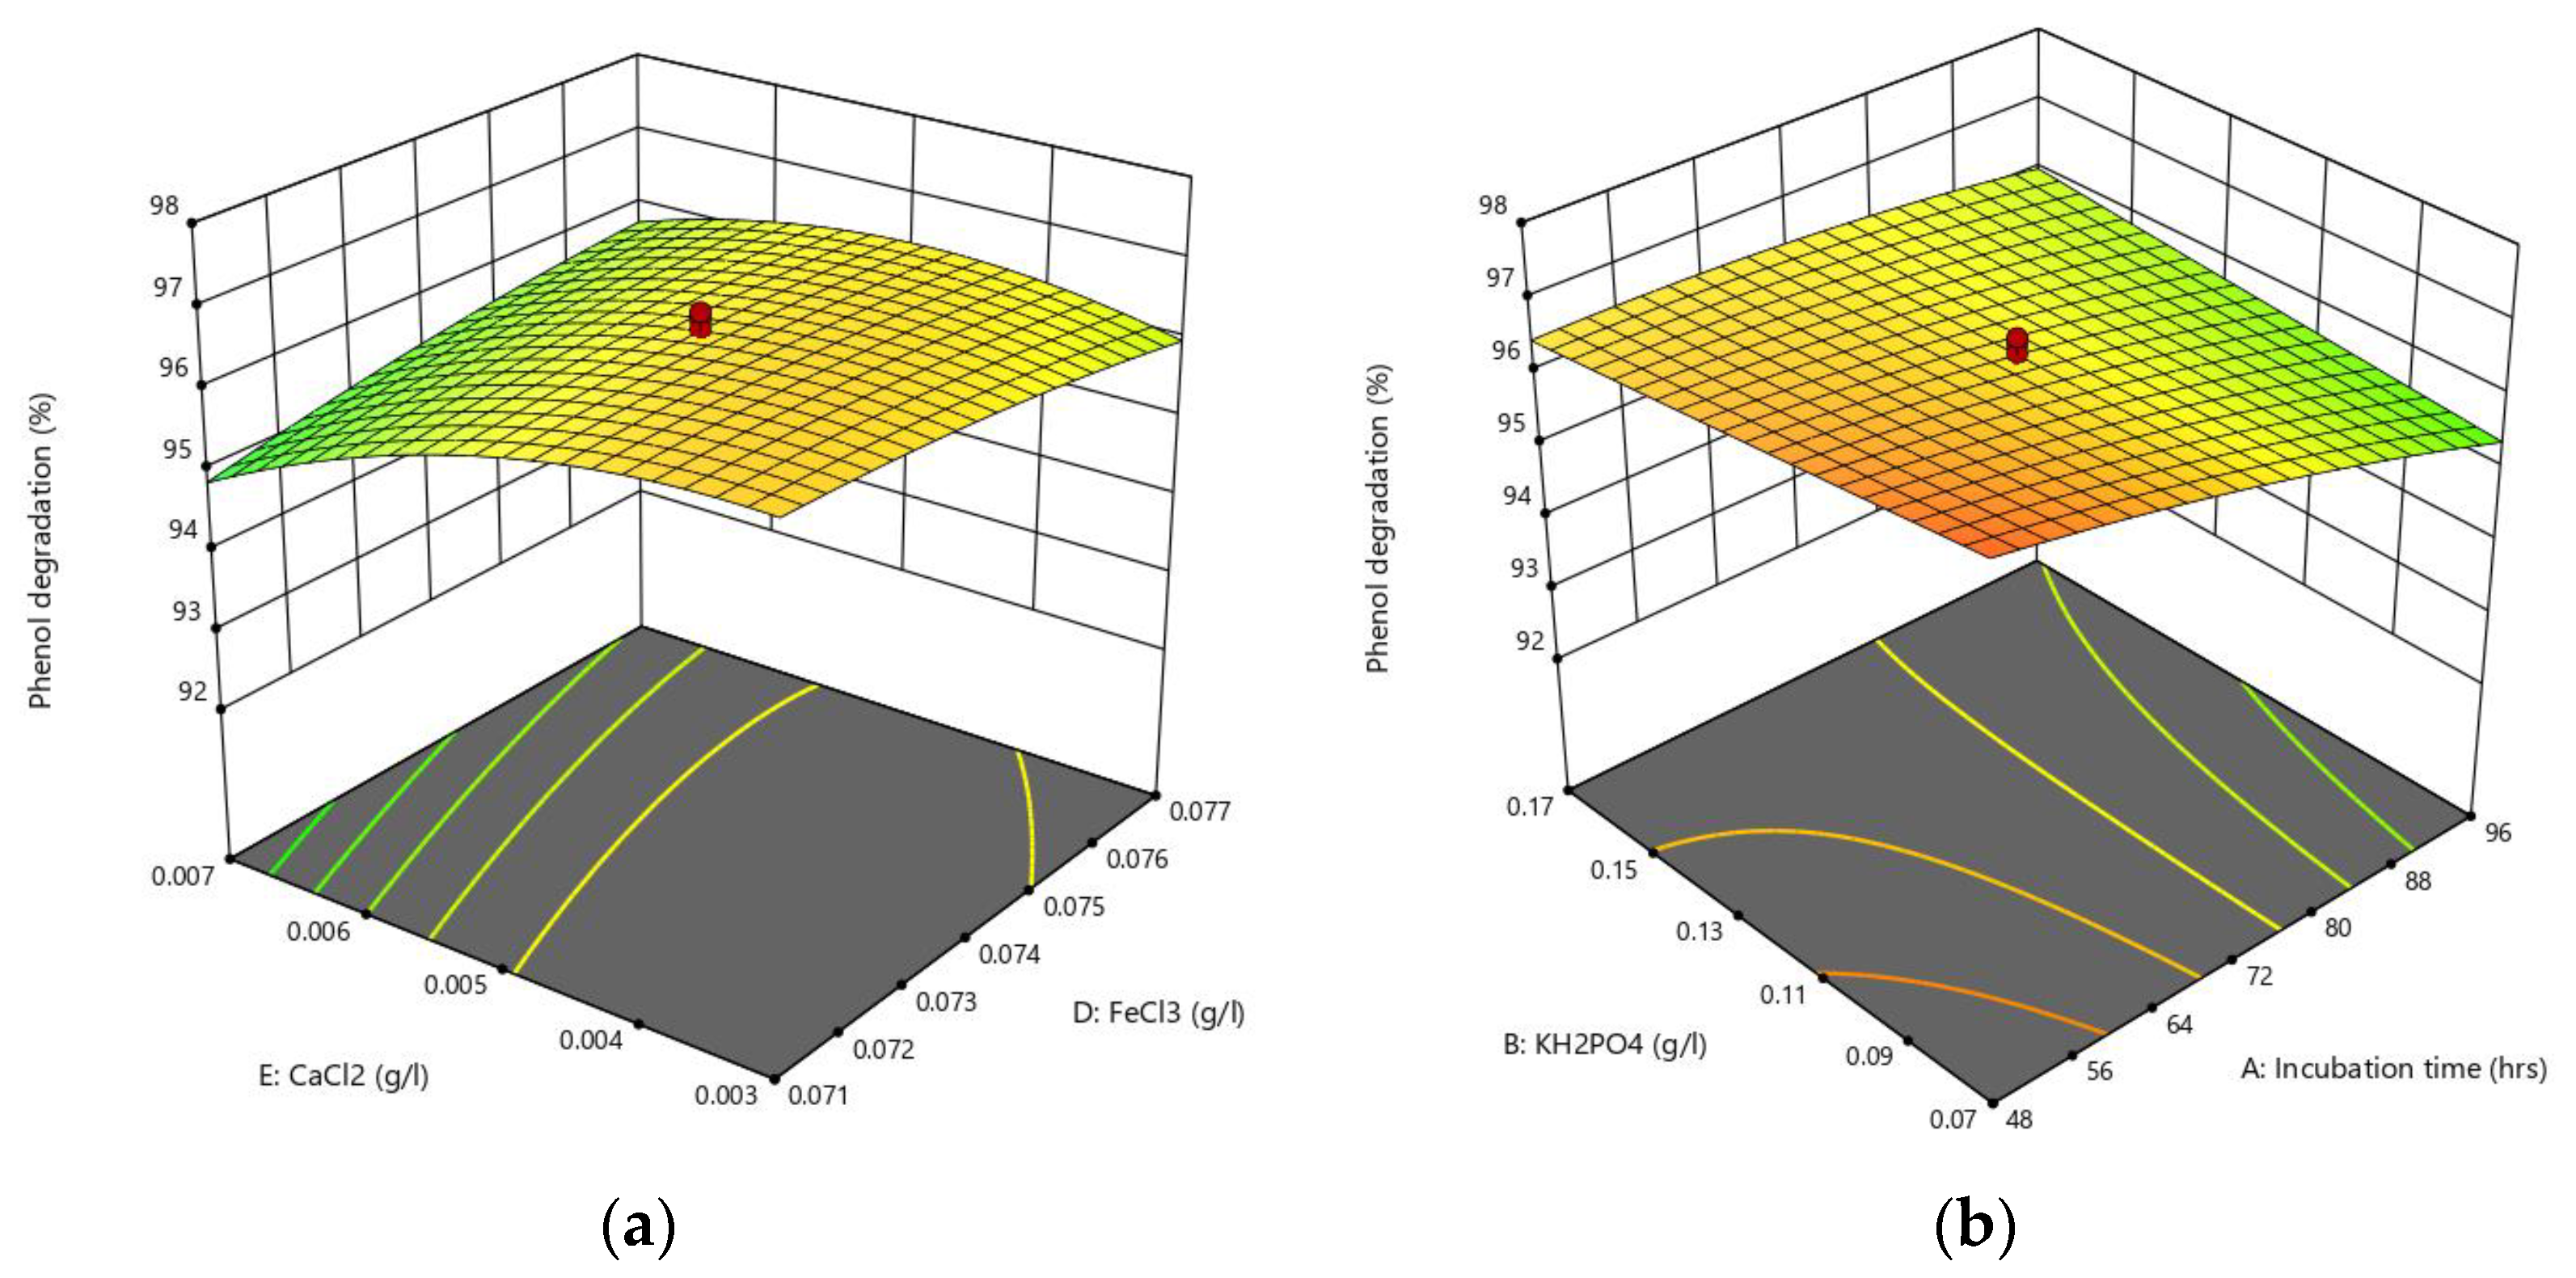
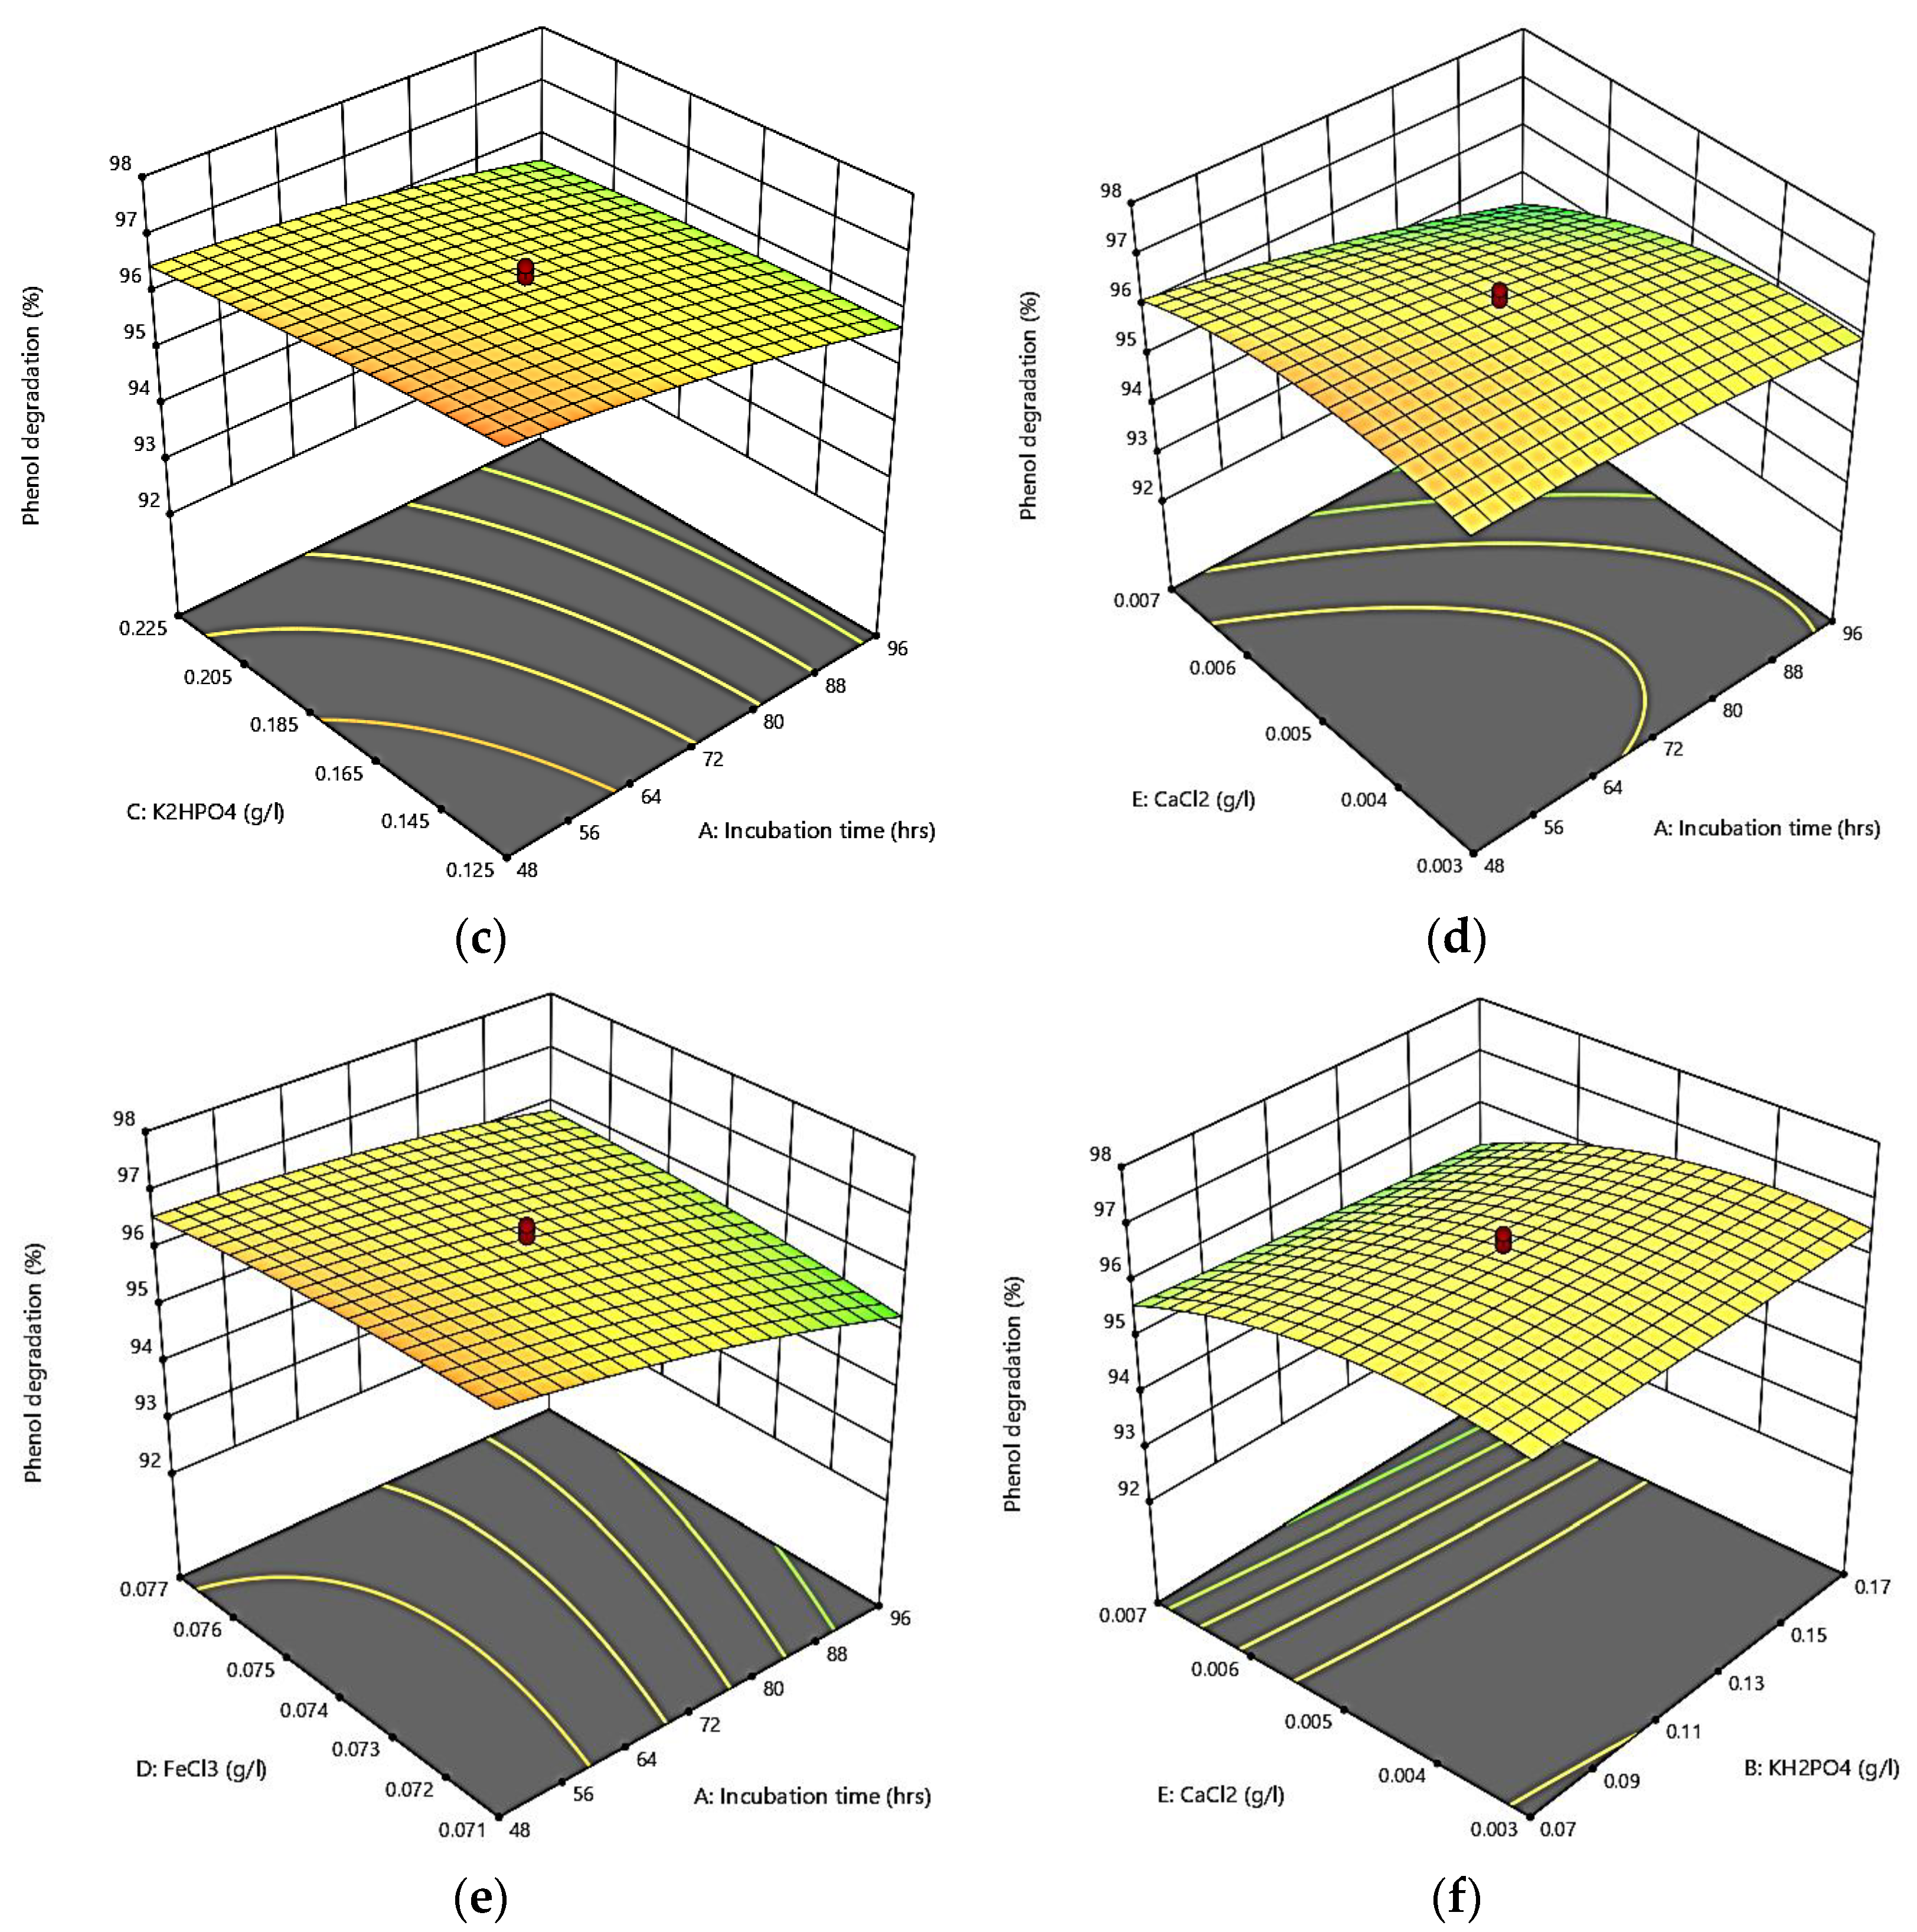
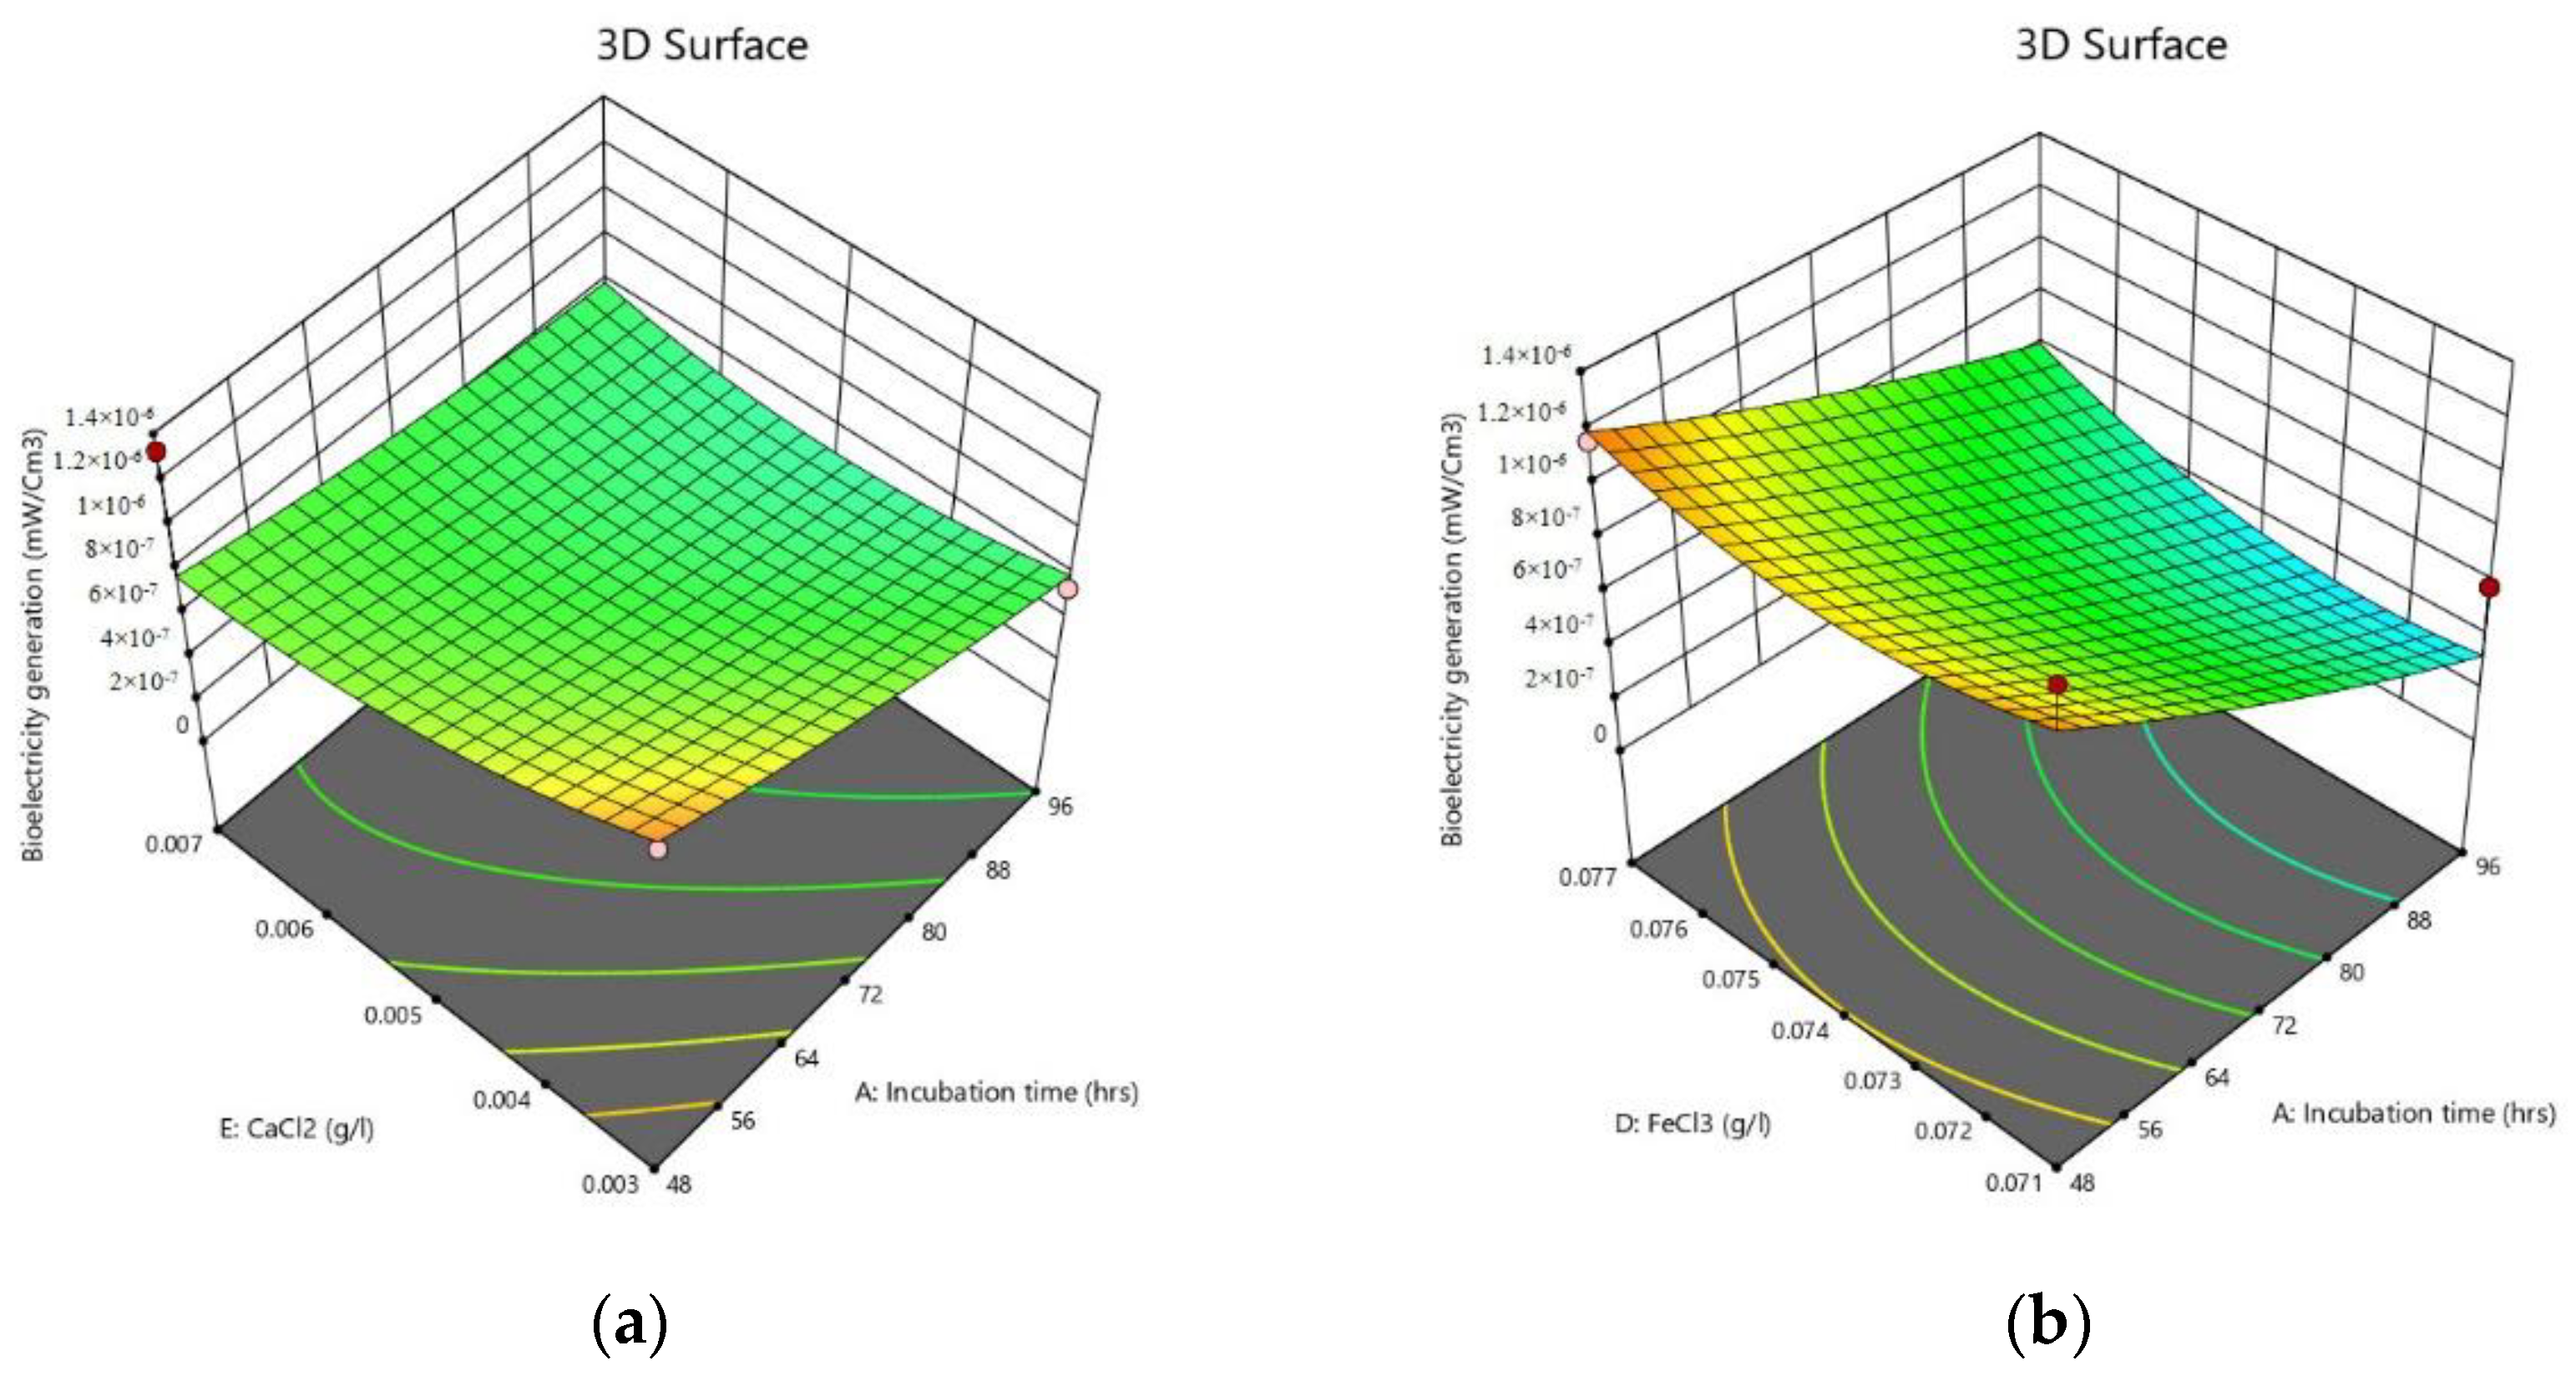
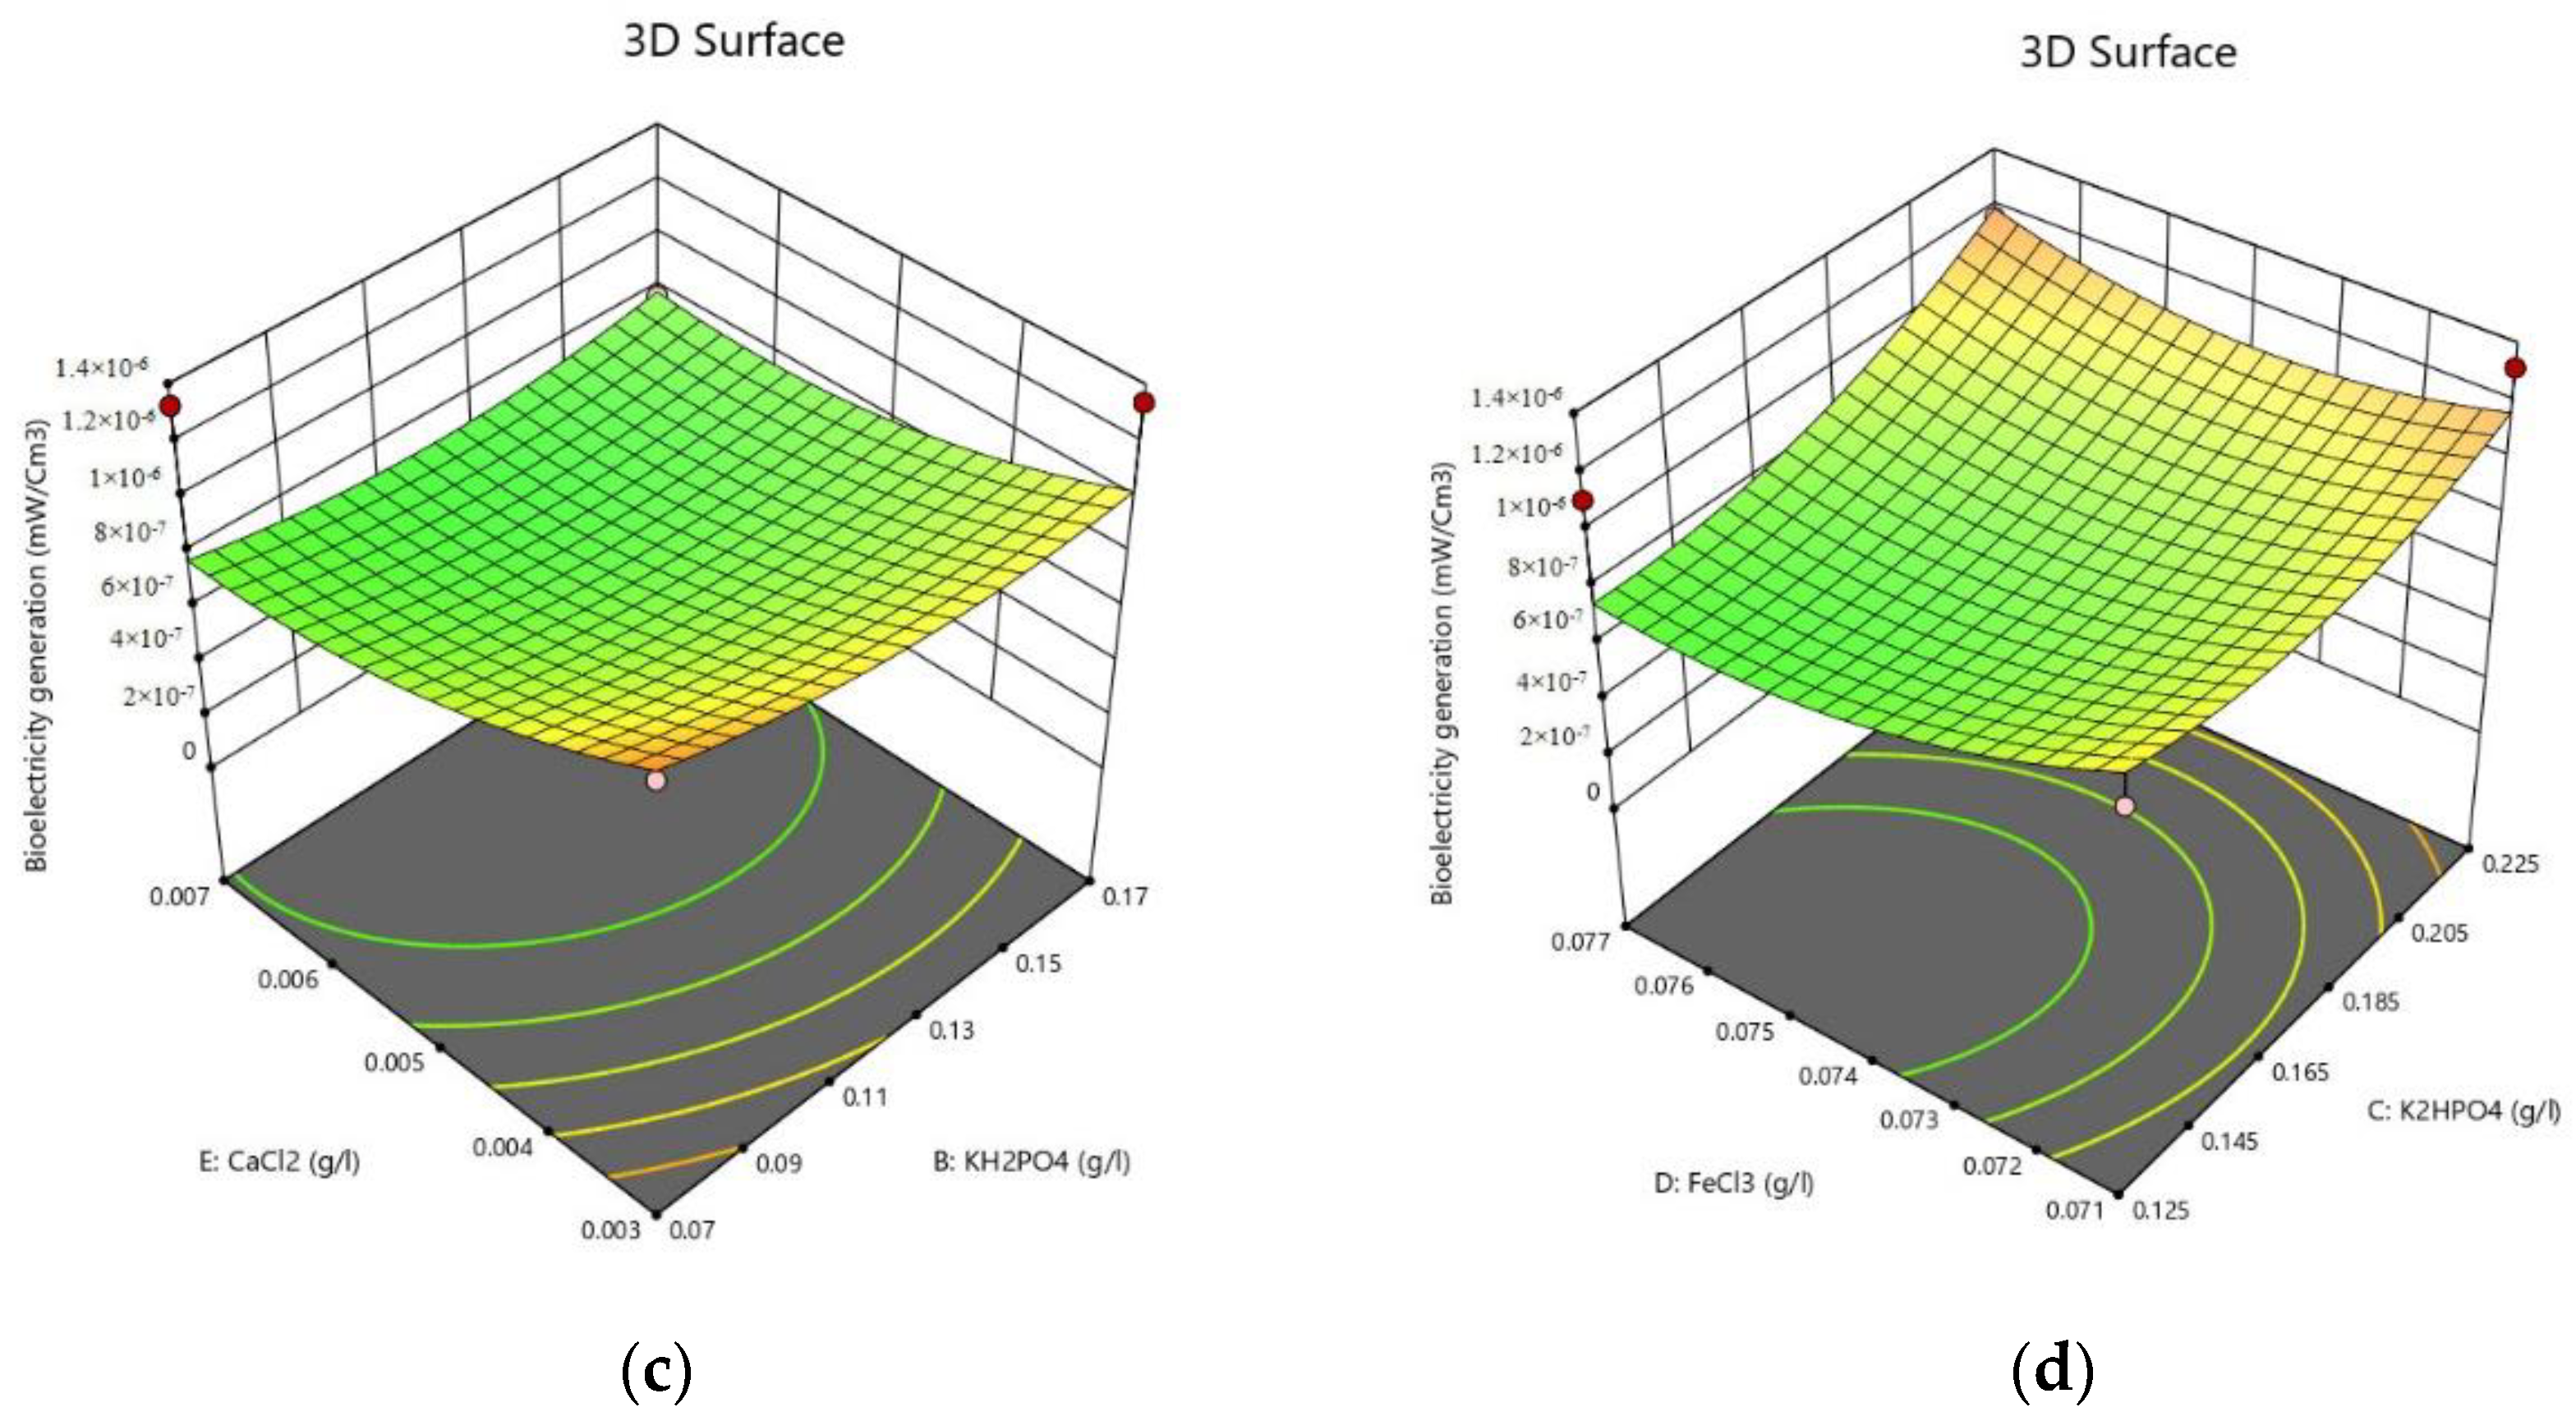
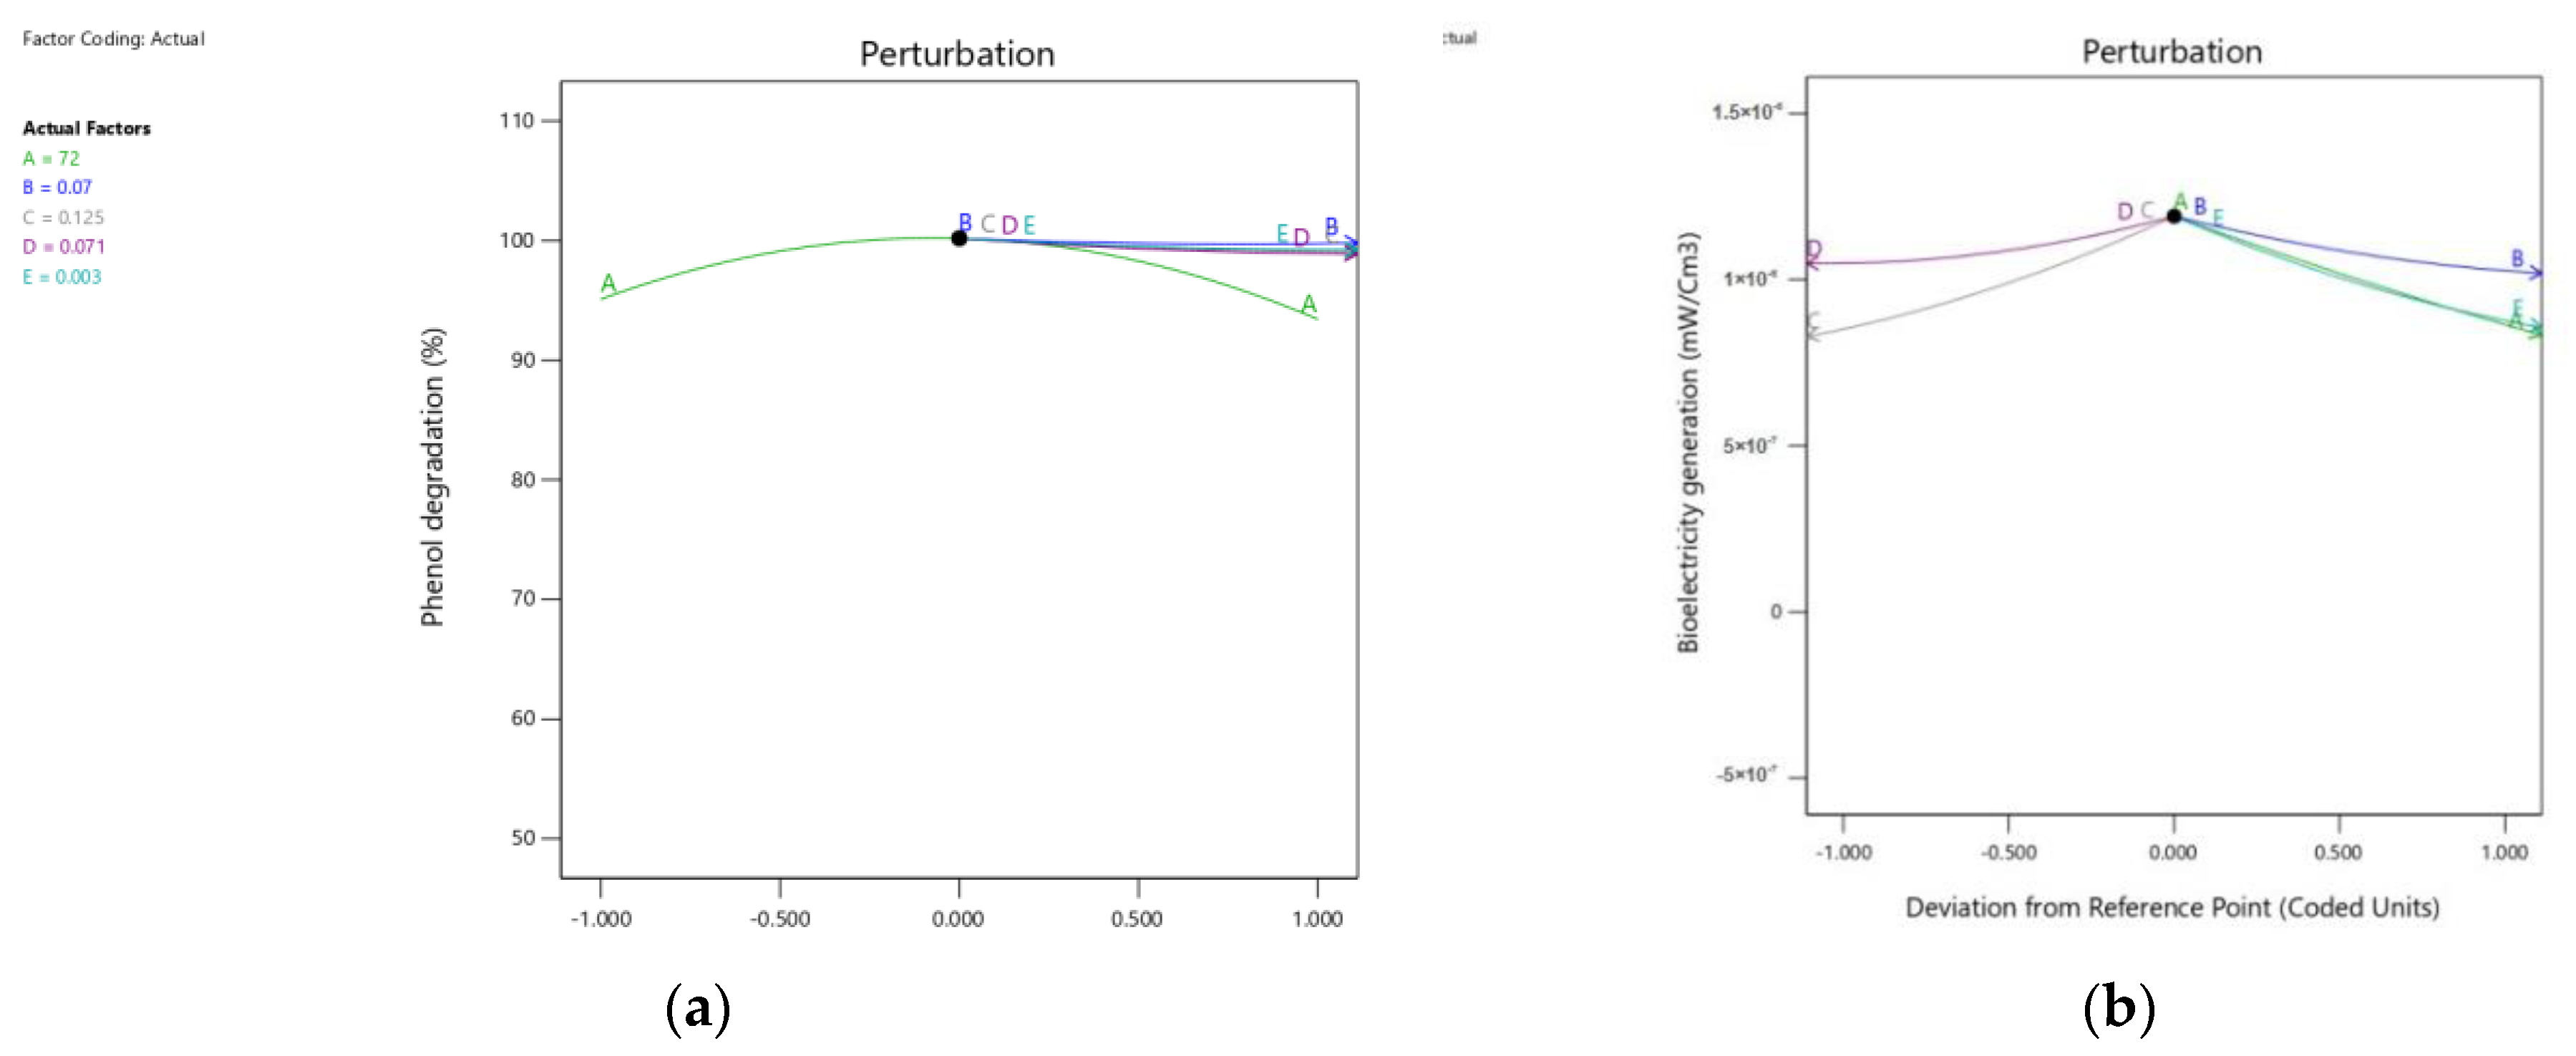
3.5.2. Central Composite Design (CCD)

Phenol degradation and bioelectricity generation (Table 7) as responses for variations in parameters, namely, incubation time (x1), KH2PO4 (x2), K2HPO4 (x3), FeCl3 (x4), and CaCl2 (x5), were obtained using Design Expert 12.0®. The results of the second-order response surface model fitting in the form of an analysis of variance (ANOVA) were calculated (Table 8). The significance of each coefficient in Equations (10) and (11) for the phenol degradation and bioelectricity generation, respectively, was determined using Fisher’s F-test and p-values. The linear effects of incubation time and CaCl2, as well as the quadratic effect of CaCl2, on the phenol biodegradation were significant. Moreover, the interaction effects of “incubation time and KH2PO4” and “FeCl3 and CaCl2” were found to be significant (p ≤ 0.05). On the other hand, for the bioelectricity generation, the linear and quadratic effects of incubation time were significant, as well as the quadratic effects of KH2PO4, K2HPO4, FeCl3, and CaCl2. The interaction effect of incubation time and CaCl2 was significant (p ≤ 0.05). The remaining interaction terms were insignificant (p > 0.05).
y = 96.42 0.5627 x 1 0.0368 x 2 0.1872 x 3 + 0.0719 x 4 0.4817 x 5 0.1435 x 1 2 + 0.0067 x 2 2 0.0604 x 3 2 0.1154 x 4 2 0.4991 x 5 2 + 0.3450 x 1 x 2 + 0.0994 x 1 x 3 + 0.2150 x 1 x 4 0.2969 x 1 x 5 0.1144 x 2 x 3 + 0.1138 x 2 x 4 0.1419 x 2 x 5 + 0.0606 x 3 x 4 + 0.0800 x 3 x 5 + 0.3681 x 4 x 5
y = 1.979   ×   10 7 2.455   ×   10 7   x 1 7.741   ×   10 9 x 2 + 1.918   ×   10 8 x 3 4.380   ×   10 8 x 4 + 1.113   ×   10 8 x 5 + 3.655   ×   10 8 x 1 2 + 8.537   ×   10 8 x 2 2 + 1.222   ×   10 7 x 3 2 + 1.279   ×   10 7 x 4 2 + 1.114   ×   10 7 x 5 2   2.415   ×   10 8 x 1 x 2 3.094   ×   10 8 x 1 x 3 + 6.272   ×   10 8 x 1 x 4 + 1.002   ×   10 7 x 1 x 5 3.942   ×   10 8 x 2 x 3 1.433   ×   10 8 x 2 x 4 + 4.121   ×   10 8 x 2 x 5 + 8.103   ×   10 8 x 3 x 4 4.719   ×   10 8 x 3 x 5 2.513   ×   10 8 x 4 x 5
The 3D curve interpretation revealed that the absorbance value of the phenol degradation increased by increasing KH2PO4 to 0.17 g/L. On the other hand, by decreasing the incubation time, K2HPO4, FeCl3, and CaCl2 to 72 h, 0.125, 0.071, and 0.003 g/L, respectively, the percentage of phenol degradation increased (Figure 8). However, the power of the generated bioelectricity increased by increasing K2HPO4 and FeCl3 to 0.225 and 0.077 g/L, respectively. On the other hand, decreasing the incubation time, KH2PO4, and CaCl2 to 48 h, 0.07, and 0.003 g/L, respectively, increased the bioelectricity generation (Figure 9).
By applying the perturbation curve (Figure 10), the optimal values of the tested parameters for maximum phenol degradation could be determined. The predicted degradation percentage value for the optimized parameters was 100%, and by applying these optimal parameter values, the actual phenol degradation reached 99.63% in 72 h. The present findings showed more efficient phenol degradation than that reported by Pathak et al. [21], who reached 89.77% phenol degradation using a bacterial consortium of Alcaligenes faecalis JF339228 and Klebsiella oxytoca KF303807 immobilized on carbon alginate beads in a fixed bio-column reactor. Moreover, the results of the present investigation showed higher phenol degradation than that reported by Samimi et al. [22], who reported 97% phenol degradation using bacterial isolate O-CH1. Furthermore, the presented findings showed faster phenol degradation than that reported by Poi et al. [9], who were able to degrade phenol by 99.6% in 27 days using a bacterial consortium comprising 20 bacterial strains (12 isolates belonged to the genera Bacillus, five strains belonged to the genera Pseudomonas, and three to Acinetobacter) isolated from phenol- and petroleum-hydrocarbon-contaminated wastewater.
The predicted yield value was close to the obtained actual response value, which demonstrated the model’s validity. Therefore, throughout this study, values from the statistical optimization model were applied (72 h incubation time and 0.07, 0.125, 0.07, and 0.003 g/L KH2PO4, K2HPO4, FeCl3, and CaCl2, respectively) as optimal parameters values for a maximum phenol degradation of 99.63% using consortium B.
On the other hand, the maximum bioelectricity generated using consortium B was estimated by applying the perturbation curve (Figure 10). The predicted power generation of the optimized parameters was 1.2 × 10⁻⁶ mW/Cm3, and by applying these optimal values, the actual generated power reached 3.13 × 10⁻⁶ mW/cm3.
The predicted power generation value was close to the obtained actual response value, which demonstrated the model’s validity. Therefore, throughout this study, values from the statistical optimization model were applied (48 h incubation time and 0.07, 0.225, 0.077, and 0.003 g/L KH2PO4, K2HPO4, FeCl3, and CaCl2, respectively) as optimal parameters values for maximum bioelectricity generation using consortium B.

High-Performance Liquid Chromatography (HPLC)

The estimation of the phenol degradation (after the fermentation process in which the phenol biodegradation took place) was evaluated using HPLC (Agilent 1100 system). The control sample (Figure S1a) showed a phenol peak at a retention time 3.14 min and another peak at 4.2 min which represented the culture medium. After treatment with bacterial consortium B, a tremendous decrease in phenol concentration was observed at a retention time of 3 min (Figure S1b). Moreover, by calculating the area under the peaks it was revealed that the optimized consortium B was highly efficient, with 99.8% phenol biodegradation, which confirmed the optimization findings where phenol degradation reached 99.6%.

3.6. Detection of Phenol Degradation Metabolites

A cell-free extract of the medium after fermentation with consortium B was subjected to GC-MS analysis. The MS spectrum after the biological treatment with bacterial consortium B indicated that the major components were trans-cyclopropaneoctanoic-2-[(2-pentylcyclopropyl)-methyl-ester and diethyl phthalate (Figure 11a–c). According to WHO, the present phenol degradation products are non-toxic and safe for environmental and pharmacological use.

4. Conclusions

Data from the present study concluded that the phenol biodegradation was better achieved using consortia rather than individual isolates. Phenol degradation reached 99.8% after the optimization process using a CCD to obtain demi-water. The optimal conditions that led to the maximum phenol degradation using a consortium composed of all 15 isolated bacterial strains were as follows: 72 h incubation time and 0.07, 0.125, 0.07, and 0.003 g/L of KH2PO4, K2HPO4, FeCl3, and CaCl2, respectively. Overall, the present study revealed that the native phenol-degrading consortia can be considered an economical and sustainable approach to the degradation of phenol within industrial wastewater to produce demi-water.

Supplementary Materials

The following are available online at https://www.mdpi.com/article/10.3390/su141912912/s1, Figure S1: Phenol detection and estimation using HPLC; medium before fermentation (a), after fermentation with bacterial consortium B (b).

Author Contributions

Conceptualization, B.H.E., Z.A.O., E.E.D.A.M. and Y.M.Y.; methodology, S.S., N.N.H., M.H.E., S.M.O., N.N.H., M.H.E. and S.M.O.; software, S.S.; validation, S.S., N.N.H., M.H.E., S.M.O. and B.H.E.; formal analysis, D.A.G., S.M.A. and N.B.E.D.G.; investigation, S.S., N.N.H., M.H.E., S.M.O. and B.H.E.; resources, Z.A.O.; data curation, S.S., N.N.H., M.H.E. and S.M.O.; writing—original draft preparation, S.S., B.H.E., Y.M.Y., E.E.D.A.M. and Z.A.O.; writing—review and editing, B.H.E.; visualization, S.S., N.N.H., M.H.E. and S.M.O.; supervision, D.A.G., S.M.A., N.B.E.D.G. and Z.A.O.; project administration, Y.M.Y., E.E.D.A.M. and Z.A.O.; funding acquisition, Y.M.Y., E.E.D.A.M. and Z.A.O. All authors have read and agreed to the published version of the manuscript.

Funding

The research described in the present paper was part of a project entitled “Microbial degradation of phenol containing petroleum effluents and its application in electricity generation”, which was financially supported by the Science, Technology, and Innovation Funding Authority (STIFA) (grant ID: 41612).

Institutional Review Board Statement

Not applicable.

Informed Consent Statement

Not applicable.

Data Availability Statement

Not applicable.

Conflicts of Interest

The authors declare no conflict of interest. The funder agreed for the study to be submitted for publication.

References

  1. Deng, Z.H.; Li, N.; Jiang, H.L.; Lin, J.M.; Zhao, R.S. Pretreatment techniques and analytical methods for phenolic endocrine disrupting chemicals in food and environmental samples. TrAC Trends Anal. Chem. 2019, 119, 115592. [Google Scholar] [CrossRef]
  2. Liu, H.; Chen, L.; Wang, E.T.; Liu, Y.; Zhang, L.; Zhao, K.; Gu, Y.; Yu, X.; Ma, M.; Penttinen, P.; et al. Combined microbial consortium inoculation and black locust planting is effective in the bioremediation of waste drill cuttings. Front. Microbiol. 2020, 11, 536787. [Google Scholar] [CrossRef] [PubMed]
  3. Navarrete, C.; Jacobsen, I.H.; Martínez, J.L.; Procentese, A. Cell factories for industrial production processes: Current issues and emerging solutions. Processes 2020, 8, 768. [Google Scholar] [CrossRef]
  4. Karaś, M.A.; Wdowiak-Wróbel, S.; Sokołowski, W. Selection of Endophytic Strains for Enhanced Bacteria-Assisted Phytoremediation of Organic Pollutants Posing a Public Health Hazard. Int. J. Mol. Sci. 2021, 22, 9557. [Google Scholar] [CrossRef]
  5. Savla, N.; Pandit, S.; Mathuriya, A.S.; Gupta, P.K.; Khanna, N.; Babu, R.P.; Kumar, S. Recent advances in bioelectricity generation through the simultaneous valorization of lignocellulosic biomass and wastewater treatment in microbial fuel cell. Sustain. Energy Technol. Assess. 2021, 48, 101572. [Google Scholar]
  6. Soria, R.B.; Chinchin, B.D.; Arboleda, D.; Zhao, Y.; Bonilla, P.; Van der Bruggen, B.; Luis, P. Effect of the bio-inspired modification of low-cost membranes with TiO2: ZnO as microbial fuel cell membranes. Chemosphere 2021, 291, 132840. [Google Scholar] [CrossRef] [PubMed]
  7. Usman, Z.M.; Said, M.A.; Shehu, F.A.; Abdussalam, K.; Abdulrazak, T.M.; Abdullahi, N. Isolation and Identification of Phenol-Degrading Bacteria from Oil-Contaminated Sites. Niger. J. Biotechnol. 2021, 38, 160–165. [Google Scholar] [CrossRef]
  8. Rea, V.S.G.; Egerland-Bueno, B.; Cerqueda-García, D.; Sierra, J.D.M.; Spanjers, H.; van Lier, J.B. Degradation of p-cresol, resorcinol, and phenol in anaerobic membrane bioreactors under saline conditions. Chem. Eng. J. 2021, 430, 132672. [Google Scholar]
  9. Poi, G.; Aburto-Medina, A.; Mok, P.C.; Ball, A.S.; Shahsavari, E. Bioremediation of phenol-contaminated industrial wastewater using a bacterial consortium—From laboratory to field. Water Air Soil Pollut. 2017, 228, 89. [Google Scholar] [CrossRef]
  10. Hassen, W.; Neifar, M.; Cherif, H.; Mahjoubi, M.; Souissi, Y.; Raddadi, N.; Cherif, A. Assessment of genetic diversity and bioremediation potential of pseudomonads isolated from pesticidecontaminated artichoke farm soils. 3 Biotech 2018, 8, 263. [Google Scholar] [CrossRef]
  11. Boudraa, H.; Kadri, N.; Mouni, L.; Madani, K. Microwave-assisted hydrodistillation of essential oil from fennel seeds: Optimization using Plackett–Burman design and response surface methodology. J. Appl. Res. Med. Aromat. Plants 2021, 23, 100307. [Google Scholar] [CrossRef]
  12. Du, Y.; Huang, P.; Jin, W.; Li, C.; Yang, J.; Wan, H.; He, Y. Optimization of Extraction or Purification Process of Multiple Components from Natural Products: Entropy Weight Method Combined with Plackett–Burman Design and Central Composite Design. Molecules 2021, 26, 5572. [Google Scholar] [CrossRef] [PubMed]
  13. Wu, B.; Deng, J.; Niu, H.; Liang, J.; Arslan, M.; Gamal El-Din, M.; Wang, Q.; Guo, S.; Chen, C. Establishing and Optimizing a Bacterial Consortia for Effective Biodegradation of Petroleum Contaminants: Advancing Classical Microbiology via Experimental and Mathematical Approach. Water 2021, 13, 3311. [Google Scholar] [CrossRef]
  14. Suleria, H.A.; Barrow, C.J.; Dunshea, F.R. Screening and characterization of phenolic compounds and their antioxidant capacity in different fruit peels. Foods 2020, 9, 1206. [Google Scholar] [CrossRef] [PubMed]
  15. Bai, X.; Nie, M.; Diwu, Z.; Wang, L.; Nie, H.; Wang, Y.; Yin, Q.; Zhang, B. Simultaneous biodegradation of phenolics and petroleum hydrocarbons from semi-coking wastewater: Construction of bacterial consortium and their metabolic division of labor. Bioresour. Technol. 2022, 347, 126377. [Google Scholar] [CrossRef]
  16. Filipowicz, N.; Momotko, M.; Boczkaj, G.; Cieśliński, H. Determination of phenol biodegradation pathways in three psychrotolerant yeasts, Candida subhashii A011, Candida oregonensis B021 and Schizoblastosporion starkeyi-henricii L012, isolated from Rucianka peatland. Enzym. Microb. Technol. 2020, 141, 109663. [Google Scholar] [CrossRef]
  17. Shong, J.; Diaz, M.R.J.; Collins, C.H. Towards synthetic microbial consortia for bioprocessing. Curr. Opin. Biotechnol. 2012, 23, 798–802. [Google Scholar] [CrossRef]
  18. Ammeri, R.W.; Di Rauso Simeone, G.; Hassen, W.; Ibrahim, C.; Ammar, R.B.; Hassen, A. Bacterial consortium biotransformation of pentachlorophenol contaminated wastewater. Arch. Microbiol. 2021, 203, 6231–6243. [Google Scholar] [CrossRef]
  19. Naik, S.; Eswari, J.S. Experimental and validation with neural network time series model of microbial fuel cell bio-sensor for phenol detection. J. Environ. Manag. 2021, 290, 112594. [Google Scholar] [CrossRef]
  20. Al-Shaikh, A.J.; Jamal, M.T. Bioaugmentation of halophilic consortia for the degradation of petroleum hydrocarbons and petroleum wastewater treatment. Int. J. Adv. Res. Biol. Sci. 2020, 7, 97–112. [Google Scholar]
  21. Pathak, U.; Banerjee, A.; Roy, T.; Das, S.K.; Das, P.; Kumar, T.; Mandal, T. Evaluation of mass transfer effect and response surface optimization for abatement of phenol and cyanide using immobilized carbon alginate beads in a fixed bio-column reactor. Asia-Pac. J. Chem. Eng. 2020, 15, e2405. [Google Scholar] [CrossRef]
  22. Samimi, M.; Shahriari Moghadam, M. Phenol biodegradation by bacterial strain O-CH1 isolated from seashore. Glob. J. Environ. Sci. Manag. 2020, 6, 109–118. [Google Scholar]
Figure 1. Batch microbial fuel cell configuration.
Sustainability 14 12912 g001
Figure 2. Bacterial phenol degradation as affected by incubation time.
Sustainability 14 12912 g002
Figure 3. Phenol degradation using bacterial consortia for different time intervals.
Sustainability 14 12912 g003
Figure 4. Bioelectricity generation using bacterial isolates and their consortia over different time intervals.
Sustainability 14 12912 g004
Figure 5. Phylogenetic tree for the DNA isolates based on the sequencing results.
Sustainability 14 12912 g005
Figure 6. Pareto chart showing the contribution percentage and the effects of all parameters on the phenol degradation percentage using consortium B.
Sustainability 14 12912 g006
Figure 7. Pareto chart showing the contribution percentage and the effects of all parameters on the bioelectricity generation using consortium B.
Sustainability 14 12912 g007
Figure 8. Three-dimensional surface plots for the effects of the tested parameter interactions that led to the maximum phenol degradation (R1): CaCl2 and FeCl3 (a), incubation time and KH2PO4 (b), incubation time and K2HPO4 (c), incubation time and CaCl2 (d), incubation time and FeCl3 (e), and KH2PO4 and CaCl2 (f).
Sustainability 14 12912 g008aSustainability 14 12912 g008b
Figure 9. Three-dimensional plots for the effects of the investigated parameter interactions that led to the maximum bioelectricity generation (R2): incubation time and CaCl2 (a), incubation time and FeCl3 (b), KH2PO4 and CaCl2 (c), and K2HPO4 and FeCl3 (d).
Sustainability 14 12912 g009aSustainability 14 12912 g009b
Figure 10. Perturbation curve showing the exact optimal values of the tested parameters and predicted phenol degradation (a) and bioelectricity generation (b).
Sustainability 14 12912 g010
Figure 11. (a) GC spectrum of the cell-free extract after bacterial phenol degradation. (b) MS fragmentation spectrum of trans-cyclopropaneoctanoic-2-[(2-pentylcyclopropyl)-methyl-ester. (c) MS fragmentation spectrum of diethyl phthalate.
Sustainability 14 12912 g011aSustainability 14 12912 g011b
Table 1. Parameters under investigation using a PBD.
No.FactorUnitLevels
−101
1Bacterial Inoculum Size%135
2Culture volumemL75100125
3Phenol concentrationppm61320
4pH-6.57.58.5
5Incubation timeday3711
6KH2PO4mg/L120.0420.0720.0
7K2HPO4mg/L175.0375.0675.0
8(NH4)2SO4mg/L144.0244.0344.0
9NaClmg/L5.015.035.0
10FeCl3.6H2Omg/L34.054.074.0
11MgSO4.7H2Omg/L30.050.070.0
12CaCl2.2H2Omg/L5.015.035.0
Table 2. Parameters under investigation using a CCD.
ParameterUnitLevels
−2−10+1+2
Incubation Timeh14.918148.072.096.0129.082
KH2PO4mg/L1.0770.0120.0170.0238.9
K2HPO4mg/L56.01125.0175.0225.0293.9
FeCl3mg/L66.8671.074.077.081.1
CaCl2mg/L0.243.05.07.09.7
Table 3. Bacterial identification data.
IsolatesIdentificationIdentified Accession Number
1Pseudomonas aeruginosaMW598285
2Klebsiella pneumoniaeMW585395
3Bacillus cereusMW585396
4Pseudomonas monteiliiMW585595
5Bacillus subtilisMW585596
6Pseudomonas mosseliiMW585691
7Staphylococcus equorumMW585694
8Bacillus benzoevoransMW597321
9Bacillus circulansMW597408
10Pseudomonas fulvaMW598162
11Pseudomonas aeruginosaMW598228
12Pseudomonas putidaMW598278
13Burkholderia cepaciaMW579472
14Bacillus cereusMW598367
15Klebsiella pneumoniaeMW598404
Table 4. Phenol degradation and bioelectricity generation with bacterial consortium B using a PBD.
RunInoculum SizeCulture VolumePhenol Conc.pHIncubation PeriodKH2PO4K2HPO4(NH4)2SO4NaClFeCl3MgSo4CaCl2R1
(% Phenol Degradation)
Phenol Removal Amount Per OD600 (mg/OD600)R2
(Bioelectricity Generation)
1−1−111−11−11−11−1188.1111.09.69 × 10−7
2−1−1−111−11−1−1−11160.027.54.00 × 10−8
31−11−111−1−11−1−1148.696.09.71 × 10−8
411111111111136.274.51.23 × 10−7
51−1−1−1−111−1−11−1−179.409.98.56 × 10−7
611111−11−1−11−1−136.354.52.02 × 10−7
7−111−1−1−1111−1−1−189.3111.18.40 × 10−7
8−1−1−1111111−1−1−171.368.91.43 × 10−7
91−1−1−1−1−111111181.9110.21.03 × 10−6
10−1−111−1−1−1−1111−190.3811.21.40 × 10−6
1111−11−1−1−1−11−1−1188.1011.01.31 × 10−6
12−11−1−11−1−11−11−1150.006.21.85 × 10−7
13−111−1−111−1−1−11188.8011.11.11 × 10−6
14−11−1−111−1−1111−174.799.32.05 × 10−7
1511−11−11−11−1−11−181.3810.19.49 × 10−7
161−11−11−1−11−1−11−188.3611.04.10 × 10−7
1700000000000085.9910.74.21 × 10−7
Table 5. Analysis of variance (ANOVA) using a PBD for the phenol degradation percentage using consortium B.
TermEffectCoefficientSE Coefficientt-Valuep-Value
Constant 0.72760.0345321.070.000
Bacterial inoculum size−0.0904−0.04520.03557−1.270.273
Culture volume−0.0790−0.03950.03557−1.110.329
Phenol concentration−0.0259−0.01290.03557−0.360.735
pH−0.0616−0.03080.03557−0.870.435
Incubation time−0.2769−0.13850.03557−3.890.018
KH2PO4−0.0195−0.00980.03557−0.270.797
K2HPO4−0.0857−0.04290.03553−1.210.294
(NH4)2SO40.02520.01260.035570.350.741
NaCl0.00590.00300.035460.080.937
FeCl3.6H2O−0.0985−0.04930.03557−1.380.238
MgSO4.7H2O0.06320.03160.035570.890.424
CaCl2.2H2O−0.0913−0.04570.03546−1.290.267
Table 6. Analysis of variance (ANOVA) using a PBD for bioelectricity generation using consortium B.
TermEffectCoefficientSE Coefficientt-Valuep-Value
Constant 0.0000010.00000011.550.000
Bacterial inoculum size0.0000000.0000000.0000000.100.927
Culture volume−0.000000−0.0000000.000000−0.030.979
Phenol concentration0.0000000.0000000.0000000.500.641
pH0.0000000.0000000.0000000.470.660
Incubation time−0.000000−0.0000000.000000−8.180.001
KH2PO4−0.000000−0.0000000.000000−1.120.324
K2HPO4−0.000000−0.0000000.000000−1.330.253
(NH4)2SO4−0.000000−0.0000000.000000−0.660.543
NaCl0.0000000.0000000.0000000.580.596
FeCl3.6H2O0.0000000.0000000.0000000.090.936
MgSO4.7H2O0.0000000.0000000.0000000.770.484
CaCl2.2H2O−0.000000−0.0000000.000000−0.100.926
Table 7. Phenol degradation and bioelectricity generation using consortium B (15 strain) after optimizing the affecting parameters using a central composite design.
Runx1
Incubation Time
x2
KH2PO4
x3
K2HPO4
x4
FeCl3
x5
CaCl2
R1
(Phenol Degradation
%)
Phenol Removal Amount per OD600 (mg/OD600)R2
(Bioelectricity Generation
(mW/Cm3))
1−1−1+1−1+196.8312.16.91 × 10−7
2+1+1+1−1−195.2411.94.14 × 10−8
3−1+1+1+1+196.3912.07.77 × 10−7
4−1+1−1+1−195.2011.98.03 × 10−7
50000095.3211.91.77 × 10−7
60+200096.7112.03.50 × 10−7
7+1−1−1−1−195.2011.91.69 × 10−7
8−1+1−1+1+197.1012.18.80 × 10−7
90000−294.4511.84.14 × 10−7
100000095.4411.91.11 × 10−7
11+1−1+1−1+195.811.92.33 × 10−7
1200+20093.3111.66.26 × 10−7
13+2000054.476.87.29 × 10−9
140−200092.7511.57.54 × 10−7
150000095.0511.81.73 × 10−7
16+1+1−1−1−196.9112.12.89 × 10−7
17000+2094.5711.84.03 × 10−7
18+1+1−1+1−19712.13.07 × 10−7
1900−20096.3912.08.96 × 10−7
20−2000059.297.42.29 × 10−8
21+1−1−1+1−195.0511.83.71 × 10−7
220000095.5511.91.79 × 10−7
23+1−1+1+1+194.4911.84.76 × 10−7
24+1−1−1+1+195.411.95.24 × 10−7
25+1+1−1+1+194.6111.85.44 × 10−7
260000+295.3611.99.73 × 10−7
270000095.1911.81.00 × 10−7
28+1+1+1−1+193.7811.75.20 × 10−7
29−1+1+1−1+19612.09.53 × 10−7
30+1−1+1+1−195.6411.95.49 × 10−7
31−1−1−1+1+196.9112.12.34 × 10−7
32−1−1−1−1−197.4212.19.41 × 10−7
33+1+1−1−1+195.811.95.54 × 10−7
34−1−1−1−1+196.9812.11.03 × 10−6
350000095.6311.91.09 × 10−7
36−1−1−1+1−197.0612.11.11 × 10−6
37−1−1+1+1−196.5912.01.16 × 10−6
38−1+1+1−1−195.7611.91.21 × 10−6
390000095.6511.91.12 × 10−7
40−1+1−1−1+195.611.91.24 × 10−6
41000−2096.4712.01.18 × 10−6
42+1+1+1+1−195.5611.95.74 × 10−7
43−1+1−1−1−197.6212.21.30 × 10−6
44−1−1+1−1−197.312.11.31 × 10−6
45+1−1−1−1+194.9311.85.97 × 10−7
46−1−1+1+1+196.3512.01.33 × 10−6
470000095.2611.91.20 × 10−7
48−1+1+1+1−196.3112.01.34 × 10−6
49+1+1+1+1+195.211.96.09 × 10−7
50+1−1+1−1−195.0111.85.94 × 10−7
Table 8. Analysis of variance (ANOVA) results of response surface quadratic model employed for the parameter optimization for the maximum phenol degradation (R1) and bioelectricity generation (R2).
TermCoefficientPhenol Degradation (R1)Bioelectricity Generation (R2)
Coefficient’s Estimated ValueF-Valuep-ValueCoefficient’s Estimated ValueF-Valuep-Value
M—Modelb096.423.990.00041.979 × 10−74.430.0002
x1—Incubation timeb1−0.562720.150.0001−2.455 × 10−740.68<0.0001
x2—KH2PO4b2−0.03680.08640.7709−7.741 × 10−90.04050.8420
x3—K2HPO4b3−0.18722.230.14601.918 × 10−80.24830.6221
x4—FeCl3b40.07190.32910.5706−4.380 × 10−81.300.2643
x5—CaCl2b5−0.481714.730.00061.113 × 10−80.08340.7748
x1x2b120.34505.600.0249−2.415 × 10−80.29090.5938
x1x3b130.09940.46440.5010−3.094 × 10−80.47730.4951
x1x4b140.21502.170.15116.272 × 10−81.960.1719
x1x5b15−0.29694.140.05101.002 × 10−75.010.0331
x2x3b23−0.11440.61520.4392−3.942 × 10−80.77490.3859
x2x4b240.11380.60850.4417−1.433 × 10−80.10240.7512
x2x5b25−0.14190.94660.33864.121 × 10−80.84670.3651
x3x4b340.06060.17280.68078.103 × 10−83.270.0808
x3x5b350.08000.30100.5875−4.719 × 10−81.110.3007
x4x5b450.36816.370.0173−2.513 × 10−80.31500.5789
x12b11−0.14351.680.20503.655 × 10−81.160.2909
x22b220.00670.00370.95218.537 × 10−86.320.0178
x32b33−0.06040.29800.58931.222 × 10−712.950.0012
x42b44−0.11541.100.30381.279 × 10−714.270.0007
x52b55−0.499119.940.00011.114 × 10−710.530.0030
Publisher’s Note: MDPI stays neutral with regard to jurisdictional claims in published maps and institutional affiliations.

