Article

Household Food Waste to Biogas in Västerås, Sweden: A Comprehensive Case Study of Waste Valorization

1
Institute of Circular Economy, Beijing University of Technology, Beijing 100124, China
2
Energy Research Institute, Chinese Academy of Macroeconomic Research, NDRC, Beijing 100038, China
3
Chinese Research Academy of Environmental Sciences, Beijing 100012, China
4
Biogas Institute of Ministry of Agriculture, Chengdu 610041, China
5
Department of Environmental Science and Engineering, Fudan University, Shanghai 200433, China
*
Author to whom correspondence should be addressed.
Sustainability 2022, 14(19), 11925; https://doi.org/10.3390/su141911925
Submission received: 21 August 2022 / Revised: 18 September 2022 / Accepted: 19 September 2022 / Published: 21 September 2022

Abstract

:
Sustainable large-scale household food waste (HFW) reutilization is difficult worldwide. This study presents a systematic and in-depth analysis of the case of Västerås, Sweden, where biogas has been produced from HFW for years and utilized as renewable vehicle fuel. Various aspects are covered, including the logistic flow, energy recovery, environmental benefits, cost-benefit analysis, and social survey. In 2017, 8879 tons of food waste were collected from Västerås city, which could generate 590,000 Nm3 biomethane and support 21 biogas-powered buses. A reduction of 1052.9–1541.2 tons of CO2-eq was estimated by replacing fossil fuels in vehicles and centralized composting units for HFW. The actual operating profit of this process amounted to 6.604 million Swedish Krona (SEK), and the maximized environmental economic benefit was estimated to be 3.15–3.73 million SEK/year. The active participation of the residents to source-separate their HFW was crucial to the success of the project, and the driving factors were tentatively identified as value orientation and facility convenience. With information pooled from various sectors, this study constructs a comprehensive reference case for industrial, academic, and municipal entities that are interested in similar practices in the future.

1. Introduction

With rapid global urbanization, municipal solid waste (MSW) is being generated in increasingly larger amounts. A significant part of MSW is food waste, which is of particular concern because of its putrefiable nature. In addition to causing public hygiene issues, the traditional ways of disposing of MSW, including food waste, is not conducive to environmental sustainability [1]. When buried in landfills, food waste decomposes to release methane, a potent greenhouse gas. Additionally, due to its high moisture content, incineration of food waste is often an endothermal process and requires the co-combustion of extra fuel. On the other hand, food waste has considerable potential for both energy and material reclamation. Food waste can be biologically converted to biogas. If collected properly, biogas can be combusted to generate heat and/or electricity, or alternatively upgraded into biomethane, to be injected into the city gas grid or utilized as renewable vehicle fuel [2]. Therefore, recycling food waste through proper procedures has the potential to both significantly reduce greenhouse gas (GHG) emissions and generate valuable products, thus contributing to global environmental and energy sustainability and helping to achieve carbon neutrality.
Despite the apparent advantages, successful recycling and utilization of food waste have not been widely achieved. Food waste can include organic waste originating from commercial food production, selling and serving processes, expired food, and food residue from households [1]. Commercial food waste can be viewed as an industrial waste stream, as it is generated in places like factories, supermarkets, restaurants, canteens, and catering facilities. The management of such waste is relatively easy, with its steady quantity, predictable composition, high nutrition value, and simple collection logistics. For example, a successful recycling and treatment scheme has been developed and operated in Suzhou city, China, since 2008, where commercial food waste and waste edible oil are collected by a government-commissioned contractor, then anaerobically digested to produce biogas, protein feed additives, biodiesel, glycerol, and bio-asphalt [2]. This process has reported a daily processing capacity of 350 tons and seems to be commercially viable.
However, the management of household food waste (HFW) is far more difficult. In contrast to commercial waste, domestic food waste can be considered as a non-point source, where a small quantity is generated daily in individual kitchens scattered over an extended area. To perform any kind of meaningful treatment on HFW would first require it to be separated from the rest of household waste. The separation must be sustained at a high level and over a long term and certain residential area to establish a steady waste stream. The success of such a scheme would highly depend on the voluntary actions of the residents. The infrastructure and logistics for collecting non-point source HFW are also much more complicated, and its digestion process is more uncertain due to fluctuating feedstock quality, which poses higher costs and risks to potential service providers.
Moreover, a sustained supply of high-quality HFW is only the starting point, as there are several other factors at play. In a recent cross-country review, De Clercq et al. [3] analyzed the national status of food waste conversion to bioenergy via anaerobic digestion (AD) in seven countries and identified various regulatory, financial, technical, and managerial barriers. Poor source separation, insufficient financial support, misplaced subsidy, lack of standards, supervision and performance evaluation, and weak government coordination were proposed as major challenges faced across regions. Translated to the project level, this suggests that the success of an HFW-to-biogas practice lies in the smooth circulation of material, value, and information in a given social and economic setting. The collected HFW must be transported to an AD facility of a suitable scale with technical proficiency to achieve acceptable productivity [4,5]. The products, biogas and digestate, must meet respective quality standards to enter the open market [2] or be disposed of in proper ways to cause minimal environmental burden [6]. Thus, the material flow of “consumers–HFW–biogas and digestate–consumers” is closed. In this process, various service providers perform tasks like HFW collection, transportation, and disposal, whose economic viability must be ensured. Indeed, the high initial capital cost required to establish a commercial-scale biogas plant is often a major barrier to potential investors [7]. Sufficient financial incentives like subsidies and service fees may help to overcome such barriers [8]; however, the stable sale and proper pricing of these products might be more vital to sustaining a healthy cash flow [9]. Again, this depends on the public acceptance of the arrangement of the AD plant, its products and their usage, the respective subsidy/fees, and the overall scheme of HFW reutilization. To achieve such acceptance, dedicated social campaigns might be needed to engage the public, and proper feedback should be given in the long run to sustain its support.
All these factors must be considered for the conversion of HFW (and other organic waste) to renewable energy and materials, whose success requires systematic support from an integrated framework of energy and environmental strategy, policymaking, financing, regulation, technology, and market development. At the root of all these factors are social awareness, consensus, and active participation. Perhaps due to the complex and multi-disciplinary nature of such projects, successful long-term, large-scale HFW-to-biogas cases are rare worldwide, and relevant reports are seldom seen in the scientific literature [9,10]. Existing research in this field tends to cover single aspects, such as waste separation behavior [10], energy potential [5], process efficiency [4], emission reduction and environmental impact [6], economic analysis [2], and general policy structures [3], while the full scope of an HFW-to-biogas practice has not been extensively studied. To fill this knowledge gap, this study presents a detailed and comprehensive analysis of the real-life case of Västerås, a medium-size industrial/manufacturing city in southern Sweden that has been operating a centralized biogas plant since 2005, continuously and efficiently converting the city’s HFW and other organic wastes into high-quality biomethane and biofertilizer, which are then utilized by the local public transportation service and farming sector, respectively [11]. This plant has been mentioned in a few previous studies, but their focus was mainly on various technical issues [12,13]. In this study, the mechanism underlying the successful HFW-to-biogas scheme of Västerås was explored in a systematic and integrated way. With first-hand data and materials, various aspects including its technological features, energy potential, environmental benefits, economic viability, and public participation were surveyed to illustrate the material, value, and information circulation throughout this process. This study will provide insights into how an HFW-to-biogas project achieves long-term sustainability and multiple benefits in certain social settings. More importantly, it can serve as a model for similar future projects and offer a complete analytical framework for the factors relevant to their success or failure.

2. Methods

2.1. Area and Industry Sectors Investigated

The municipality of Västerås was the chosen area for this case study. Located in southern Sweden, it is the 6th largest city in the country (urban area 52.94 km2). The city had a population of 150,134 in 2017, which was adopted in this study as the relevant data.
Västerås was chosen as the study area because of its advanced state in terms of energy innovation, environmental sustainability, and circular economy. Currently, the city employs a voluntary “two categories” municipal waste sorting system, in which the residents are guided to sort their household waste into biowaste and ”other”; the latter is sent to the region’s incineration plant, Mälarenergi, for energy recovery. The HFW-to-biogas project is an integrated and crucial part of the region’s energy and material network, in which the biogas plant, Växtkraft, plays the central role. The Växtkraft plant began operating in 2005 to digest the biowaste and ley crops of the region [13], from which vehicle fuel-grade biomethane and certified bio-fertilizers are produced. The plant is now co-owned and operated by the company VafabMiljö Kommunalförbund (Vafab in short). Vafab is a municipally owned, non-profit company, and the region’s main service provider of municipal solid waste management. It has been identified as one of the successful cases in this field [14]. Therefore, both the Växtkraft plant and the Vafab company were identified as the key sources of relevant information in this study. In addition, the incineration plant, Mälarenergi, and the provider of public transportation service, VL company, were solicited for information on the treatment of “other” waste and the usage of biomethane as vehicle fuel, respectively.

2.2. Research Contents and Methods

A comprehensive set of investigations and analyses was conducted to obtain information on various aspects of the Västerås HFW-to-biogas process, including a literature review, on-site and email interviews, and structured questionnaires. First, background information and statistic data were collected from public sources, including national statistic yearbooks, research reports, company annual reports, and academic databases. The research team then visited Vafab’s HFW processing site twice and conducted a semi-structured interview with the program director. More visits were paid to locations like HFW collection points, and several face-to-face surveys were conducted with the managers of various businesses including restaurants and supermarkets. Supplementary and updated information was obtained via further inquiry emails to the public relations departments and associated personnel of various companies. Finally, a questionnaire survey of the city residents was performed, based on random sampling. The framework of the study contents is shown in Figure 1.

2.2.1. Estimation of Energy Potential

The energy potential of the project mainly lies in its biomethane production. In this study, a conversion coefficient of 100 m3 biogas/ton wet weight of mixed feedstock was adopted for calculation, which is consistent with other well-performing biogas plants [15] and was verified by site-specific data. The total biogas productivity can be calculated by multiplying this conversion coefficient by the quantity of HFW entering the process.

2.2.2. Assessment of Environmental Benefits

Multiple environmental benefits can be derived from the conversion of food waste to biogas. This work selected several categories based on their relevance and the availability of data, which can be classified as follows.
(1)
Avoided emission from landfill or compost
At a landfill or composting site, if aeration is not provided and/or off-gas is not captured and treated, as is often the case, a large quantity of GHG emissions may occur from the fermentation of biodegradable organic wastes, including CH4, and N2O. Therefore, the diversion of HFW from such processes to sealed anaerobic digesters has the advantage of significantly improving off-gas capture and avoiding electricity use, thus reducing GHG emissions. In the case of HFW treatment in Västerås, centralized composting was generally practiced before the biogas plant went into action. The residents were guided to place their source separated HFW into specialized bins together with garden waste, which was transported to Gryta and Sala, where two processing plants are located. In Gryta, long-term open window composting was performed [16], and this scenario was used as the basis to calculate the avoided emissions. A relevant study systematically measured methane and N2O emissions from various composing systems and reported a general range of a compound emission factor of 30–85 kg CO2-eq per ton of wet weight organic waste from similar systems [17]. This range was adopted for calculation according to the following equation:
E 1 = Q     e 1
where E1 is the avoided GHG emission, Q is the quantity of HFW diverted from composting, and e1 is the compound emission coefficient from CH4 and N2O, in centralized window composting units for household organic waste [17].
(2)
Replacement of fossil fuel
Biogas produced from anaerobic digestion can be fed into an existing power plant for heat/electricity generation or be upgraded into city gas or vehicle fuel. The replacement of fossil fuels in boilers/vehicle engines, such as coal, diesel, gasoline, and liquefied natural gas (LNG) contributes to energy and environmental sustainability. In this study, biomethane upgraded from raw biogas was primarily used by the local public transportation provider to fuel their biogas-powered buses. At the same time, a smaller proportion was available to the public to fuel passenger cars. According to information provided by the bus company VL, for every 100 km bus mileage, 57 m3 commercial biomethane is consumed. In contrast, the corresponding diesel consumption rate by similar vehicles was estimated to be approximately 32.1 L/100 km [18]. In addition to this substitution ratio, it was assumed that replacing fossil fuel with biomethane in vehicles can reduce up to 90% of the original carbon emissions [6], which is estimated at 2.63 kg CO2-eq per L of diesel consumed [19]. Therefore, the emission reduction due to the replacement of vehicle fuel was calculated as follows:
Q = Q     e     e 2 / e 3
E 2 = Q / e 4     e 5     e 6     0.9  
where Q′ is the biomethane production capacity from HFW; e is the conversion co-efficient of HFW to biogas; e2 and e3 represent the methane contents in raw biogas and vehicle fuel-grade biomethane, respectively; E2 is the GHG reduction due to the direct replacement of diesel in vehicle engines; e4 and e5 denote the respective consumption rates of fuel-grade biomethane and diesel by heavy vehicles, and e6 is the emission coefficient of diesel.
(3)
Reduced air pollution from combustion in vehicle engines
Biomethane is considered a clean fuel and burning biomethane instead of fossil fuels in vehicles has the potential to reduce the emissions of SOx, NOx, VOCs, and particulate matter (PM), contributing to the mitigation of air pollution. Therefore, comparison studies conducted on biomethane replacing diesel in heavy vehicles (such as trucks and buses) were consulted. The emission data for some key pollutants are listed below (Table 1 [20]) and were used for calculation.
The reduction in air pollutant emission can be calculated as follows:
E S O 2 = Q / e 4     ( e diesel   e methane )
E P M = Q / e 4     ( e diesel e methane )
where ESO2 and EPM are the respective reductions of the two primary air pollutants, ediesel and emethane indicate the emission factors of SO2 from diesel and methane, respectively, while e′diesel and e′methane are the respective emission factors of PM.
The coefficients used for the above calculations are provided in Table 2.

2.2.3. Analysis of the Value Chain and Economic Feasibility

A cost-benefit analysis was adopted to outline the economics of converting HFW to biogas along the value chain in the Vafab enterprise. Figure 2 shows the structure of the operating costs and revenues of the “HFW-to-biogas” project, while the data used for calculations are from the 2017 annual report of Vafab [21].

2.2.4. Calculation of monetized Environmental Benefits

The environmental benefits can be monetized for more direct observation, such as tax reductions for biomethane users and incomes from carbon trading. The respective tax rates are listed in Table 3 [22,23]. The current carbon price of 1190 SEK per ton CO2-eq in Sweden was used to calculate the possible economic value through exchanging of reduced carbon emissions.

2.2.5. Investigation of Public Participation

A random sampling survey was planned and conducted with the residents of Västerås via face-to-face interviews and questionnaires. The investigation period was from 9 October 2018, to 25 November 2018. The structure and content of the questions were designed based on previously published research [24,25,26] and consultations with various local experts. A total of 126 questionnaires were retrieved, of which 95 were deemed valid. An analysis was conducted based on the latter to map out the residents’ perception and the potential key factors in their behavior towards HFW separation and reutilization.

3. Results

3.1. Food Waste Quantity

In the case of Västerås, food waste is primarily generated in household kitchens, catering enterprises, and food retailers (such as supermarkets). According to the statistical reports from the Swedish Environmental Protection Agency [27], the annual quantity of food waste produced by residents in Västerås is approximately 91 kg per capita, of which 67 kg originate from household kitchens, 18 kg from restaurants and cafés, and 6 kg from food retailers. As indicated by the latest census data [21], the total population of Västerås amounted to 150,134 in 2017. Therefore, the total quantity of food waste generated in Västerås in 2017 was estimated to be 13,662 tons, of which 10,059 tons were contributed by the residents’ daily food cooking and serving activities in household kitchens.

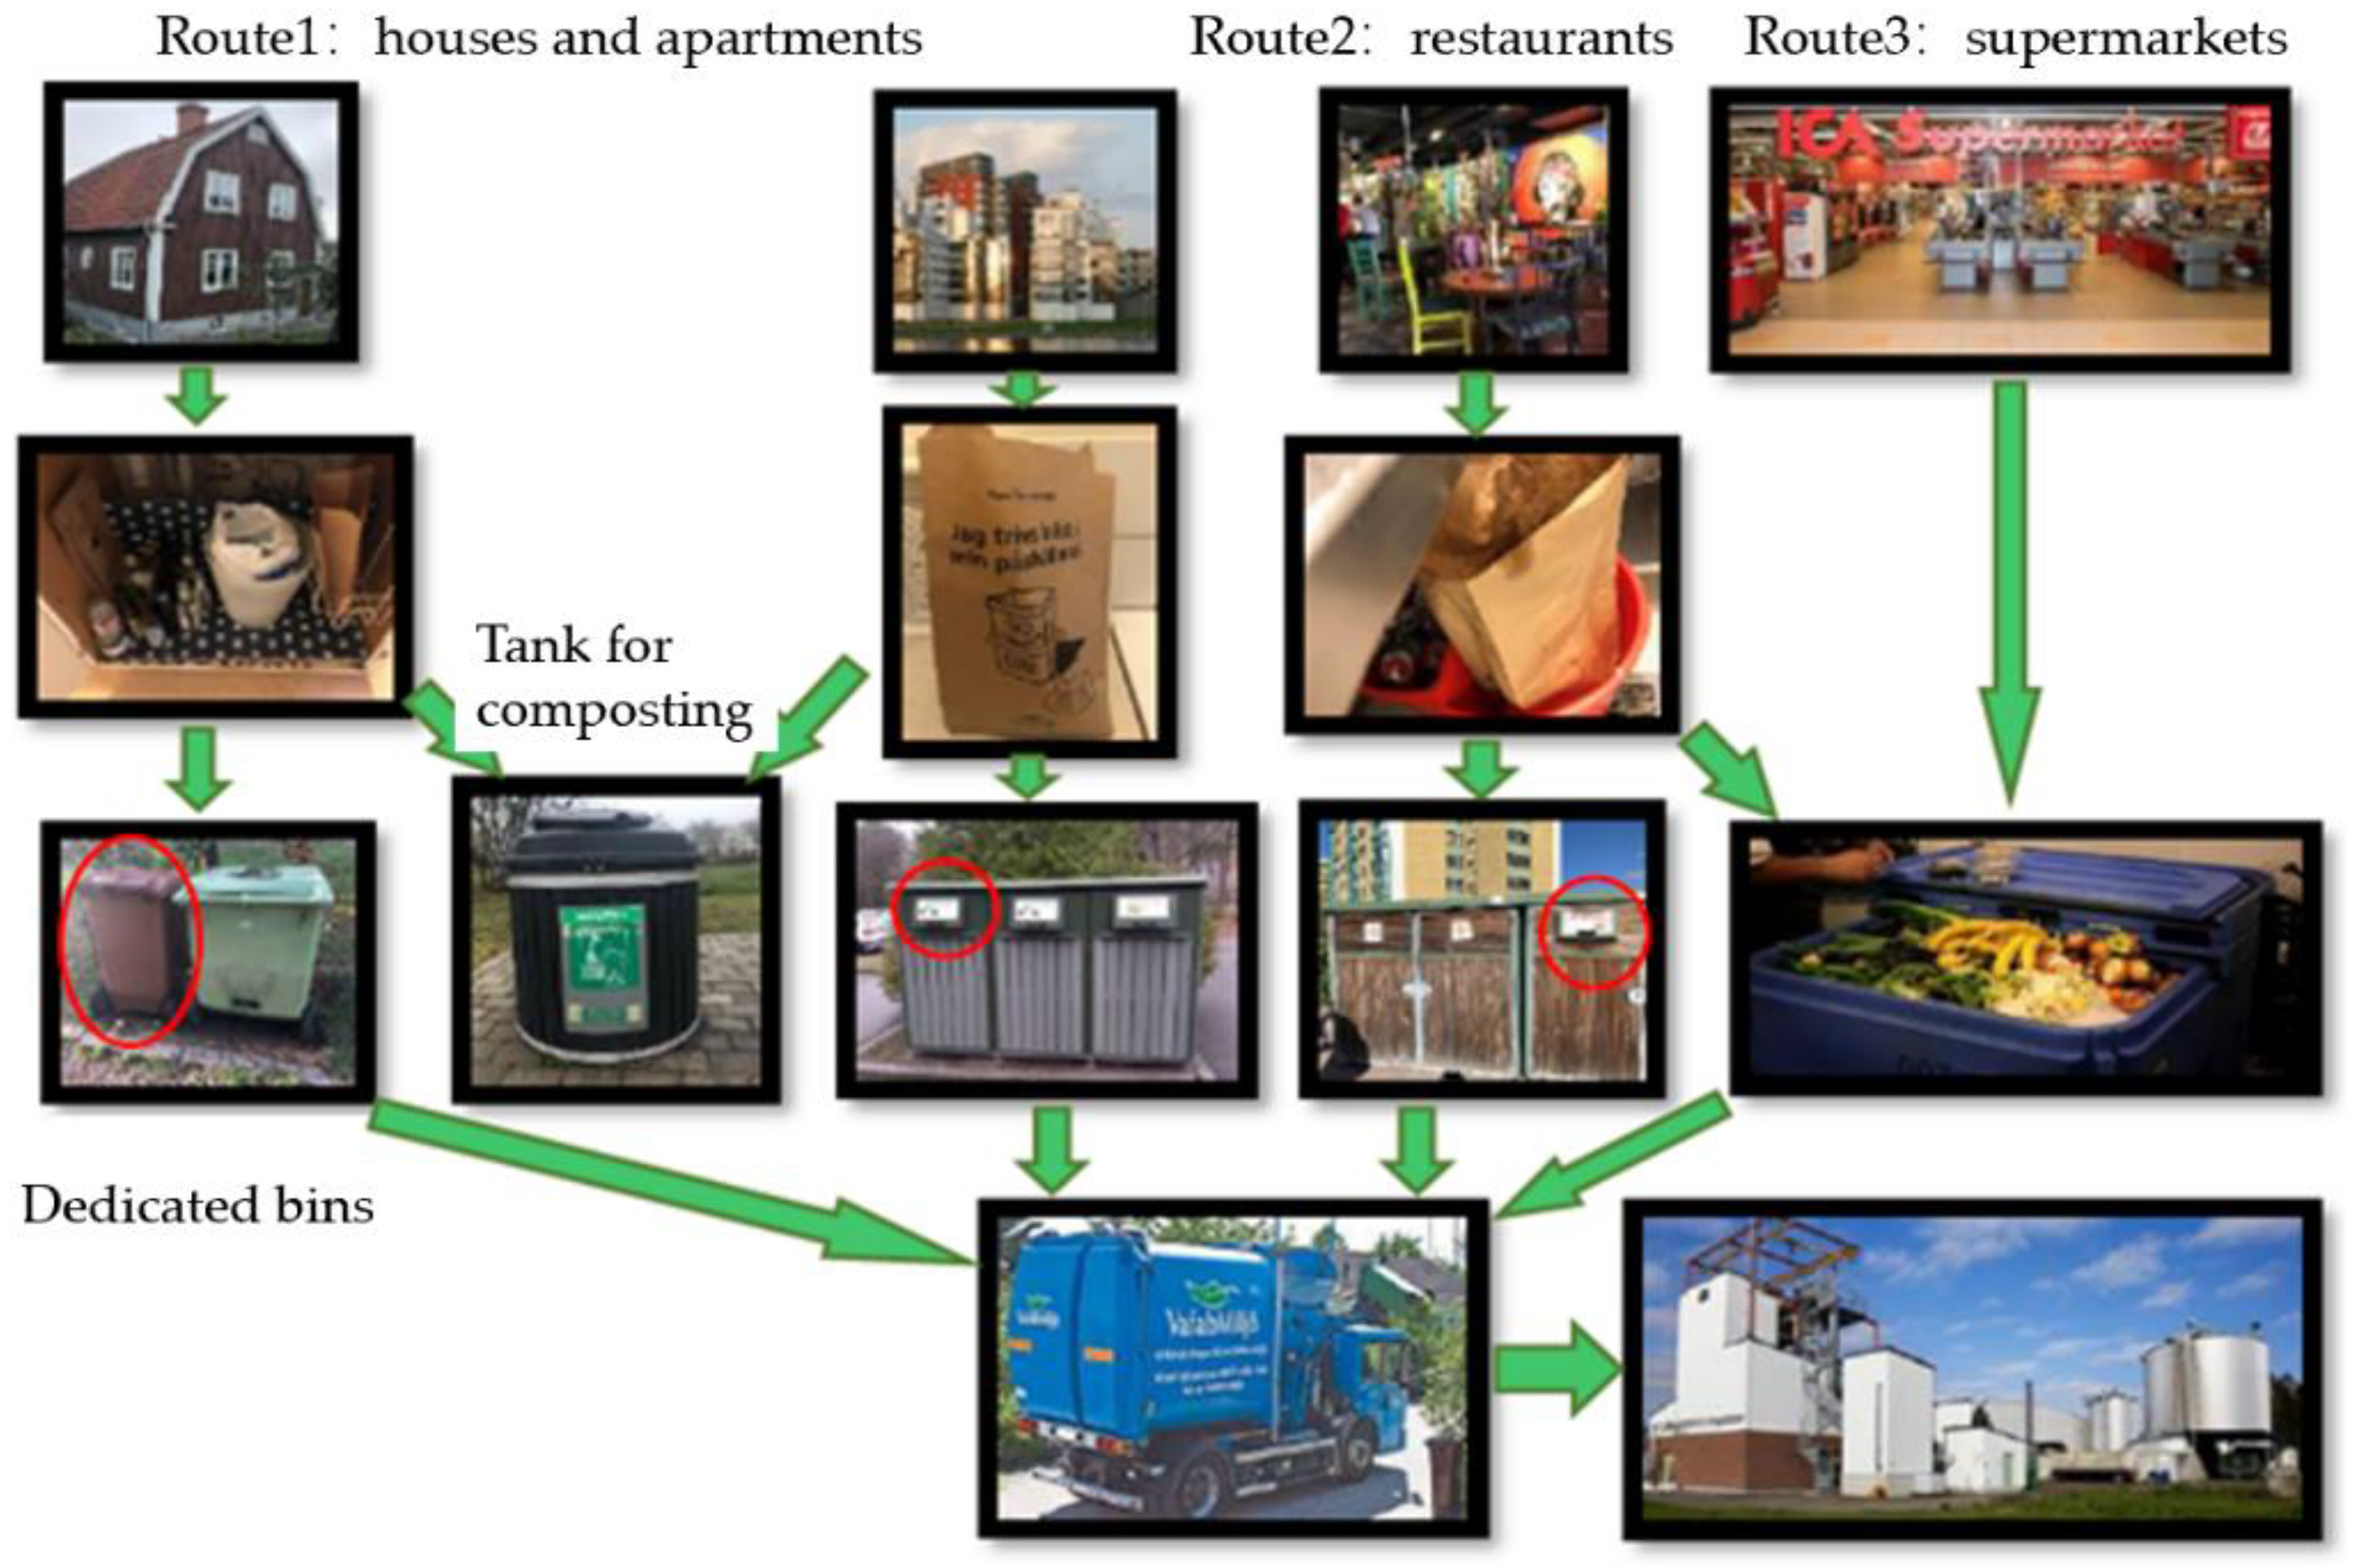
3.2. Logistics of HFW Collection and Transportation

All food waste generated in Västerås city is collected and transported by one company (Vafab). According to interviews, 8879 tons of food waste was collected within the Västerås city boundary in 2017, which is the basis for further calculation in this study. Therefore, the food waste separation rate in Västerås is 65% (i.e., 8879/13662), which is very high compared with the rest of the world [10]. The remaining part of the food waste is mixed into the “other” category and sent to Mälaenergi Combined Heat and Power (CHP) plant, or in some cases, self-composted. The whole process is facilitated by a sound and effective food waste collection and transportation system, the logistic flow of which is shown below in Figure 3.
In domestic households, HFW is required to be separated from other kinds of waste (lumped as “other”) and placed in special brown paper bags. The bags are supplied by Vafab and can be obtained for free from the respective community committees or service centers. They are impermeable to odor and water resistant for a short period (a week), with a volume to hold the HFW generated in a normal household in 2–4 days. They can be co-digested with food waste with no adverse effect. Residents of apartment buildings are required to deliver the bags containing HFW to dedicated bins located in the respective communities, usually within easy walking distance. These bins are emptied every two to four weeks by Vafab collection trucks. For residents living in houses, private bins are set up within the boundary of the individual estates. These residents are also required to collect their HFW in brown paper bags; however, they can choose whether to put them into a dedicated bin or not. For residents who choose not to source-separate their HFW, a higher fee is set by Vafab for the unit quantity of mixed waste.
According to the interview results, restaurants and canteens generally separate their food waste and deliver it to central collection points in their respective business areas. Sludge from grease separators in institutional kitchens and restaurants is collected with slurry tanks. The collected food waste is also transported by Vafab, approximately once per week. Relatively little food waste is generated in supermarkets, and it is usually collected separately. However, some expired food items in plastic packaging may be disposed of directly into the food waste bins, without the packaging materials being stripped. This has caused significant difficulty to the subsequent processing, as contamination of plastics in food waste hinders biological processes. When more than 10 plastic bags are discovered in one truckload of food waste collected, the whole truckload is deemed unfit for anaerobic fermentation and must be sent to the incineration plant.

3.3. Technical Features of the Anaerobic Digestion Process

The collected food waste is transported to the Växtkraft plant to be co-digested with ley crops, following the procedure of “pretreatment–mixing–digestion–separation–upgrading”. Some of the technical features are summarized below, and relevant information from several other similar operating plants is summarized in Appendix A Table A1 for comparison.
(1)
Pretreatment
Food waste is unloaded from the transporting trucks, shredded, and sieved to remove impurities, then mixed with shredded ley crops. Waste in liquid or slurry form (such as grease) is then added in, and the total feedstock flow is fed into the mixer. Process water is supplemented therein, resulting in a final solid content of approximately 15%. After further separation by sieving, the slurry is crushed and pumped into the buffer tank.
(2)
Fermentation
The slurry in the buffer tank is distributed into three parallel thermos tanks, to be pasteurized at 70 °C for 1 h to remove undesirable microorganisms and promote hydrolysis of the raw materials. The partially hydrolyzed slurry is then sent into the main fermentation tank and retained there for approximately 20 days at 37–40 °C. The tank processes 50–60 tons of raw materials each day, with a working volume of 4000 m3. The tank is fed continuously for 6 days and is then left to rest for 1 day to “clear the backlog”.
(3)
Biogas upgrading
Raw biogas produced in the main tank has a CH4 content of approximately 65% (e2), which is upgraded onsite. High pressure (10 bar) water is employed to remove CO2, NH3, and H2S, and increase CH4 content to 97–98% (e3), meeting the requirement of vehicle fuel [28]. With an additional source of raw biogas from the city’s municipal wastewater treatment plant, this unit generates approximately 6300 m3 biomethane per day and is expandable to a maximum capacity of 13,200 m3 per day. In 2017, total production of 2,890,000 Nm3 was reported, with a CH4 loss of 2% in the upgrading unit.
Compared to other plants listed in Appendix A Table A1 [8,29,30,31], Växtkraft has been operating longer and has shown constantly good performance. With a feedstock mainly composed of HFW, a feature not shared by other examples, this plant is able to achieve a relatively high substrate conversion rate and volumetric productivity. This might be related to its smaller scale, which poses lower stress on feedstock security and process management.

3.4. Distribution and Utilization of the Products

3.4.1. Delivery and Utilization of Biomethane

A small part of the raw biogas is combusted on-site for CHP generation. The electricity produced is utilized to sustain the various auxiliary facilities in the plant, including the pretreatment, digestion, biogas upgrading and compression, and digestate separation units. The heat is fed into the district network for public consumption. After purification and compression, product biomethane is transported through Vafab’s pipelines at 4 bar to the three filling stations within Västerås city. The main station is in the city center next to the central bus terminal, approximately 8.5 km from the biogas plant. The three stations outside the city are supplied with pressurized biomethane transported by Vafab trucks, and a minor proportion of biomethane is used to fuel some of Vafab’s garbage collection trucks and company cars. The energy expenditure is approximately 2.9 MWh per day for the whole plant, while the daily biogas production corresponds to approximately 24 MWh of electricity and 44 MWh of heat, resulting in an overall electrical efficiency rate of 93.4% [32]. Therefore, the biomethane compression and transportation processes can largely be considered as carbon neutral, and the plant’s emission is basically biogenic.

3.4.2. Utilization of the Digestates

The residue organic substances generated from the main fermentation tank go through centrifugation to separate the liquid and solid digestates. The combined annual production in 2017 was 19,800 tons, which was delivered to or collected by the local farmers at prearranged schedules, stored near the agricultural field, and used throughout the year.

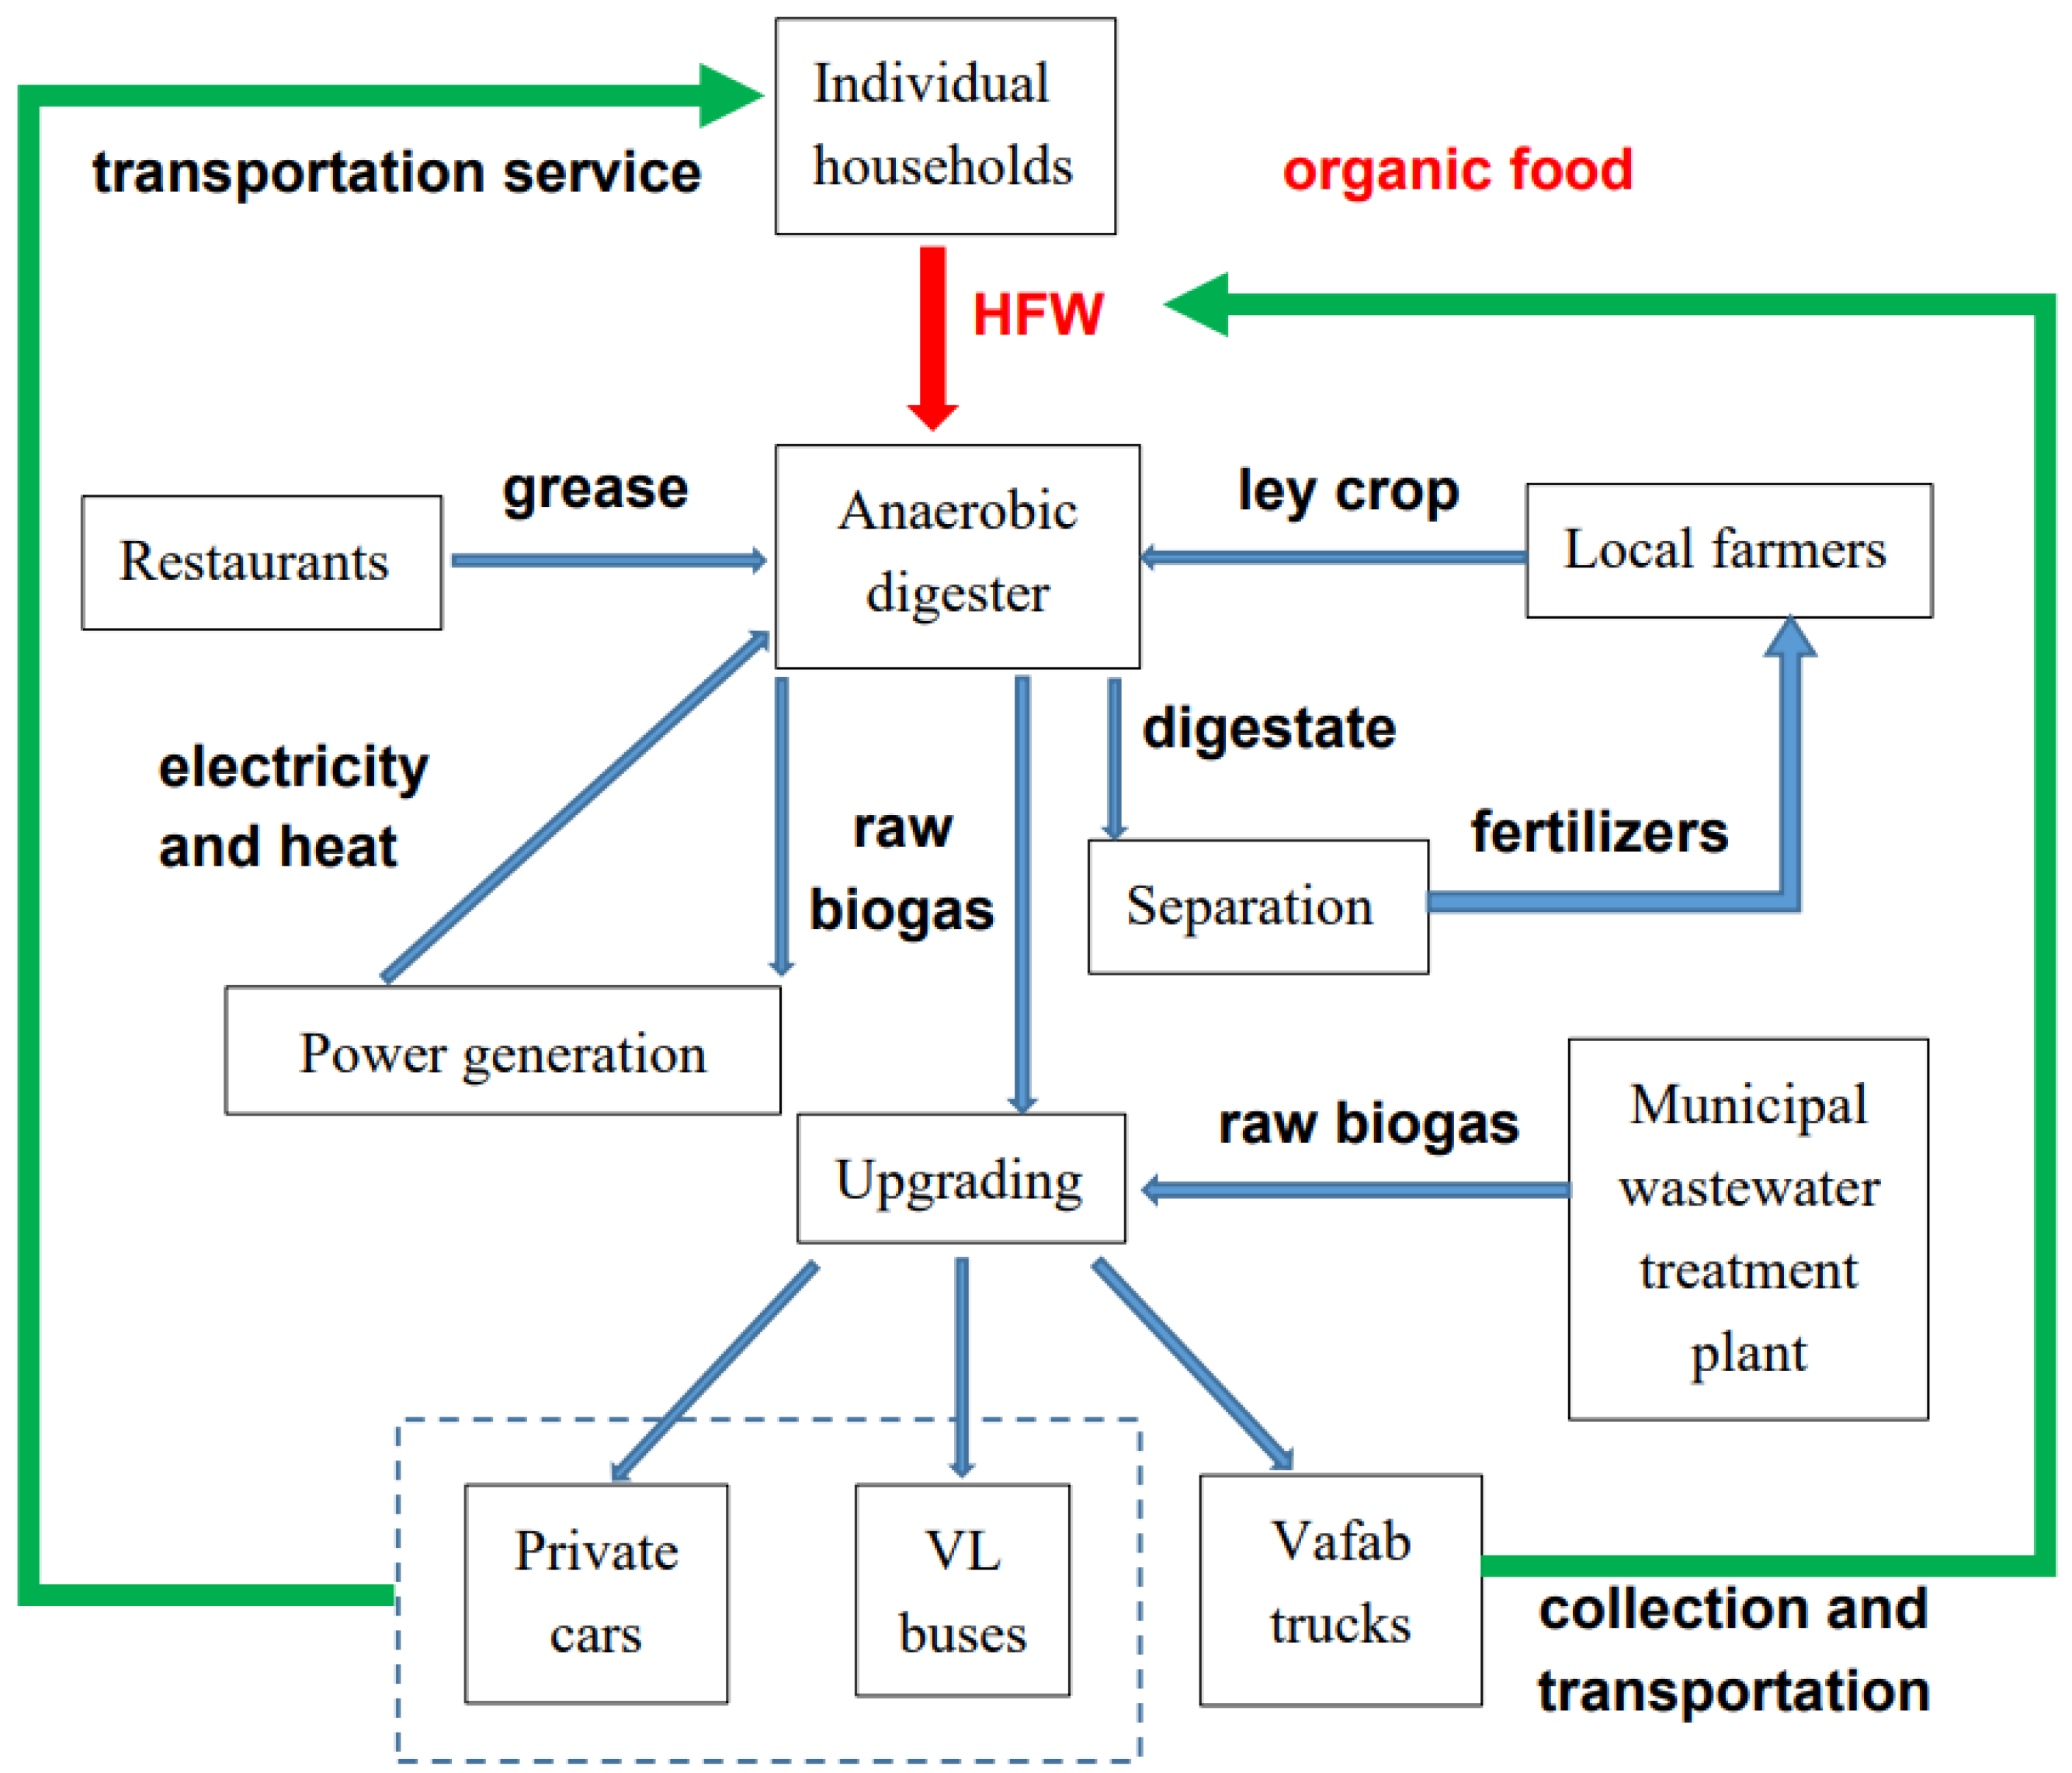
3.5. Energy Potential from Västerås’ HFW

The total quantity of raw biogas generated from Västerås city’s HFW was calculated to be 8879 tons * e = 887,900 Nm3 (65% CH4) in 2017. When upgraded into vehicle-grade biofuel (97–98% CH4, 97.5% used for calculation), the energy potential was 590,000 Nm3 (as biomethane, see Equation (2)). This biomethane is provided as a commercial vehicle fuel to consumers around the city, with the major user being the local public transportation provider VL. According to the data supplied by VL, there are 73 biogas-powered buses running within the Västerås city boundary, with an average mileage of 186 km per bus per workday. The consumption rate of biogas by the buses is 57 Nm3/100 km. Therefore, the total mileage that can be sustained by Västerås’ HFW is 3981 km/day (assuming 260 workdays per year), which can sustain 21 biogas-powered buses in their daily operation. Hence, the biogas from Västerås’ HFW alone can support over 29% of the city’s public transportation. On the other hand, if the total biomethane production (2,890,000 Nm3) is used as the base of calculation, a fleet of 105 buses could be run exclusively on renewable sources, such as HFW, commercial food waste, ley crop, sewage sludge, and animal manure.
The whole material and energy flow of the Västerås biogas project is illustrated in Figure 4.

3.6. Environmental Benefits

Converting HFW to biogas can incur multiple benefits for various sectors, including biogas users, farmers, local residents, and the general public. The most direct and significant of these benefits are the reduction of GHG emissions from landfill and compost, replacement of fossil fuel in engines, provision of biofertilizers for sustainable farming, and reduction of noxious gas emissions during vehicle operation. These benefits were analyzed qualitatively or quantitatively as follows.
(1)
Avoided emissions from composting
Before the HFW-to-biogas project was fully in motion, the residents of Västerås had been diverting their HFW to composting for many years as a response to the landfill ban on organic waste introduced by the 1998 Swedish Environmental Code. The collection tanks were placed at easily accessible spots in various residential areas, allowing the local residents to walk there and hand deliver their HFW and garden waste. As shown in Figure 3, the tanks had a depth of approximately 3 m, of which 2 m was underground. During the storage period, no ventilation or off-gas treatment was provided, nor was content turned or mixed. After the mixed organic waste was transported to the Gryta site, open window composting was performed, which can be considered the main source of GHG emissions. Of the main GHGs categories, CO2 is usually not included in calculations, as it can be considered as biogenic and part of the natural cycle when HFW is the feedstock. As for methane and N2O, a compound emission coefficient of 30–85 kg CO2-eq/ton wet weight was adopted from a study of similar settings [16]. Accordingly, when the annual production of food waste in Västerås city (8879 tons in 2017) is diverted from such composts to the biogas plant, the total avoided emissions are calculated to be 266.4–754.7 tons of CO2-eq.
(2)
Replacement of fossil fuels in city buses
In Section 3.5, the energy potential from Västerås’ HFW was calculated to be 590,000 Nm3 biomethane, which sustains a mileage of 1,035,088 km for the city’s biogas bus fleet. This practice would result in GHG reduction, as diesel is assumed to be replaced as a fuel in heavy vehicles. According to Equation (3), the replacement of 332,269 L diesel reduction was estimated to be 786.5 tons CO2-eq. The biogas fleet of Västerås has a total of 73 buses. Such a fleet, with an average mileage of 186 km per bus per workday, would consume 2,012,260 Nm3 biomethane in a year (assuming 260 workdays). This would, in turn, result in a replacement of 1,133,220 L diesel and a GHG reduction of 2682.4 tons CO2-eq. The rest of the biogas is used by collection trucks, company cars, and private cars, whose number and mileage are not known to this study. However, an earlier report estimated a replacement of 2.3 million L of petrol from the yearly biogas production of this plant [33], with an energy potential of 23,000 MWh.
As shown in Figure 4, the Växtkraft plant receives three types of raw materials in 2017, i.e., HFW, grease, and ley crops. These raw materials were of various quantities and characteristics, which are summarized in Table A1 from various sources. According to their respective quantities and biogas potentials, their contributions to the final production were estimated. HFW contributed to approximately 74.5% of the total biogas output, thus serving as the major feedstock in this plant.
(3)
Reduction of air pollution
As a clean fuel, methane substituting diesel in vehicle engines can result in various degrees of emission reductions, depending on the specific pollutant and the type of vehicle. Assuming the emission factors of small rigid trucks (the vehicle type closest to biogas-powered buses), as shown in Table 1, the reduction of NOx, SO2, and PM upon fuel switch was calculated to be 1.98 kg SO2 and 15 kg PM (Equations (4) and (5)). The reduction in SO2 and PM is more significant, as biomethane contains predominately methane and almost no sulfur, facilitating clean and efficient burning. There is no reduction of NOx in this case, as these substances are mainly of thermal origin and are more related to the combustion process than the fuel composition.
(4)
Replacement of chemical fertilizer
A major drive for the development of the Västerås HFW-to-biogas project was to provide local farmers with good quality fertilizer and soil conditioner. This aim has been satisfactorily achieved through continuous and coordinated collaboration between the plant and farmers. A total of 17 local farms have entered into an agreement, where 300 hectares of arable land (3 km2) were set aside to grow two or three years of ley crops, mainly clover, timothy, fescue, cocksfoot, and ryegrass. The crops are harvested two or three times per year, according to the schedule arranged by the plant and agreed to by the farmers. The harvested crop is shredded on-site and delivered to the plant by the farmers, then stored in bag silos to continuously provide the plant with silage. The land has ley productivity of approximately 7700 kg/hectare (as total solid), with a volatile solid content of 84%, corresponding to an energy content of 7 MWh/hectare [33]. After the digestion of mixed feedstock, the digestate is centrifuged and separated into two parts, whose characteristics are shown below in Table 4 [32,34,35].
On average, a total quantity of approximately 20,000 tons of digestate is produced annually, with the solid fraction enriching phosphorus and the liquid fraction enriching nitrogen. It is estimated that from every ton of HFW entering the process, 1.4 tons of liquid and 0.2 tons of solid fertilizer is generated [35]. The digestate is collected by the farmers weekly according to a pre-arranged schedule and stored near their respective farms until application. All the farms participating in this project are located within 10–20 km of the plant (~20 min drive); therefore, the delivery of both the crop and digestate has limited environmental impact. The liquid digestate is spread as ordinary chemical fertilizer, and the solid digestate is applied as soil conditioner like animal manure, thus earning the project the nickname “mechanical cow”.
Various amounts of plant nutrients are supplied by this process, including 100–150 tons nitrogen, 10–30 tons phosphorus, 60–100 tons potassium, and at least 1000 tons organic matter. Such a supply is expected to replace chemical fertilizer enough to grow cereal on 1200–1600 hectares of arable land [32]. As the feedstock contains only food waste and ley crops, both of agricultural origin and stable quality, the digestate can be used for food cultivation. When their farming practice meets the Swedish Organic Farming Quality Standards, the respective users of these digestates can be recognized as ecological farmers, as four of the participating farmers already have. As a result, their products can be guaranteed a substantial premium or higher market price, potentially bringing the farmers more income and better economic stability.

3.7. Economic Feasibility

As stated in Section 1, for an HFW recycling project to achieve long-term success, it is crucial that economic viability is ensured for its service providers. In this section, the relevant cash flow of the company Vafab is briefly analyzed to gain insight into the economic feasibility underlying its HFW-to-biogas operation. All the currencies are scaled to the year 2017 value.

3.7.1. Waste Collection and Handling Fee

A significant part of Vafab’s revenue comes from the waste processing fees paid by the local residents. Upon agreement by the public and municipal government, the company has set up respective fees for the services of collection, transportation, treatment, and the ultimate disposal of household waste. The waste tariff is divided into a fixed and a variable part. All households must pay the fixed fee, regardless of the type of service subscribed. The level of the variable part depends on the type of subscription chosen by individual households, such as whether to separate their HFW, the size of the bins, and the quantity and frequency of collection. The total fee is the sum of these two parts.
The total number of subscribers in Västerås and the number of subscribers who choose to separate their waste are shown in Table 5, while the respective fixed rates are listed in Table 6. The variable collecting fee for those choosing not to separate food waste was 3696 SEK/year, and for those choosing to do so was 924 SEK/year in 2017 [21]. It can be seen that for subscribers who choose not to separate their food waste, a much higher rate is applied (four times that of those who opt to separate). This policy strongly encourages the local residents to conduct food waste diversion, while still leaving their choices open. According to these data, the various types of waste collection and processing fees paid by different subscribers can be calculated, and the results are shown in Table 7. It is estimated that the total amount of waste collection and handling fees received by Vafab in 2017 was approximately 51.76 million SEK, including a fixed fee of 29.72 million SEK and a variable fee of 22.04 million SEK. When the fees paid by businesses are excluded, the remaining payment amounts to 48.48 million SEK, accounting for 93.7% of the total fee. On the other hand, only 2.44 million SEK was collected from subscribers who were not separating, which was 4.7% of the total payment. Therefore, the individual citizens living in houses and apartments are the main source of waste processing fees for the company, and the structure and levels of the fees are effective in promoting people to conduct source separation for their HFW.

3.7.2. Revenue from Biogas Sales

According to the data provided by Vafab, the current selling price of upgraded biomethane (97–98% at 1 bar) is 19.8 SEK/m3. Therefore, production from Västerås’ HFW (590,000 Nm3 in 2017) could bring approximately 11.68 million SEK of income for the company. When the total biomethane production of 2,890,000 Nm3 is considered, the sales income would amount to 57.22 million SEK.

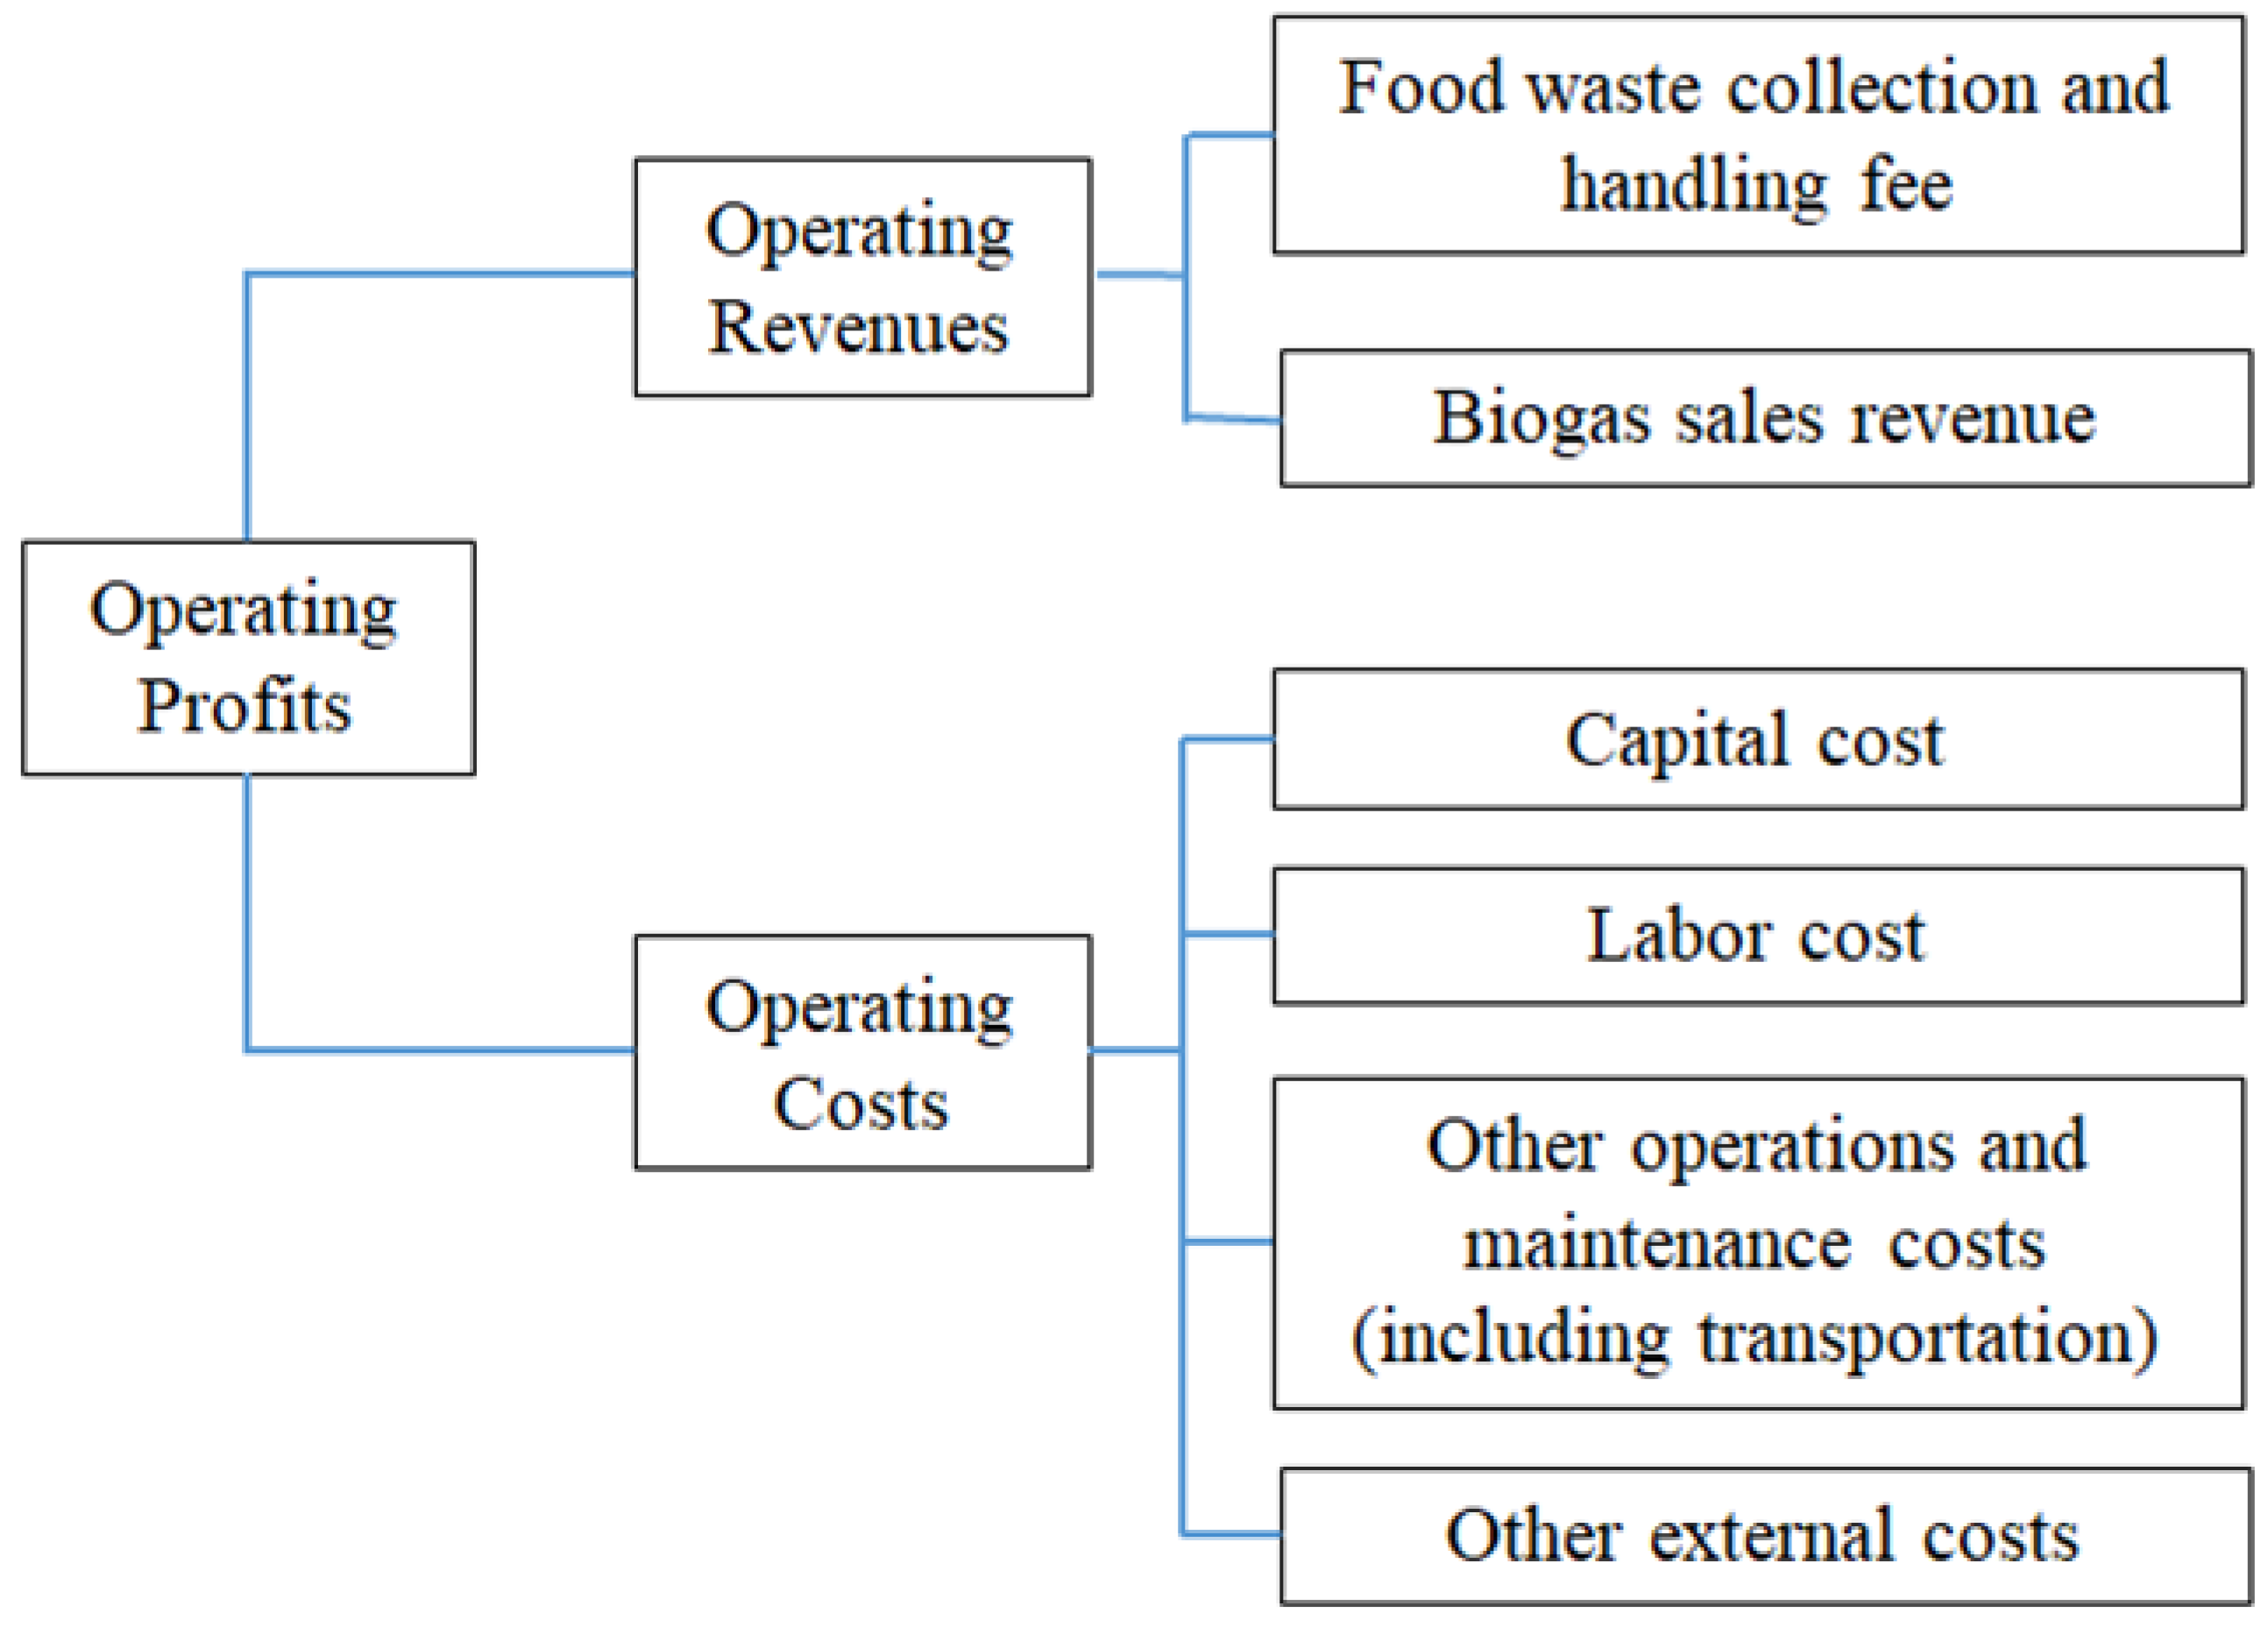
3.7.3. Operating Costs

The operation of biogas plants incurs various costs, including annual depreciation and amortization after fixed capital investment, new capital investment, labor costs, transportation costs for collecting food waste and distributing biogas, and other related operating and maintenance costs. The total investment of the Växtkraft plant is reported to be 103 million SEK, and the infrastructure construction capital of the associated pipelines and filling stations is 14.42 million SEK. The depreciation and amortization cost for 2017 was approximately 15.97 million SEK [21]. According to the data provided in Vafab’s annual report, the newly added capital investment in 2017 was 1.725 million SEK, the labor cost was 4.827 million SEK, the total costs of other operations and maintenance (including transportation) were 26.854 million SEK, and other external costs were 4.18 million SEK [21].

3.7.4. Operating Profit

The various data listed above were used for the calculation of the operating profit of the process, and the results are shown in Table 8. The waste handling fees are not only for food waste, but also include the collection and transportation service for the “other” waste. However, as the “other” waste is sent to the Mälarenergi plant for CHP generation, the cost of its treatment is largely not born by Vafab.
Combining the incomes from waste handling fees and biomethane sales, in 2017, Vafab would have collected an operating revenue of about 60.16 million SEK for handling the wastes generated in Västerås city. According to the 2017 annual report, Vafab achieved a total operating revenue of 593.146 million SEK. Therefore, the conversion of Västerås’ food waste into biomethane accounted for 10.1% of the company’s total revenue. On the other hand, the total operating cost of the Växtkraft plant in 2017 was approximately 53.556 million SEK, accounting for 9.5% of the total cost for Vafab (566.730 million SEK) in that year. As a result, the actual operating profit of this plant amounted to 6.604 million SEK in 2017, accounting for 25.0% of Vafab’s annual total operating profit (26.416 million SEK). This denotes the significance of the HFW-to-biogas project in the company’s business landscape, and its contribution to the overall economic viability. It is worth noting that the plant’s operating cost includes that of the biogas upgrading unit, which processes the raw biogas from two different sources, as well as the transportation of the “other” waste. Therefore, it could be inferred that the real cost of Västerås’ HFW-to-biogas process is lower, and the operation is highly sustainable for the company from a financial perspective.

3.8. Monetized Environmental Benefits

As shown in Section 3.6, 332,269 L diesel can be replaced by biomethane from Västerås’ yearly HFW. According to the tax rates listed in Table 3, the corresponding tax exemption for the bus company is 1.90 million SEK. The reduction of taxes for biomethane is to encourage the usage of this renewable fuel, as it contributes significantly to combatting global warming. Such a contribution can be embodied by the price placed on carbon emissions, which is currently 1190 SEK per ton CO2-eq in Sweden. Based on the calculation in Section 3.4, a total of 1052.9–1541.2 tons CO2-eq of GHG reduction is estimated from diverting HFW from composting and replacing diesel in engines, which corresponds to 1.25–1.83 million SEK/year of direct environmental economic benefits. The total environmental benefits are therefore 3.15–3.73 million SEK/year.
The overall value flow between and among the various sectors is indicated in 
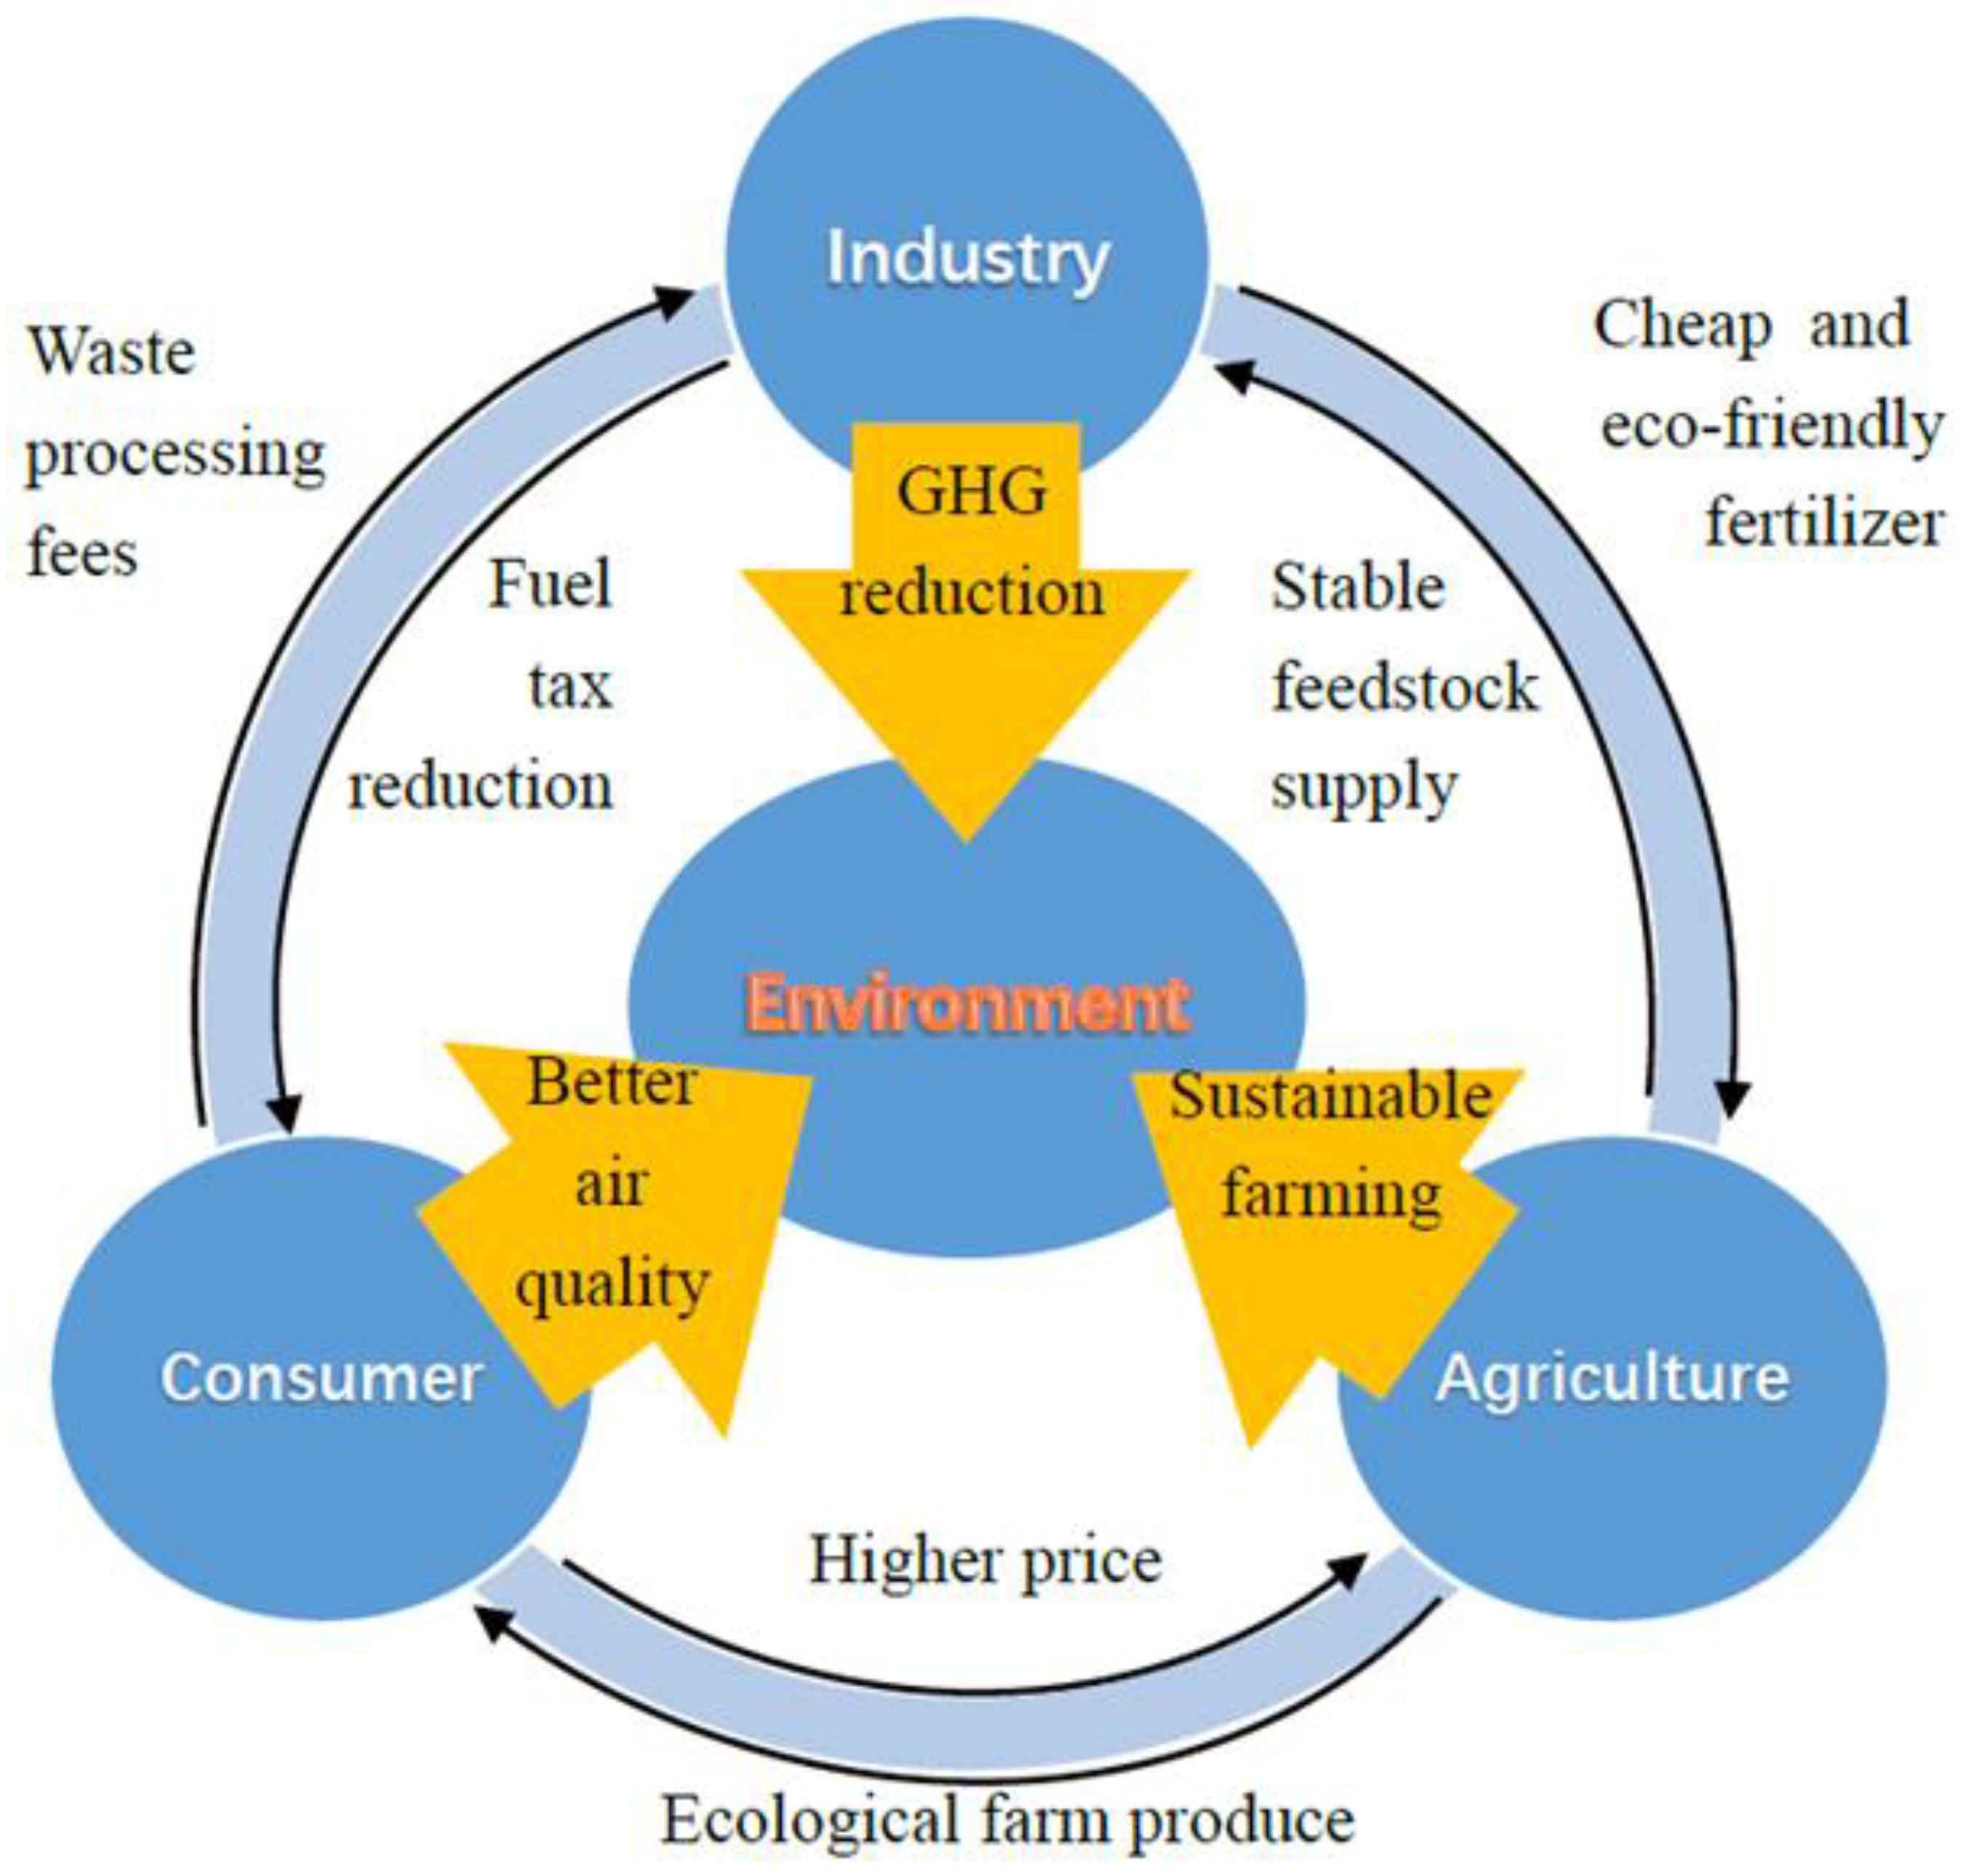
Figure 5, emphasizing some major benefits analyzed previously. In summary, Västerås’ HFW-to-biogas project successfully facilitates a continuous circulation of value, both tangible and intangible, among its various stakeholders. The fees paid by the residents to Vafab ensure its healthy financial status, which in return provides the subscribers with high-quality waste handling services. The major product, biomethane, fuels the city buses and many other vehicles, providing valuable public transportation services and reducing fuel costs for consumers through tax exemption. Consumers, while replacing conventional fossil fuels in their engines with biomethane, contribute significantly to global environmental sustainability by reducing GHG, SOx, and PM emissions. Another product, digestate, is rich in organics, plant nutrients, and microorganisms, which can be a problem if viewed as a waste stream to be treated but can become a valuable resource if reutilized. By engaging the local farmers in a mutually beneficial collaboration, the biogas plant ensures its digestate is continuously and fruitfully employed, thus nullifying the problem of disposal. On the other hand, the supply of ley crops to the plant diversifies its feedstock, improving both the stability and productivity of anaerobic digestion. The farmers, in return, also reap significant benefits. In addition to obtaining stable and high-quality fertilizers to compensate for their lack of animal manure, the application of such solid and liquid digestate improves soil structure, sequesters carbon, and recycles plant nutrients back to arable land, making farming more sustainable. Consequently, the users are eligible to apply for the status of ecological farmers, which brings their produce into a high-end market. In addition, the HFW-to-biogas project integrates technologies from several sectors, including waste collection and transportation, feedstock pretreatment, anaerobic digestion, biogas purification, and product distribution and utilization. Valuable experience can be obtained, expertise developed, and employment provided for both the urban and rural societies, enhancing not only environmental but also social equitability and sustainability in the region.

3.9. Public Participation

Underlying the material and value flows in the HFW-to-biogas system lies the less obvious but no less important circle of information exchanged among the various stakeholders. In the reverse logistic system of HFW collection and utilization, the residents’ active participation is the first and probably most crucial link. At the onset of the landfill ban, dedicated social campaigns had been launched to promote the practice of HFW diversion. In this part of the study, a questionnaire survey was conducted to investigate the residents’ perception and awareness of the waste sorting program in general, and the HFW reutilization project in particular. The aim was to identify the factors affecting residents’ attitudes toward participation, which would help to understand their motivation and obstacles and become the foundation for future intervention. The results of the survey are presented as follows.

3.9.1. Background Information and Characteristics of the Respondents

The basic information on the respondents included their gender, age, education experience, time spent living in Västerås, and income level. When distributing the questionnaires, care was taken to keep the respondents’ gender, age, education level, and annual income as diverse as possible. As shown in Table 9, the distribution in these aspects was reasonably well balanced. The total number was split evenly between male and female respondents, with an average age of 37 years. At the time of the survey, 57% of the respondents had received high education, and 60% of them were in the middle-to-high income group. It should be noted that the survey was directed mainly towards the residents in Västerås city, as they are the major generators of HFW.

3.9.2. Analysis of Behavioral Drivers for HFW Separation

Six dimensions (11 factors) were tentatively identified as the behavioral drivers for HFW separation, which cover value, morality, habit, facility, incentives, and penalty. Respondents used a score from 1 to 5 to rate the importance of the driving factors on their HFW separation behavior, where 1 means not important at all and 5 means most important. The average value and standard deviation are shown in Table 10.
The rating results indicate that value orientation and facility convenience are the two key drivers for respondents’ sorting behavior. The factor with the highest score (4.75) was environmental awareness, which belongs in the dimension of value. The other two major drivers were the free paper bags for HFW separation (4.39), and the special food waste bins for collection (4.23), indicating the importance of available facilities. In addition, the awareness that their HFW is converted to biogas, which is used to support public transportation (4.19), acts as another important incentive. In contrast, the respondents showed less concern towards public pressure and economic reward or penalty, indicating that their behavior stems more from personal belief and choice. According to the preliminary data collected via questionnaire and interviews, 61% of the interviewed apartment residents reported not knowing about the specific fee for waste collection and treatment, as it was included in the rent of the apartments, while 20% of the residents understood that the fee was lower than 500 SEK/month. Furthermore, some of the respondents mentioned that the garbage collection fee was lower than their expectation, and more money should be charged for waste management as it was a valuable service for the public and the environment. Therefore, economic reward/penalty is likely to be ineffective in further encouraging the residents’ HFW separation practice, which can be a consideration for future education/campaign programs.
It was surprising to discover that >70% of the respondents knew how their HFW was ultimately utilized, indicating that this might be a key piece of information. Figure 6 shows a picture of a biogas-powered bus regularly running in the city streets, where a big sign of “BIOGASBUSS” is clearly shown on the surface. This serves as a powerful reminder to the commuters of what fuels the buses they ride every day, even if they do not know the details of how it is achieved. Combined with the information provided on the paper bags and biowaste bins, effective feedback is constituted for the participants of HFW separation, which likely helps in achieving high HFW separation in Västerås.

4. Discussion, Lessons Learned, and Perspectives for Future Application

The conversion of biological waste into biogas to meet various environmental, energy, and/or agriculture needs is not a rare practice. However, most projects choose agricultural residue or industrial waste streams as their raw materials, such as stalk, animal manure, and food and beverage processing waste [3]. Household food waste, though a suitable substrate for anaerobic digestion, seldom serves as the main feedstock in a large-scale biogas plant. The main reason behind this is likely the difficulty in securing a stable and high-quality HFW supply in the long run, thereby jeopardizing the plant’s operational efficiency and economic viability. Correspondingly, most published studies on HFW focus on fragmented aspects, such as hypothetical scenarios for HFW management [36], biogas potential of a given location [37], HFW source separation behavior [10], plant performance evaluation [38], life cycle analysis of food waste-based biogas generation [39,40], and environmental impacts of alternative treatments [16]. Detailed studies of real, successful, large scale and long-term HFW-to-biogas cases are seldom seen, and the whole picture of how their various pieces work together, leading to an overall sustainable operation, is lacking.
On the other hand, HFW is becoming an increasingly urgent problem worldwide. Some countries have developed sound waste sorting programs early on, such as Japan and Korea. However, in Japan, the majority of HFW is incinerated, which is considered as an environmentally acceptable option [41]; whereas in Korea, a significant portion of the source-separated HFW is used as animal feed, a process not commonly adopted elsewhere. Some other countries, while experiencing rapid urban development, try to establish a sustainable HFW management system but are faced with great difficulty.
In Appendix A Table A2, several operating biogas plants in China are listed, among which at least one is suffering from chronic underproduction. Insufficient supply of commercial food waste causes this plant to operate at only 20% of its intended capacity, with 100% parasitic loading and virtually no profit. Another plant in Hainan Province avoided this problem by diversifying its feedstock to include municipal sludge and agricultural waste, but its economic viability is compromised by the high cost and low sale prices of its products (biogas and digestate). Mismatching managerial and technical developments are observed in other cities such as Shanghai, where a relatively stable HFW flow has been established but the downstream processing capacity is still being developed, limiting its environmental benefit.
In this sense, the Västerås case is unique in many ways. On one hand, HFW has been targeted as the main feedstock since the conception of the project, which could present an even bigger logistic issue than commercial food waste, yet an efficient and sustainable collection system has enabled the AD plant to operate at full scale and profitably for more than 16 years. On the other hand, instead of feeding the product biogas to a CHP plant for centralized utilization, it is upgraded and distributed to various corporate and private users, increasing technical complexity but also economic return. The other product, digestate, is not disposed of as waste but gainfully employed, further lowering operational costs and environmental impact. Presently, VafabMiljö is planning a large-scale upgrade, which includes modifications to the pretreatment step for more efficient and streamlined operation, and the addition of a second fermentation tank to prolong the retention time and maximize biogas productivity. The entire upscaling project was expected to be finished by 2022, on a total budget of over 100 million SEK. This indicates that to the local community, the HFW-to-biogas project presents sufficient long-term benefits, providing them with the motivation for upscaling.
According to observations made by various studies including our own, the key factors to this large-scale, sustainable HFW-to-biogas program are concluded in Table A3. The primary factor is perceived to be the active participation of the residents to source separate their HFW. Another critical decision has been to include the farming society as a major stakeholder since the conception of the project, which not only ensures a stable supply of ley crop as feedstock but also secures a productive and environment-friendly sink for the digestates, which would otherwise have to go through expensive and energy intensive treatments. Finally, the utilization of both biogas and digestate serves to dissimilate information and provide positive feedback to the stakeholders, which truly integrates the project into the local geographic, economic, and social structure and completes the recycling loop.
Consequently, there might be several ways that this study becomes useful for future applications:
  • Troubleshooting in existing AD plants receiving similar feedstock: As introduced above, many projects that target food waste are experiencing various operational problems, including but not limited to underproduction and low profit. In this sense, this case study can provide a matrix of indices. The project managers/plant operators can compare the features of this scheme with their own and analyze their material, value, and information flows, to identify the possible bottlenecks. Various means of mitigation can then be designed, such as launching a public campaign to raise awareness, upgrading technical units for higher output, securing paying customers for the product biogas and digestate, to break through the bottlenecks and enhance overall benefits.
  • Planning of future urban AD plants: in the present climate, landfill of organic waste is becoming increasingly difficult and unpopular. Chances are that more cities and towns will need better solutions for their HFW in near future. In case the biogas route is chosen, this case study could offer many pertinent pieces of information for the planning of AD plants. Such information includes the suitable scale of the fermentation unit, the mass flow and purity of HFW needed to sustain such a unit, the required level of public participation and source separation; the output of the AD unit, and the quality of the raw biogas, the utilization of the biogas and the associated technical processes, the cost and revenue to be expected, and the environmental benefit/burden caused by the digestate. The specific infrastructure around the planned project could be measured against these parameters to estimate its feasibility in certain social settings, thereby minimizing risk and increasing the chance of success.
  • Testbed for more advanced biotechnologies: Anaerobic digestion for biogas production is a proven and mature process, but not the only feasible way to utilize organic waste. Many new biotechnologies are being developed at the moment, such as the generation of hydrogen [42], medium-chain-length fatty acids [43], and single-cell proteins [44] in anaerobic/photo fermentation. These products have higher values than biogas and can further promote the development of the circular economy. The framework presented in this study could assist in the feasibility analysis of such innovative biotechnologies. In addition, when these technologies are to be implemented, pilot scale units could be set up alongside existing biogas plants to study their effects in real life. Scaling up can be performed later to upgrade such units to parallel or substitution processes for biogas production.

5. Conclusions

This study systematically analyzed the various synergetic interactions among the public, industry, agriculture, and government sectors, painting a holistic picture of Västerås’ long-term success in HFW reutilization. In 2017, 8879 tons of food waste were collected from Västerås city, which could generate 590,000 Nm3 of biomethane and support 21 biogas-powered buses. A reduction of 1052.9–1541.2 tons CO2-eq was estimated by replacing fossil fuels in vehicles and centralized composting units for HFW. The actual operating profit of this process amounted to 6.604 million Swedish Krona (SEK), and the maximized environmental economic benefit was estimated to be 3.15–3.73 million SEK/year. The mechanism underlying this success is analyzed in detail, and a high level of public participation, sufficient infrastructure, and effective information feedback is identified as the possible key factors.
Due to the limitation imposed by time and resources, this study is more focused on the scope rather than the depth of the subject. In the future, this limitation can be amended by employing more advanced sustainability assessment tools, such as those introduced by Rosen et al. [45]. It is hoped that this case study can provide vital information for industrial, academic, and municipal entities who are interested in HFW reutilization, and serve as a benchmark or reference case for similar future practices.

Author Contributions

T.L. (Tingting Liu): Conceptualization, methodology, writing—original draft preparation and reviewing. Q.Z.: formal analysis, data curation, writing—editing. X.K.: conceptualization, investigation, data curation. J.H.: conceptualization, investigation, data curation. T.L. (Tao Luo): conceptualization, investigation, data curation. Y.Z.: conceptualization, methodology, validation, writing—original draft preparation and reviewing. All authors have read and agreed to the published version of the manuscript.

Funding

This study received funding from the National Natural Science Foundation of China (42001253), the China Scholarship Council (2018 International Clean Energy Talent Program), and the National Key Research and Development Program of China (No. 2017YFE0193400).

Institutional Review Board Statement

Not applicable.

Informed Consent Statement

Not applicable.

Data Availability Statement

The datasets used or analyzed during the current study are available from the corresponding author upon reasonable request.

Acknowledgments

The authors would like to express their sincere appreciation to YAN Jinyue of Mälardalen University, Sweden, and the China Scholarship Council for organizing the 2018 International Clean Energy Talent Program, which gave rise to the study. We would also like to thank YE Chi, Miljana Mikic, Martin Larsson, LIU Chuang and BO Yu, for their help in distributing and retrieving some of the questionnaires. For much of the key information imparted in this study, Natalie Lindkvist and Jacob Bucht of VafabMiljö Kommunalförbund, and Marie Brattström of VL are to be thanked. Marie Harder of Fudan University has given valuable advice on the writing of the manuscript, which the authors appreciate very much.

Conflicts of Interest

The authors declare no conflict of interest.

Appendix A

Table A1. Feedstock to the biogas plant (approximate data) [13,14,15,34,35,36].
FeedstockFood WasteGreaseLey Crop
Annual quantity14,000~15,000 tons2000~4000 tons4000~5000 tons
Solid content30%4%35%
Volatile solid content90% of total solidNot known84% of total solid
Biogas potential100 m3/ton45 m3/ton80 m3/ton
Contribution to total energy output~74.5%~7%~18.5%
Table A2. Key technical features of several biogas plants treating food waste.
Biogas PlantBeijingSuzhouHainanLinköpingVästerås
Operational time20122009/2013 **20161997/2012 ***2005
Feedstock Restaurant food wasteCommercial food wastePig manure, municipal sludge, sugar cane slag, others (incl. food waste)Slaughterhouse waste, HFW, other industrial food wasteHFW, grease, ley silage
HFW% in feedstock0%0%<20%~40%~64%
Capacity:
designed/actual
200/40 tpd */350 tpd (2nd stage)500/233 tpd (1st stage)~ 260 tpd50~60 tpd
Conversion coefficient: designed/actual150/40 m3 raw biogas/ton/78 m3 raw biogas/ton123.5 m3 raw biogas/ton/~140 m3 raw biogas/ton86/~100 m3 raw biogas/ton
Fermentation processWet digestion: 3300 m3, 35 °C, 20 days; dry digestion: 300 m3, 30 days4 digesters, 2000 m3 each24,000 m3, 35 daysNR #Wet digestion: 4000 m3, 37–40 °C, 20 days
Raw biogas production: designed/actual30,000/1000 Nm3/day/27,500 Nm3/day30,000 Nm3/day, 55% methane/~36,000 Nm3/day~4400 Nm3/day, 65% methane
Specific fermenter productivity 0.30 m3/m3 digester volume, day2.5 m3/m3 digester volume, day1.25 m3/m3 digester volume, dayNR1.1 m3/m3 digester volume, day
Biogas usageOn-site power generation, 100% parasitic loadOn-site CHP generationUpgraded to vehicle fuel + on-site power generation, 2% parasitic loadUpgraded to vehicle fuelOn-site CHP generation + Upgraded to vehicle fuel
Other (by)product(s)Liquid digestate treated as wastewater, solids for on-site power generation10.5 tpd organic fertilizer, 45.5 tpd protein feed, 30 tpd biodiesel; 300 tpd liquid digestate treated as wastewater72,000 ton/year liquid/solid digestate, sold at low price and treated as wasteDigestate used as biofertilizer19,800 ton/year liquid+solid digestate used as bio-fertilizer
Reference[38][8][39][40]This study
* Ton per day; ** 1st/2nd stage; *** The plant was operational in 1997, but HFW was not included until 2012; # Not reported.
Table A3. Key factors for the large-scale, sustainable HFW-to-biogas program.
FactorsContents
Diversified and stable feedstock supplyCo-digestion of HFW, grease and ley crops of constant ratios enhances process stability
InfrastructurePre-establishment of HFW collection system (bags, bins, collection trucks) and biomethane utilization system (pipelines and filling stations)
Sound technologyAD equipment sourced from well-established manufacturers; centralized upgrading of biogas from 3 sources lowers the process cost; control of fugitive methane emission
Useful productsBiogas substituting diesel and digestate substituting chemical fertilizers, benefiting both urban and rural societies
Public participationFormation of HFW separation behavior before the program was initiated; sustaining the behavior by feedback on product usage
Synergic collaboration between urban and rural communitiesStable and predictable supply of ley crop as feedstock (in both quantity and quality); convenient and environment-friendly sink for the digestate; cost saving for the farmers; promotion of ecological farming, agricultural sustainability and rural employment in a wider region
Policy frameworkLandfill ban; renewable energy target; tax exemption for biomethane usage; other supporting policies for biomethane users; certification system for ecological produces (private)

References

  1. Woon, K.S.; Lo, I.M.C. A proposed framework of food waste collection and recycling for renewable biogas fuel production in Hong Kong. Waste Manag. 2016, 47, 3–10. [Google Scholar] [CrossRef] [PubMed]
  2. Wen, Z.; Wang, Y.; De Clercq, D. What is the true value of food waste? A case study of technology integration in urban food waste treatment in Suzhou City, China. J. Clean. Prod. 2016, 118, 88–96. [Google Scholar] [CrossRef]
  3. De Clercq, D.; Wen, Z.; Gottfried, O.; Schmidt, F.; Fei, F. A review of global strategies promoting the conversion of food waste to bioenergy via anaerobic digestion. Renew. Sustain. Energy Rev. 2017, 79, 204–221. [Google Scholar] [CrossRef]
  4. Browne, J.D.; Allen, E.; Murphy, J.D. Assessing the variability in biomethane production from the organic fraction of municipal solid waste in batch and continuous operation. Appl. Energy 2014, 128, 307–314. [Google Scholar] [CrossRef]
  5. Leung, D.Y.C.; Wang, J. An overview on biogas generation from anaerobic digestion of food waste. Int. J. Green Energy 2016, 13, 119–131. [Google Scholar] [CrossRef]
  6. Jin, Y.; Chen, T.; Chen, X.; Yu, Z. Life-cycle assessment of energy consumption and environmental impact of an integrated food waste-based biogas plant. Appl. Energy 2015, 151, 227–236. [Google Scholar] [CrossRef]
  7. Lantz, M. Biogas in Sweden—Opportunities and Challenges from a Systems Perspective. Ph.D. Thesis, Lund University, Lund, Sweden, 2013. [Google Scholar]
  8. De Clercq, D.; Wen, Z.; Fan, F. Performance evaluation of restaurant food waste and biowaste to biogas pilot projects in China and implications for national policy. J. Environ. Manag. 2017, 189, 115–124. [Google Scholar] [CrossRef]
  9. Pham, T.P.T.; Kaushik, R.; Parshetti, G.K.; Mahmood, R.; Balasubramanian, R. Food waste-to-energy conversion technologies: Current status and future directions. Waste Manag. 2015, 38, 399–408. [Google Scholar] [CrossRef] [PubMed]
  10. Li, C.J.; Huang, Y.; Harder, M.K. Incentives for food waste diversion: Exploration of a long term successful Chinese city residential scheme. Int. J. Green Energy 2017, 156, 491–499. [Google Scholar] [CrossRef]
  11. Lonnqvist, T.; Sanches-Pereira, A.; Sandberg, T. Biogas potential for sustainable transport—A Swedish regional case. J. Clean. Prod. 2015, 108, 1105–1114. [Google Scholar] [CrossRef]
  12. Nordlander, E.; Holgersson, J.; Thorin, E.; Thomassen, M.; Yan, J. Energy: Efficiency Evaluation of two Biogas Plants. In Proceedings of the Third International Conference on Applied Energy, Perugia, Italy, 16–18 May 2011; pp. 1661–1674. [Google Scholar]
  13. Thorin, E.; Lindmark, J.; Nordlander, E.; Odlare, M.; Dahlquist, E.; Kastensson, J.; Leksell, N.; Pettersson, C. Performance optimization of the Växtkraft biogas production plant. Appl. Energy 2012, 97, 503–508. [Google Scholar] [CrossRef]
  14. Biogas in Sweden—Best Practices. Biogas XPOSE: Sweden. 2015. Available online: http://www.biogasxpose.eu/upload/Best_practise.pdf (accessed on 21 April 2022).
  15. Kern, M.; Thomas, R. Biogas-Atlas 2014/15–Investment Guide of Fermentation of Organic Waste in Germany and Europe; Witzenhausen-Institute: Witzenhausen, Germany, 2015. [Google Scholar]
  16. Kosovska, H. The Biological Treatment of Organic Food Waste; Royal Institute of Technology: Stockholm, Sweden, 2006. [Google Scholar]
  17. Amlinger, F.; Peyr, S.; Cuhls, C. Green house gas emissions from composting and mechanical biological treatment. Waste Manag. Res. 2008, 26, 47–60. [Google Scholar] [CrossRef] [PubMed]
  18. Myhre, G.; Schindell, D. Anthropogenic and Natural Radiative Forcing. In Climate Change 2013: The Physical Science Basis; Contribution of Working Group I to the Fifth Assessment Report of the Intergovernmental Panel on Climate Change; Cambridge University Press: Cambridge, UK, 2013. [Google Scholar]
  19. Zhang, S.; Wu, Y.; Liu, H.; Huang, R.; Yang, L.; Li, Z.; Fu, L.; Hao, J. Real-world fuel consumption and CO2 emissions of urban public buses in Beijing. Appl. Energy 2014, 113, 1645–1655. [Google Scholar] [CrossRef]
  20. Tools for Consumers and Designers of Solar. SunEarthTools.com. Available online: https://www.sunearthtools.com/tools/CO2-emissions-calculator.php (accessed on 7 April 2021).
  21. Kollamthodi, S.; Norris, J.; Dun, C.; Brannigan, C.; Twisse, F.; Biedka, M.; Bates, J. The Role of Natural Gas and Biomethane in the Transport Sector; Transport and Environment Report ED61479; Ricardo Energy & Environment: Didcot, UK, 2016. [Google Scholar]
  22. VafabMiljö Årsredovisning; VafabMiljö Kommunalförbund: Västerås, Sweden, 2017.
  23. Swedish Petroleum & Biofuels Institute: Sales Points Renewable Transport Fuels. 2017. Available online: http://www.spbi.se (accessed on 21 April 2017).
  24. Swedish Tax Agency: Tax Exemptions for Transport Biofuels. 2017. Available online: http://www.skatteverket.se (accessed on 21 April 2017).
  25. Svenskt Gastekniskt Center, A.B. Basic Data on Biogas, 2nd ed.; Swedish Gas Technology Centre Ltd. (SGC): Malmoe, Sweden, 2012. [Google Scholar]
  26. Liu, T.; Liu, Y.; Wu, S.; Xue, J.; Wu, Y.; Li, Y.; Kang, X. Restaurants’ behaviour, awareness, and willingness to submit waste cooking oil for biofuel production in Beijing. J. Clean. Prod. 2018, 204, 636–642. [Google Scholar] [CrossRef]
  27. Liu, T.; Wu, Y.; Tian, X.; Gong, Y. Urban household solid waste generation and collection in Beijing, China. Resour. Conserv. Recycl. 2015, 104, 31–37. [Google Scholar] [CrossRef]
  28. Swedish, E.P.A. Food Waste Volumes in Sweden; Swedish Environmental Protection Agency: Stockholm, Sweden, 2013. [Google Scholar]
  29. Bauer, F.; Hulteberg, C.; Persson, T.; Tamm, D. Biogas Upgrading—Review of Commercial Technologies; SGC Rapport: Malmoe, Sweden, 1 April 2013. [Google Scholar]
  30. De Clercq, D.; Wen, Z.; Fan, F.; Caicedo, L. Biomethane production potential from restaurant food waste in megacities and project level-bottlenecks: A case study in Beijing. Renew. Sustain. Energy Rev. 2016, 59, 1676–1685. [Google Scholar] [CrossRef]
  31. De Clercq, D.; Wen, Z.; Fan, F. Economic performance evaluation of bio-waste treatment technology at the facility level. Resour. Conserv. Recycl. 2017, 116, 178–184. [Google Scholar] [CrossRef]
  32. Fallde, M.; Eklund, M. Towards a sustainable socio-technical system of biogas for transport: The case of the city of Linköping in Sweden. J. Clean. Prod. 2015, 98, 17–28. [Google Scholar] [CrossRef]
  33. Monson, K.D.; Esteves, S.R.; Guwy, A.J.; Dinsdale, R.M. Anaerobic Digestion of Source Segregated Biowastes—Case Study; Sustainable Environment Research Centre: Newport, UK, 2007. [Google Scholar]
  34. Lindmark, J.; Leksell, N.; Schnurer, A.; Thorin, E. Effects of mechanical pre-treatment on the biogas yield from ley crop silage. Appl. Energy 2012, 97, 498–502. [Google Scholar] [CrossRef]
  35. Held, J.; Mathiasson, A.; Nylander, A. Biogas from Manure and Waste Products-Swedish Case Studies; Gas Centre, Swedish Gas Association, Swedish Biogas Association: Stockholm, Sweden, 2008. [Google Scholar]
  36. Chiew, Y.L.; Spangberg, J.; Baky, A.; Hansson, P.A.; Jonsson, H. Environmental impact of recycling digested food waste as a fertilizer in agriculture—A case study. Resour. Conserv. Recycl. 2015, 95, 1–14. [Google Scholar] [CrossRef]
  37. Bernstad, A.; Jansen, J.L. A life cycle approach to the management of household food waste—A Swedish full-scale case study. Waste Manag. 2011, 31, 1879–1896. [Google Scholar] [CrossRef] [PubMed]
  38. Feiz, R. Biogas potential for improved sustainability in Guangzhou, China—A study focusing on food waste on Xiaoguwei Island. Sustainability 2009, 11, 1556. [Google Scholar] [CrossRef]
  39. Banks, C.J.; Chesshire, M.; Heaven, S.; Arnold, R. Anaerobic digestion of source-segregated domestic food waste: Performance assessment by mass and energy balance. Bioresour. Technol. 2011, 102, 612–620. [Google Scholar] [CrossRef] [PubMed]
  40. Xu, C.; Shi, W.; Hong, J.; Zhang, F.; Chen, W. Life cycle assessment of food waste-based biogas generation. Renew. Sustain. Energy Rev. 2015, 49, 169–177. [Google Scholar] [CrossRef]
  41. Koido, K.; Takeuchi, H.; Hasegawa, T. Life cycle environmental and economic analysis of regional-scale food-waste biogas production with digestate nutrient management for fig fertilization. J. Clean. Prod. 2018, 190, 552–562. [Google Scholar] [CrossRef]
  42. Policastro, G.; Cesaro, A.; Fabbricino, M. Photo-fermentative hydrogen production from cheese whey: Engineering of a mixed culture process in a semi-continuous, tubular photo-bioreactor. Int. J. Hydrogen Energy 2022. [Google Scholar] [CrossRef]
  43. Yousuf, A.; Bastidas-Oyanedel, J.; Schmidt, J.E. Effect of total solid content and pretreatment on the production of lactic acid from mixed culture dark fermentation of food waste. Waste Manag. 2018, 77, 516–521. [Google Scholar] [CrossRef] [PubMed]
  44. Gervasi, T.; Pellizzeri, V.; Calabrese, G.; Bella, G.D.; Cicero, N.; Dugo, G. Production of single cell protein (SCP) from food and agricultural waste by using Saccharomyces cerevisiae. Nat. Prod. Res. 2018, 32, 648–653. [Google Scholar] [CrossRef]
  45. Rosen, M.A. Environmental sustainability tools in the biofuel industry. Biofuel Res J. 2018, 17, 751–752. [Google Scholar] [CrossRef] [Green Version]
Figure 1. Analysis framework of the HFW-to-biogas process.
Sustainability 14 11925 g001
Figure 2. The structure of the operating profits of the Vafab biogas project.
Sustainability 14 11925 g002
Figure 3. The logistic flow of food waste collection and transportation in Västerås.
Sustainability 14 11925 g003
Figure 4. Flow of material, energy, and services in Västerås biogas project, highlighting those related to food, HFW, and individual citizens.
Sustainability 14 11925 g004
Figure 5. Circulation of value in the HFW-to-biogas process.
Sustainability 14 11925 g005
Figure 6. A biogas-powered bus in Västerås.
Sustainability 14 11925 g006
Table 1. Emission factors for diesel and methane-powered vehicles.
Vehicles Type/Emission (mg/km)NOxSO2PM
Small rigid truck/diesel2911.9116.1
Small rigid truck/methane29101.6
Table 2. Coefficients and factors used for the calculation of environmental benefits.
CoefficientSignificanceUnitValueReference
eHFW conversion to biogasNm3 biogas/ton wet weight100Field survey
e1GHG emission from open-window compostingkg CO2-eq/ton wet weight30–85[17]
e2Methane content in raw biogas%65Field survey
e3Methane content in upgraded biomethane%97–98Field survey
e′Energy density of biomethanekWh/Nm39.7Field survey
e4Consumption rate of biomethane by heavy vehiclesm3/100 km57Field survey
e5Consumption rate of diesel by heavy vehiclesL/100 km32.1[18]
e6Emission factor of diesel as heavy vehicle fuelkg CO2-eq/L diesel consumed2.63[19]
Table 3. Carbon and energy taxes for several types of transportation fuels.
FUEL TypeEnergy Intensity [24]Energy TaxCO2 TaxTotal Tax
SEK/L or Nm3SEK/kWhSEK/L or Nm3SEK/kg CO2SEK/L or Nm3SEK/kWh
Diesel9.8 kWh/L2.490.253.241.275.730.58
Biomethane9.7 kWh/Nm3000000
Table 4. Characteristics of the digestates from Växtkraft plant.
DigestateAnnual QuantitySolid ContentOrganic ContentN ContentP Content
Solid2300–6500 tons25–30%21%8.2 kg/ton2.4 kg/ton
Liquid13,000–21,000 tons2–4%3%4.3 kg/ton0.4 kg/ton
Table 5. The percentages of subscribers who choose to separate their waste in Västerås.
Type of SubscriberTotal No.Those Choosing to SeparatePercentage
House17,45216,98897.3%
Apartment building1769175599.2%
Business1663152691.8%
Summer houses99194695.5%
Table 6. Standards of the fixed fees for household waste collection in Västerås, 2017.
Type of SubscriberFee (SEK/Year)
House1491
Apartment883
Business819
Resort778
Table 7. Payment of waste collection and processing fees in Västerås, 2017 (in SEK).
TypeFixed FeeVariable FeeTotal
House26,020,93217,411,85643,432,788
Apartment1,562,0271,673,3643,235,391
Business1,361,9971,916,3763,278,373
Resort770,9981,040,4241,811,422
Total29,715,95422,042,02051,757,974
Excluding business28,353,95720,125,64448,479,601
Table 8. The economic value of HFW-to-biogas operation for Vafab.
CategoryValue (Million SEK)
Operating Revenue60.16
  Collection and handling fees48.48
  Biogas sales revenue11.68
Operating Costs53.556
  Capital cost17.695
  Labor cost4.827
  Other operations and maintenance costs (including transportation)26.854
  Other external costs4.18
Operating profit6.604
Table 9. Socioeconomic characteristics of the respondents.
VariableGroupNumberSample
Proportion
Value
Assignment
Average
Value
Standard
Deviation
GenderMale5053%11.50.5
Female4547%2
Age<1877% 37.414.7
18–302627%
31–402526%
41–502021%
>501718%
EducationJunior high school and below1213%12.70.97
High school2830%2
College and Undergraduate3233%3
Graduate2324%4
Annual Income>400k SEK3739%12.21.2
300–400 k SEK2021%2
200–300 k SEK1819%3
<200 k SEK1920%4
Table 10. Driving factors for residents’ participation in the food waste separation.
DimensionFactorAverage ValueStandard
Deviation
ValueI feel proud of doing that.4.161.20
I feel it is good for environmental protection and resource recycling.4.750.65
MoralityI am afraid of being judged by other people.1.741.11
I feel guilty if I do not sort food waste.3.531.48
HabitI was told to do that when I was younger.3.071.57
People around me are doing that, so am I.3.101.33
FacilityI can get the brown bags for food waste for free and conveniently.4.391.12
There is a special food waste bin for collection.4.231.20
IncentiveI know that food waste can be used for biogas buses, so I separate food waste.4.191.25
I can get money or other material rewards from sorting.1.771.29
PenaltyI will get a penalty if I do not sort food waste.1.761.34
Publisher’s Note: MDPI stays neutral with regard to jurisdictional claims in published maps and institutional affiliations.

