
Impact of a Carbon Tax on Energy Transition in a Deregulated Market: A Game-Based Experimental Approach

Abstract
:1. Introduction
2. Game Model Design
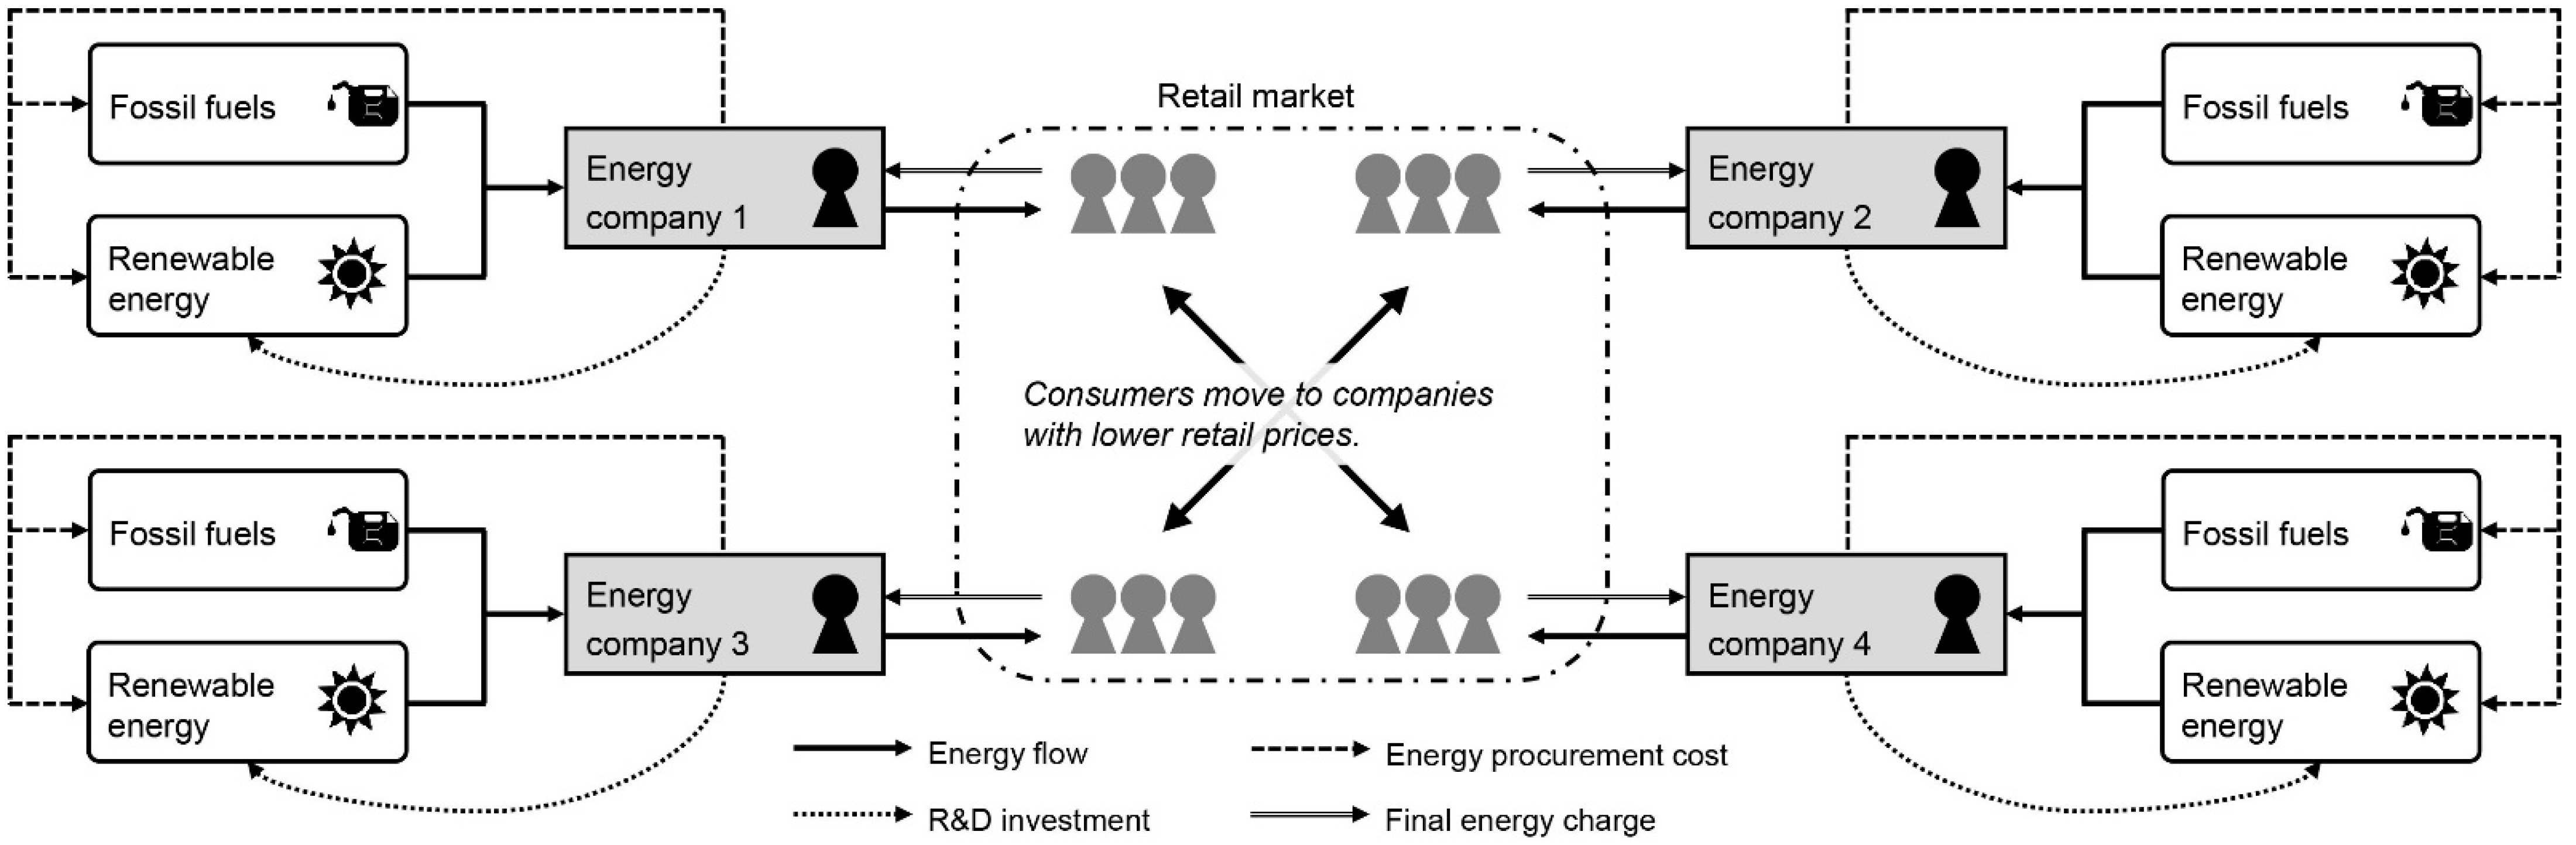
2.1. Structural Conditions
2.1.1. Participant Role
2.1.2. Price Competition
2.1.3. Energy Prices
2.1.4. Incomplete Information
2.1.5. Social Dilemma
2.1.6. Carbon Tax
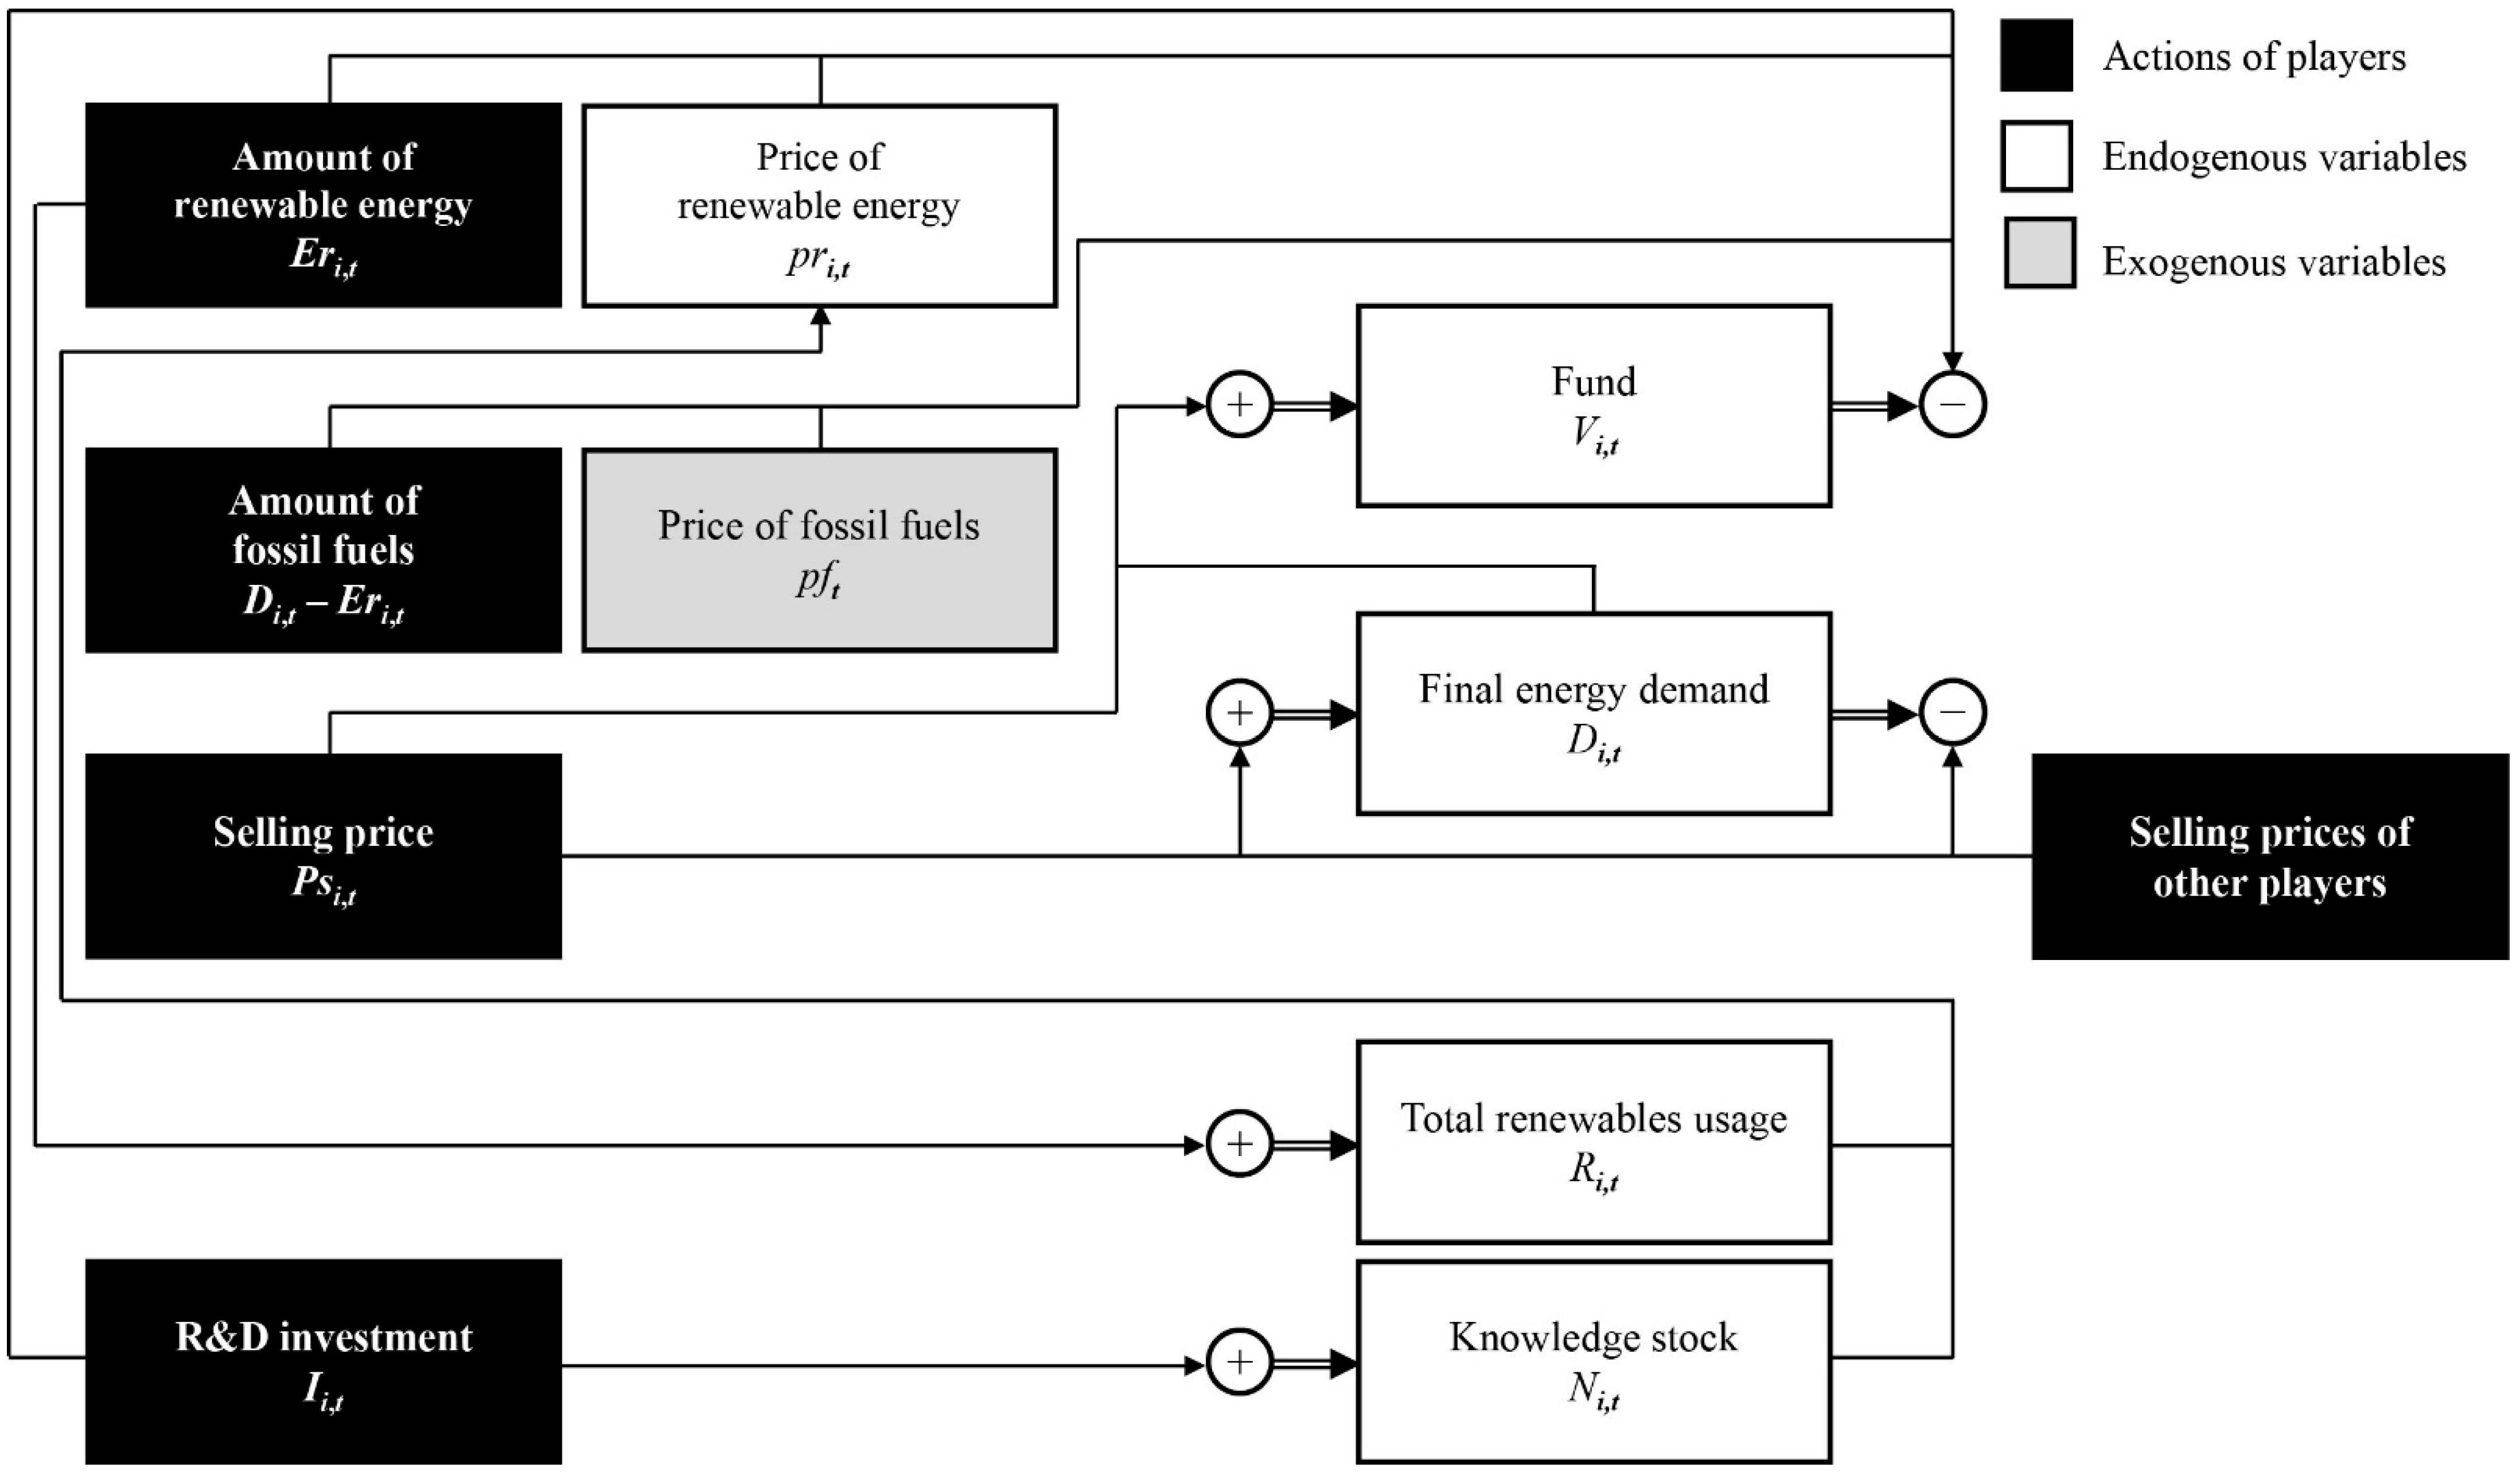
2.2. Formal Model
2.3. Experimental Conditions
2.3.1. Numbers of Players and Rounds
2.3.2. Parameter Settings
2.3.3. Parameters and Optimal Actions
3. Experimental Design
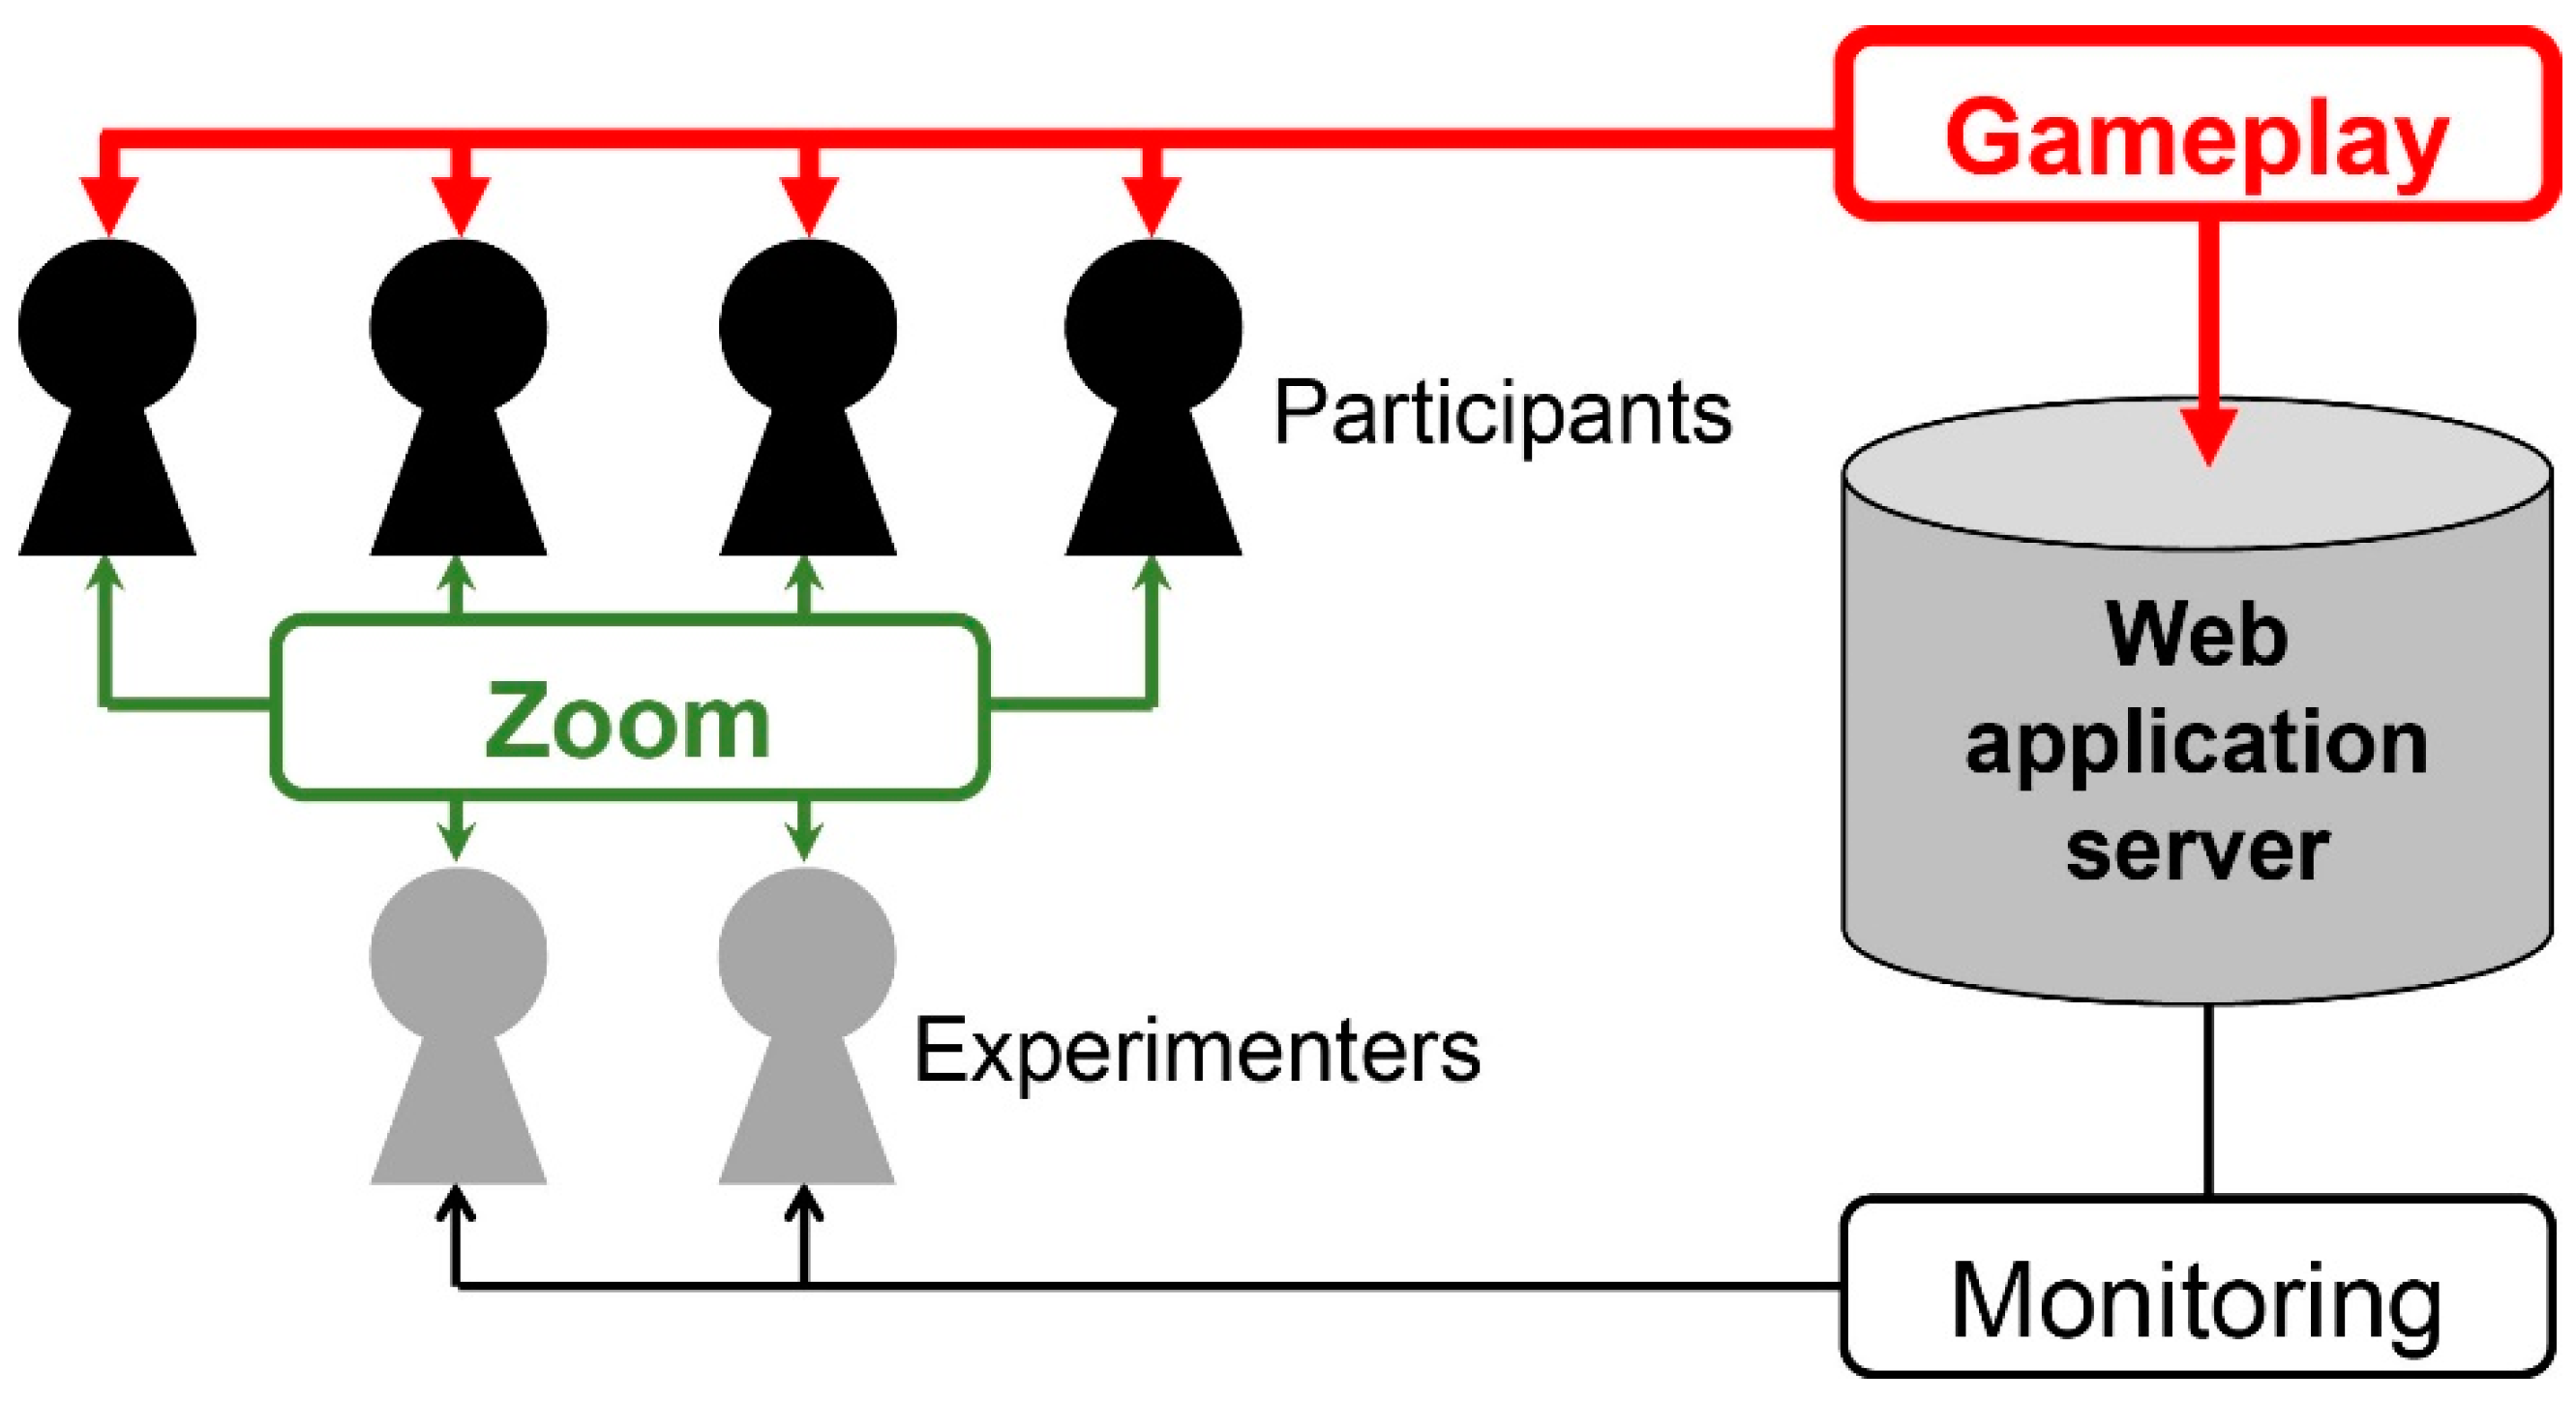
3.1. Experimental Environment and Procedures
3.2. Questionnaire Survey
4. Results
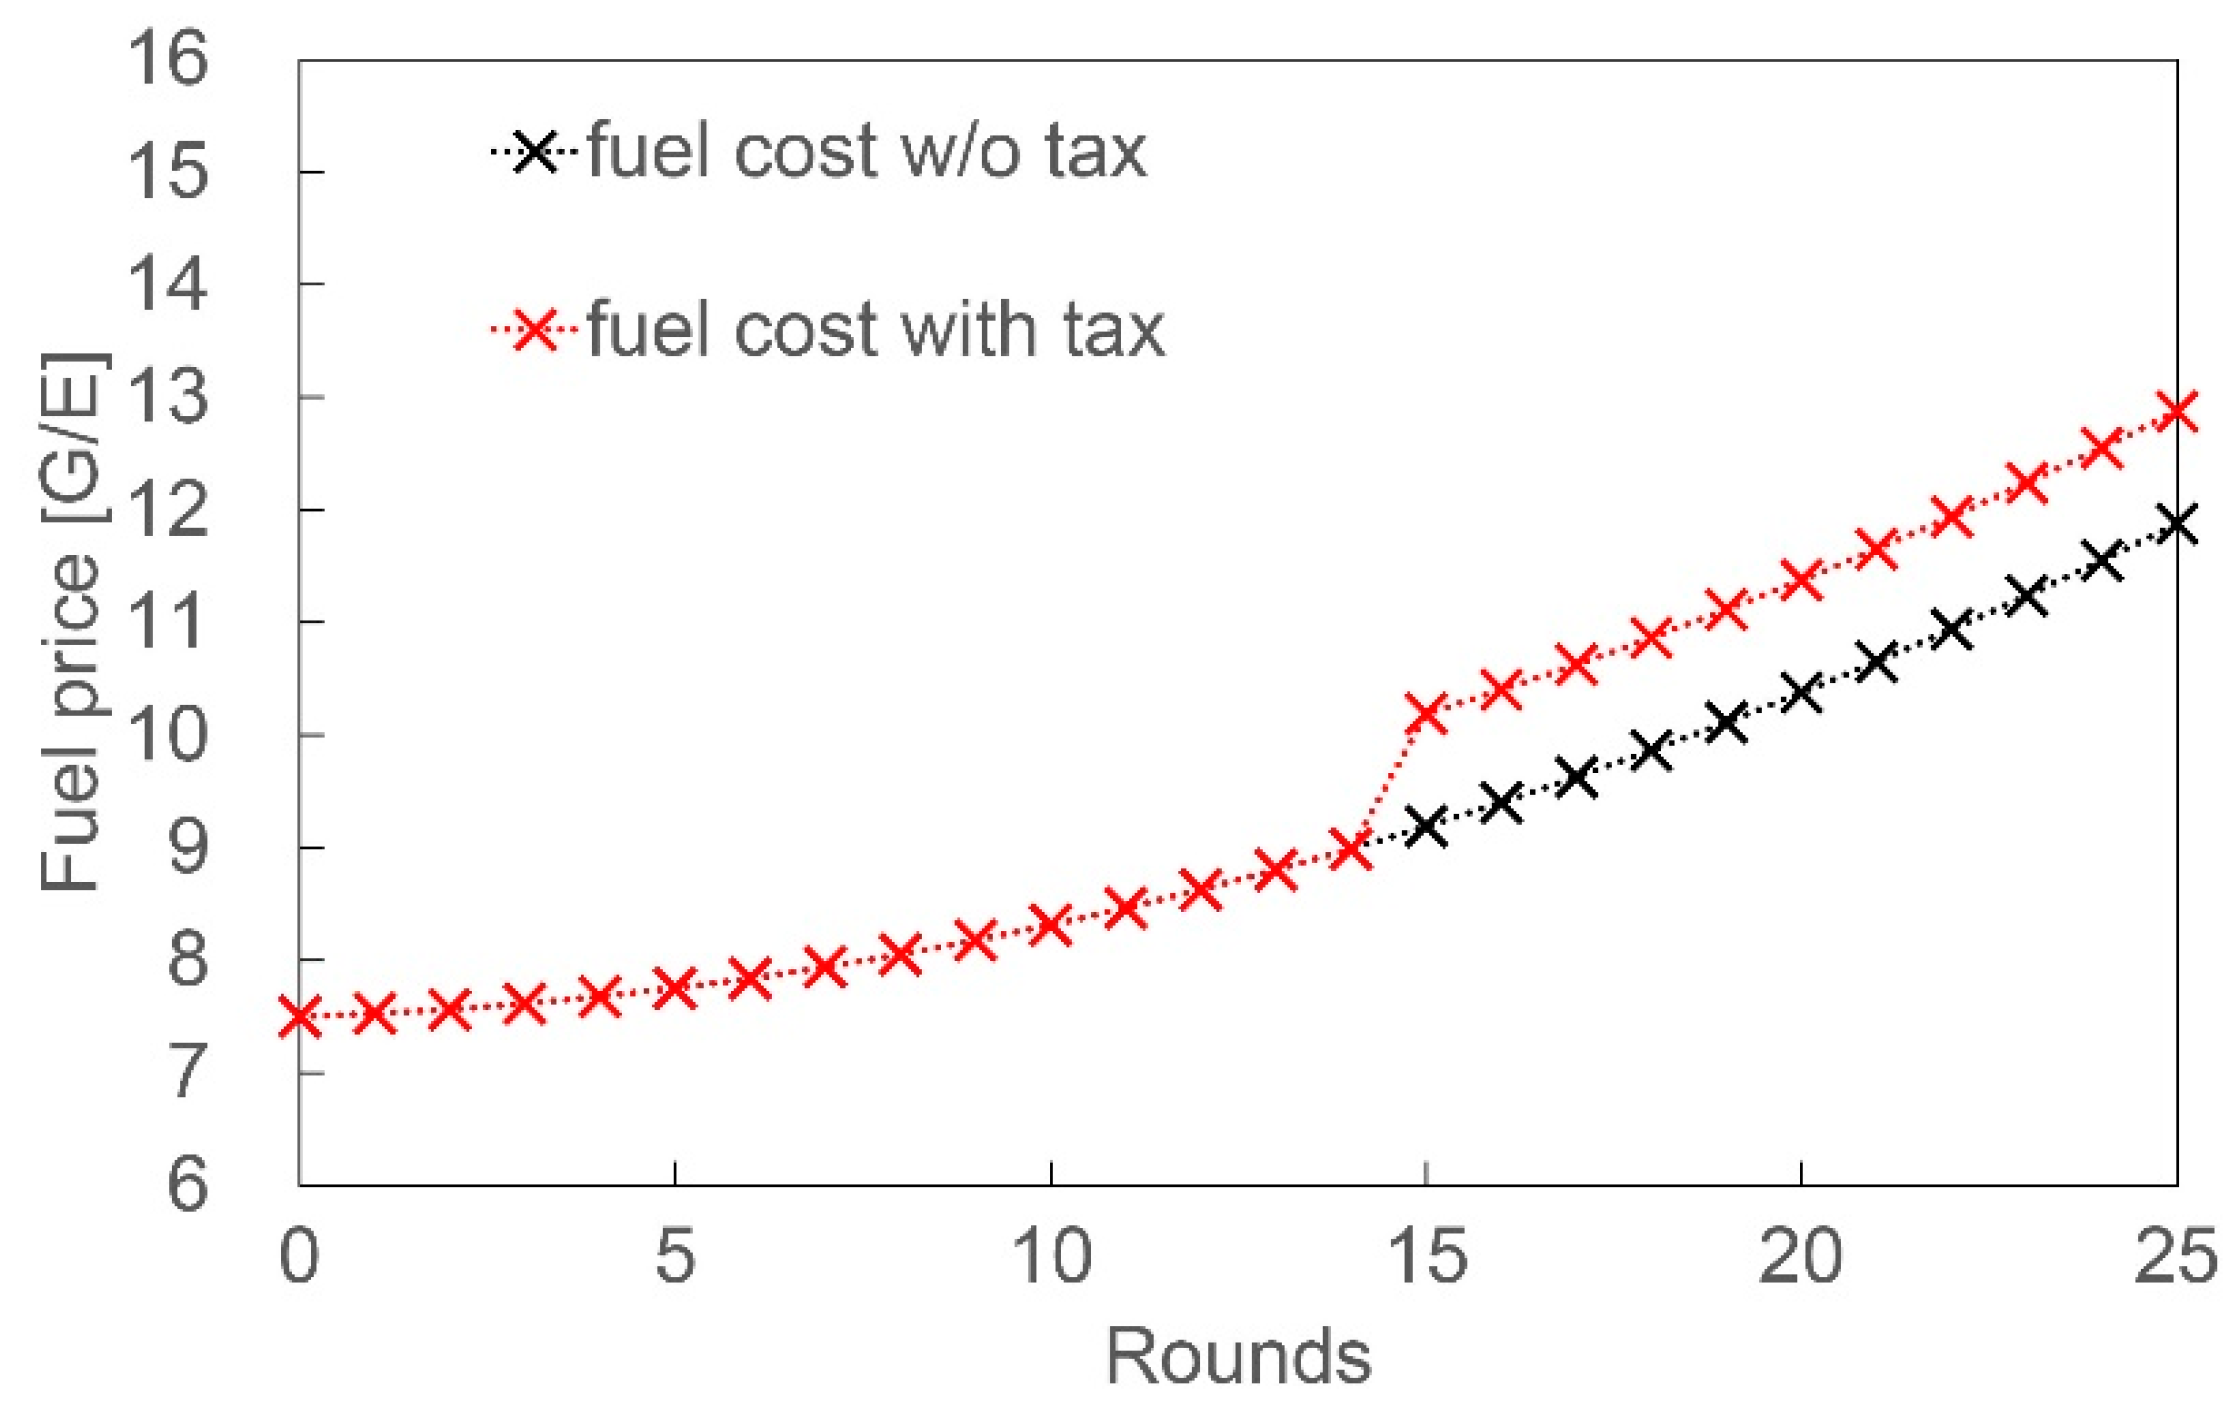
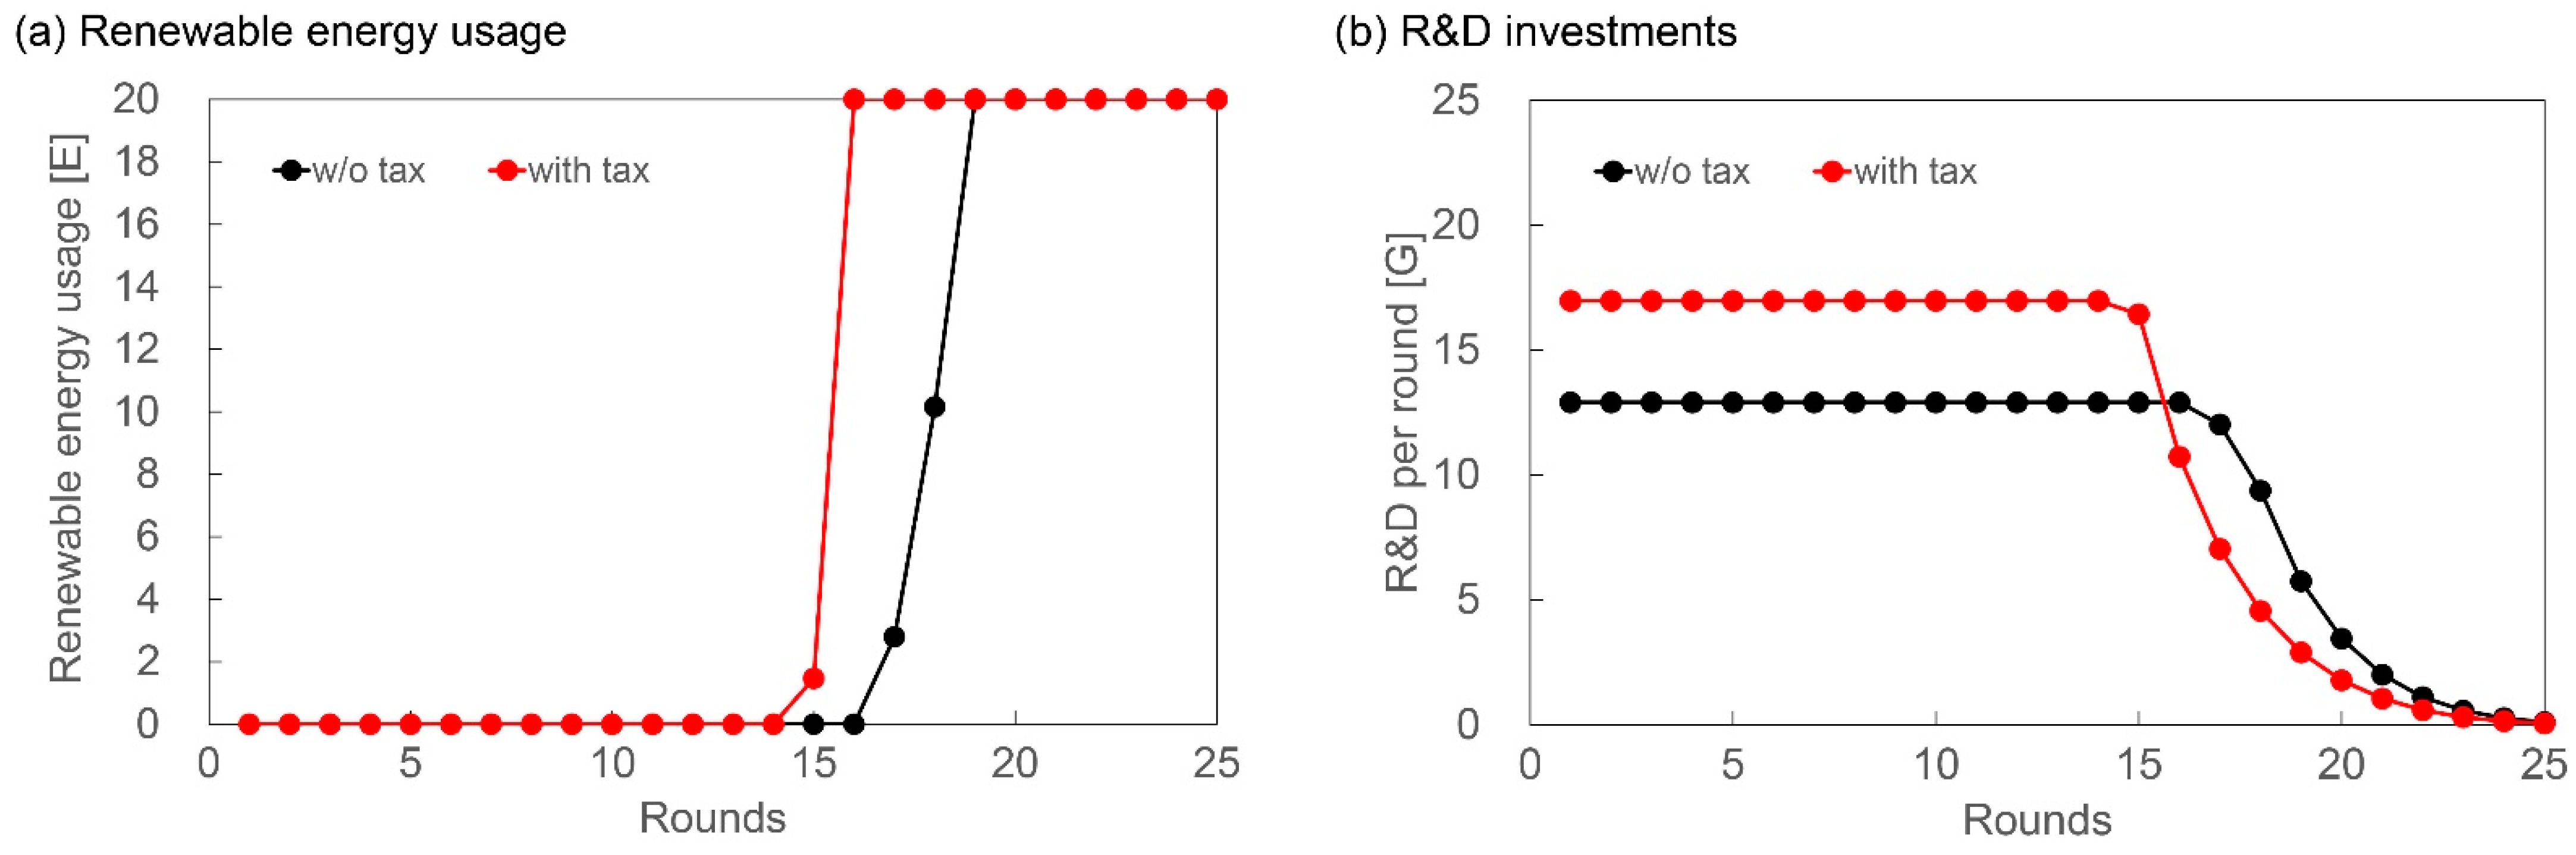
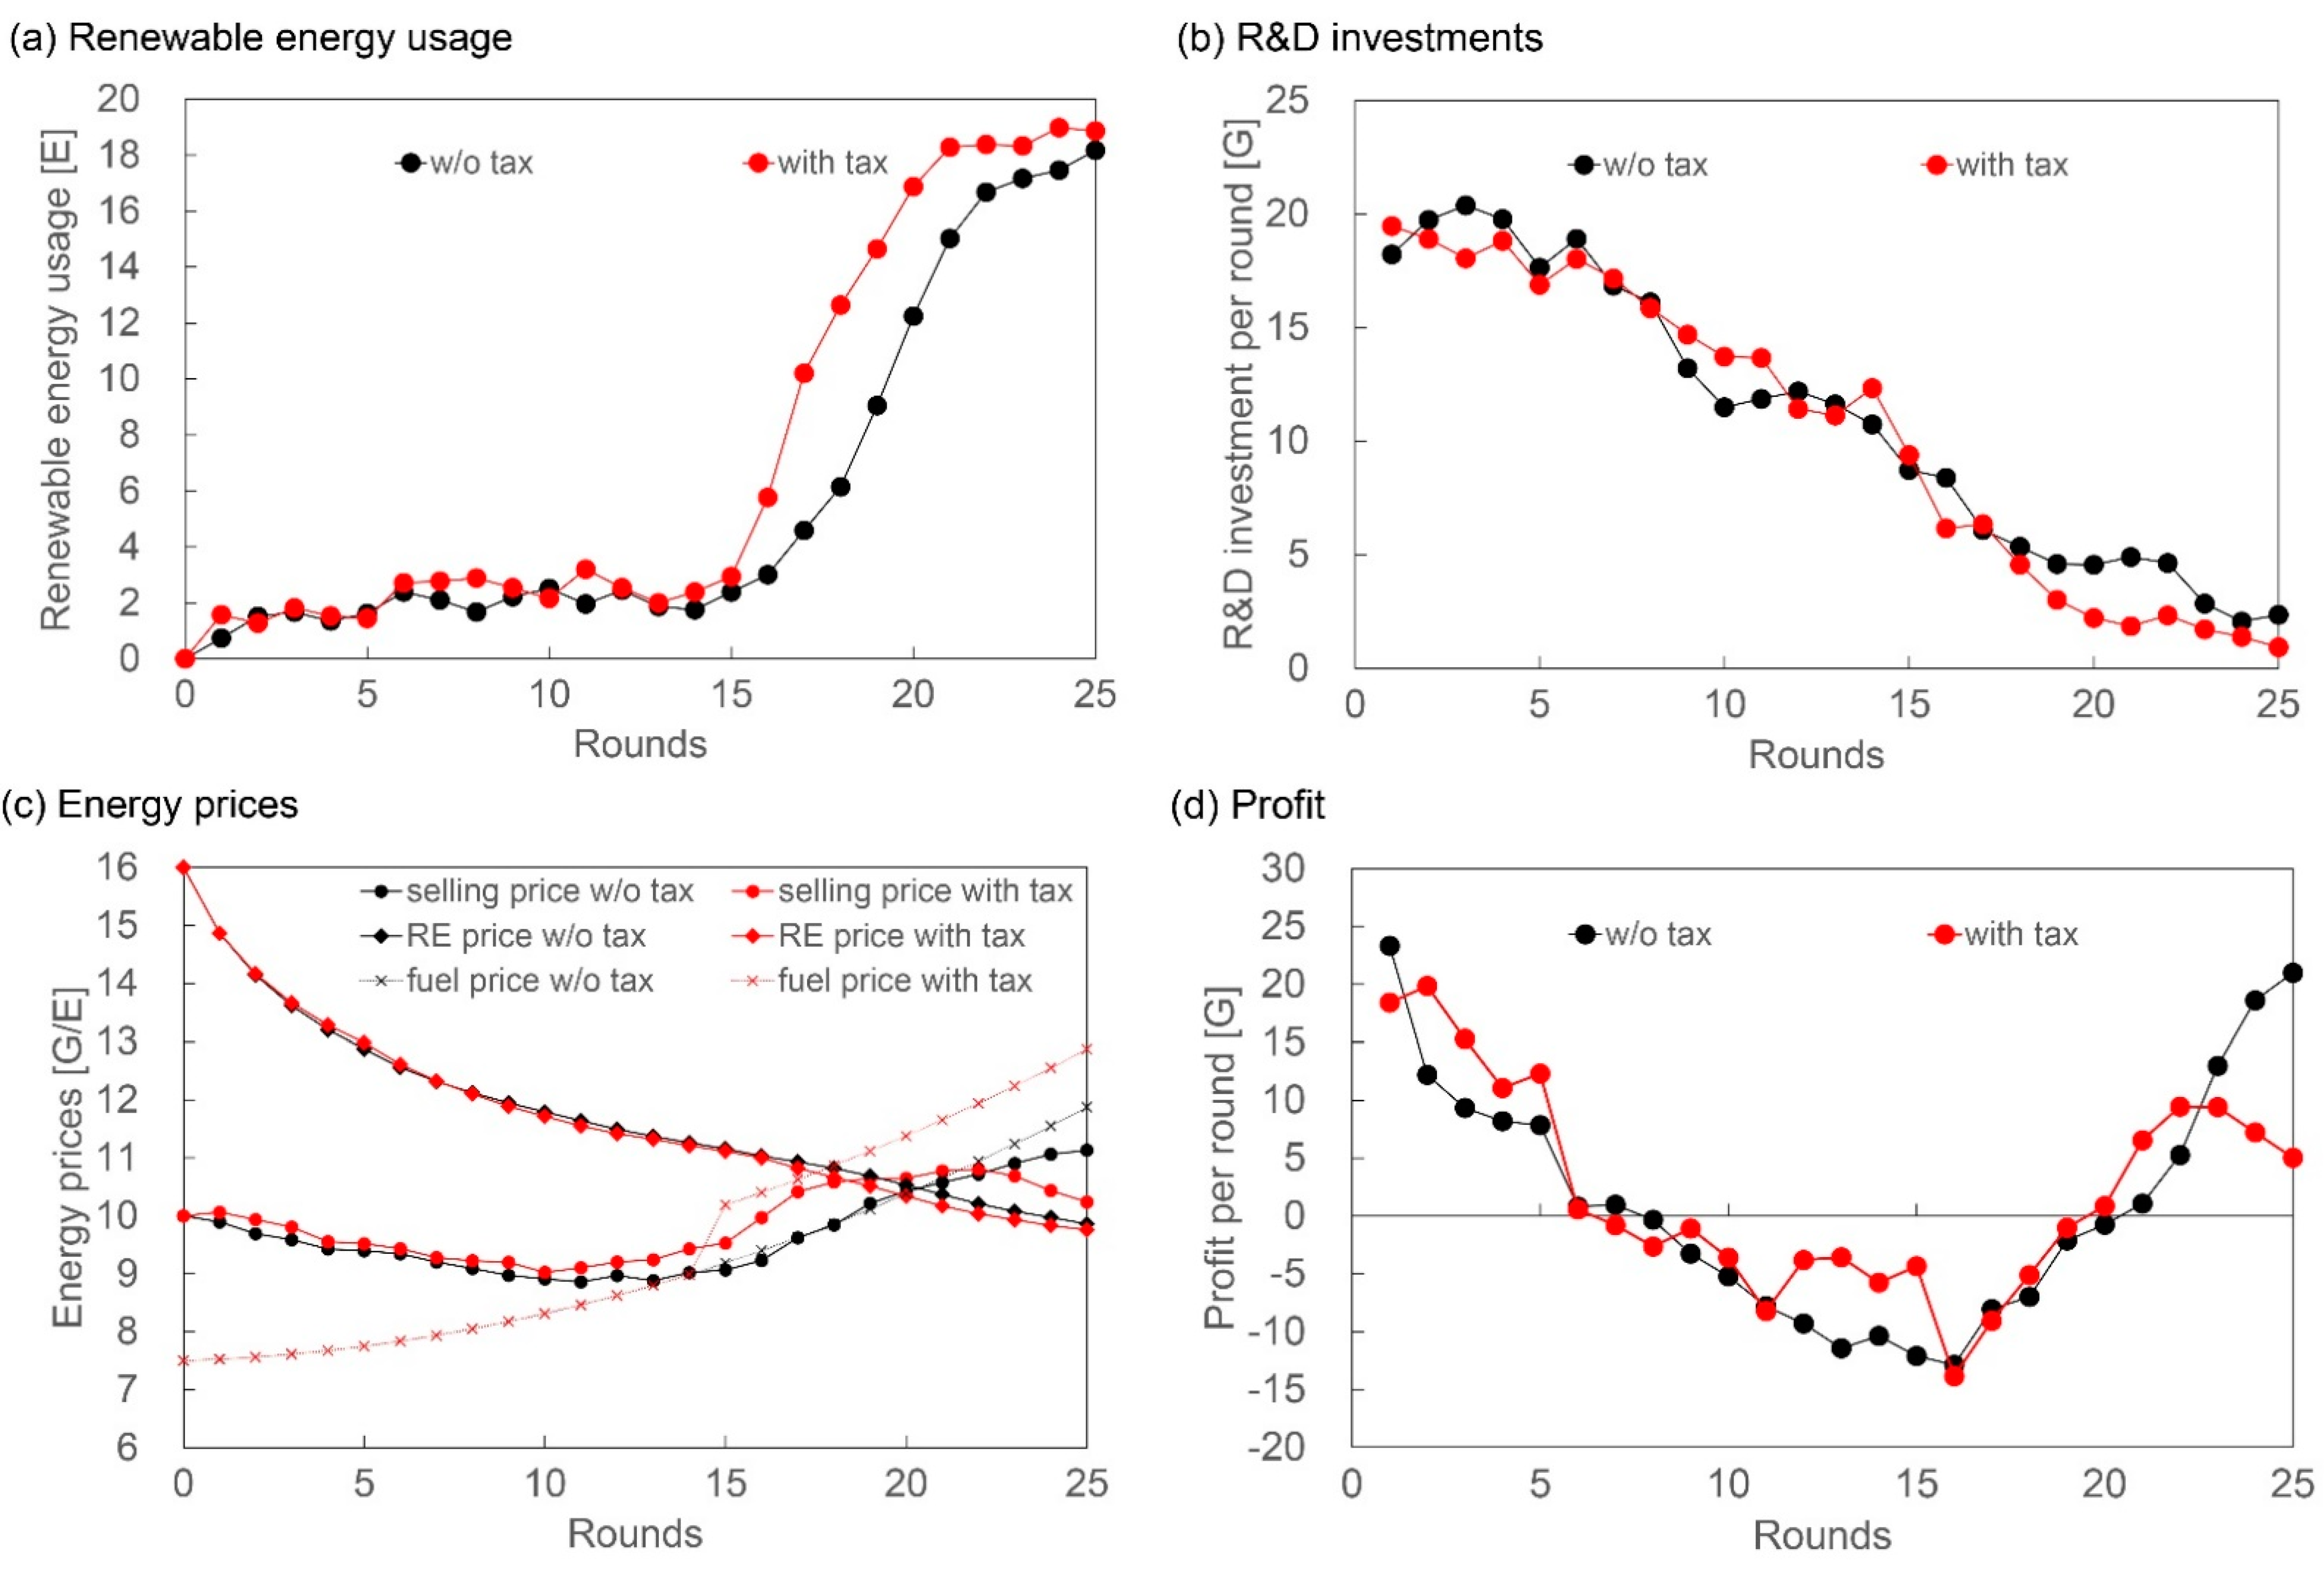
4.1. Gameplay Records
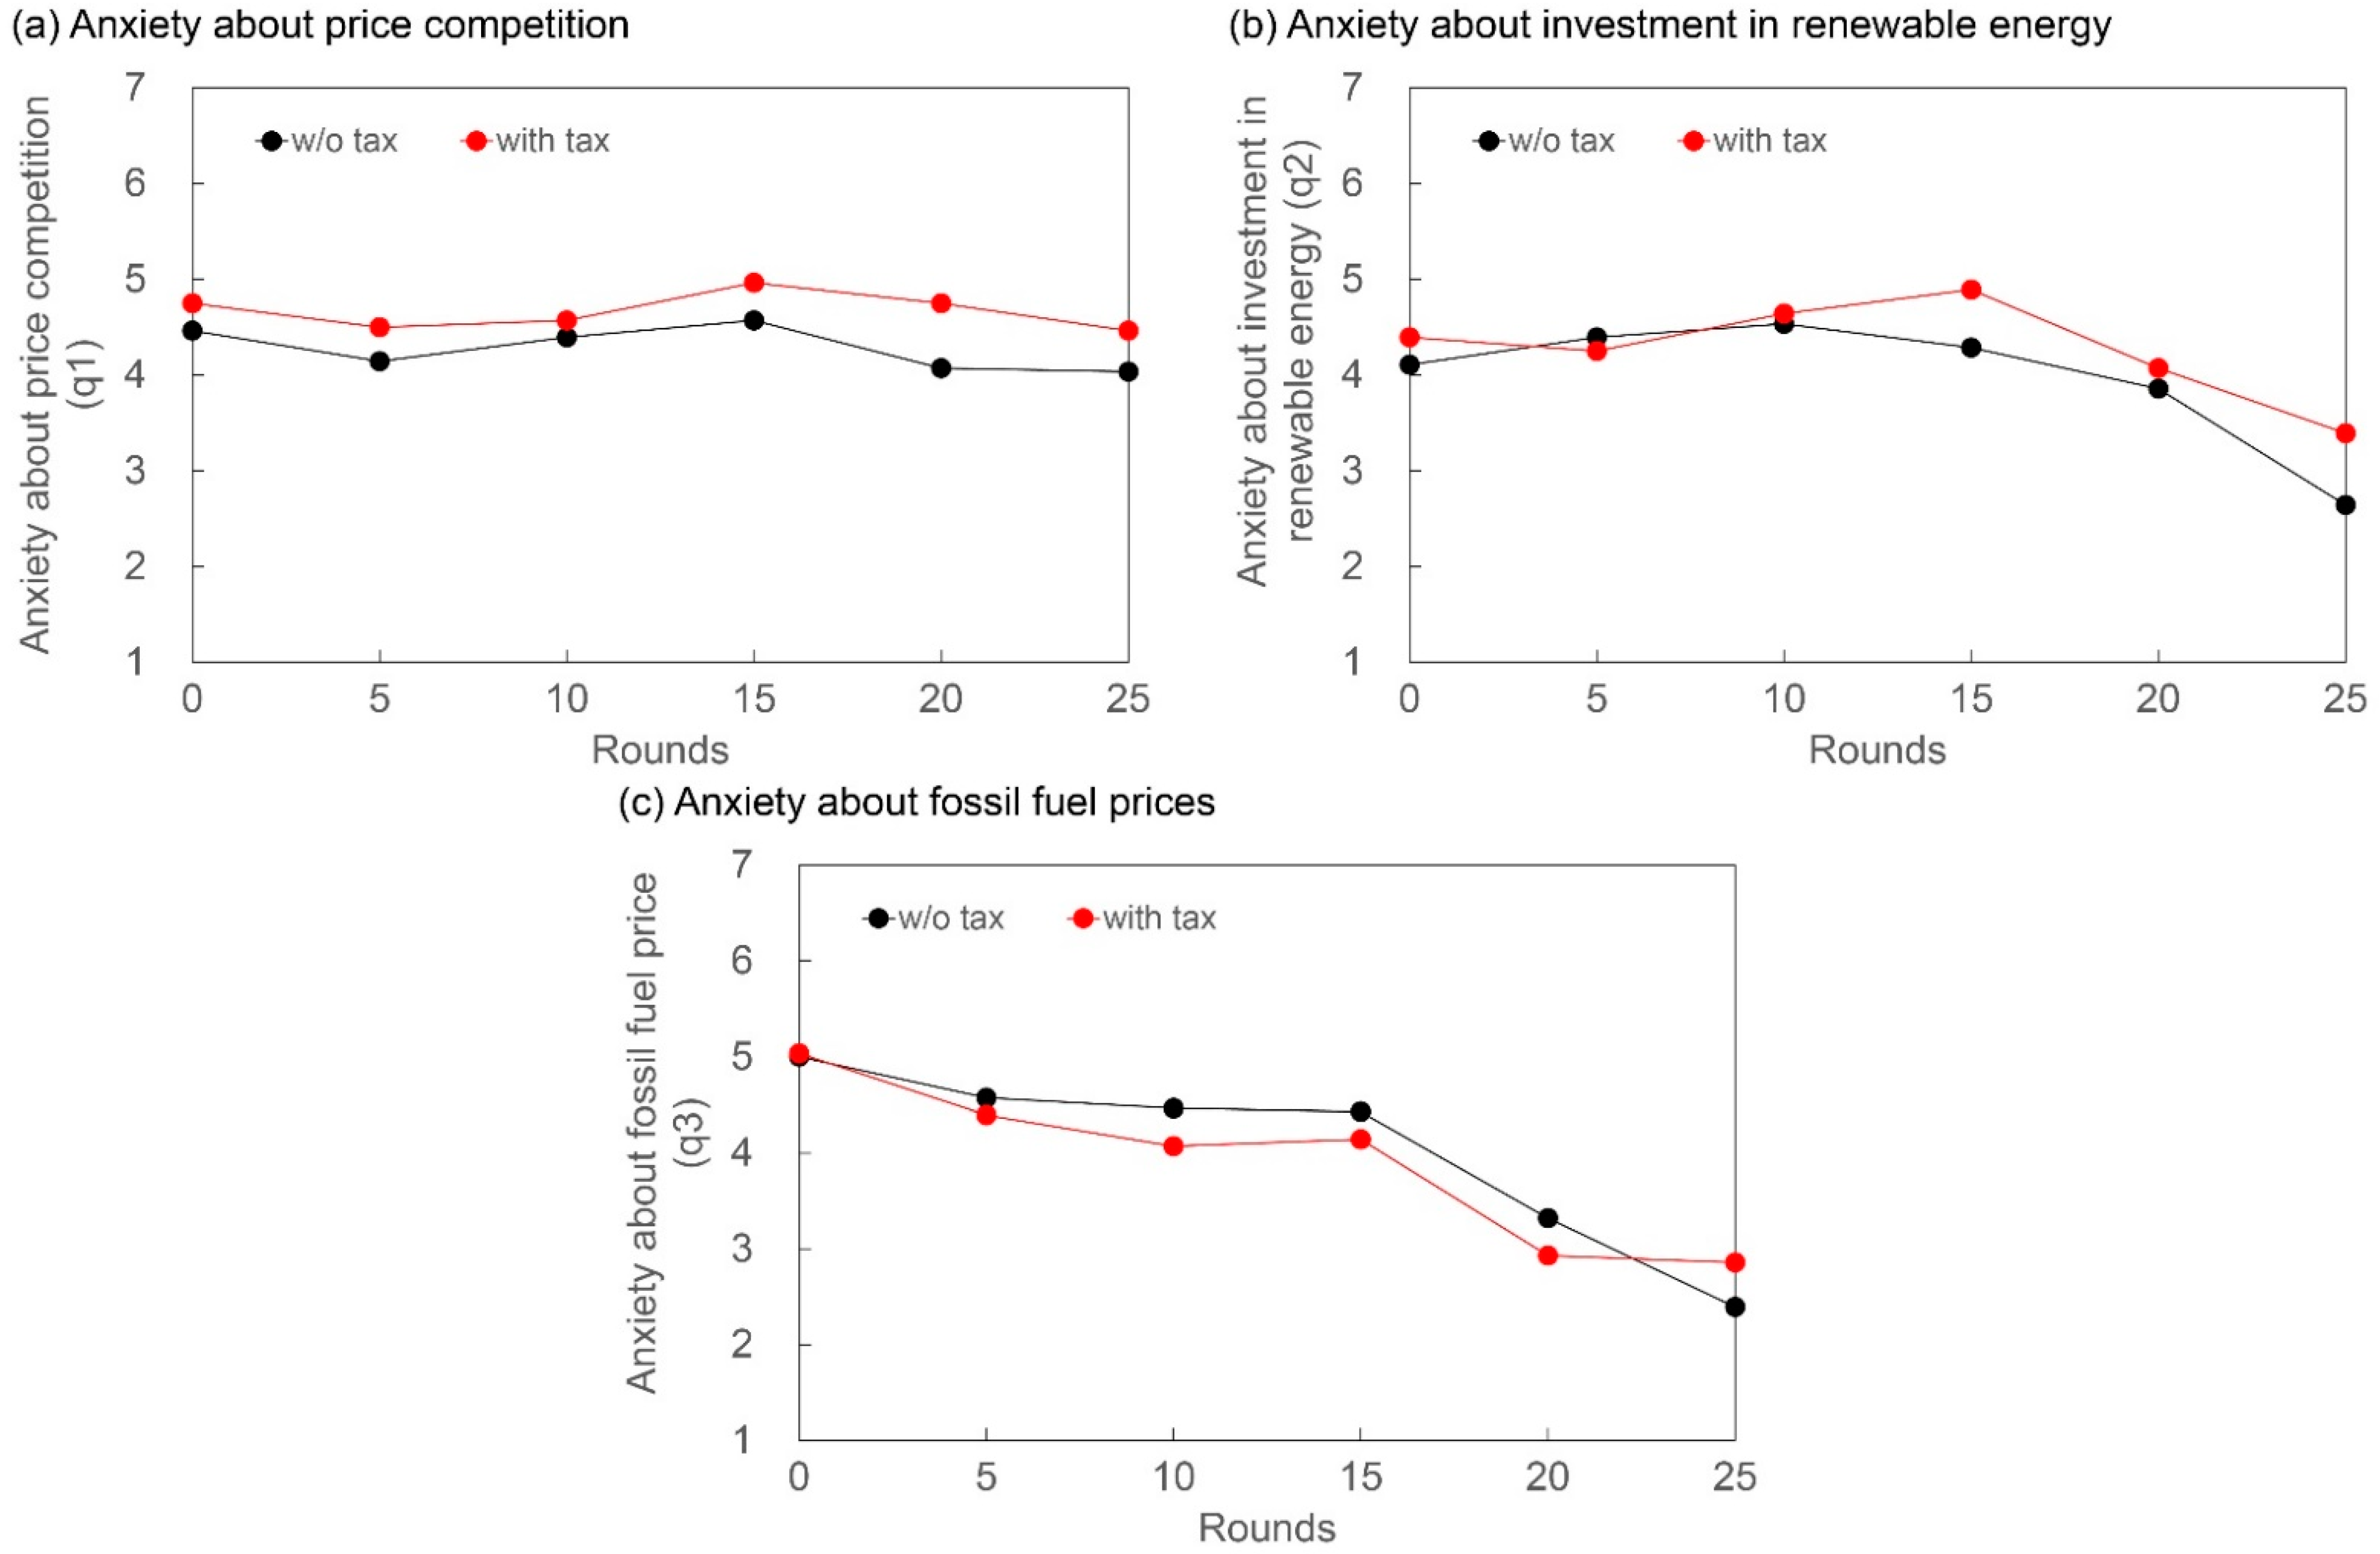
4.2. Questionnaire Responses
5. Discussion
6. Conclusions
Author Contributions
Funding
Institutional Review Board Statement
Informed Consent Statement
Data Availability Statement
Conflicts of Interest
References
- Jackson, R.B.; Friedlingstein, P.; Le Quéré, C.; Abernethy, S.; Andrew, R.M.; Canadell, J.G.; Ciais, P.; Davis, S.J.; Deng, Z.; Liu, Z.; et al. Global fossil carbon emissions rebound near pre-COVID-19 levels. Environ. Res. Lett. 2022, 17, 031001. [Google Scholar] [CrossRef]
- British Petroleum (BP) Statistical Review of World Energy. Available online: https://www.bp.com/en/global/corporate/energy-economics/statistical-review-of-world-energy.html (accessed on 12 August 2022).
- The Intergovernmental Panel on Climate Change (IPCC) Assessment Report. Available online: https://www.ipcc.ch/report/sixth-assessment-report-cycle/ (accessed on 12 August 2022).
- Global Warming of 1.5 °C. Available online: https://www.ipcc.ch/sr15/ (accessed on 12 August 2022).
- Becker, S.; Frew, B.A.; Andresen, G.B.; Zeyer, T.; Schramm, S.; Greiner, M.; Jacobson, M.Z. Features of a fully renewable US electricity system: Optimized mixes of wind and solar PV and transmission grid extensions. Energy 2014, 72, 443–458. [Google Scholar] [CrossRef] [Green Version]
- Brown, T.W.; Bischof-Niemz, T.; Blok, K.; Breyer, C.; Lund, H.; Mathiesen, B.V. Response to ‘Burden of proof: A comprehensive review of the feasibility of 100% renewable-electricity systems’. Renew. Sustain. Energy Rev. 2018, 92, 834–847. [Google Scholar] [CrossRef]
- Delucchi, M.A.; Jacobson, M.Z. Providing all global energy with wind, water, and solar power, Part II: Reliability, system and transmission costs, and policies. Energy Policy 2011, 39, 1170–1190. [Google Scholar] [CrossRef]
- Elliston, B.; MacGill, L.; Diesendorf, M. Least cost 100% renewable electricity scenarios in the Australian National Electricity Market. Energy Policy 2013, 59, 270–282. [Google Scholar] [CrossRef]
- Gils, H.C.; Scholz, Y.; Pregger, T.; de Tena, D.L.; Heide, D. Integrated modelling of variable renewable energy-based power supply in Europe. Energy 2017, 123, 173–188. [Google Scholar] [CrossRef] [Green Version]
- Jacobson, M.Z.; Delucchi, M.A. Providing all global energy with wind, water, and solar power, Part I: Technologies, energy resources, quantities and areas of infrastructure, and materials. Energy Policy 2011, 39, 1154–1169. [Google Scholar] [CrossRef]
- Jacobson, M.Z.; Delucchi, M.A. Response to Trainer’s second commentary on a plan to power the world with wind, water, and solar power. Energy Policy 2013, 57, 641–643. [Google Scholar] [CrossRef]
- Lenzen, M.; McBain, B.; Trainer, T.; Juette, S.; Rey-Lescure, O.; Huang, J. Simulating low-carbon electricity supply for Australia. Appl. Energy 2016, 179, 553–564. [Google Scholar] [CrossRef]
- Rodriguez, R.A.; Becker, S.; Andresen, G.B.; Heide, D.; Greiner, M. Transmission needs across a fully renewable European power system. Renew. Energ. 2014, 63, 467–476. [Google Scholar] [CrossRef]
- Trainer, T. A critique of Jacobson and Delucchi’s proposals for a world renewable energy supply. Energy Policy 2012, 44, 476–481. [Google Scholar] [CrossRef]
- Trainer, T. 100% Renewable supply? Comments on the reply by Jacobson and Delucchi to the critique by Trainer. Energy Policy 2013, 57, 634–640. [Google Scholar] [CrossRef]
- Heard, B.P.; Brook, B.W.; Wigley, T.M.L.; Bradshaw, C.J.A. Burden of proof: A comprehensive review of the feasibility of 100% renewable-electricity systems. Renew. Sustain. Energy Rev. 2017, 76, 1122–1133. [Google Scholar] [CrossRef]
- Nordhaus, W.D. The Climate Casino; Yale University Press: New Haven, CT, USA; London, OH, USA, 2013; pp. 316–326. [Google Scholar]
- Płatkowski, T. Greed and fear in multiperson social dilemmas. Appl. Math. Comput. 2017, 308, 157–160. [Google Scholar] [CrossRef]
- Deissenroth, M.; Klein, M.; Nienhaus, K.; Reeg, M. Assessing the Plurality of Actors and Policy Interactions: Agent-Based Modelling of Renewable Energy Market Integration. Complexity 2017, 2017, 7494313. [Google Scholar] [CrossRef] [Green Version]
- Hansen, P.; Liu, X.; Morrison, G.M. Agent-based modelling and socio-technical energy transitions: A systematic literature review. Energy Res. Soc. Sci. 2019, 49, 41–52. [Google Scholar] [CrossRef]
- Geels, F.W.; Sovacool, B.K.; Schwanen, T.; Sorrell, S. The Socio-Technical Dynamics of Low-Carbon Transitions. Joule 2017, 1, 463–479. [Google Scholar] [CrossRef] [Green Version]
- Alvim, A.M.; Sanguinet, E.R. Climate change policies and the carbon tax effect on meat and dairy industries in brazil. Sustainability 2021, 13, 9026. [Google Scholar] [CrossRef]
- Antón, A. Taxing crude oil: A financing alternative to mitigate climate change? Energy Policy 2020, 136, 111031. [Google Scholar] [CrossRef]
- Böhringer, C.; Garcia-Muros, X.; Cazcarro, I.; Arto, I. The efficiency cost of protective measures in climate policy. Energy Policy 2017, 104, 446–454. [Google Scholar] [CrossRef]
- Descateaux, P.; Astudillo, M.F.; Amor, M.B. Assessing the life cycle environmental benefits of renewable distributed generation in a context of carbon taxes: The case of the northeastern American market. Renew. Sustain. Energy Rev. 2016, 53, 1178–1189. [Google Scholar] [CrossRef]
- Dong, H.J.; Dai, H.C.; Geng, Y.; Fujita, T.; Liu, Z.; Xie, Y.; Wu, R.; Fujii, M.; Masui, T.; Tang, L. Exploring impact of carbon tax on China’s CO2 reductions and provincial disparities. Renew. Sustain. Energy Rev. 2017, 77, 596–603. [Google Scholar] [CrossRef]
- Li, H.; Wang, J.; Wang, S. The impact of energy tax on carbon emission mitigation: An integrated analysis using CGE and SDA. Sustainability 2022, 14, 1087. [Google Scholar] [CrossRef]
- Schütze, F.; Fürst, S.; Mielke, J.; Steudle, G.A.; Wolf, S.; Jaeger, C.C. The role of sustainable investment in climate policy. Sustainability 2017, 9, 2221. [Google Scholar] [CrossRef] [Green Version]
- Takeda, S.; Arimura, T.H. A computable general equilibrium analysis of environmental tax reform in Japan with a forward-looking dynamic model. Sustainability Sci. 2021, 16, 503–521. [Google Scholar] [CrossRef]
- Myerson, R.B. Game Theory; Harvard University Press: Cambridge, MA, USA, 1997; pp. 1–5. [Google Scholar]
- Wood, P.J. Climate change and game theory. Ann. N. Y. Acad. Sci. 2011, 1219, 153–170. [Google Scholar] [CrossRef]
- DeCanio, S.J.; Fremstad, A. Game theory and climate diplomacy. Ecol. Econ. 2013, 85, 177–187. [Google Scholar] [CrossRef]
- Diekert, F.K. The tragedy of the commons from a game-theoretic perspective. Sustainability 2012, 4, 1776–1786. [Google Scholar] [CrossRef] [Green Version]
- Mielke, J.; Steudle, G.A. Green investment and coordination failure: An investors’ perspective. Ecol. Econ. 2018, 150, 88–95. [Google Scholar] [CrossRef]
- Pittel, K.; Rübbelke, D.T.G. Climate policy and ancillary benefits: A survey and integration into the modelling of international negotiations on climate change. Ecol. Econ. 2008, 68, 210–220. [Google Scholar] [CrossRef]
- Cao, K.Y.; He, P.; Liu, Z.X. Production and pricing decisions in a dual-channel supply chain under remanufacturing subsidy policy and carbon tax policy. J. Oper. Res. Soc. 2020, 71, 1199–1215. [Google Scholar] [CrossRef]
- Drake, D.F.; Kleindorfer, P.R.; Van Wassenhove, L.N. Technology choice and capacity portfolios under emissions regulation. Prod. Oper. Manag. 2016, 25, 1006–1025. [Google Scholar] [CrossRef]
- Yenipazarli, A. Managing new and remanufactured products to mitigate environmental damage under emissions regulation. Eur. J. Oper. Res. 2016, 249, 117–130. [Google Scholar] [CrossRef]
- Uzawa, H. Global warming as a cooperative game. Environ. Econ. Policy Stud. 1999, 2, 1–37. [Google Scholar] [CrossRef]
- Honjo, K. Cooperative Emissions Trading game: International permit market dominated by buyers. PLoS ONE 2015, 10, e0132272. [Google Scholar] [CrossRef] [Green Version]
- Zeng, L.; Zhao, L.; Wang, Q.; Wang, B.; Ma, Y.; Cui, W.; Xie, Y. Modeling interprovincial cooperative energy saving in China: An electricity utilization perspective. Energies 2018, 11, 241. [Google Scholar] [CrossRef] [Green Version]
- Ostrom, E. The Governing the Commons; Cambridge University Press: Cambridge, UK, 1990; pp. 1–28. [Google Scholar]
- Ostrom, E. A behavioral approach to the rational choice theory of collective action: Presidential Address, American Political Science Association, 1997. Am. Pol. Sci. Rev. 1998, 92, 1–22. [Google Scholar] [CrossRef]
- Madani, K.; Dinar, A. Cooperative institutions for sustainable common pool resource management: Application to groundwater. Water Resour. Res. 2012, 48. [Google Scholar] [CrossRef] [Green Version]
- Madani, K. Modeling international climate change negotiations more responsibly: Can highly simplified game theory models provide reliable policy insights? Ecol. Econ. 2013, 90, 68–76. [Google Scholar] [CrossRef]
- Kitakaji, Y.; Ohnuma, S. The detrimental effects of punishment and reward on cooperation in the industrial waste illegal dumping game. Simul. Gaming 2019, 50, 509–531. [Google Scholar] [CrossRef]
- Yamagishi, T. The provision of a sanctioning system as a public good. J. Pers. Soc. Psychol. 1986, 51, 110–116. [Google Scholar] [CrossRef]
- Yamagishi, T. The provision of a sanctioning system in the united states and Japan. Soc. Psychol. Q. 1988, 51, 265–271. [Google Scholar] [CrossRef]
- Eek, D.; Loukopoulos, P.; Fujii, S.; Gärling, T. Spill-over effects of intermittent costs for defection in social dilemmas. Eur. J. Soc. Psychol. 2002, 32, 801–813. [Google Scholar] [CrossRef]
- Fehr, E.; Gächter, S. Altruistic punishment in humans. Nature 2002, 415, 137–140. [Google Scholar] [CrossRef]
- Balliet, D.; Mulder, L.B.; Van Lange, P.A.M. Reward, punishment, and cooperation: A meta-analysis. Psychol. Bull. 2011, 137, 594–615. [Google Scholar] [CrossRef] [Green Version]
- Putterman, L. When punishment supports cooperation: Insights from voluntary contribution experiments. In Reward and Punishment in Social Dilemma; van Lange, P.A.M., Rockenbach, B., Yamagishi, T., Eds.; Oxford University Press: New York, NY, USA, 2014; pp. 17–33. [Google Scholar]
- Tenbrunsel, A.E.; Messick, D.M. Sanctioning systems, decision frames, and cooperation. Admin. Sci. Q. 1999, 44, 684–707. [Google Scholar] [CrossRef]
- Ostrom, E. The value-added of laboratory experiments for the study of institutions and common-pool resources. J. Econ. Behav. Organ. 2006, 61, 149–163. [Google Scholar] [CrossRef]
- Mulder, L.B.; van Dijk, E.; De Cremer, D.; Wilke, H.A.M. Undermining trust and cooperation: The paradox of sanctioning systems in social dilemmas. J. Exp. Soc. Psychol. 2006, 42, 147–162. [Google Scholar] [CrossRef]
- Mulder, L.B.; van Dijk, E.; De Cremer, D.; Wilke, H.A.M. When sanctions fail to increase cooperation in social dilemmas: Considering the presence of an alternative option to defect. Pers. Soc. Psychol. Bull. 2006, 32, 1312–1324. [Google Scholar] [CrossRef]
- van Prooijen, J.W.; Gallucci, M.; Toeset, G. Procedural justice in punishment systems: Inconsistent punishment procedures have detrimental effects on cooperation. Br. J. Soc. Psychol. 2008, 47, 311–324. [Google Scholar] [CrossRef]
- Irwin, K.; Mulder, L.; Simpson, B. The detrimental effects of sanctions on intragroup trust: Comparing punishments and rewards. Soc. Psychol. Q. 2014, 77, 253–272. [Google Scholar] [CrossRef] [Green Version]
- Hendrickx, L.; Poortinga, W.; van der Kooij, R. Temporal factors in resource dilemmas. Acta Psychol. 2001, 108, 137–154. [Google Scholar] [CrossRef]
- Milfont, T.L.; Wilson, J.; Diniz, P. Time perspective and environmental engagement: A meta-analysis. Int. J. Psychol. 2012, 47, 325–334. [Google Scholar] [CrossRef]
- Kortenkamp, K.V.; Moore, C.F. Time, uncertainty, and individual differences in decisions to cooperate in resource dilemmas. Pers. Soc. Psychol. Bull. 2006, 32, 603–615. [Google Scholar] [CrossRef]
- Stern, P.C. Effect of incentives and education on resource conservation decisions in a simulated common dilemma. J. Pers. Soc. Psychol. 1976, 34, 1285–1292. [Google Scholar] [CrossRef]
- Milinski, M.; Sommerfeld, R.D.; Krambeck, H.J.; Reed, F.A.; Marotzke, J. The collective-risk social dilemma and the prevention of simulated dangerous climate change. Proc. Natl Acad. Sci. USA 2008, 105, 2291–2294. [Google Scholar] [CrossRef] [Green Version]
- Zhang, Y.; Gao, Y.A.; Jiang, J. An unpredictable environment reduces pro-environmental behavior: A dynamic public goods experiment on forest use. J. Environ. Psychol. 2021, 78, 101702. [Google Scholar] [CrossRef]
- Subcommittee on the Use of Carbon Pricing. Available online: https://www.env.go.jp/content/900422816.pdf (accessed on 12 August 2022).
- Aldy, J.E. Carbon tax review and updating: Institutionalizing an act-learn-act approach to U.S. climate policy. Rev. Environ. Econ. Policy 2020, 14, 76–94. [Google Scholar] [CrossRef] [Green Version]
- Carattini, S.; Carvalho, M.; Fankhauser, S. Overcoming public resistance to carbon taxes. Wiley Interdiscip. Rev. Clim. Change 2018, 9, e531. [Google Scholar] [CrossRef] [Green Version]
- Haites, E. Carbon taxes and greenhouse gas emissions trading systems: What have we learned? Clim. Policy 2018, 18, 955–966. [Google Scholar] [CrossRef]
- Suzuki, K.; Nakai, K.; Ogihara, A. Design of simulation and gaming to promote the energy transition from fossil fuels to renewables. In Neo-Simulation and Gaming Toward Active Learning, Translational Systems Sciences; Hamada, R., Soranastaporn, S., Kanegae, H., Eds.; Springer: Singapore, 2019; Volume 18, pp. 201–210. [Google Scholar] [CrossRef]
- Suzuki, K. The unique value of gaming simulation as a research method for sustainability-related issues. In Translational Systems Sciences; Kaneda, T., Hamada, R., Kumazawa, T., Eds.; Springer: Singapore, 2021; Volume 25, pp. 125–147. [Google Scholar] [CrossRef]
- Gupta, S.D. Dynamics of switching from polluting resources to green technologies. Int. J. Energy Econ. Policy 2015, 5, 1109–1124. [Google Scholar]
- Tsur, Y.; Zemel, A. Optimal transition to backstop substitutes for nonrenewable resources. J. Econ. Dyn. Control 2003, 27, 551–572. [Google Scholar] [CrossRef]
- van der Ploeg, F.; Withagen, C. Is there really a green paradox? J. Environ. Econ. Manag. 2012, 64, 342–363. [Google Scholar] [CrossRef] [Green Version]
- Gronwald, M.; Van Long, N.V.; Roepke, L. Simultaneous supplies of dirty energy and capacity constrained clean energy: Is there a green paradox? Environ. Resour. Econ. 2017, 68, 47–64. [Google Scholar] [CrossRef] [Green Version]
- Wang, M.; Zhao, J.H. Are renewable energy policies climate friendly? The role of capacity constraints and market power. J. Environ. Econ. Manag. 2018, 90, 41–60. [Google Scholar] [CrossRef]
- Rubin, E.S.; Azevedo, I.M.L.; Jaramillo, P.; Yeh, S. A review of learning rates for electricity supply technologies. Energy Policy 2015, 86, 198–218. [Google Scholar] [CrossRef]
- Chen, D.L.; Schonger, M.; Wickens, C. oTree—An open-source platform for laboratory, online, and field experiments. J. Behav. Exp. Fin. 2016, 9, 88–97. [Google Scholar] [CrossRef]
- Curtin, J.; McInerney, C.; Gallachoir, B.O.; Hickey, C.; Deane, P.; Deeney, P. Quantifying stranding risk for fossil fuel assets and implications for renewable energy investment: A review of the literature. Renew. Sust. Energ. Rev. 2019, 116, 109402. [Google Scholar] [CrossRef]
- O’Mahony, T. State of the art in carbon taxes: A review of the global conclusions. Green Fin. 2020, 2, 409–423. [Google Scholar] [CrossRef]
- Clark, E.M.; Merrill, S.C.; Trinity, L.; Bucini, G.; Cheney, N.; Langle-Chimal, O.; Shrum, T.; Koliba, C.; Zia, A.; Smith, J.M. Using experimental gaming simulations to elicit risk mitigation behavioral strategies for agricultural disease management. PLoS ONE 2020, 15, e0228983. [Google Scholar] [CrossRef] [PubMed]
- Krawchenko, T.A.; Gordon, M. How Do We Manage a Just Transition? A Comparative Review of National and Regional Just Transition Initiatives. Sustainability 2021, 13, 6070. [Google Scholar] [CrossRef]
- Swarnakar, P.; Singh, M.K. Local Governance in Just Energy Transition: Towards a Community-Centric Framework. Sustainability 2022, 14, 6495. [Google Scholar] [CrossRef]
- World Energy Council. Localising the Grand Transition: Enabling Citizen Participation and Encompassing Local Government. Available online: https://www.worldenergy.org/impact-communities/future-energy-leaders (accessed on 30 September 2022).
- Craven, J.; Angarita, H.; Perez, G.A.C.; Vasquez, D. Development and testing of a river basin management simulation game for integrated management of the Magdalena-Cauca river basin. Environ. Model. Softw. 2017, 90, 78–88. [Google Scholar] [CrossRef]
- Hertzog, T.; Poussin, J.C.; Tangara, B.; Kouriba, I.; Jamin, J.Y. A role playing game to address future water management issues in a large irrigated system: Experience from Mali. Agric. Water Manag. 2014, 137, 1–14. [Google Scholar] [CrossRef]
- Teague, A.; Sermet, Y.; Demir, I.; Muste, M. A collaborative serious game for water resources planning and hazard mitigation. Int. J. Disaster Risk Reduct. 2021, 53, 101977. [Google Scholar] [CrossRef]
- Ambrosius, F.H.W.; Hofstede, G.J.; Bokkers, E.A.M.; Bock, B.B.; Beulens, A.J.M. The social influence of investment decisions: A game about the Dutch pork sector. Livest. Sci. 2019, 220, 111–122. [Google Scholar] [CrossRef]
- Salvini, G.; van Paassen, A.; Ligtenberg, A.; Carrero, G.C.; Bregt, A.K. A role-playing game as a tool to facilitate social learning and collective action towards Climate Smart Agriculture: Lessons learned from Apui, Brazil. Environ. Sci. Policy 2016, 63, 113–121. [Google Scholar] [CrossRef]
- Speelman, E.N.; Garcia-Barrios, L.E.; Groot, J.C.J.; Tittonell, P. Gaming for smallholder participation in the design of more sustainable agricultural landscapes. Agric. Syst. 2014, 126, 62–75. [Google Scholar] [CrossRef]
- Salen, K.; Zimmerman, E. Rules of Play: Game Design Fundamentals; MIT Press: Cambridge, MA, USA, 2003; pp. 575–576. [Google Scholar]


| m | α | β | γ | ε | V0 | D0 | pr0 | Ps0 | R0 | N0 | |
|---|---|---|---|---|---|---|---|---|---|---|---|
| Unit | [G/E] | [G] | [E] | [G/E] | [G/E] | [E] | [K] | ||||
| Value | 1 | 0.5 | 0.07 | 0.13 | 0.79 | 20 | 5 | 16 | 10 | 4 | 4 |
| In-game | Anxiety about uncertainties | q1 | How anxious are you about whether you can survive in price competition? |
| q2 | How anxious are you about whether investing in renewables will yield profits at the end of game? | ||
| q3 | How anxious are you about future fuel prices? | ||
| Post-game | Effective strategy | Q1 | I should have continued using only fossil fuels. |
| Q2 | I should have completely transitioned to renewables. | ||
| Q3 | I should have utilized fossil fuels and renewables together throughout the game. | ||
| Obstacles to energy transition | Q4 | The whole market was competitive. | |
| Q5 | Certain players were competitive. | ||
| Q6 | The effect of R&D investment on the unit price of renewable energy was not quantitatively shown. | ||
| Q7 | The increase rate of fossil fuel prices was not shown in advance. | ||
| Overall impressions | Q8 | Do you feel this game was fun? | |
| Q9 | Do you feel this game was easy to understand? |
| Average | M. W. U Test | |||
|---|---|---|---|---|
| w/o Tax | with Tax | U-Value | p-Value | |
| Total renewables usage [E] | 147.7 | 186.7 | 11 | * 0.097 |
| Total R&D investment [G] | 273.1 | 259.9 | 24 | 1.000 |
| Average market price [G/E] | 9.7 | 9.9 | 18 | 0.443 |
| Total profit [G] | 31.0 | 53.1 | 18 | 0.443 |
| Rounds | ||||||
|---|---|---|---|---|---|---|
| 1–5 | 6−10 | 11−15 | 16–20 | 21–25 | ||
| Renewable energy usage [E] | U-val. | 22.5 | 22 | 20 | 6 | 10.5 |
| p-val. | 0.848 | 0.798 | 0.609 | ** 0.021 | * 0.084 | |
| R&D investment [G] | U-val. | 23 | 20 | 23 | 17 | 14 |
| p-val. | 0.898 | 0.609 | 0.898 | 0.371 | 0.201 | |
| Market price [G/E] | U-val. | 21 | 24 | 22 | 11 | 15 |
| p-val. | 0.701 | 1.000 | 0.798 | * 0.097 | 0.250 | |
| Profit [G] | U-val. | 21 | 17 | 19 | 22 | 17 |
| p-val. | 0.701 | 0.371 | 0.523 | 0.798 | 0.523 | |
| Average | M. W. U Test | ||||
|---|---|---|---|---|---|
| w/o Tax | with Tax | U-Val. | p-Val. | ||
| Effective strategy | Fossil fuel only (Q1) | 2 | 2.1 | 24.5 | 0.948 |
| Complete transition (Q2) | 6.1 | 5.5 | 15.5 | 0.274 | |
| Hybrid approach (Q3) | 2 | 2.4 | 20.5 | 0.653 | |
| Obstacles to transition | Competitive market (Q4) | 5.5 | 3.9 | 0 | *** 0.002 |
| Competitive player (Q5) | 3.4 | 3.9 | 17 | 0.367 | |
| R&D uncertainty (Q6) | 5.4 | 5.6 | 20 | 0.605 | |
| Fuel price uncertainty (Q7) | 3.8 | 4.1 | 21.5 | 0.748 | |
| Overallimpressions | Game was fun (Q8) | 6.3 | 6.1 | 18 | 0.438 |
| Easy to understand (Q9) | 5.8 | 4.9 | 12.5 | 0.139 | |
Publisher’s Note: MDPI stays neutral with regard to jurisdictional claims in published maps and institutional affiliations. |
© 2022 by the authors. Licensee MDPI, Basel, Switzerland. This article is an open access article distributed under the terms and conditions of the Creative Commons Attribution (CC BY) license (https://creativecommons.org/licenses/by/4.0/).
Share and Cite
Suzuki, K.; Ishiwata, R. Impact of a Carbon Tax on Energy Transition in a Deregulated Market: A Game-Based Experimental Approach. Sustainability 2022, 14, 12785. https://doi.org/10.3390/su141912785
Suzuki K, Ishiwata R. Impact of a Carbon Tax on Energy Transition in a Deregulated Market: A Game-Based Experimental Approach. Sustainability. 2022; 14(19):12785. https://doi.org/10.3390/su141912785
Chicago/Turabian StyleSuzuki, Kengo, and Ryohei Ishiwata. 2022. "Impact of a Carbon Tax on Energy Transition in a Deregulated Market: A Game-Based Experimental Approach" Sustainability 14, no. 19: 12785. https://doi.org/10.3390/su141912785