Article

Crushed Glass and Oil Extracted from Palm Oil Sludge as Primary Materials in the Production of Hydrophobic Sand for Capillary Barrier Applications

by
Josefina Sullivan-Porras
1,
María Badilla-Sánchez
2,
Renato Rimolo-Donadio
3 and
Federico Masís-Meléndez
4,*
1
Ingeniería Ambiental, Instituto Tecnológico de Costa Rica, Cartago 159-7050, Costa Rica
2
Escuela de Ciencia e Ingeniería de los Materiales, Instituto Tecnológico de Costa Rica, Centro de Investigación y Extensión en Ingeniería de los Materiales, CIEMTEC, Cartago 159-7050, Costa Rica
3
Escuela de Ingeniería en Electrónica, Instituto Tecnológico de Costa Rica, Cartago 159-7050, Costa Rica
4
Escuela de Química, Centro de Investigación y de Servicios Químicos y Microbiológicos, CEQIATEC, Instituto Tecnológico de Costa Rica, Cartago 159-7050, Costa Rica
*
Author to whom correspondence should be addressed.
Sustainability 2022, 14(19), 12770; https://doi.org/10.3390/su141912770
Submission received: 31 August 2022 / Revised: 23 September 2022 / Accepted: 26 September 2022 / Published: 7 October 2022
(This article belongs to the Special Issue Environmentally Sound Waste Management and Zero Waste Principles)

Abstract

:
Hydrophobic-coated sand causes a reduction in infiltration, making it suitable for hydrophobic capillary barriers. Borosilicate glass waste was crushed into a synthetic sand 180 µm average, and fatty acids (PFA) were extracted from palm oil sludge. The synthetic sand was coated with PFA using mixing (POS-M) and solvent-assisted (POS-S) methods with stearic-acid-coated sand (SA) as a standard at concentrations varying from 1 to 16 g/kg. Contact angle measurements were undertaken by applying the sessile drop method. The water holding capacity of POS-M and SA were determined, and hydraulic conductivity curves were estimated with the van Genuchten model. Finally, a qualitative assessment of POS-M’s effectiveness as a capillary barrier was performed using a set of micro-tensiometers. Maximum contact angles for POS-M, POS-S, and SA were 119.73°, 118.83°, and 107.48°, respectively, and the saturated hydraulic conductivity of hydrophobized sands showed an exponential change of minus 2. Saturated conditions above the capillary barrier and unsaturated underneath were observed. In conclusion, the results indicate that the zero-waste approach applied through the reuse of solid waste from glass and palm oil production can be a waste management alternative in the production of hydrophobic sands that can be used in hydrophobic capillary barrier applications.

1. Introduction

Capillary barriers are often used as cover systems in landfills to restrict the infiltration of rain water into the compacted solid waste [1]. They are rising in popularity in developing countries because they are more cost-effective than the traditional geosynthetic membranes [2]. Capillary barriers consist of layers of soil with different hydraulic properties that restrict the movement of gravitational water [3] and consequently produce a barrier that stops the infiltration of rain water. In general terms, they have a top layer of fine soil, also known as the capillary layer or drainage layer, and a bottom layer of coarse particles such as sand or gravel, also referred to as the capillary block [3,4]. Due to the grain size difference, the capillary force in the top layer is stronger than in the bottom layer [4]. This superior capillary force boosts the water retention of the top layer [2] and impedes the vertical infiltration of water at the interface of the layers [3]. The top stores the water during rainfall events and then releases it as lateral drainage or evapotranspiration [5]. Depending on its construction and context, this technology could be used to drain water and harvest it, or as an evapotranspiration cover in landfills. Another factor in the effectiveness of the capillary barrier is the difference between the unsaturated hydraulic conductivities (K) of the layers; the K of the top layer (KTop) must be higher than the K of the bottom layer (KBottom). This creates a barrier at the interface of the layers [6,7]. This will also be reflected by their respective water characteristic curves, where the top layer has a higher water holding capacity than the bottom layer [8]. Water in the top layer will be retained and will flow exclusively through it [4]. The breakthrough point is reached when KBottom = KTop, causing the barrier to no longer be effective [3]. The unsaturated hydraulic conductivities equal each other under a specific matric potential, also known as the water entry pressure (WEP) [5]. For WEP to occur, the top layer must accumulate a lot of water, to the point of saturation [9]. When the precipitation rate is higher than the evapotranspiration or drainage rate, the barrier will no longer prevent infiltration [10]. A few of the variables for an effective capillary barrier are: a well-adjusted grain size distribution of layers, a minimum slope and a suitable K at the top layer [4]. Unfortunately, capillary barriers may need up to four different hydraulically suitable soils; this can increase costs and does not perform well in tropical climates [10]. Nonetheless, it is possible to enhance the capillary barrier by making the coarse layer hydrophobic [5,10,11,12,13].
Capillary barriers can be built with synthetic water-repellent soil to restrict infiltration of water, promote lateral diversion, increase the value of WEP to positive pressures and create a larger difference in the water retention capacity of the layers [5,10]. Studies have shown that hydrophobic capillary barriers perform better than conventional capillary barriers and are able to resist higher precipitation rates, making them more suitable for tropical climates [5,10]. Due to these characteristics, they can also be used in water harvesting for human intake or agricultural purposes. DIME, a German company, has patented their hydrophobic sands and is publicizing their use for agriculture in deserted regions [14]. A hydrophobic sand layer underneath the roots will help maintain the humidity of the soil, thus reducing the amount of water needed for irrigation [15]. On the other hand, at certain depths, an artificial water table could be manufactured with the sands to provide water for human activities. In this type of capillary barrier, the pore walls of the bottom layer are hydrophobic, thus when in contact with water will form a convex meniscus that, according to the capillary ascent model, will lead to a capillary descent, enhancing to the capillary barrier’s resistance [10]. According to Dell’ Avanzi et al. [10], four desired characteristics for a capillary barrier are economic affordability, long term performance, the use of only one capillary barrier and nearby resources. This author suggests another important aspect: the use of waste materials instead of conventional resources for the fabrication of the barriers.
Borosilicate glass is generally composed of soda, silicates, limestone, and boron trioxide, which makes it more resistant to corrosion and high temperature compared to standard glass [16,17]. Due to these characteristics, it is not generally a recyclable material. It has been proved that the extraction of natural sands for construction and production have a significant carbon and ecological footprint [18]. In fact, natural sand was discovered to be the second most widely consumed natural resource on the planet [19]. Additionally, it contributes to the strain on landfills when it becomes solid waste. There is a global generation of 2 billion tonnes of solid waste per year, of which 5% consists of glass [20]. Wartman et al. 2004 [21] reported that crushed glass has similar physical properties to natural sand. Its dominant material is also silica, making it comparable in chemical composition [22]. Even though its geometry is more angular, it does not seem to affect its suitability in construction or geotechnical engineering [21,22,23]. Kazmi et al. [22] determined that crushed glass waste could replace natural sand in geotechnical applications and even had a higher abrasion resistance. Its use in cement production has also been studied: Limbachiya [23] found concrete produced with glass waste had similar bulk engineering properties and durability to concrete produced with natural sand. According to Imteaz et al. [24], lixiviants from crushed glass are insignificant and do not exceed boundaries set by the Environmental Protection Agency of the USA.
Palm oil is one of the most popular vegetable oils in the market; from 2017 to 2018, it was estimated that the palm oil industry produced a total of 69.98 × 10⁶ tons of oil worldwide [25]. It is extracted from the mesocarp of the fruit from Elaeis guineensi plant [26]. Its production generally consists of the steps displayed in Figure 1: sterilization of the fruit, stripping, digestion at high temperatures, separation of the seed, pressing to extract oil, clarification, and purification. The clarification tank generates waste in the form of an oily sludge with a solid consistency [26]. Owing to the presence of oils, the sludge can be used as a binding agent for sawdust briquettes [27] or rice husk briquettes [28]. It is also effective as an absorbent for copper sequestration in water [29] and in removing sulfur dioxide from the air when turned into biochar [30]. Successful waste treatments include composting in an aerated reactor [31] or vermicompost [32]. The present study intends to use extracted oil from the sludge to be used as a primary material in the production of hydrophobic sand.
Solid–liquid extractions have been used to successfully extract oil from palm oil by-products such as palm kernel cake [33] or from palm oil mesocarp [34]. The solid–liquid extraction method mixes a solvent with the solid sample, dissolves the analyte into the solvent and therefore transfers the analyte from the solid sample into the liquid solvent [35]. Finally, separating the analyte from the solvent through a rotary evaporator [36] or vacuum oven [37]. The conventional procedure to put the solvent in contact with the analyte is through maceration or a vortex mixer. Zimilia et al. [37] obtained favorable results applying this method in the extraction of Jatropha oil; where the seeds were mixed with hexane in a vortex, the solvent was separated from the seed with a centrifuge and the oil was isolated using a vacuum oven. There are variations of this method, such as applying ultrasound to increase the efficiency [38] or microwave reactors [33]. Both have shown promising results for large scale extractions due to the shorter extraction time, decreased volume of solvent needed and increased yield [38,39].
Hydrophobic soil can be natural or artificial. A naturally hydrophobic soil is generally a product of the accumulation of organic compounds from decomposing vegetation or microorganisms [40,41]. On the other hand, they have been produced artificially by coating particles with a hydrophobic agent. Particles such as natural sands [2,11], synthetic sands [5], or clay [13] have been studied. Effective hydrophobic agents include silanes [42,43], dimethyldichlorosilane [5], polytetrafluorethylene [10], stearic acid [11,44], and oleic acid [2]. It is commonly known that hydrophobic soils repel water molecules due to the strength of the cohesive forces of the water over the adhesive forces between the surface of the particle and the water [41]. Hydrophobicity of soil is impossible to measure directly because of its particulate form, nonetheless Bachmann et al. [45] developed a method that establishes a quasi-plain surface from closely packed particles. Since it still is not a smooth surface, the results are considered an apparent value [45].
To this date, there are few studies on the use of fatty acids as a hydrophobic agent on sand particles. Subedi et al. [11] reported contact angles above 90° for stearic-acid-coated sands and oleic acid, as well as Leelamanie et al. [44], Wijewardana et al. [2], and González-Peñaloza et al. [46]. On the other hand, contact angles between 124° and 138° have been obtained with silane-covered sand [42]; a 140° contact angle was reached by Zheng et al. [5] with dimethyldichlorosilane-coated sand. To the best of the authors’ knowledge, no studies have tried to fabricate hydrophobic sands from solid waste such as borosilicate glass and palm oil sludge. Thus, this study aims to provide insight into the possibility of using solid waste as a primary resource for the fabrication of hydrophobic sand for capillary barriers. The specific objectives of this study were to prove and evaluate the possibility of producing hydrophobic sands from borosilicate glass waste and palm oil sludge, as well as examine the quality of the hydrophobic sands and determine whether they are suitable for a capillary barrier.

2. Materials and Methods

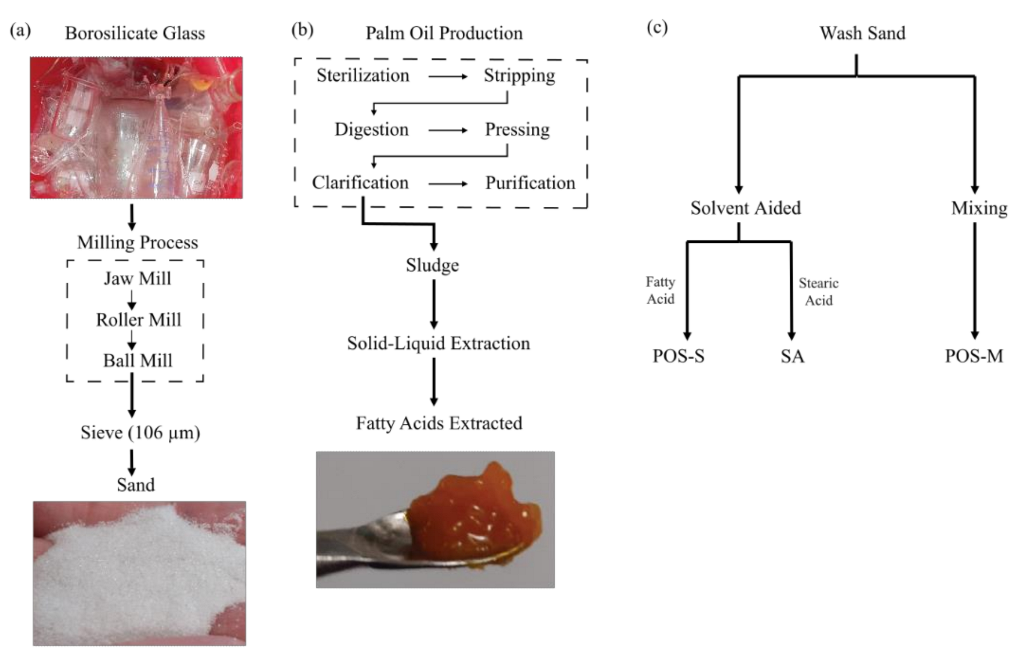
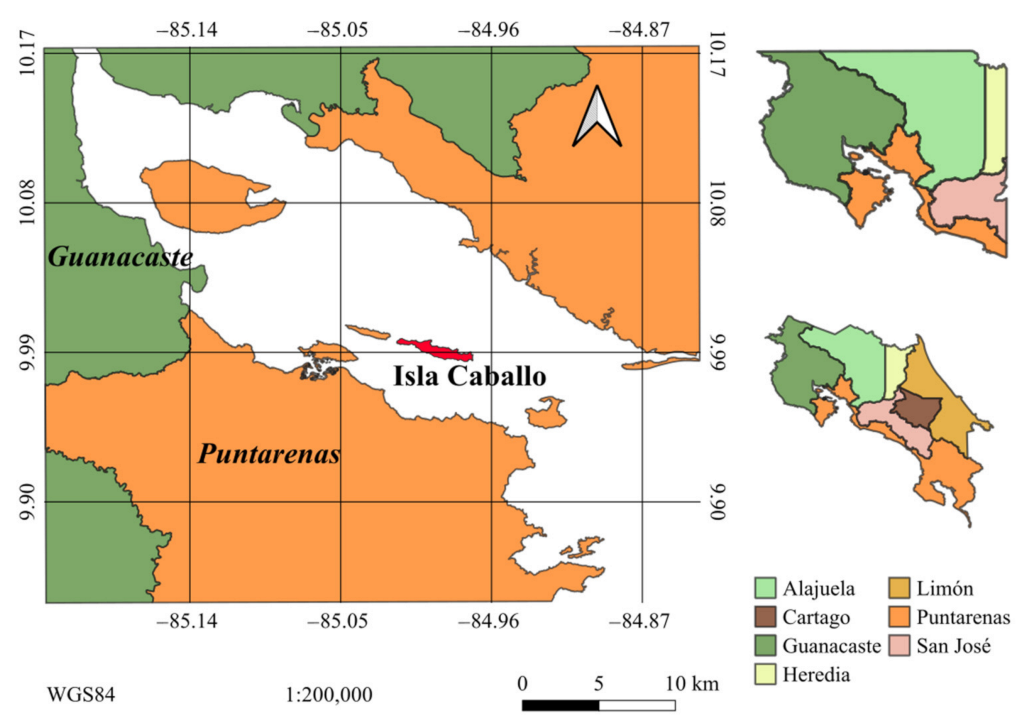
2.1. Sample Collection and Preparation

The raw materials used in the primary production of hydrophobic sand were palm oil residual sludge (PORS), borosilicate glass waste, and stearic acid (Sigma Aldrich). The PORS was supplied by the Costa Rican palm oil company, “COOPEAGROPAL” in Puntarenas, Costa Rica. Specifically, the waste sludge produced at the bottom of their clarification tank. The borosilicate glass waste was broken glassware from the CEQIATEC laboratories and materials science laboratory at Instituto Tecnológico de Costa Rica.
The palm oil fatty acids (PFA) were extracted from the PORS through a solid–liquid extraction using 1.25 mL of hexane (J.T Baker, EUA, x20656) per gram of PORS. The PORS was mixed with hexane in a vortex mixer (Four E’s scientific Co., Ltd., Hunt Valley, NSW, USA), centrifuged at 3500 rpm, and decanted. Finally, the fatty acid was separated from the hexane through distillation with a rotary evaporator (Heidolph Instruments, Germany) at 60 °C, and a rotation of 200 rpm. This procedure was repeated three times per sample before disposal. In parallel, a sample of PORS was heated in an oven at 105 °C for 24 h and left to rest in a desiccator to determine its water content through mass difference calculations. When not in use, the PORS was kept at 0 °C to avoid fermentation.
Borosilicate glass waste was crushed into a particle size between 106 µm and 200 µm by a series of mills: a jaw mill, followed by a roller mill, and finally, a ball mill. The residence time for the ball mill was 10 min with six 0.5 kg iron balls, five 0.75 kg balls, three 1 kg balls, and four 1.5 kg balls. The mixture obtained was sieved with an opening of 210 µm to separate sand particles from powder. Finally, the synthetic sand was obtained. In this study it is assumed the synthetic sand is composed of 70–80% silicon dioxide, 7–13% boron trioxide, 4–8% sodium oxide, and 2–8% aluminum oxide [47].
Finally, following the method illustrated in Figure 1c, the extracted fat and the synthetic sand were used to produce hydrophobic sand. Two methods of coating were applied to produce the hydrophobic sands: solvent-assisted and mixing. The PFA was used as a hydrophobic agent and coated onto the synthetic sand through both methods producing two sands: POS-S and POS-M. Synthetic sand coated with stearic acid (SA) was used as a standard for comparison, for which only the solvent-assisted method was used. They were coated at concentrations of 1, 3, 6, 10, 13, and 16 g/kg (ghydrophobic agent/kgsand).
Before coating, the sand was washed with dish soap, rinsed with distilled water, and dried in an oven at 80 °C for 24 h.
The mixing method consisted of introducing the synthetic sand and hydrophobic agent into a hermetic bag. Followed by mechanically mixing the two until forming a heterogeneous mix.
For the solvent-assisted method, the hydrophobic agent was dissolved in ethyl ether (J.T.Baker, Mexico, V30666). When completely dissolved, sand was added according to the desired concentration and mixed in. Next, the mixture was transferred quantitatively onto a watch glass and left to rest for 3 h in an extraction chamber, until all the ethyl ether had evaporated. For both methods, the sand was left to rest for 48 h in a desiccator.

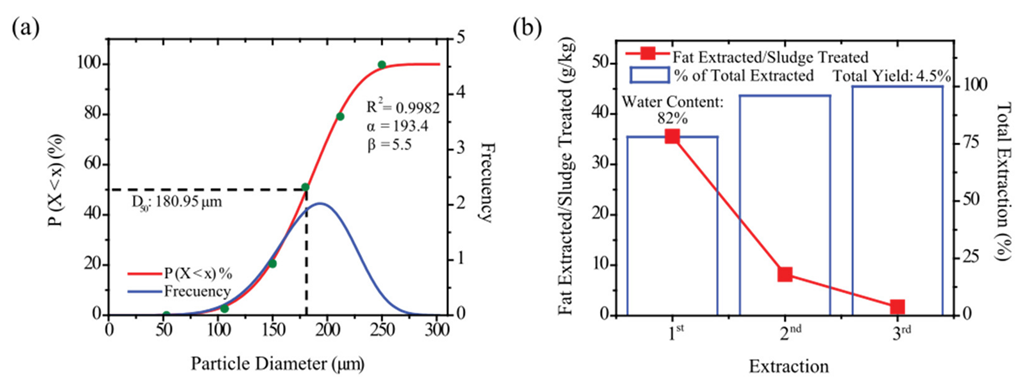
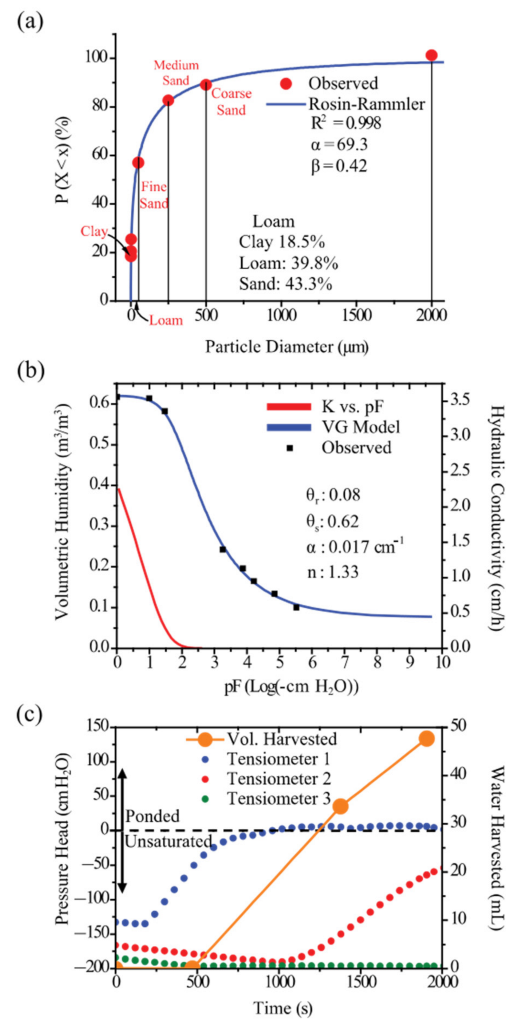
2.2. Particle Size Analysis

A triplicate sieve analysis was performed to determine the particle size distribution of the synthetic sand according to the method described by Sivakugan [48]. In this case, five sieves were used with openings of 500 µm, 250 µm, 106 µm, 63 µm, and 53 µm.
Furthermore, the Rosin-Rammler equation was used to model the particle distribution curve and to calculate D50 [49].
P ( X < x ) % = 1 e ( x α ) β
where P (X < x) is the percentage of accumulated retained mass, x is particle diameter, and α and β are Rosin-Rammler coefficients. The median grain size diameter (D50) was calculated through the Rosin-Rammler model, and the uniformity coefficient (Cu) was obtained.
C u = D 30 2 D 60 × D 10
where D x   is the particle size that corresponds to x% finer materials of the sample.

2.3. Characterization of Fatty Acids Extracted

Fat was extracted with ethyl ether for 15 min and centrifuged for 10 min at 4000 rpm (67,996× g). Later, esterification was performed with BF3 for 45 min to 100 °C. The fatty acids present in the extracted fat were determined through gas chromatography CG-2014 equipped with a 20 m × 0.18 μm × 0.2 μm Agilent J&W DB-23 column and stationary phase 50% poly(biscianpropylsiloxane). The standard solutions were prepared using fatty acids with purity degree above 99%, dissolved in dichloromethane or hexane with BHT at a concentration of 10 mg/mL. These were later separated into 1 mL vials. A solution composed of 37 fatty acid methyl esters were analyzed to verify the retention time of each analyte. The final concentration of each fatty acid was obtained by measuring the area under the curve of each peak obtained in the chromatogram and applying the following equation:
[ Fatty   Acid ] = A i A i × 100
where Ai is the area under the curve of each peak and [Fatty Acid] is the concentration of the fatty acid. The concentration obtained was reported in the form of g/100 g.

2.4. Contact Angle Analysis

A contact angle analysis was performed for POS-M, POS-S, and SA at concentrations of 1, 3, 6, 10, 13, and 16 g/kg. A control sample was also used throughout the whole study, which consisted of washed synthetic sand without any coating. The sample was prepared following the methodology described by Bachmann et al. [45] for the determination of contact angles on soil particles.
A Ramé-Hart 500 goniometer was used in the measurement of initial contact angles and contact angle in time for each hydrophobic sand duplicate. The contact angle was measured every 3 s for 117 s, with 7 repetitions. All contact angle measurements were performed at 20 °C and RH of 70%. The droplet volume used was 4 µL, where the effect of gravity on the liquid is negligible [50].

2.5. Hydraulic Properties

2.5.1. Water Characteristic Curves

Water characteristic curves (WCC) were determined for POS-M, SA, and the synthetic sand control. The sand samples were packed into a cylinder ring (8.5 cm diameter, 5.3 cm high, with a preformed hole, 0.86 cm wide at 2.4 cm high) secured with a nylon cloth and a rubber band on the bottom. The packed samples were placed into a bath of water with a 6 cm water column to saturate for 24 h. From this point, suction was applied gradually up to −80 cm-H2O. The suction was applied through an extractor pressure plate cell (266.7 mm diameter), 1/2 Bar High Flow Soilmoisture Equipment Corp (Santa Barbara, CA, USA), which was previously saturated, placed on a scale (±0.01 g) and attached to a suction pump. The saturated sample was set on top of the plate and a tensiometer was gently inserted into a preformed hole at a side of the ring, in parallel to the pressure plate and crossing the sample. The pump was turned on intermittently to allow suction while the change in matric potential and water content was registered. Finally, the data was introduced into the software RETC [51] to determine the WCC according to the van Genuchten–Mualem model [52]. The software was configured to calculate θs, α, and n, with a maximum of 50 iterations.

2.5.2. Saturated Hydraulic Conductivity

The saturated hydraulic conductivity (Ks) was measured using the constant water head method as described by Reynolds et al. [53]. The ring used was 3.5 cm in height and 36.11 cm in diameter; and the water head applied was of 3.5 cm-H2O. A hydraulic conductivity curve was then constructed using the software Hydrus 1D [54] and the WCC and Ks.

2.6. Characterization of Hydrophobic Sand
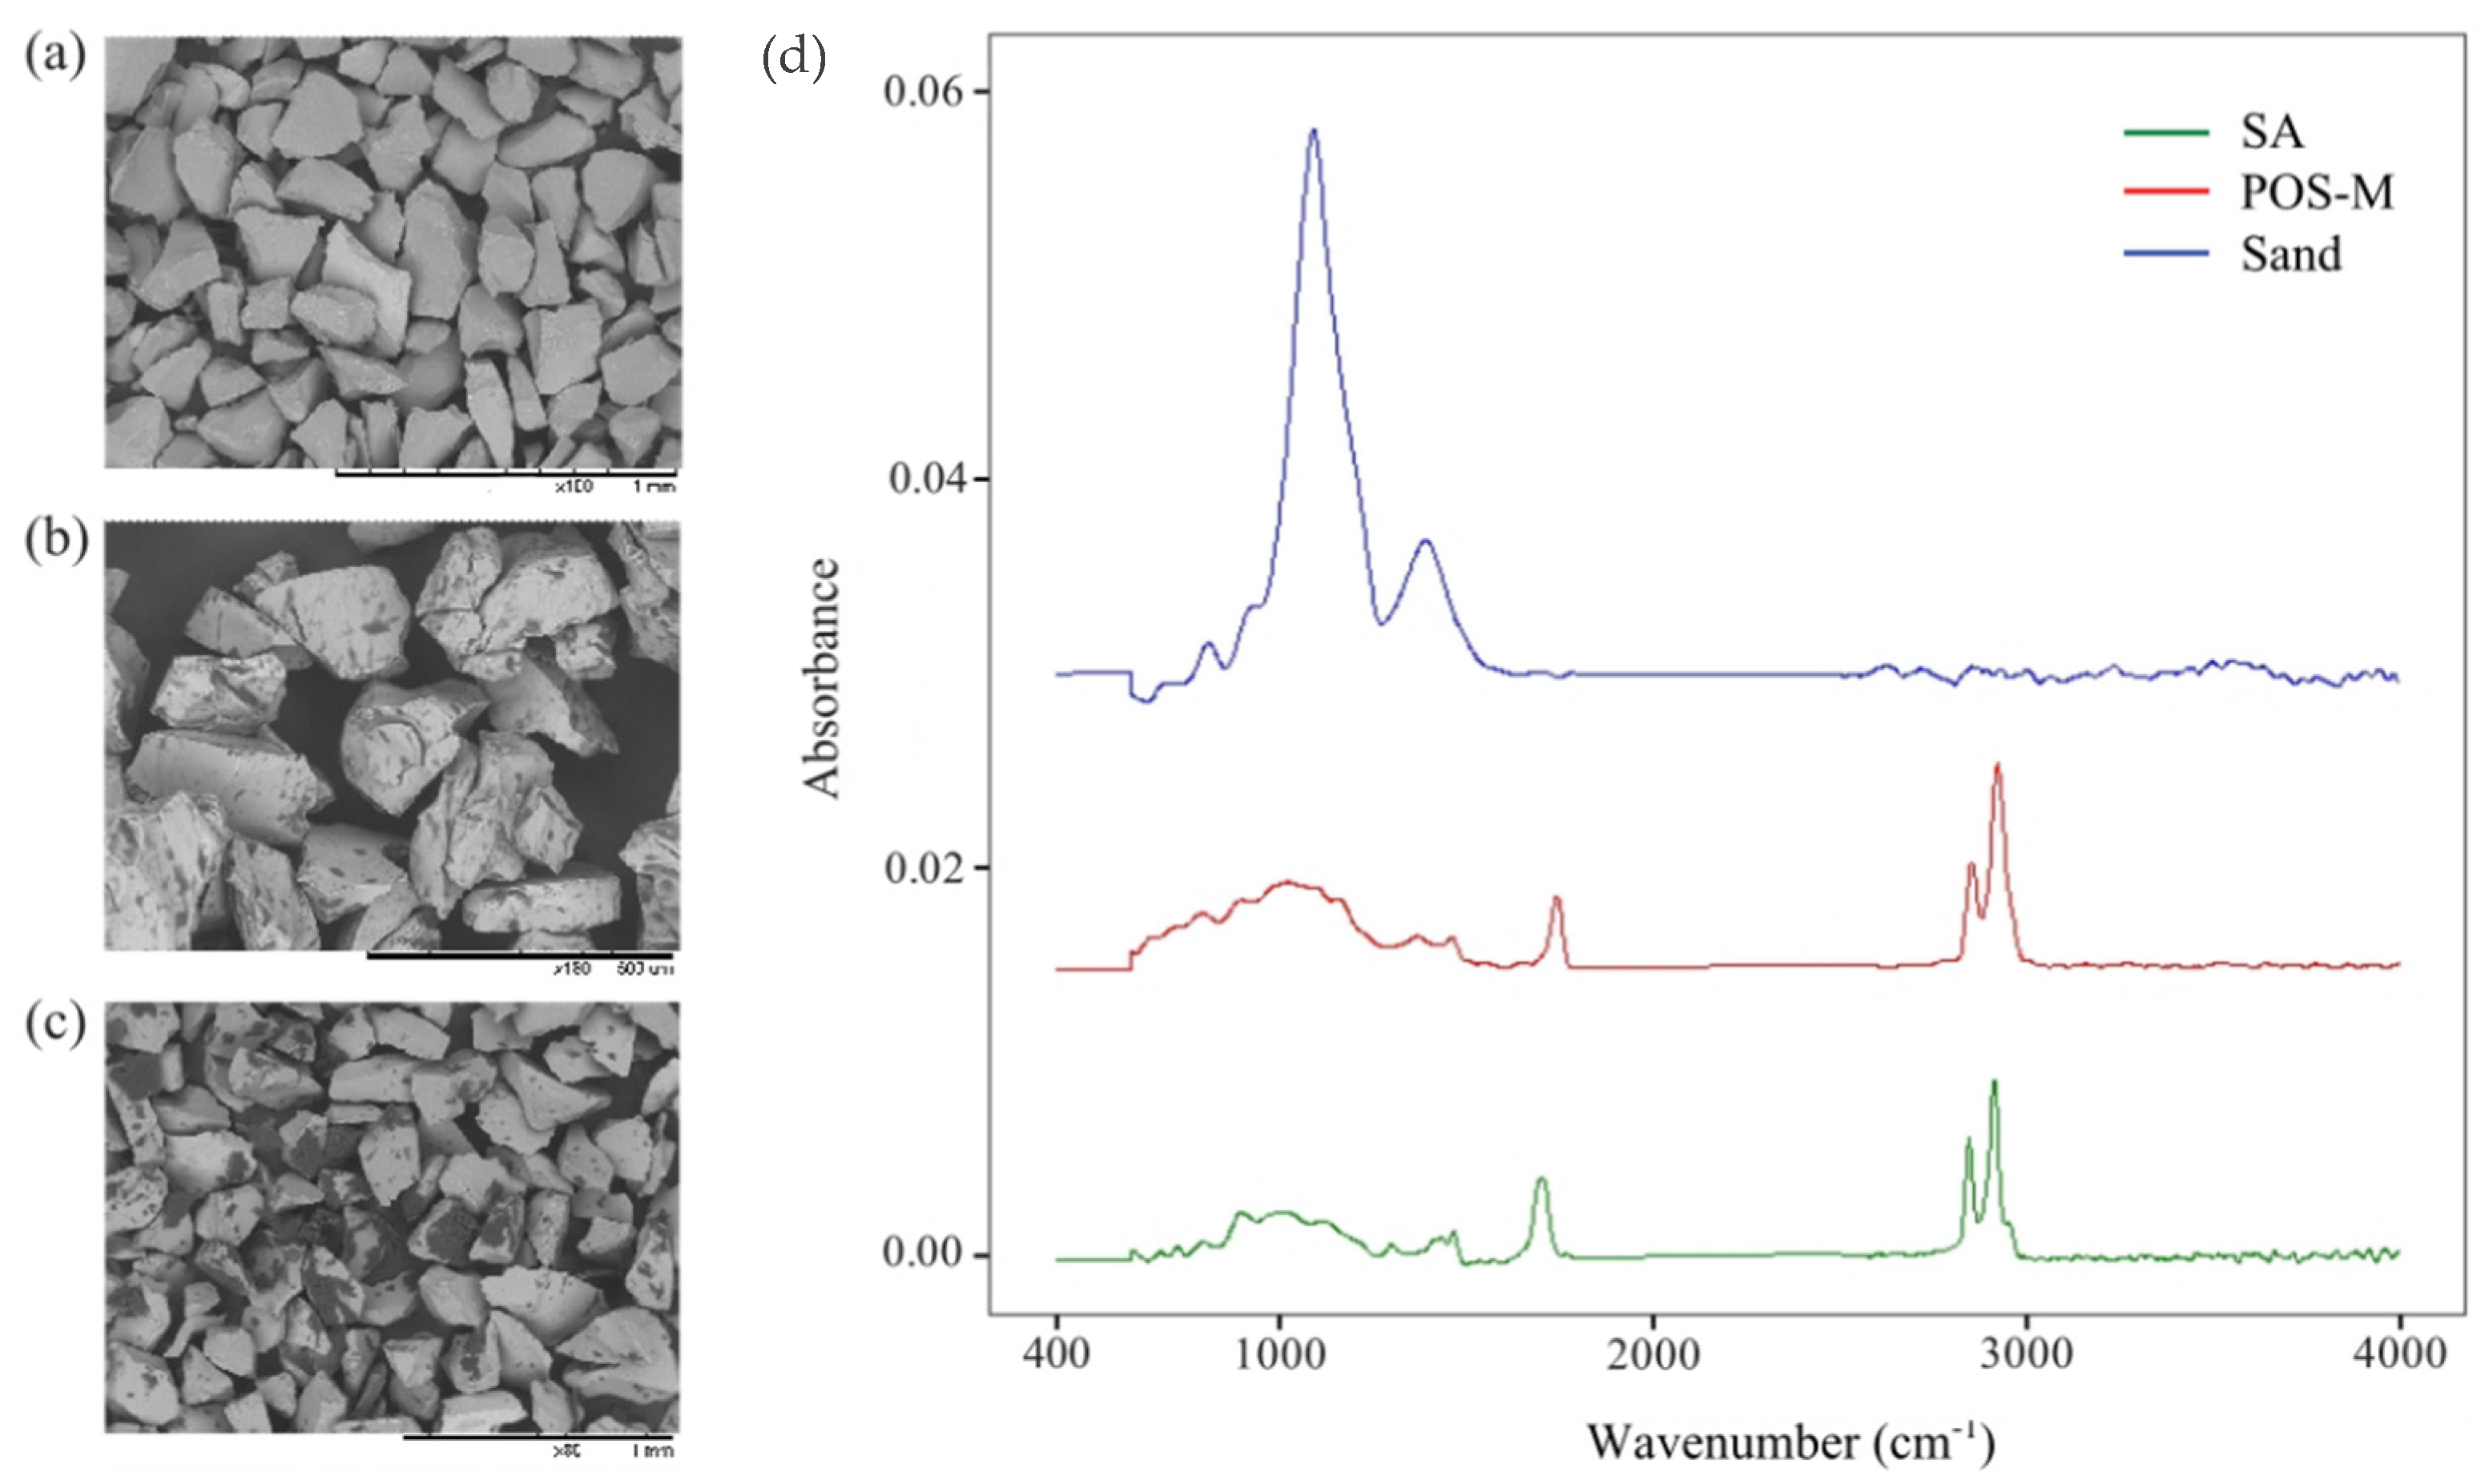
2.6.1. Images

For contrast comparison of surface morphology, a scanning electron microscope (SEM) TM 3000, Hitachi Tabletop Microscope (Tokyo, Japan) at 10 kV was used to direct the beam to the surface of the SA at 16 g/kg, control synthetic sand and POS-M at 10 g/kg, using 80×, 100× and 180× magnification, respectively.

2.6.2. ATR-FTIR

Attenuated total reflectance-Fourier transformed infrared spectroscopy (ATR-FTIR) was conducted with a Nicolet 380 FTIR spectrometer (Thermo Nicolet Corporation, Madison, WI, USA) equipped with an iATR accessory and controlled with OMNIC v9.3.301 software. Air dry samples of the SA at 16 g/kg, control synthetic sand, and POS-M at 10 g/kg were placed directly onto the diamond window. Measurements were made in the 600–4000 cm−1 spectral range using 32 scans and 4 cm−1 resolutions in absorbance mode.

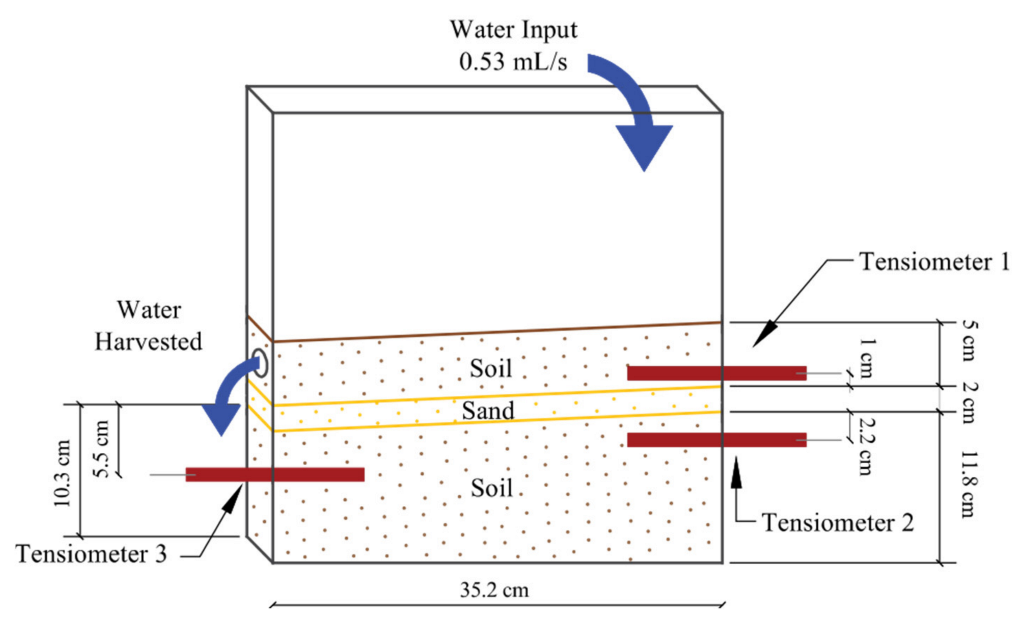
2.7. Qualitative Assessment of Capillary Barrier Effect of Hydrophobic Sand

2.7.1. Characterization of Soil

The soil used in the qualitative assessment was sampled from Isla Caballo, Puntarenas, Costa Rica, and its location is displayed in Figure 2. The island has an area of 364.5 ha with a mountainous terrain and beaches all around. The sample was specifically taken at the surface, 60 m from the coast. According to Mata-Chinchilla et al. [55] the soil in this area corresponds to a leptosol. The texture of the soil was determined using the Bouyucous Hydrometer method [56]. To determine the particle size distribution of the soil, the data from the Bouyucous Hydrometer at 2 h, 4 h and 6 h was used alongside Stokes’ Law. The soil used in the Bouyucous experiment, was sieved through a 53 µm sieve and rinsed to separate the sand particles. A sieve analysis was performed on the resulting sand according to the method described by Sivakugan [48] using sieves with openings of 250 µm and 500 µm.
Finally, the soil was packed into a steel ring of 3.5 cm in height and 6.1 cm in diameter at a bulk density of 1.01 g/cm3 [57] in order to determine the WCC. The WCC was constructed using a Hanging Water Column [58] for head pressures from saturation to field capacity, 0–100 cm-H2O (pF 0 to 2.0) and a WP4C potentiometer, Decagon Devices [59] for head pressures below −1000 cm-H2O (pF > 3.0). The van Genuchten–Mualem model [52] was used to generate the WCC using the software RETC [51]. The software was configured to calculate θs, α, and n, with a maximum of 50 iterations.

2.7.2. Qualitative Assessment

The qualitative assessment was performed in an impermeable acrylic box of 35.2 cm × 35.2 cm × 5 cm with an open top and four holes. The test consisted of layering soil and hydrophobic sand in the container as shown in Figure 3 and applying an intermittent flow of water of 0.53 mL/s from above with a total input of 546.7 mL. Three micro-tensiometers were inserted in the soil: one above the hydrophobic sand layer and two below measuring the change in matric potential of the soil as the experiment progressed. The experiment had a total duration of 33 min and 19.8 s. The remaining hole was used to collect the water runoff from the hydrophobic sand layer. The mass of the water was weighed and converted to volume using a water density of 1 g/mL.
The tensiometers were built by attaching round-bottom ceramic cups (0.99 cm o.d. and 8.61 cm long 1 bar; Soilmoisture Equipment Corp., Santa Barbara, CA, USA) to a flexible pipe and attaching to a 3-way stop valve a differential pressure transducer, ±15 psi (26PCCFA6D, Honeywell, Charlotte, NC, USA), data acquisition was carried out with a CR300 Datalogger by Campbell Scientific.

3. Results

3.1. Transformation of Glass and Palm Oil Waste into Hydrophobic Sand

3.1.1. Extraction of Fatty Acids from Palm Oil Waste Sludge and Glass Crushed into Sand

The synthetic sand’s particle distribution curve in Figure 4a shows it has a diameter range between 100 µm and 250 µm. The D50 was 180.95 µm, indicating that 50% of particles have a diameter equal to or below this value. Furthermore, the most frequent particle size, according to the Rossin-Rammler frequency curve, is 194.1 µm. The similarity in the D50 and most frequent particle size is characteristic of uniform size particles, which is further emphasized with a Cu of 1.5.
Figure 4b displays the extraction yield of PFA from PORS, per extraction and cumulatively. A total yield of 4.5% was achieved, where in the first extraction 78% of the total was extracted. The next 18% was in the second extraction, whereas only 4% of the total was extracted in the third iteration. Additionally, the PORS has a water content of 82% (m/m). The PFA had a solid and liquid consistency as well as orange coloring since oil palm is a well-known source of carotenes.
Table 1 shows the chemical composition of PFA which consists predominantly of palmitic acid and oleic acid with a summed concentration of 90.8 g/100 g. These acids are commonly found in palm oil products. It also has linoleic acid but in a much lower concentration. The PFA has a higher concentration of saturated fats than unsaturated fats.

3.1.2. Evaluation of Hydrophobic Sand

The results of the contact angle tests are shown in Figure 5a,b. The initial contact angles show that SA reached the ninety-degree line at a concentration of 3 g/kg. Watson and Letey [60] proposed 90° as an index of water repellency therefore, SA is considered hydrophobic at 3 g/kg. POS-M and POS-S reached the ninety-degree line at a concentration of 1 g/kg of PFA. The control sample of crushed glass proved to be completely wettable with a contact angle of 0°. Maximum contact angles of 119.73° and 118.83° were obtained for both, POS-M and POS-S, respectively, at 10 g/kg. On the other hand, SA at 10 g/kg, had a contact angle of 100.49°, which increased to 107.48° at a concentration of 1.6 g/kg. As evidenced in Figure 4a, initial contact angles for POS-M and POS-S, drop slightly after 10 g/kg. Both sands seem to have very similar contact angles regardless of concentration, as they always inside each other’s error bars. Figure 4b shows contact angles every 3 s for 117 s of SA at 16 g/kg, POS-M at 10 g/kg and POS-S at 10 g/kg (their respective optimum concentrations). Evidently, SA’s contact angle decreases more rapidly than POS-M and POS-S, and falls below 90° after 33 s. On the other hand, although POS-M and POS-S have an initial drop in contact angle, this quickly slows down resulting in a small constant reduction in their contact angles. When comparing POS-M and POS-S, their initial contact angles are very similar but in time POS-M maintains a slightly higher contact angle in time.
Hydraulic properties were also evaluated, Figure 5c compares the WCCs obtained for POS-M (10 g/kg), the control sand and SA (16 g/kg) and Table 2 lists the van Genuchten parameters calculated. The observation points fit to the van Genuchten–Mualem model with an R2 above 0.99. POS-M has the lowest retention capacity, followed by SA and finally the control sand, as is evidenced in Figure 5c. According to van Genuchten [52], the air entry point is approximately the inverse of α, therefore the head pressure for air-entry value of POS-M was −13.2 cm-H2O (pF = 1.12), for SA was −37.2 cm-H2O (pF = 1.57) and −50 cm-H2O (pF = 1.70) for the control sand. The saturated water content (θs) also decreased with hydrophobicity: 0.41 cm3 cm−3 for the control sand, 0.37 cm3 cm−3 for SA and 0.32 cm3 cm−3 for POS-M. Additionally, the WCC slopes are steeper for the control sand and SA, while POS-M has a slightly less steep slope as is reflected in their ‘n’ coefficients: 5.54, 6.14, and 4.54, respectively.
Figure 5d displays the hydraulic conductivity curves of the three sands. There is a drastic difference between the Ks of the control and the hydrophobic sands; in fact, Ks was reduced by two orders of magnitude. Additionally, even though POS-M has a higher Ks than SA, at pressures lower than −7.4 cm-H2O, (>pF = 0.87) POS-M’s unsaturated hydraulic conductivity is lower. Additionally, POS-M reaches zero conductivity before SA, at −23 cm-H2O (pF = 1.37). On the other hand, SA reaches 0 cm/h at −60.3 cm-H2O (pF = 1.78) and the control sand at −90.5 cm-H2O (pF = 1.98).
Figure 6a is a SEM image of the control sand which reveals that the milling of borosilicate glass produces a synthetic sand with an angular geometry and pointed edges. Figure 6b,c are SEM images of POS-M (10 g/kg) and SA (16 g/kg). POS-M appears to have a thin coating of PFA with accumulations in random areas, as is evidenced by its darker spots. On the other hand, SA has segmented coating, which is not as smooth or heterogeneous. Figure 6d shows the ATR-FTIR spectra of the control sand, POS-M (10 g/kg) and SA (16 g/kg). The control sand shows the common fingerprint for borosilicate glass and shows no evidence of hydrophobicity. On the other hand, POS-M and SA have a peak at 2800–3000 cm−1 range which indicates the presence of hydrophobic functional groups such as CH2 and CH3.

3.2. Qualitative Assessment of Capillary Barrier Effect

The soil has a loamy texture with high percentages of loam and sand, 39.8% and 43.3%, respectively. From the Rosin-Rammler curve in Figure 7a it can be assumed that there are a wide range of well sorted particles from 53 µm to 2000 µm. Figure 7b displays hydraulic properties of the soil, such as the WCC and hydraulic conductivity. The WCC adjusted well to the van Genuchten–Mualem model with an R2 of 0.999, and a Ks, of 2.4 cm/h. Finally, the results of the qualitative assessment can be found in Figure 7c, containing values of the tensiometer readings and the volume of water harvested. It took 180 s for the input of water to influence the matric potential of the soil above the hydrophobic sand layer. The soil on top reached saturation (0 cm-H2O) after 960 s with a maximum of 7.2 cm of ponded water. Below the hydrophobic sand layer, the soil remained unsaturated with values oscillating between −166.3 cm-H2O and −196.3 cm-H2O, until a leak was registered at 1080 s. At this time, tensiometer 2 became less unsaturated and reached a suction of −53.9 cm-H2O, whereas tensiometer 3 never became less unsaturated. It is also important to point out that during the first 500 s, tensiometers 1 and 2 became more saturated because they were entering equilibrium with the soil; and that it can be assumed that the suction of the untouched soil was of approximately −200 cm-H2O or pF = 2.3. During the experiment, water started collecting after 472 s, and a total of 49 mL was captured, which is 9% of the total water input.

4. Discussion

The observed uniformity of the particle size of the synthetic sand from Figure 4a indicates that the method used to produce and separate particles between 150 µm and 210 µm was successful. The fact that the particles differ so little in size means they are also similar in surface area, which is an important factor in the coating of particles [61]; the bigger the particle size, the more repellent at lower concentrations [46]. Therefore, the particles will be coated equally. This also suggests that it is safe to assume that pore size is uniform, meaning that, if used as a capillary barrier, the whole barrier layer will have the same hydraulic characteristics.
The results in Figure 4b reveal that two iterations are enough to extract the 97% of the fatty acids. This does not take into consideration that by using a different extraction method or a different solvent, more fatty acids could be extracted. While the liquid extraction method applied to the PORS to obtain PFA was successful, the extraction of fatty acids from PORS had a relatively low yield (<5%). The extraction of PFA could be an optional use before ultimate disposition (e.g., in composting or biochar production). Therefore, to be considered a good primary source and fulfill the ‘zero waste’ concept, additional studies are needed considering the sustainability and additional gain value of the remaining solid waste.
The results in Figure 5a,b of initial contact angles and contact angles in time show that the sands indeed became hydrophobic, as evidenced by contact angles higher than 90°. The hydrophobic agent, PFA, and both coating methods were successful in effectively reducing the surface energy of the synthetic sand. POS-M and POS-S reached even higher contact angles than SA, which has been used in a number of research regarding low cost hydrophobic sands [11,12,44,46].
Initial contact angles for POS-M and POS-S reveal a peak contact angle of approximately 120° at 10 g/kg followed by a slight reduction. Wijewardana et al. [2] used oleic acid as the hydrophobic agent and obtained a maximum contact angle of approximately 100° at 3 g/kg. Subedi et al. [11], who also used oleic acid, reached a maximum of 101° and 97° at 1 g/kg with the mixing in method and solvent-assisted method, respectively [11]. The authors similarly reported an initial contact angle of 108° at 6 g/kg for stearic-acid-coated sand [11], while González Peñaloza et al. obtained a maximum contact angle of around 101° at 1 g/kg that remained constant [46]. Since the contact angle of SA is comparable to the literature, one can assume that the high hydrophobicity of POS-M and POS-S compared to other fatty-acid-coated sands may be caused by the mixture of different fatty acids. To the best of the authors’ knowledge, there are no studies that use a mixture of fatty acids as a hydrophobic agent.
The results in Figure 5a show that POS-M and POS-S suffer a drop in hydrophobicity after peak contact angle is reached. This phenomenon was also observed by Wijewardana et al. [2] and Subedi et al. [11] when using oleic acid. This occurs due to the formation of a multiple layer coat, which causes the hydrophilic head of the fatty acid to point outward, attracting water molecules and consequently, reducing water repellency [2]. Contrarily, when peak hydrophobicity is reached, there is a monolayer surrounding the particle with the hydrophobic tail pointed outwards [2].
Results of the contact angle in time show that POS-M has a slightly higher stability in time than POS-S, even though they both have very similar initial contact angles. All hydrophobic sands or soils experience an exponential decrease in contact angle in time, followed by an equilibrium. This was also the case for Subedi et al. [11] with oleic acid and stearic acid and for Leelamanie and Juntaro [44] using stearic acid. Doerr et al. [41] argue that this occurs because the hydrophilic head of the fatty acids attracts water molecules, which then weaken the adhesion between the fatty acid and the sand causing them to separate and lose hydrophobicity. Additionally, water is absorbed onto the contact surface which increases surface energy [44]. The variation of the contact angle in time varies depending on the strength of the adherence between the sand particle and the hydrophobic agent. In the case of this fatty acid mixture, the mixing method provided a stronger adhesion to the synthetic sand particle. This is contrary to what was evidenced by Subedi et al. [11] when comparing mixing in method and solvent-assisted method for oleic-acid-coated sands.
Moreover, there is a clear relationship between the degree of hydrophobicity of sand and its WCC. The POS-M has the least retention capacity of the three sands analyzed and is the sand with the highest initial contact angle. Hydrophobization leads to the weakening of adhesive and capillary forces between the particles and the water molecules. This is evidenced by a lower air entry value; thus, less suction is needed to drain the pores; and a lower θs (cm3 cm−3). In fact, according to the capillary ascent model, when the walls pores have a contact angle above 90°, the water experiences a capillary descent. A diminished capillary force is one of the main components for a successful capillary barrier; the soil above the hydrophobic sand layer will have a stronger capillary force, preventing infiltration of water below [4]. Liu et al. [62] reported the same results when comparing soils that were hydrophobized versus untreated soils and discovered that water retention differences were small or none at saturation, whereas at a higher pF the difference in water content became bigger [62]. Therefore, POS-M, will be effective as a hydrophobic capillary barrier at matric potential lower than −13.2 cm-H2O (pF > 1.12), which is the point where the POS-M curve deviates the most to the control curve. Interestingly, the ‘n’ coefficient, which describes the slope of the WCC from the air entry value onwards [52], is lower for POS-M than SA or the control sand, even though it is more hydrophobic. This can be explained by the fact that POS-M drained its pores at a lower suction/higher water saturation. In contrast, SA and the control sand drained their pores at a higher suction, provoking a steeper decrease in water content.
Figure 5d presents the hydraulic conductivity values as a function of suction of the control sand, POS-M and SA. The considerable difference in Ks between the control sand and the hydrophobic sands shows the latter provide the capillary barrier with a higher infiltration resistance. Dell’Avanzi et al. [10] reported a decrease in 3 orders of magnitude between the Ks of untreated sand and the Ks of Polytetrafluorethylene (PTFE)-coated sand. The hydrophobic sands (SA and POS-M) have very similar Ks; SA being the one with the lowest even though it is less hydrophobic. Nonetheless, at −7.4 cm-H2O, (pF > 0.87) the hydraulic conductivity of POS-M is lower than that of SA and even reaches cero conductivity 37.3 cm-H2O before SA. This is because POS-M has less water retention, it stops conducting water at higher moisture. Liu et al. [62] suggest that because hydrophobicity decreases with saturation, the effects of a hydrophobicity are more visible in dryer regions. Thus, explaining why POS-M has the lowest conductivity once the soil drains. Additionally, Zheng et al. [5] point out that for capillary barriers, it is necessary that the coarse lower layer has a lower unsaturated hydraulic conductivity; this is what will provoke the barrier effect. According to these results, POS-M has the optimum hydraulic conductivity for a capillary barrier.
The SEM images revealed that the synthetic sand particles have an angular geometry. Both POS-M and SA seem to lack a uniform layer of coating around the particle, but according to Doerr [41], it is expected that hydrophobic agents will absorb onto soil particles as small globules. The mixing method seems to coat PFA onto these particles more efficiently and allows full coverage. It has also been discussed that angularity hinders the formation of a multilayer of fatty acid [2], which could explain why the peak hydrophobicity is obtained at a higher concentration than other studies [2,11,12]. Additionally, the ATR-FTIR spectra show that POS-M and SA impregnated indistinctively with a mixture of fatty acids or single stearic acid, present the asymmetric stretching vibration (2918–2924 cm−1) and the symmetric stretching vibration (2850–2853 cm−1) of the aliphatic C-H group typical of alkane. This is the driving cause in lowering the surface energy of borosilicate sand, thus in increasing the contact angle that leads to the capillary effect.
Finally, the qualitative assessment showed promising results; a barrier effect was in fact observed which is evidenced by the rapid decrease in suction in the tensiometer above the hydrophobic sand layer and the formation of a 7.2 cm H2O column. Additionally, the bottom layer of soil remained mostly unsaturated even at the start of the collection of water, except for a leak near Tensiometer 2. The infiltration of water occurs, roughly, when the soil becomes ponded, which could indicate that 2 cm layer of hydrophobic sand can experience leaks when subjected to a 4 cm-H2O column. This test observes the efficacy of the capillary barrier, it is not as a quantitative measure to determine its exact breakthrough point. Zheng et al. [5] and Dell’Avanzi et al. [10] conducted laboratory scale capillary barrier tests comparing the water entry points of a conventional capillary barrier and a hydrophobized capillary barrier. Zheng et al. [5] found that the water-repellent barrier was able to withstand up to 6.3 cm-H2O, whereas the conventional capillary barrier has a breakthrough at a negative pF, in other words before saturation. Dell’Avanzi et al. [10] reported similar results, where in same conditions, the conventional capillary barrier lasted 44 min without leaking; the hydrophobic capillary barrier lasted more than 2 h. The top layer of finer soil’s role is to act as a reservoir that stores the water and holds it; therefore, it is important to consider this layer also when constructing the capillary barrier.

5. Conclusions

This study addressed the sustainably use of solid waste to produce hydrophobic sands from borosilicate glass and palm oil production. The first cannot be recycled for bottle production due to its high melting point compared to standard glass. Therefore, optional uses of borosilicate glass are compulsory. Palm oil residual sludge results demonstrated that there is at least 4.5% of fatty acids remaining that can be extracted before final disposition. Gas chromatography revealed that PFA consists mostly of palmitic acid and oleic acid, with a small amount of lauric acid. Regarding the borosilicate glass waste, we obtained a median particle size of 180 µm by a combination of mills normally applied in the glass industry, producing sands with an angular geometry that can be valuably hydrophobized.
The hydrophobization of these synthetic sands was successful and reached contact angles above 90°. The maximum contact angle reached for PFA-coated particles was 119.73°: a result of the mixing method and a concentration of 10 g/kg. POS-M delivered the most water-repellent sand in the study, reflected by its greater initial contact angle and time dependent contact angles.
The effects of hydrophobization were also seen in the sand’s hydraulic properties. POS-M and SA’s saturated hydraulic conductivity was two orders of magnitude lower than the control sand. Water holding capacity decreased with a higher hydrophobicity, POS-M being the sand with the lowest capacity. These results are congruent with the necessary characteristics for the development of hydrophobic capillary barriers.
The qualitative assessment of the capillary barrier effect shows that hydrophobic borosilicate glass in loam soil can harvest water. The micro-tensiometer above the layer of POS-M registered values between −130 cm-H2O and 7.2 cm-H2O, while the micro-tensiometers below the layer remained unsaturated for the most part. At 1100 s, there was a leak which was registered on only one side of the glass box.
PORS and waste borosilicate glass have proven to be effective materials for the fabrication of hydrophobic sands and can be used for the construction of hydrophobic capillary barriers in water harvesting and landfill cover systems. Further research could apply industrial scale extraction methods and analyze the economic impact of this to produce hydrophobic sands. Other non-recyclable glass, such as flat glass, should be considered for future studies andthe leaking in the qualitative assessment should be addressed by scaling and optimizing the capillary barrier design.

Author Contributions

Conceptualization, F.M.-M.; Methodology, F.M.-M. and M.B.-S.; Formal Analysis, J.S.-P., M.B.-S. and F.M.-M.; Investigation, J.S.-P. and F.M.-M.; Resources, F.M.-M., M.B.-S. and R.R.-D.; Writing—Original Draft Preparation, J.S.-P.; Writing—Review and Editing, M.B.-S., R.R.-D., F.M.-M. and J.S.-P.; Supervision, F.M.-M. and R.R.-D.; Funding Acquisition R.R.-D., M.B.-S. and F.M.-M. All authors have read and agreed to the published version of the manuscript.

Funding

This work was partially funded by the Costa Rica Ministry of Science, Technology, and Telecommunications (MICITT), grant CONICIT FI-044B-19, and the Vice-presidency of Research and Outreach at the Instituto Tecnológico de Costa Rica, project 1360045.

Institutional Review Board Statement

Not applicable.

Informed Consent Statement

Not applicable.

Data Availability Statement

Not applicable.

Acknowledgments

We would like to thank CoopeArgopal for providing the Palm Oil Residual Sludge and for trusting us, as well as Aníbal Ruíz for his help in taking soil samples. We give thanks to Javier Pineda from Grupo VILCA for help on the milling process and thanks to Byron Setoguchi for helping in building the set up.

Conflicts of Interest

The authors declare no conflict of interest.

References

  1. Zhan, L.; Li, G.; Jiao, W.; Lan, J.; Chen, Y.; Shi, W. Performance of a Compacted Loess/Gravel Cover as a Capillary Barrier and Landfill Gas Emissions Controller in Northwest China. Sci. Total Environ. 2020, 718, 137195. [Google Scholar] [CrossRef] [PubMed]
  2. Wijewardana, N.S.; Kawamoto, K.; Moldrup, P.; Komatsu, T.; Kurukulasuriya, L.C.; Priyankara, N.H. Characterization of Water Repellency for Hydrophobized Grains with Different Geometries and Sizes. Environ. Earth Sci. 2015, 74, 5525–5539. [Google Scholar] [CrossRef]
  3. Solanki, B.; Gapak, Y.; Tadikonda, B.V. Capillary Barrier Effects in Unsaturated Layered Soils. In Proceedings of the International Conference on Soil and Environment, Bangalore, India, 22–23 July 2016; pp. 1–8. [Google Scholar]
  4. Simon, F.; Müller, W.W. Standard and Alternative Landfill Capping Design in Germany. Environ. Sci. Policy 2004, 7, 277–290. [Google Scholar] [CrossRef]
  5. Zheng, S.; Xing, X.; Lourenço, S.D.N.; Cleall, P.J. Cover Systems with Synthetic Water-Repellent Soils. Vadose Zone J. 2021, 20, 1–15. [Google Scholar] [CrossRef]
  6. Khire, M.V.; Benson, C.H.; Bosscher, P.J. Field Data from a Capillary Barrier and Model Predictions with UNSAT-H. J. Geotech. Geoenviron. Eng. 1999, 125, 518–527. [Google Scholar] [CrossRef]
  7. Stormont, J.C.; Anderson, C.E. Capillary Barrier Effect from Underlying Coarser Soil Layer. J. Geotech. Geoenviron. Eng. 1999, 125, 641–648. [Google Scholar] [CrossRef]
  8. Meerdink, J.; Benson, C.; Khire, M. Unsaturated Hydraulic Conductivity of Two Compacted Barrier Soils. J. Geotech. Eng. 1996, 122, 565–576. [Google Scholar] [CrossRef]
  9. Khire, M.V.; Benson, C.H.; Bosscher, P.J. Capillary Barriers: Design Variables and Water Balance. J. Geotech. Geoenviron. Eng. 2000, 126, 695–708. [Google Scholar] [CrossRef] [Green Version]
  10. Dell’Avanzi, E.; Guizelini, A.P.; da Silva, W.R.; Nocko, L.M. Potential Use of Induced Soil-Water Repellency Technique to Improve the Performance of Landfill’s Alternative Final Cover Systems. In Proceedings of the 4th Asia-Pacific Conference on Unsaturated Soils (UNSAT 2009), Newcastle, Australia, 23–25 November 2009; pp. 461–466. [Google Scholar]
  11. Subedi, S.; Kawamoto, K.; Jayarathna, L.; Vithanage, M.; Moldrup, P.; Wollesen de Jonge, L.; Komatsu, T. Characterizing Time-Dependent Contact Angles for Sands Hydrophobized with Oleic and Stearic Acids. Vadose Zone J. 2012, 11, vzj2011.0055. [Google Scholar] [CrossRef]
  12. Subedi, S.; Hamamoto, S.; Komatsu, T.; Kawamoto, K. Development of Hydrophobic Capillary Barriers for Landfill Covers System: Assessment of Water Repellency and Hydraulic Properties of Water Repellent Soils. Res. Rep. Dep. Civ. Environ. Eng. Saitama Univ. 2013, 39, 33–44. [Google Scholar]
  13. Choi, Y.; Choo, H.; Yun, T.S.; Lee, C.; Lee, W. Engineering Characteristics of Chemically Treated Water-Repellent Kaolin. Materials 2016, 9, 978. [Google Scholar] [CrossRef] [PubMed]
  14. Saenz, A. Waterproof Nanotech Sand Could Change Deserts into Farms. Available online: https://singularityhub.com/2009/09/17/waterproof-nanotech-sand-could-change-deserts-into-farms/ (accessed on 20 July 2022).
  15. Zyga, L. Hydrophobic Sand Could Combat Desert Water Shortages. Available online: https://phys.org/news/2009-02-hydrophobic-sand-combat-shortages.html (accessed on 20 July 2022).
  16. Jones, J.V.; Ohlberg, S.M. Flat Glass Composition with Improved Melting and Tempering Properties. U.S. Patent No 5,071,796, 10 December 1991. [Google Scholar]
  17. George, W.M. The Composition of Glass. Am. Assoc. Adv. Sci. 1936, 42, 542–554. [Google Scholar] [CrossRef] [Green Version]
  18. Bravo, M.; Brito, J.; de Pontes, J.; Evangelista, L. Mechanical Performance of Concrete Made with Aggregates from Construction and Demolition Waste Recycling Plants. J. Clean. Prod. 2015, 99, 59–74. [Google Scholar] [CrossRef]
  19. WACA. What Can Be Done about West Africa’s Disappearing Sand? 2018, pp. 1–4. Available online: https://weandb.org/wp-content/uploads/2018/03/ks_west-africa-is-running-out-en-v1-20171114.pdf (accessed on 12 October 2021).
  20. Kaza, S.; Yao, L.; Bhada-Tata, P.; Van Woerden, F. What a Waste 2.0: A Global Snapshot of Solid Waste Management to 2050; World Bank Group: Washington, DC, USA, 2018; Volume 7, ISBN 9772081415. [Google Scholar]
  21. Wartman, J.; Grubb, D.G.; Nasim, A.S.M. Select Engineering Characteristics of Crushed Glass. J. Mater. Civ. Eng. 2004, 16, 526–539. [Google Scholar] [CrossRef]
  22. Kazmi, D.; Serati, M.; Williams, D.J.; Qasim, S.; Cheng, Y.P. The Potential Use of Crushed Waste Glass as a Sustainable Alternative to Natural and Manufactured Sand in Geotechnical Applications. J. Clean. Prod. 2021, 284, 124762. [Google Scholar] [CrossRef]
  23. Limbachiya, M.C. Bulk Engineering and Durability Properties of Washed Glass Sand Concrete. Constr. Build. Mater. 2009, 23, 1078–1083. [Google Scholar] [CrossRef]
  24. Imteaz, M.A.; Ali, M.Y.; Arulrajah, A. Possible Environmental Impacts of Recycled Glass Used as a Pavement Base Material. Waste Manag. Res. 2012, 30, 917–921. [Google Scholar] [CrossRef] [PubMed]
  25. Lai, O.; Phuah, E.; Lee, Y.; Basiron, Y. Palm Oil. In Bailey’s Industrial Oil and Fat Products; John Wiley and Sons: Hoboken, NJ, USA, 2020; pp. 1–101. ISBN 047167849X. [Google Scholar]
  26. Lai, O.-M.; Tan, C.-P.; Akoh, C. Palm Oil: Production, Processing, Characterization and Uses; AOCS Press: Sommerville, MA, USA, 1995. [Google Scholar]
  27. Obi, O.F. Evaluation of the Effect of Palm Oil Mill Sludge on the Properties of Sawdust Briquette. Renew. Sustain. Energy Rev. 2015, 52, 1749–1758. [Google Scholar] [CrossRef]
  28. Obi, O.F.; Okongwu, K.C. Characterization of Fuel Briquettes Made From a Blend of Rice Husk and Palm Oil Mill Sludge. Biomass Convers. Biorefinery 2016, 5, 449–456. [Google Scholar] [CrossRef]
  29. Lee, X.J.; Hiew, B.Y.Z.; Lai, K.C.; Tee, W.T.; Thangalazhy-Gopakumar, S.; Gan, S.; Lee, L.Y. Applicability of a Novel and Highly Effective Absorbent Derived From Industrial Palm Oil Mill Sludge for Copper Sequestration: Central Composite Design Optimization and Adsorption Performance Evaluation. J. Environ. Chem. Eng. 2021, 9, 105968. [Google Scholar] [CrossRef]
  30. Iberahim, N.; Sethupathi, S.; Bashir, M.J.K. Optimization of Palm Oil Mill Sludge Biochar Preparation for Sulfur Dioxide Removal. Environ. Sci. Pollut. Res. 2018, 25, 25702–25714. [Google Scholar] [CrossRef] [PubMed]
  31. Yaser, A.Z.; Rahman, R.A.; Kalil, M.S. Co-Composting of Palm Oil Mill Sludge-Sawdust. Pakistan J. Biol. Sci. 2007, 10, 4473–4478. [Google Scholar] [CrossRef] [Green Version]
  32. Rupani, P.F.; Singh, R.P.; Ibrahim, M.H.; Esa, N. Review of Current Palm Oil Mill Effluent (POME) Treatment Methods: Vermicomposting as a Sustainable Practice Cite This Paper Related Papers Management of Biomass Residues Generat Ed from Palm Oil Mill: Vermicompost Ing a Sust Aina… Norizan Esa A Review On. World Appl. Sci. J. 2010, 10, 1190–1201. [Google Scholar]
  33. Nuchdang, S.; Phruetthinan, N.; Paleeleam, P.; Domrongpokkaphan, V.; Chuetor, S.; Chirathivat, P.; Phalakornkule, C. Soxhlet, Microwave-Assisted, and Room Temperature Liquid Extraction of Oil and Bioactive Compounds from Palm Kernel Cake Using Isopropanol as Solvent. Ind. Crops Prod. 2022, 176, 114379. [Google Scholar] [CrossRef]
  34. Zamanhuri, N.A.; Rahman, N.A.; Bakar, N.F.A. Extraction of Palm Fatty Acids from Sterilized Oil Palm Mesocarp by Microwave Technique: Optimization and Kinetics. Mater. Today Proc. 2022, 63, 166–173. [Google Scholar] [CrossRef]
  35. Priego-Capote, F. Solid–Liquid Extraction Techniques. In Analytical Sample Preparation with Nano- and Other High-Performance Materials; Lucena, R., Cárdenas, S., Eds.; Elsevier: Amsterdam, The Netherlands, 2021; pp. 111–130. [Google Scholar]
  36. Daso, A.P.; Okonkwo, O.J. Conventional Extraction Techniques: Soxhlet and Liquid–Liquid Extractions and Evaporation. In Analytical Separation Science; John Wiley and Sons: Hoboken, NJ, USA, 2015; ISBN 9783527678129. [Google Scholar]
  37. Zimila, H.; Mandlate, J.; Artur, E.; Muaimbo, H.; Uamusse, A. Vortex-Assisted Solid-Liquid Extraction for Rapid Screening of Oil Content in Jatropha Seed: An Alternative to the Modified Soxhlet Method. S. Afr. J. Chem. 2021, 75, 1–5. [Google Scholar] [CrossRef]
  38. Vernès, L.; Vian, M.; Chemat, F. Ultrasound and Microwave as Green Tools for Solid-Liquid Extraction. In Liquid-Phase Extraction; Elsevier: Avignon, France, 2020; pp. 355–374. [Google Scholar]
  39. Mahindrakar, K.; Rathod, V. Ultrasound-Assisted Extraction of Lipids, Carotenoids, and Other Compounds from Marine Resources. In Innovative and Emerging Technologies in the Bio-Marine Food Sector; García-Vaquero, M., Rajauria, G., Eds.; Academic Press: Cambridge, MA, USA, 2022; pp. 81–128. [Google Scholar]
  40. Cervera-Mata, A.; Aranda, V.; Ontiveros-Ortega, A.; Comino, F.; Martín-García, J.M.; Vela-Cano, M.; Delgado, G. Hydrophobicity and Surface Free Energy to Assess Spent Coffee Grounds as Soil Amendment. Relationships with Soil Quality. Catena 2021, 196, 1–14. [Google Scholar] [CrossRef]
  41. Doerr, S.H.; Shakesby, R.A.; Walsh, R.P.D. Soil Water Repellency: Its Causes, Characteristics and Hydro-Geomorphological Significance. Earth Sci. Rev. 2000, 51, 33–65. [Google Scholar] [CrossRef]
  42. Chan, C.S.H.; Lourenço, S.D.N. Comparison of Three Silane Compounds to Impart Water Repellency in an Industrial Sand. Geotech. Lett. 2016, 6, 1–4. [Google Scholar] [CrossRef] [Green Version]
  43. Zhou, Z.; Leung, A.K.; Karimzadeh, A.A.; Lau, C.H.; Li, K.W. Infiltration through an Artificially Hydrophobized Silica Sand Barrier. J. Geotech. Geoenviron. Eng. 2021, 147, 06021006. Available online: https://hdl.handle.net/1783. [CrossRef]
  44. Leelamanie, D.A.L.; Karube, J. Time Dependence of Contact Angle and Its Relation to Repellency Persistence in Hydrophobized Sand. Jpn. Soc. Soil Sci. Plant Nutr. 2009, 55, 457–461. [Google Scholar] [CrossRef]
  45. Bachmann, J.; Horton, R.; van der Ploeg, R.R.; Woche, S. Modified Sessile Drop Method for Assessing Initial Soil-Water Contact Angle of Sandy Soil. Soil Sci. Soc. Am. J. 2000, 64, 564–567. [Google Scholar] [CrossRef]
  46. González-Peñaloza, F.A.; Zavala, L.M.; Jordán, A.; Bellinfante, N.; Bárcenas-Moreno, G.; Mataix-Solera, J.; Granged, A.J.P.; Granja-Martins, F.M.; Neto-Paixão, H.M. Water Repellency as Conditioned by Particle Size and Drying in Hydrophobized Sand. Geoderma 2013, 209, 31–40. [Google Scholar] [CrossRef]
  47. Hasanuzzaman, M.; Rafferty, A.; Sajjia, M.; Olabi, A. Materials Science and Materials Engineering; Elsevier: Amsterdam, The Netherlands, 2016. [Google Scholar]
  48. Sivakugan, N. Soil Classification. In Soil Mechanics and Foundation Engineering: Fundamentals and Applications; McGraw Hill: New York, NY, USA, 2021. [Google Scholar]
  49. Vesilind, A. The Rosin-Rammler Particle Size Distribution. Resour. Recover. Conserv. 1980, 5, 275–277. [Google Scholar] [CrossRef]
  50. Kranias, S.; GmbH, K. Effect of Drop Volume on Static Contact Angles; KRÜSS GmbH: Hamburg, Germany, 2004. [Google Scholar]
  51. Van Genuchten, M.T.; Leij, F.J.; Yates, S.R. The RETC Code for Quantifying the Hydraulic Functions of Unsaturated Soils. Environmental Protection Agency, 1991. Available online: https://www.pc-progress.com/Documents/programs/retc.pdf (accessed on 23 September 2022).
  52. Van Genuchten, M.T. A Closed-Form Equation for Predicting the Hydraulic Conductivity of Unsaturated Soils. Soil Sci. Soc. Am. J. 1980, 44, 892–898. [Google Scholar] [CrossRef] [Green Version]
  53. Reynolds, W.D.; Elrick, D.E.; Youngs, E.G.; Booltink, H.W.G.; Bouma, J. Physical Methods. In Methods of Soil Analysis; Dane, J., Topp, C., Eds.; Soil Science Society of America: Madison, WI, USA, 2002; pp. 802–816. [Google Scholar]
  54. Šimůnek, J.; Šejna, M.; Saito, H.; Sakai, M.; van Genuchten, M.T. The Hydrus-1D Software Package for Simulating the One-Dimensional Movement of Water, Heat and Multiple Solutes in Variably-Saturated Media. University of Environmental Sciences, 2009. Available online: https://www.pc-progress.com/Downloads/Pgm_hydrus1D/HYDRUS1D-4.08.pdf (accessed on 23 September 2022).
  55. Mata-Chinchilla, R.; Ibarra, R.; Gerardo, A.; Sandoval, D. Subórdenes de Suelo de Costa Rica; Asociación Costarricenses de Ciencias del Suelo: 2013. Available online: https://catalogosiidca.csuca.org/Record/UCR.000439870#similar (accessed on 23 September 2022).
  56. Gee, G.; Or, D. Particle Size Analysis. In Methods of Soil Analysis; Dane, J., Topp, C., Eds.; Soil Science Society of America: Madison, WI, USA, 2002; Volume 3, pp. 225–282. [Google Scholar]
  57. Dane, J.; Hopmans, J. Water Retention and Storage. In Methods of Soil Analysis; Dane, J., Topp, C., Eds.; Soil Science Society of America: Madison, WI, USA, 2002; p. 677. [Google Scholar]
  58. Eijkelkamp Soil & Water User Manual: Sandbox for PF-Determination. 2019, pp. 1–25. Available online: https://www.royaleijkelkamp.com/media/ny1lqhyr/m-0801e-sandbox-for-pf-determination.pdf (accessed on 4 August 2021).
  59. Meter Group Inc WP4C Operator’s Manual. 2021. Available online: https://manuals.plus/meter/wp4c-water-potential-meter-manual (accessed on 23 September 2022).
  60. Watson, C.; Letey, J. Indices for Characterizing Soil-Water Repellency Based Upon Contact Angle-Surface Tension Relationships. Soil Sci. Soc. Am. J. 1970, 34, 841–844. [Google Scholar] [CrossRef]
  61. Iley, W.J. Effect of Particle Size and Porosity on Particle Film Coatings. Powder Technol. 1991, 65, 441–445. [Google Scholar] [CrossRef]
  62. Liu, H.; Ju, Z.; Bachmann, J.; Horton, R.; Ren, U. Moisture-Dependent Wettability of Artificial Hydrophobic Soils and Its Relevance for Soil Water Desorption Curves. Soil Sci. Soc. Am. J. 2012, 76, 342–349. [Google Scholar] [CrossRef]
Figure 1. (a) Borosilicate glass milling, (b) palm oil solid waste extraction process, (c) production of hydrophobic sands: POS-S, SA, and POS-M.
Sustainability 14 12770 g001
Figure 2. Map of location of Isla Caballo in Costa Rica.
Sustainability 14 12770 g002
Figure 3. Set up of the qualitative assessment of capillary barrier effect.
Sustainability 14 12770 g003
Figure 4. Results of transformation of glass and palm oil solid waste: (a) particle distribution curve of crushed glass; (b) yield of fatty acid extraction from palm oil waste.
Sustainability 14 12770 g004
Figure 5. Characterization of hydrophobic sand produced: (a) contact angle of hydrophobic sands as a function of fatty acid concentration; (b) contact angle in time for POS-S at 10 g/kg, POS-M at 10 g/kg, and SA at 16 g/kg; (c) characteristic water retention curves for POS-M at 10 g/kg, SA at 16 g/kg, and control sand; (d) hydraulic conductivity curves for POS-M at 10 g/kg, SA at 16 g/kg, and control sand, m3/m3.
Sustainability 14 12770 g005
Figure 6. SEM images and FTIR analysis of optimum hydrophobic sand: (a) SEM image of control synthetic sand; (b) SEM image of POS-M at 10 g/kg; (c) SEM image of SA at 16 g/kg and (d) absorbance curve for POS-M, synthetic sand control, and SA.
Sustainability 14 12770 g006
Figure 7. Soil analysis and qualitative assessment results: (a) particle distribution and texture of soil; (b) hydraulic conductivity curve and characteristic water retention curve of the soil; (c) pressure head of tensiometers in time and volume of water harvested in time.
Sustainability 14 12770 g007
Table 1. Composition of fatty acids extracted from palm oil residual sludge.
Fatty AcidConcentration (g/100 g)
Capric Acid C10:00.0145 ± 0.0025
Lauric Acid C12:00.188 ± 0.032
Myristic Acid C14:01.22 ± 0.21
Palmitic Acid C16:054.1 ± 9.2
Pentadecanoic Acid C15:00.0400 ± 0.0068
Pentadecanoic Acid C15:10.0112 ± 0.0019
Oleic Acid C18:136.7 ± 6.2
Linoleic Acid C18:27.7 ± 1.3
Saturated Fat55.6 ± 5.3
Monounsaturated Fat36.7 ± 2.8
Polyunsaturated Fat7.71 ± 0.74
Table 2. Van Genuchten parameters of the sand’s WCCs.
Sandθs (cm3 cm−3)α (cm−1)nm
Control Sand0.410.01995.5440.820
SA0.370.02696.1390.837
POS-M0.320.07584.5430.780
Publisher’s Note: MDPI stays neutral with regard to jurisdictional claims in published maps and institutional affiliations.

