Article

Longitudinal Driving Behavior before, during, and after a Left-Turn Movement at Signalized Intersections: A Naturalistic Driving Study in China

1
State Key Laboratory of Vehicle NVH and Safety Technology, China Automotive Engineering Research Institute Co., Ltd., Chongqing 401122, China
2
School of Mechanical Engineering, Chongqing Technology and Business University, Chongqing 400067, China
3
School of Automation, Chongqing University, Chongqing 400044, China
4
Key Laboratory of Transport Industry of Big Data Application Technologies for Comprehensive Transport, School of Traffic and Transportation, Beijing Jiaotong University, Beijing 100044, China
*
Author to whom correspondence should be addressed.
Sustainability 2022, 14(18), 11630; https://doi.org/10.3390/su141811630
Submission received: 5 August 2022 / Revised: 11 September 2022 / Accepted: 13 September 2022 / Published: 16 September 2022

Abstract

:
A human-like driving model can help to improve the acceptance and safety of automated driving systems (ADS). To improve the performance of human-like driving and interaction with conventional vehicles of ADS, the speed behavior of left-turn vehicles at the signalized intersection was studied using natural driving data. In this study, 374 valid data points of left-turn snippets at signalized intersections were extracted and three phases were introduced based on the reaction behavior of braking, stopping, and accelerating in the left-turn process. Firstly, a one-way ANOVA was used to study the influence of traffic density, traffic light state, intersection type, and left-turn waiting area on the reaction position of each phase and the spatial distribution of the speed. The traffic light state and traffic density were the main significant effects. Furthermore, to analyze the spatial distribution of acceleration, a method of frequency contour was conducted. The butterfly-shaped frequency contour suggested that “the closer to the stop line, the higher the variation of acceleration”. Finally, the driving parameters at each phase were further analyzed. The main results indicate the following: (1) The red traffic light will lead to a larger variation of acceleration, a larger maximum deceleration, a larger starting acceleration, and a larger maximum acceleration. (2) On the condition of dense traffic density, more stops and the duration of the stop–go phase may cause the time pressure, and the driver tends to choose a greater maximum acceleration. (3) The red traffic light leads to a further reaction distance of all three phases, whilst increased traffic density only increases the reaction distance of the stop. (4) Both the dense traffic density and red traffic light lead to an earlier reaction time. The findings can provide a basis for the design of human-like driving of left-turn driving assistance systems and improve the interaction with left-turn conventional vehicles.

1. Introduction

In recent years, automated vehicles (AVs) technologies have attracted increasing attention in the automotive industry. As for “what is an AV”, the Society of Automotive Engineers (SAE) gives a more precise answer. Six levels are defined for driving automation systems, ranging from no automation (Level 0), where the driver is still in complete control of the vehicle, to full automation (Level 5) [1]. Advanced driver assistance systems (ADAS) (e.g., Level 1 or Level 2 driver support features in SAE) alert, assist, and support a driver by warning or executing a limited set of lateral and/or longitudinal vehicle motion control actions to fulfill a specific, narrowly defined use case [1,2,3,4]. Conversely, an automated driving system (ADS) (i.e., Levels 3 to 5) is collectively capable of performing the complete dynamic driving task (DDT) on a sustained basis, and the capability of crash mitigation and avoidance is a part of ADS functionality. In optimistic views, AVs technologies (e.g., ADAS and ADS) can eliminate crashes due to human errors, which are attributed to 94% of road crashes [5,6]. In particular, the positive conclusion is drawn based on the assumption that the market penetration rate (MPR) of AVs technologies is 100%. However, the mixed traffic of AVs and conventional vehicles is inevitable before 100% MPR. If the driving behaviors of AVs are significantly different from conventional vehicles, the drivers’ trust and acceptance of AVs will not only be weakened [7,8], but it may also lead to other unpredictable risks in traffic accidents [9,10,11,12]. Therefore, a deep understanding of the driving behavior of conventional vehicles is important to design human-like AVs and to improve the safety and acceptance of AVs.
Due to the complex scenes at signalized intersections, a great number of accidents occur at intersections for both conventional vehicles [5,13] and AVs [9,10,11,12,14]. According to the NHTSA Technical Report (2010), in conventional traffic, the false assumptions of others’ actions was the most critical factor in left-turn crashes at signalized intersections [15]. Since 2014, in the testing of AVs on California public roads, there have been 285 reports of AV crashes [14], and 54.92% of AV crashes were AVs being struck by conventional vehicles at signalized intersections [9,10,11,12]. Through an in-depth crash investigation about the details contained in the California DMV crash reports [14], Liu et al. found that the most important causes for AV crashes in emergency scenarios were the perception–reaction time discrepancy between AVs and human drivers, the AV’s inability to accurately identify another vehicle’s intention to change lanes, and the AV’s insufficient path planning in combined time and space dimensions [12]. Therefore, left turning at the signalized intersection can be considered a crucial scenario in terms of traffic safety for AVs in the countries following the right-hand driving rule (e.g., China and the USA). Understanding the driving behavior of surrounding conventional vehicles and making a human-like driving model at the signalized intersection is necessary for AVs to successfully navigate through an intersection.
The speed, acceleration, and reaction position (e.g., the distance to the intersection (DTI) when beginning to brake before the intersection) were the important parameters describing driving behavior [16], which were used to predict the driving behavior at intersections [17,18]. Therefore, a statistical analysis of the left-turn driving behavior at the intersection was conducted in the form of speed, acceleration, jerk, etc., as shown in Table 1. Happer et al. found that the average turning speed and average acceleration of vehicles that did not stop before turning were significantly different from those that stopped [19]. Almallah et al. investigated the start-up behavior at signalized intersections by considering the reaction time, acceleration, and jerk. The mean reaction time, mean acceleration, and mean jerk were found to be 2.91 s (±0.55 SD), 2.8 m/s2 (±1.2 SD, and 0.94 m/s3 (± 0.99 SD), respectively [20]. Furthermore, past research has indicated that different elements of the road environment (i.e., traffic light, lead vehicle, roadside advertisements, traffic flow, weather, and road geometry) may affect driving behavior differently [21,22,23,24]. Rittger et al. studied the influences of traffic light state, fog, and lead vehicle on the speed, acceleration, and deceleration at the signalized intersection based on the driving simulator experiment. The results illustrated that participants drove faster when the traffic light was continuously green, and drivers stopped at a larger distance to the traffic light when there was a lead vehicle ahead [21]. Based on roadside advertisements and traffic flow, Horberry et al. divided the road environment complexity into simple and complex environments and studied the road environment complexity on driving performance. They found that the complex road environment distracted drivers and participants drove with lower mean speeds in the complex environment [22]. Drivers invest more attention and effort to deal with roadway challenges compared to the effort to deal with weather conditions [23]. Furthermore, the driver workload of the interaction between vehicles increases during heavy congestion, which may cause an increase in crash risk [24]. In recent years, the metropolitan areas in China have seen surging installations of the left-turn waiting area (LWA), which is located beyond the stop bar and is generally considered as the extension of the exclusive left-turn lane. The LWA can effectively reduce the probability of stranding and queue overflow of the left-turn vehicles, but the running of red lights, the presence of secondary conflicts, and the rear-end conflicts significantly increase the severity of traffic conflicts at the LWA [25]. Compared to the three-legged T-shaped intersections, four-legged intersections create more conflict points and cause more accidents occurring at crossroads with four legs [26]. Therefore, the influences of traffic conditions (e.g., traffic light state, traffic flow, left-turn waiting area, intersection shape, etc.) on the driving behavior at signalized intersections should not be negligible.
In the AV technologies for scenarios at signalized intersections (e.g., stop-sign assistance, left-turn assistance, and crossing traffic assistance), the actions of warnings and control must be initiated at an appropriate distance and time span to make the control comfortable and acceptable for drivers [21,27,28]. When ignoring the location and the timing to the intersection, the driving behaviors of surrounding human drivers are more likely to be misclassified and misunderstood [29]. Moreover, the process of driving behavior at signalized intersections consists of some subprocesses, including braking, stopping, turning, and accelerating, etc. There is consensus that the spatiotemporal analysis of the driving behavior in each subprocess is essential to making the human-like driving model of AVs at signalized intersections. The distance and time to the intersection as beginning to brake are used as spatiotemporal measures to describe the behavior of deceleration and preparation to turn [8,27,30,31]. Shino et al. measured the speed and DTI when decelerating before intersections. They found that drivers decide to decelerate before the intersection according to the time to the intersection (TTI, calculated by dividing the DTI of a target vehicle by its current speed) [30]. However, the driving behavior in each subprocess of left-turn drivers at signalized intersections is still unclear, particularly the effect of the traffic conditions.
Reliable and high-resolution data are a prerequisite for the analysis of drivers’ behavior. The data for driving behavior can be collected using six major methods, such as naturalistic driving study (NDS) [28,29,30,32], Driver Behavior Questionnaire (DBQ) [8], driving simulators [8,33], field test [34], vehicle trajectories extracted from videos [16,35], and smartphone sensor data [36,37]. Compared to other methods, in NDS, the detailed observations such as speed, acceleration, aggressive braking, lane position, location, and lateral and longitudinal clearance between vehicles are recorded by data-gathering devices, such as GPS devices, accelerometers, radar sensors, on-board diagnostics (OBD), video cameras, etc. However, only a few studies have analyzed driving behaviors at signalized intersections based on NDS in China [28,32]. Yuan et al. studied the braking characteristics of right-turn drivers at signalized intersections using 545 data points for drivers turning right at signalized intersections extracted from the NDS of China-FOT. They found that the approach speed and the number of lanes after the turn play a critical role in the braking characteristics of right-turn drivers, but the intersection shape did not have any effect on right-turn drivers [28]. Li et al. found that traffic flow, intersection mode, lead vehicle motion state, ego-vehicle motion state, ego-vehicle speed, and THW were the 6 remarkable factors that influence drivers’ deceleration model, based on the 393 deceleration events selected from the naturalistic driving data [32]. Moreover, even fewer studies have analyzed the driving behaviors of left-turn drivers at signalized intersections based on NDS in China.
In summary, a human-like driving model can help to improve the interaction with conventional vehicles of ADS and improve the acceptance and safety of ADS. An in-depth study of left-turn driving behavior at signalized intersections can improve the performance of human-like driving of ADS. However, the above studies are not sufficient to fully elucidate how drivers perform before, during, and after a left turn movement at signalized intersections under different traffic conditions (e.g., traffic light state, traffic flow, left-turn waiting area, intersection shape, etc.). Only a few studies have analyzed the driving behavior of left-turn drivers, and even fewer in China. Due to the potential cultural and regional differences, the conclusions about driving behavior in foreign countries may not be applicable to China. Therefore, this study aims to explore the driving behavior of left-turn vehicles at the signalized intersection and the effect of traffic conditions (i.e., traffic density, traffic signal state, intersection type, and the left-turn waiting area) based on NDS in China. First, left-turn driving data at signalized intersections were extracted from the natural driving data. The driving behaviors during turning left at the intersection were then divided into three phases based on the onset location and timing of decelerating, stopping, and accelerating. Subsequently, the influence of traffic density, traffic light state, intersection type, and left-turn waiting area on the reaction position of each phase and the spatial distribution of the speed were analyzed and discussed. Finally, the effects of traffic conditions on the characteristic of driving behavior at each phase were studied, including the spatial and temporal acceptance of drivers braking to start preparation for a left turn, stopping and accelerating to traverse the intersection, the number of stops and time duration in the stop–go cycles, and the maximum deceleration and acceleration. The knowledge of driving behaviors can provide the guidelines for the design of human-like driving of left-turn driving assistance systems, including the appropriate distance and time span of actions of warnings and control, and comfortable and acceptable control strength for drivers.
Table 1. Some relevant studies of the different factors affecting driver behavior of left turns at intersections.
StudyPerformance ParametersExperiment MethodMain Result
Ma, Z. and Y. Zhang [8]. 1. Distance from takeover to stop line, 2. time to stop line when takeover, 3. distance from beginning to decelerate to stop line, 4. average deceleration.Questionnaire and driving simulator in the USAThe driver’s trust, acceptance, and takeover frequency were significantly influenced by the interaction effects between AV’s driving style and driver’s driving style.
Li, X., et al. [33]. 1. Approaching speed, 2. reaction distance, 3. maximum deceleration, 4. stop location, 5. waiting time, 6. maximum acceleration, 7. crossing completion time.Driving simulator in Australia1. The distracted drivers braked later and decelerated with a larger maximum deceleration when approaching the intersection compared with the non-distracted drivers.
2. The distracted drivers stopped further away from the intersection and waited a longer time before crossing compared with the non-distracted drivers.
Almallah, M., et al. [20].Reaction time, acceleration, and jerk start-up behavior at the
onset of green.
Driving simulator in
Qatar
1. Age and culture of drivers had a significant effect on reaction time, acceleration, and jerk.
2. The mean reaction time, acceleration, and jerk were found to be 2.91 s (±0.55 SD), 2.8 m/s2 (±1.2 SD), and 0.94 m/s3 (±0.99 SD), respectively.
Rittger, L. et al. [21].1. Speed, 2. acceleration, 3. pedal usage.Driving simulator in GermanyMaximum accelerations and decelerations were stronger when the traffic lights changed compared to remaining solid, which was especially true when there was no fog on the track.
Zöller, I., et al. [31].Moment in time of braking initiation. Driving simulator and field test in GermanyBraking is initiated significantly earlier in the field than in the driving simulator in preparation for a turning maneuver.
Hong, S., et al. [34]. 1. Velocity at braking initiation, 2. time from braking initiation to stop, 3. distance from the stop position to a stop line, 4. rate of deceleration changed from braking operation.Field test in JapanThe rates of deceleration change (jerk) with the braking operation were unstable and the driving behaviors were affected by the environment or conditions of the intersection.
Carter, N., et al. [35]. 1. Average acceleration, 2. peak acceleration. Traffic trajectories in the USAThe average of the peak lateral accelerations was 0.17 g, the average of the peak tangential accelerations was 0.12 g, and the average of the average accelerations was 0.05 g.
Happer, A., Peck, M., and Hughes, M., [19].1. Velocity, 2. acceleration.Traffic trajectories in the USA1. Average turning speed of vehicles that did not stop before turning was in the range of 6.0 to 6.6 m/s.
2. Average turning speed of vehicles that stopped before turning ranged from 4.6 to 6.3 m/s.
3. Average acceleration of vehicles that proceeded through the intersection after stopping was over the range of 0.85 to 1.20 m/s2.
Abdeljaber, O., et al. [16]. Path, entry speed, minimum speed, and the lateral distance between the exit point and the curb (i.e., targeted exit lane).Traffic trajectories in
Qatar
The characteristics of left-turn paths are significantly related to the vehicle’s entry speed, minimum speed throughout its turning maneuver, and the lateral distance between the exit point and the curb.
Petraki, V., et al. [36]. 1. Harsh accelerations, 2. harsh decelerations, 3. average speed
of harsh event, 4. distance of the harsh event.
Smartphones’ data in Greece1. The number of harsh events and harsh accelerations increases as average traffic flow per lane increases.
2. As the average speed increases, more harsh deceleration events occur.
3. Traffic characteristics (traffic flow and speed) have the most statistically significant impact on the frequency of harsh events.
Tawfeek, M. H. and K. El-Basyouny [29]. 1. Minimum following distance, 2. acceleration, 3. relative speed, 4. headway, 5. TTC, 6. jerk. NDS in the USA1. Several behavioral measures of following distance, relative speed, headway, acceleration, time-to-collision, and jerk were extracted and used to train the algorithms in the context identification layer.
2. The drivers tend to be relatively aggressive at intersections when compared to segments.
3. When ignoring the driver’s relative location to intersections, the driver’s behavior was more likely to be misclassified.
Shino, M. et al. [30]Moment in time of braking initiation.NDS in Japan1. A driver who approached an intersection decided the deceleration timing according to the time to the intersection.
2. The index TTIS based on the formulation of deceleration behavior when a driver approaches an intersection was proposed.
3. The index TTIS can be used to detect the deviated driver states.

2. Methods

2.1. Database

In this research, a subset of naturalistic driving data collected by the Automated Vehicle Testing and Evaluation Technology Project of China Automotive Engineering Research Institute Co., Ltd, Chongqing, China. (CAERI-NDS) was used. The CAERI-NDS data were collected from 30 licensed volunteer drivers (average age 34.3 years, 79.63% of drivers’ experience more than 10,000 km) by 1 vehicle in 31 selected provinces and cities, covering various regions (including north, east, west, central, and south) in China. The data collection area covered highways, urban roads, national roads, provincial roads, and others, and the collection routes were random. The CAERI-NDS data include time-series records (e.g., speed, yaw rate, longitudinal acceleration, lateral acceleration, steering wheel angle, indicator, and brake pedal status) from different sensors installed on the vehicles and video clips recorded by multiple cameras. As shown in Figure 1, the vehicles were equipped with a Global Positioning System (GPS), three cameras, a millimeter-wave radar, a Mobileye, and a data acquisition system (DAS). As shown in Figure 2, three video cameras were used to collect information about the driving environment, including a forward view, right-side backward view, and left-side backward view.
Firstly, over 50,000 intersection fragments were initially extracted from CAERI-NDS data based on the position information of the test vehicle recorded by GPS and road information in GIS. Then, 2015 fragments of time-series records and 3 views of video clips at signalized intersections were randomly extracted and selected from 50,000 intersection segments. The videos of the 2015 fragments were reviewed and annotated by trained annotators to verify and determine the details (listed in Table 2). To ensure the accuracy of the annotating above 95%, the annotators were selected from researchers, undergraduate students, and graduate students with driving experience, and about 20% of the videos were reviewed twice by different annotators. The accuracy in the 20% crosschecked samples (400) was 98.25% (7 samples were invalid). In particular, based on the number of lead vehicles (Num_LV) in the driver’s field of view, the traffic density levels were marked as sparse (Num_LV < 5), medium (5 ≤ Num_LV ≤ 10), and dense (Num_LV > 10).
Secondly, the length of data on each fragment with the intersection should be determined by the intersection influence zone, which is usually defined as the stretch at which the deceleration of a vehicle starts and acceleration ends, or as the location from which the vehicle is forcefully involved under the activity of deceleration, stop, and acceleration [38]. Different fragments may have different intersection influence zones because the intersection influence zone is affected by the signal phasing time, amount of queuing at the intersection, weather, etc. To improve the efficiency of data extraction, data on each fragment with intersection were further extracted from 100 m before the stop line to 100 m after the stop line, uniformly. Specifically, the distance to the stop line (DTI) was computed by the velocity integral from the current time to the time at the stop line. The time at the stop line was obtained by the frame of the video when the stop line was last visible, and the current time was obtained by the current frame of video. Moreover, when the vehicle was before the stop line, the DTI was positive, and vice versa. On that note, the literature about intersections lacked a commonly accepted threshold of intersection influence area. Parker and Zegeer believed that the conflict observation area should cover the functional area of a signalized intersection, which starts from approximately 30 m upstream of the stop line in each approach [39]. In the temporal and spatial analyses of rear-end crashes at signalized intersections, Wang and Abdel-Aty thought that the crashes occurring within 250 feet (76.2 m) of the intersection should be labeled ‘at intersection’ or ‘influenced by intersection’ for the crash site location [40]. To calibrate and validate the VISSIM simulation and identify the reasonableness of SSAM at signalized intersections, the traffic data and the conflict data were recorded in the field using four video cameras which were set up about 100 m upstream of the stop line [41]. More recently, Li analyzed the crossing completion time at the intersection, which started from 100 m in front of the intersection center to the time when they crossed the intersection and reached a stable speed [33]. In the analysis of the influence of traffic congestion on driver behavior in post-congestion driving, the simulator data were collected from 100 m after passing the previous intersection to 100 m before arriving at the next intersection [42]. Therefore, the distance to the stop line from −100 to 100 m selected for the study is reasonable.
Finally, only one fragment without any braking at all was excluded, and there were 374 valid left-turn fragments in the 2015 annotated records, including 277 fragments at signalized 4-legged intersections and 97 fragments at signalized T-type intersections. The 374 valid left-turn fragments were selected to analyze the driving behavior before, during, and after a left-turn movement at signalized intersections. The traffic density, traffic signal state, intersection type, and the left-turn waiting area (LWA, shown in Figure 3) were considered as the potential factors of traffic conditions that may influence the driving behavior of left turning. According to the traffic density, the samples were divided into three categories: sparse (152/374), medium (152/374), and dense (70/374). According to traffic signal states, the samples were also divided into two categories, including green (i.e., the traffic light was continually green throughout the trip) (65/374) and red (the traffic light had been red once or more) (309/374). Due to running a yellow light being a violation in China, in this study, the impact of the yellow traffic light was not analyzed and the samples with a yellow traffic light were merged into red. The samples were also divided into two categories including with LWA (71/374) and without LWA (303/374).

2.2. Definition of the Three Driving Phases

To explore the left-turn behavior at the intersection, parameters such as DTI, speed, acceleration, and deceleration were analyzed in the process of a left turn at an intersection, as shown in Figure 4. Then, the left-turn behavior at an intersection was divided into three phases (i.e., approaching phase, stop–go phase, and traversal phase), as below:
(1)
Approaching phase: When drivers decelerate and approach the intersections to prepare for a left turn. The start of the approaching phase is defined as the onset of drivers pressing the brake pedal, while the end of the approaching phase is defined as the position of vehicles reaching the minimum speed between 100 and −40 m. Especially, when the vehicle speed was less than the typical walking speed of 4.32 km/h [3], the vehicle was considered as stopped.
(2)
Stop–go phase: Vehicles go through a series of stop–go cycles due to traffic jams and the traffic light. For cases with two or more stops (shown in Figure 4), this phase is defined as the period from the vehicle’s first stop point (i.e., the approaching ending point) to the last stop point. If the vehicle stopped once or not at all between 100 and −40 m, the phase was referred to as the point coinciding with the approaching ending point.
(3)
Traversal phase: Vehicles accelerate and traverse the intersection. The beginning of the traversal phase (“traversal starting point”) is the end of the stop–go phase, and the traversal phase ends at the position with full speed.

2.3. Data Analysis

As illustrated above, the three phases of approaching, stop–go, and traversal were introduced to analyze the speed behavior of a left turn at a signalized intersection and the influencing factors. Firstly, the spatiotemporal changing patterns of driving speed were illustrated, considering the influence of the traffic density, traffic signal state, intersection type, and the left-turn waiting area. The significant influencing factors on the speed behavior were explored. Secondly, the spatial distribution of the three phases and longitudinal acceleration (Acc) across each phase were explored relative to the stop line. Finally, to further investigate driving behavior characteristics in the phase level (as listed in Table 3), typical driving behavior parameters in each phase were analyzed by the one-way ANOVA method.
Specifically, in the approaching phase, DTIa, TTIa, and Decmax were considered and defined as below:
(1)
DTIa: The distance between the approaching starting point and the stop line, which represents the spatial acceptance of drivers starting preparation for a left turn.
(2)
TTIa: The time between approaching the starting point and the stop line, which represents the temporal acceptance of drivers starting preparation for a left turn (i.e., time from braking initiation to the stop line).
(3)
Decmax: The maximum deceleration in the period of the approaching phase (Decmax), which represents the comfort boundary drivers maintained at the approaching phase. In a sense, Decmax may refer to a state of sudden braking.
In the stop–go phase, DTIs, Numstop, and Duras were considered and defined as below:
(1)
DTIs: The distance between the approaching ending point and the stop line, which represents the spatial acceptance of drivers stopping in preparation for a left turn.
(2)
Numstop: The number of stops before traversing an intersection, which represents the traffic capacity at an intersection.
(3)
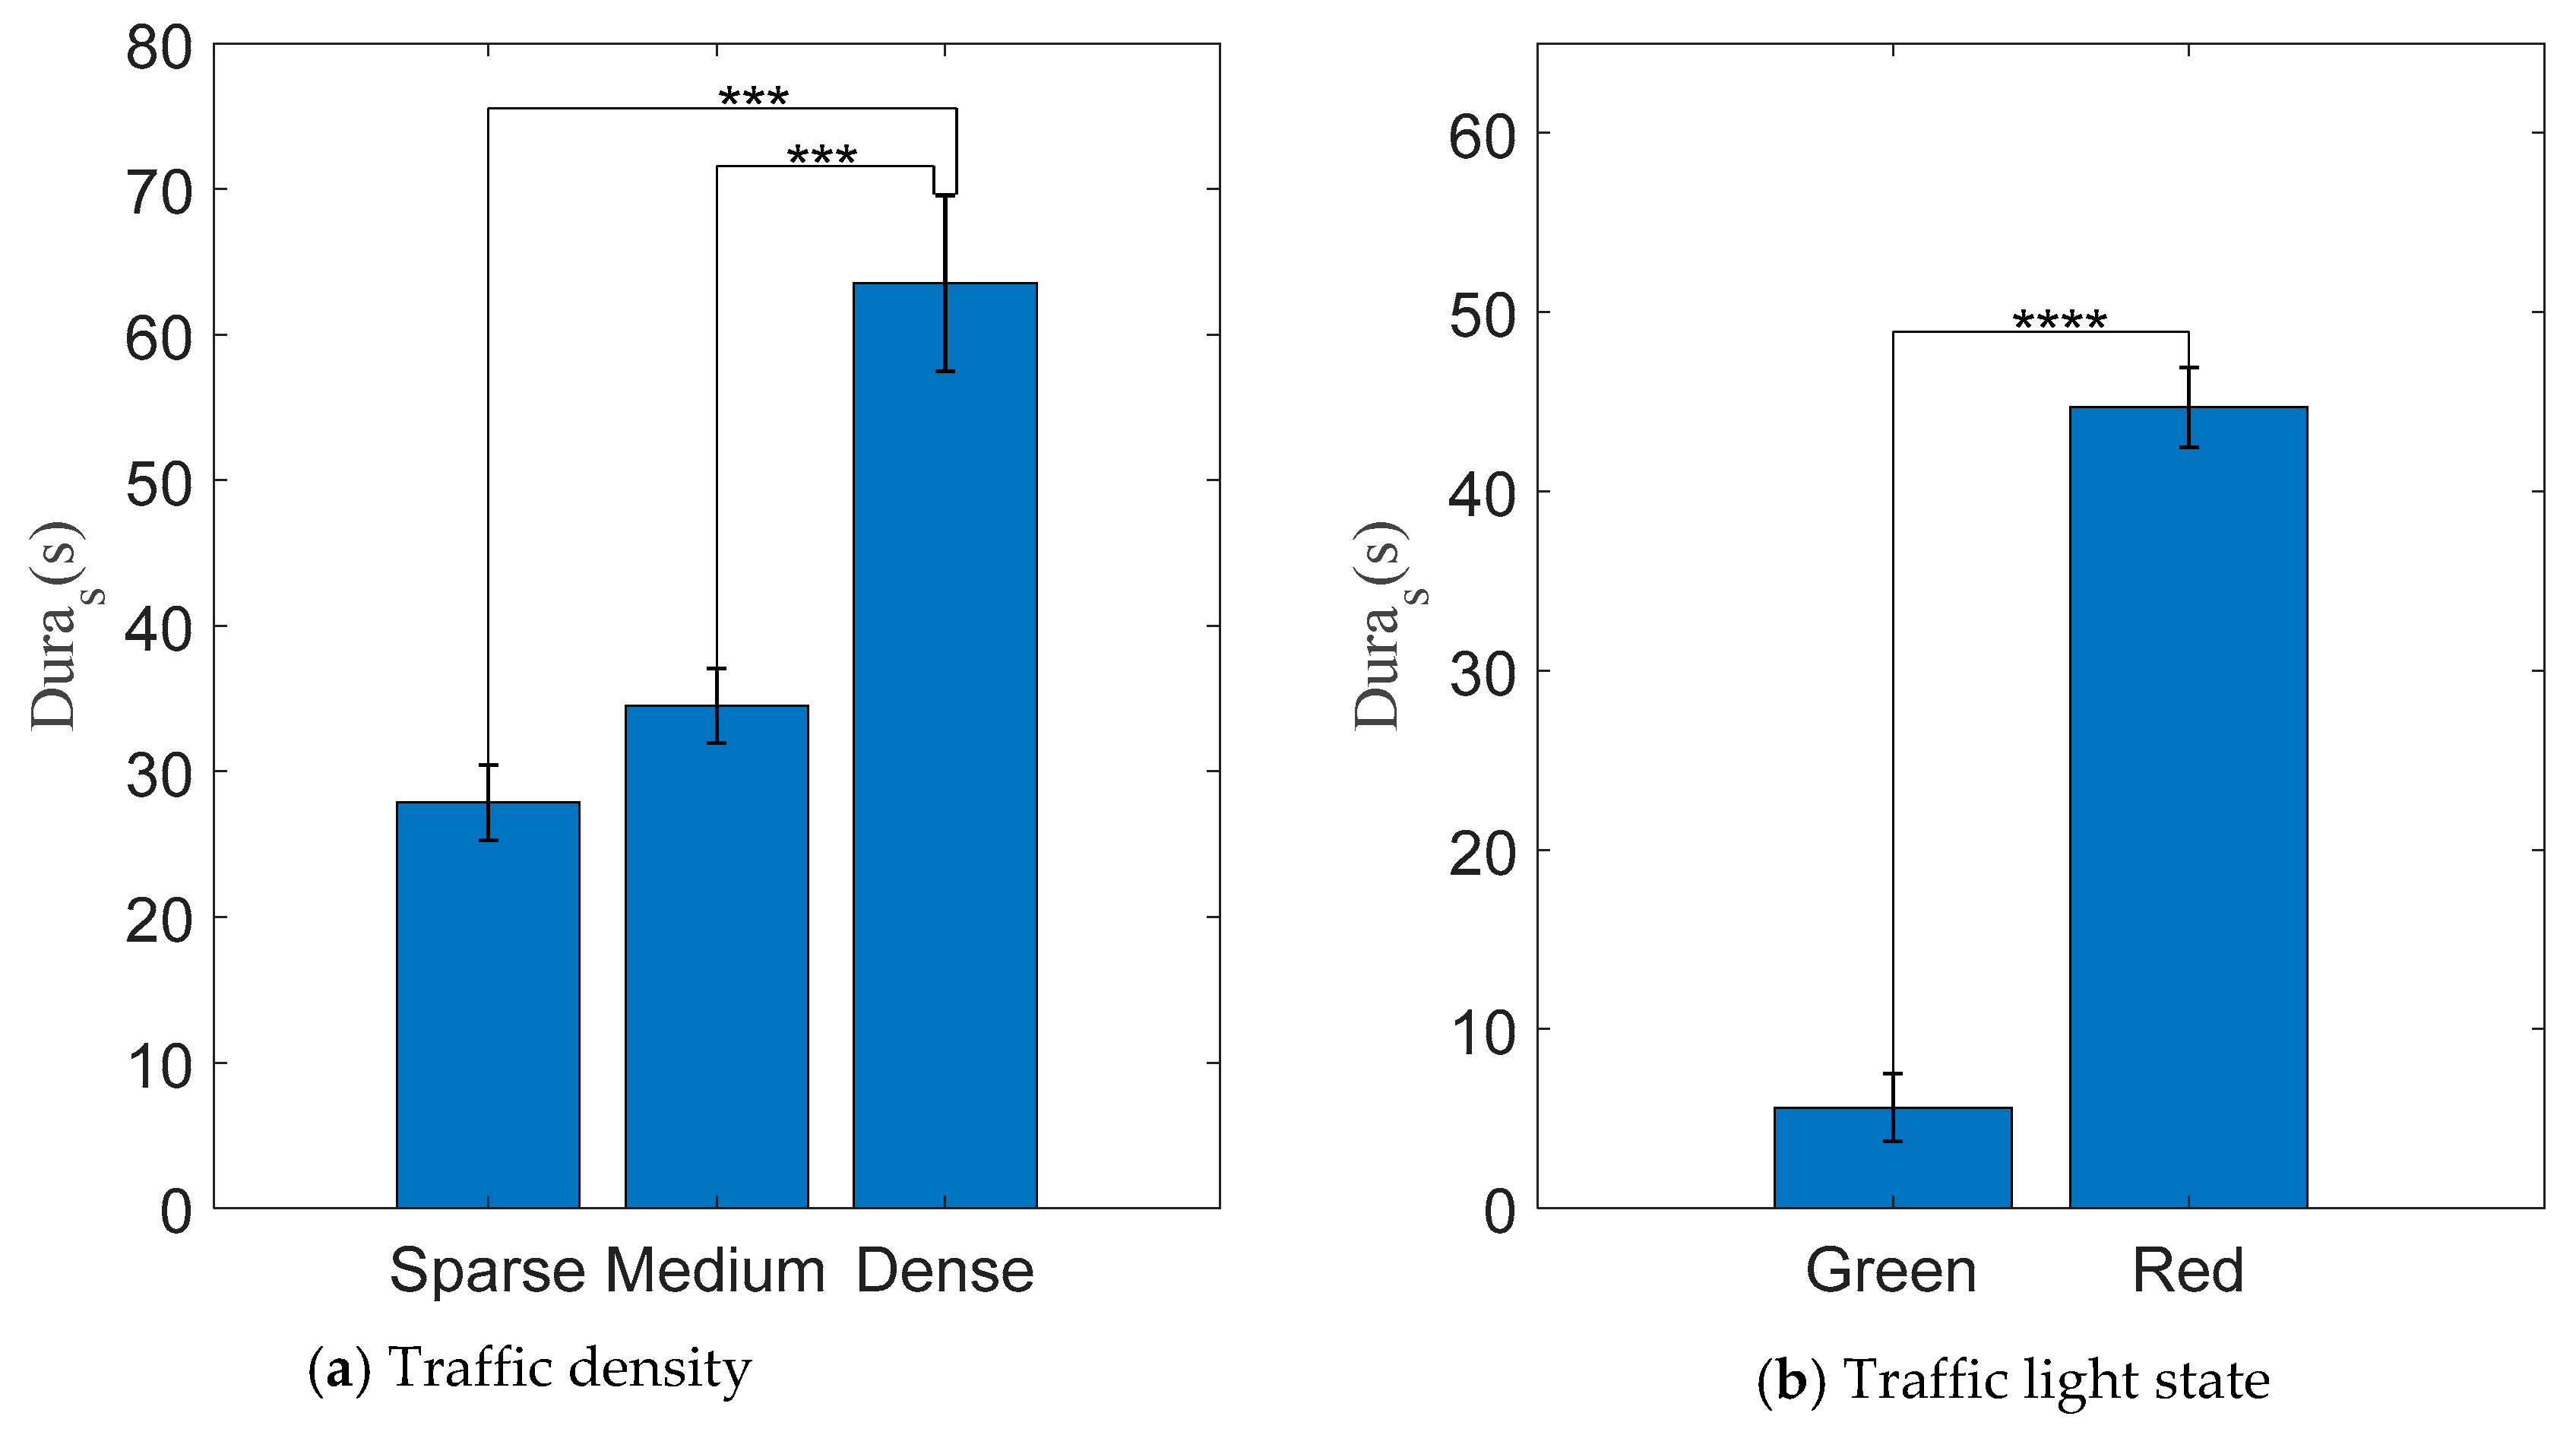
Duras: The time duration between the approaching ending point and the traversal starting point, which represents the traffic capacity at an intersection.
In the traversal phase, DTIt, ACCstart, and ACCmax were considered and defined as below:
(1)
DTIt: The distance between the traversal starting point and the stop line, which represents the spatial acceptance of drivers starting traversal and left turn.
(2)
ACCstart: The starting acceleration at the traversal phase, which was taken at 1 s after accelerating and represents the urgency for acceleration after the stop line.
(3)
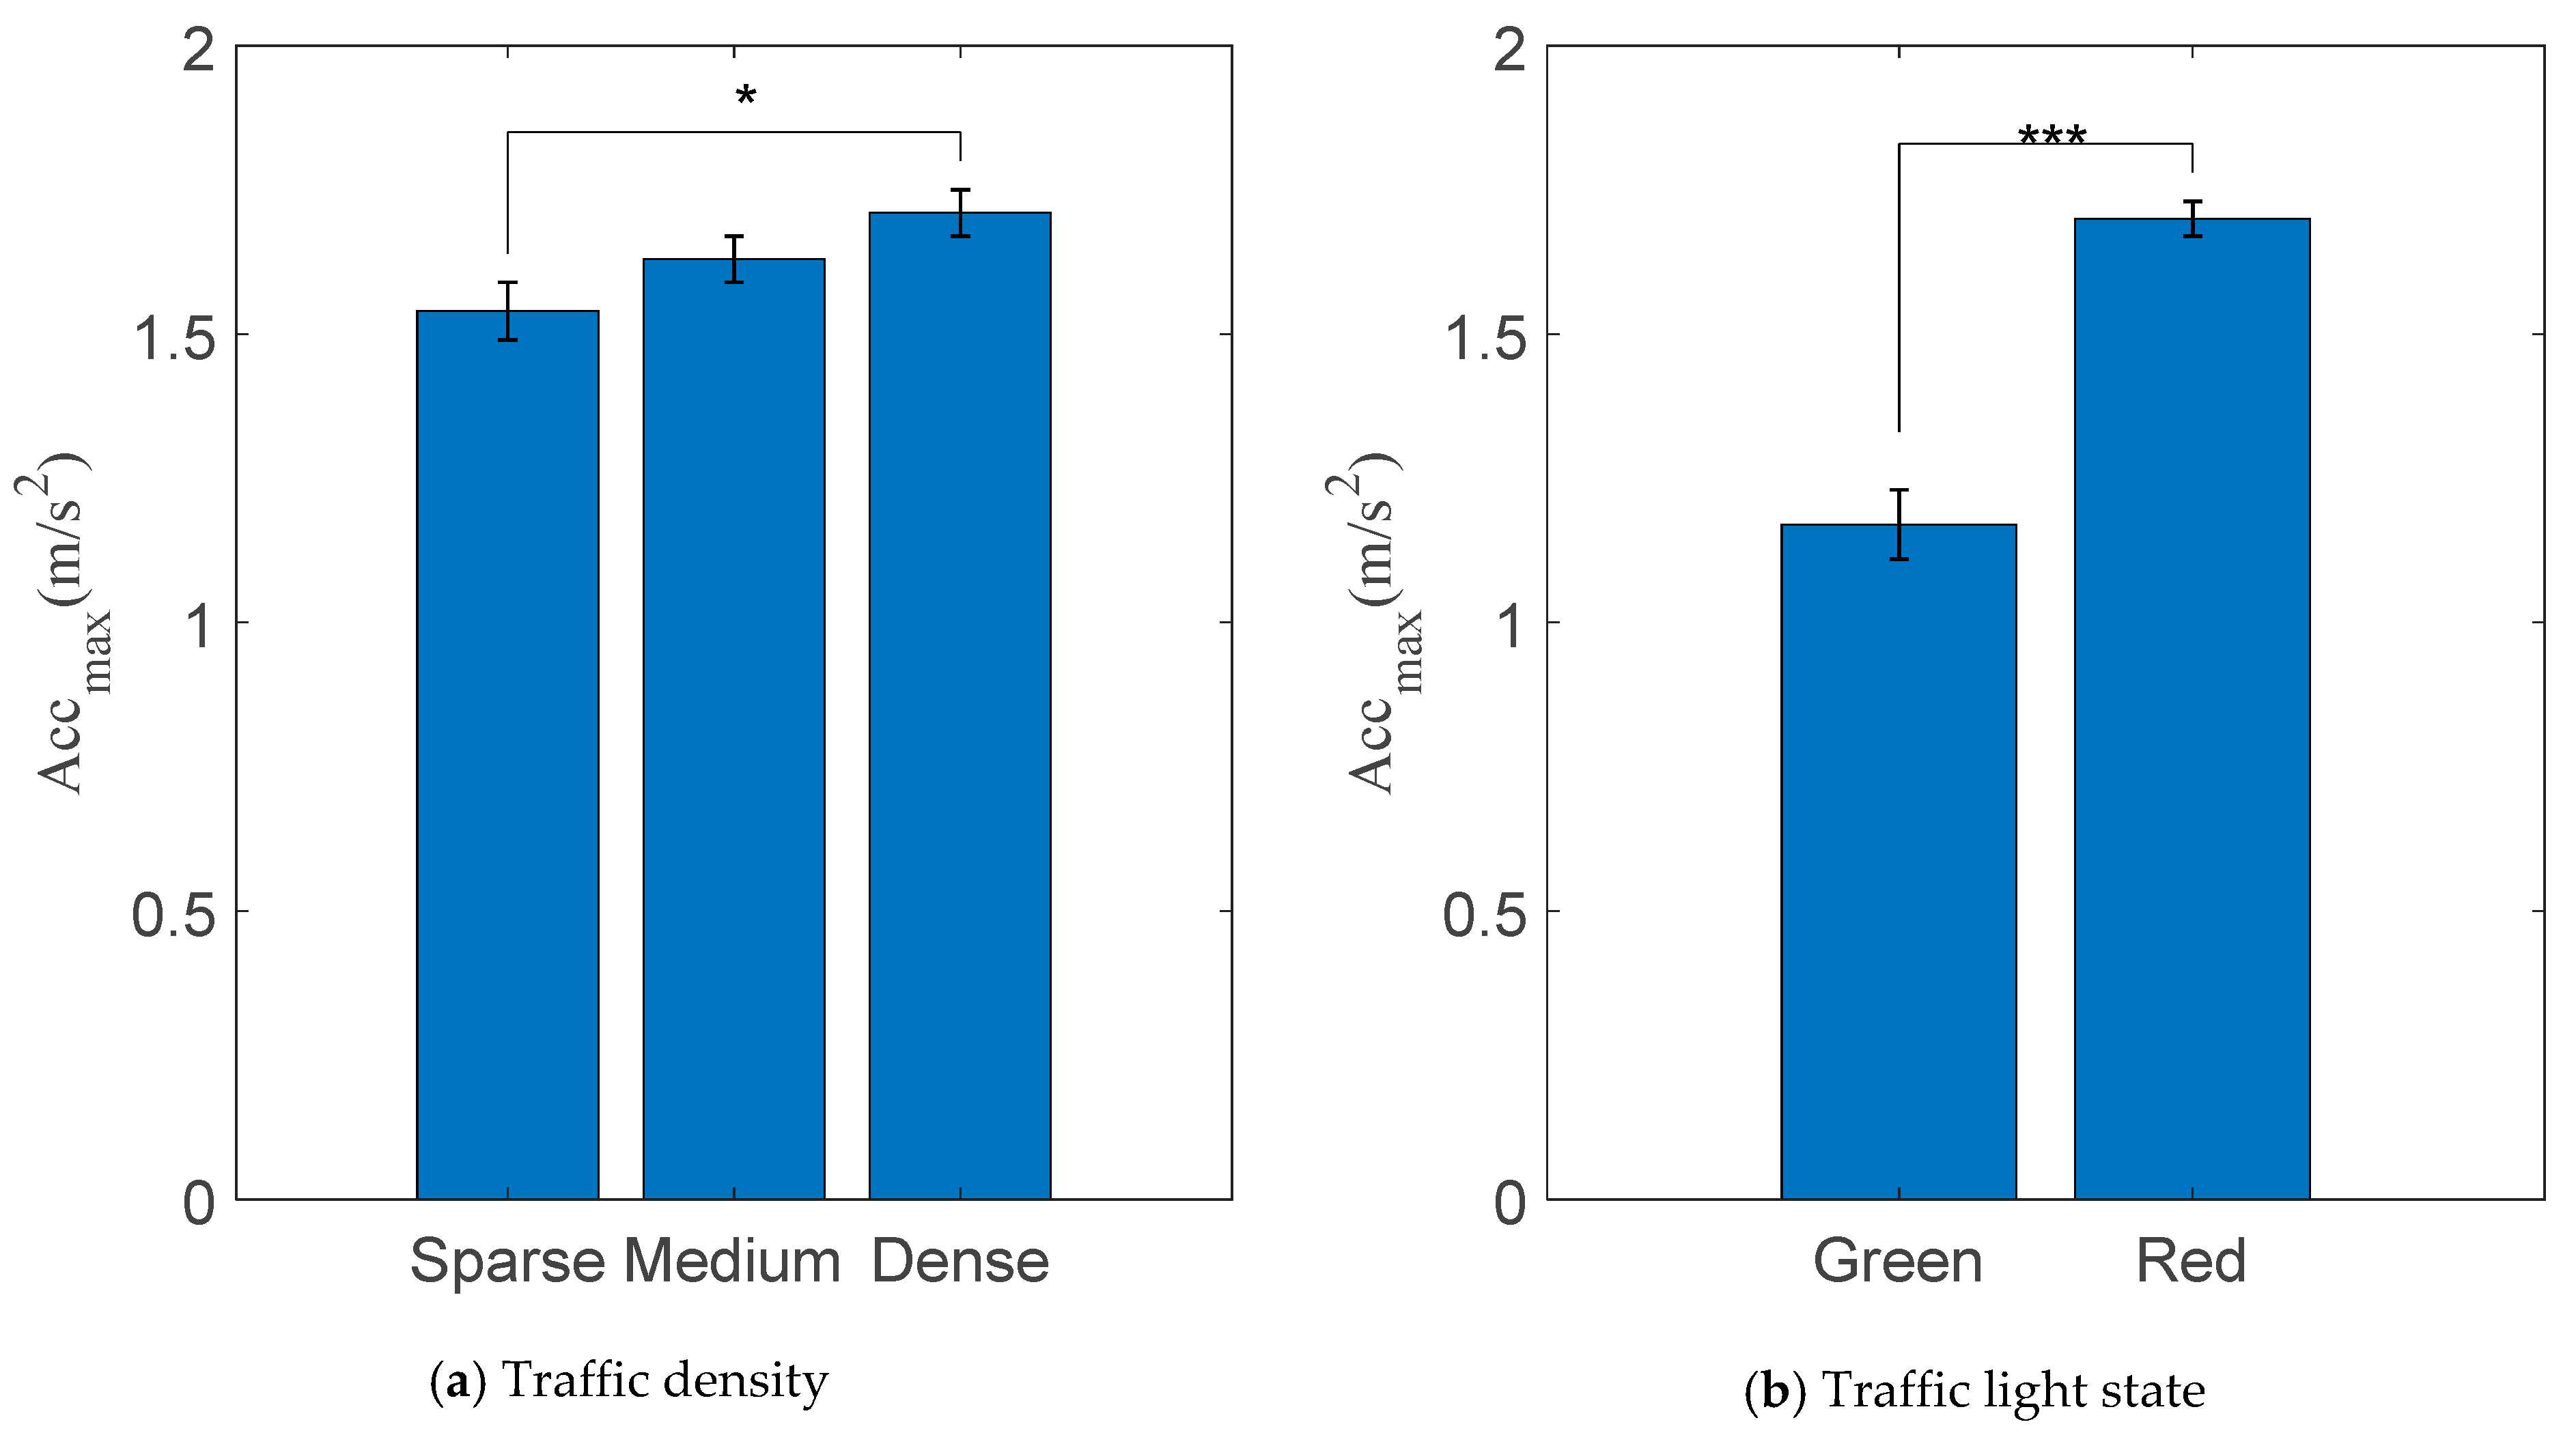
ACCmax: The maximum acceleration at the traversal phase, which represents the comfort acceleration boundary drivers maintained at the traversal phase.
Additionally, IBM SPSS Statistics 23 was used to conduct the descriptive statistics analysis. A one-way ANOVA was used to study the influence of traffic density, traffic light state, intersection type, and left-turn waiting area on normal distribution measures, and Pearson’s chi-square (x2) test for non-normal distribution parameters was also used. The 3*IQR (i.e., three times the interquartile range) boxplot “whisker” was used to identify the outliers, and the outliers (i.e., the data smaller than Q1 − 3*IQR and larger than Q3 + 3*IQR) were replaced with the winsorized value in that sequence. The interquartile range (IQR) was given by the difference between the upper quartile Q3 and lower quartile Q1. In this study, the analysis section was divided into 200 points with a constant 1 m spacing, where the measures of speed, longitudinal acceleration, brake pedal status, etc., in each 1 m zone were extracted.

3. Results

3.1. Overview Analysis of Driving Behavior

3.1.1. Spatial Distribution of the Three Phases

Overall, drivers started the approaching phase at 53.83 m (±1.82 SE). Then, they ended the approaching phase and started the stop–go phase immediately at 12.60 m (±1.53 SE). After that, drivers started the traversal phase at 4.06 m (±1.36 SE) to leave the intersection. In case of dense traffic, 17 cases had braked early at 100 m before the stop line. Moreover, among the 17 cases, 6 cases had stopped early 75 m before the stop line, which might have no approaching phase, and the stop and go phase started early within 100 m. This result indicated that the intersection influence zone of this study had some limitations. Therefore, the extraction length of the research data should be increased to extend the intersection influence zone beyond 100 m in future research. As shown in Table 4, in the condition of sparse density, the vehicles stopped at the position before the stop line of 0.57 m and accelerated after the stop line of 4.57 m. In the condition of the continually green traffic light, the vehicles slowed down to the minimum speed at the position after the stop line of 4.08 m and accelerated after the stop line of 4.09 m. Furthermore, the distribution of DTIa, DTIs, and DTIt varied with different factors. Therefore, a MANOVA with traffic density, traffic signal state, intersection type, and the left-turn waiting area considered as factors was conducted for DTIa, DTIs, and DTIt, and the results were as follows.
DTIa: There was a significant effect of the traffic light on DTIa (F(1, 372) = 18.04, p < 0.001), whereas no significant effect of traffic density, intersection type, and LWA on DTIa (p > 0.05) was observed in this study. In particular, a significantly earlier DTIa of 26.44 m was observed in the red traffic light condition, compared to green.
DTIs: There was a small effect of traffic light (F(2, 371) = 4.31, p = 0.014) and traffic density (F(1, 372) = 6.39, p = 0.012) at the start of the stop–go phase DTIs. Especially, as the traffic density increased, the vehicles stopped further before the stop line. No significant effects of intersection type and LWA on DTIs were observed, while a significant interaction effect between traffic density and LWA on DTIs was observed (F(2, 371) = 7.86, p < 0.001).
DTIt: No significant effects of traffic density, traffic signal state, intersection type, and LWA on DTIt were observed (p > 0.05). However, a significant interaction effect between traffic density and LWA on DTIt was observed (F(2, 371) = 10.31, p < 0.001).
These results indicate that drivers prepare for a left-turn earlier, which is reflected by earlier deceleration, and stop when the traffic light is red. However, this phenomenon has not appeared under varied conditions of traffic density, intersection type, and LWA.

3.1.2. Speed

The profile of the average speed of observations changing against DTI on different traffic conditions is shown in Figure 5. The average speed reduced gradually until a minimum speed was reached near the stop line, and then it kept increasing to leave the intersection. This suggests that the left-turn drivers decelerate when approaching the intersection and accelerate when leaving the intersection. Furthermore, the effect of left-turn waiting area, intersection type, traffic light state, and traffic density on the average speed at each DTI position was investigated by ANOVA, where a p-value less than 0.05 means that the average speed is significantly different between the two conditions (e.g., with LWA and without LWA in Figure 5a).
As shown in Figure 5a and Figure 6a, the speed appeared at a distinct low (outlined in red) between −20 and −40 m due to the existence of a left-turn waiting area. The influence on the average speed of the left-turn waiting area at other positions was not significant. As shown in Figure 5b and Figure 6b, no significant difference in average speed between T-type intersections and four-legged intersections was found. As shown in Figure 5c and Figure 6c, compared to the green traffic light condition, the red traffic light led to a lower speed in the area ranging from 52 to −33 m, which involved the area of the 3 phases. As shown in Figure 5d and Figure 6d, with the increase in traffic density, the average speed curve was reduced due to traffic congestion, and the sparse traffic density led to a higher speed when the vehicle’s distance to the intersection was over 6 m and less than −13 m. Significant differences in average speed among dense and medium levels of traffic density were observed at DTI > 22 m or DTI < −62 m.
These results indicate that the traffic light and traffic density were the main factors in the speed behavior of left-turn vehicles. Therefore, the following research focused on the effects of traffic light state and traffic density on driving behavior.

3.1.3. Longitudinal Acceleration

As shown in Figure 7 and Figure 8, drivers’ longitudinal acceleration during the left-turn process was illustrated by the frequency contour, to indicate the number of data samples per 1 m*0.1 m/s2. Additionally, the area border bounded by a dashed red line indicates that 90% of Acc-DTI samples fall in that area, while the area border bounded by a solid red line indicates that 50% of Acc-DTI samples fall in that area. Firstly, the butterfly-shaped contour suggested that the variation of Acc was much higher when the vehicle was closer to the stop line, as shown in Figure 8 (sparse). For instance, 50% Acc data samples were distributed in (−1.35, 1.09) m/s2 when DTI was ranged from (1, −4) m, and distributed in (0, −0.3) m/s2 when DTI was 100 m in Figure 9 (sparse). Moreover, the figure showed that the longitudinal accelerations in medium and dense traffic conditions were more concentrated in the contour compared to sparse conditions, which suggested that the increased traffic density produced a smaller variation of Acc. For instance, 50% Acc data samples ranged from −1.09 to 0.80 m/s2 in the condition of medium traffic density, while 50% Acc data samples ranged from −0.87 to 0.78 m/s2 in the condition of medium traffic density.
Additionally, Figure 8 showed that the variation of Acc was higher in conditions of red traffic light compared to green. For instance, 50% Acc data samples ranged from about −1.12 to about 0.78 m/s2 in the condition of a green traffic light, while 50% Acc data samples ranged from about −1.19 to about 1.03 m/s2 in the condition of a red traffic light. These results suggested that the red traffic light would lead to more varied acceleration.

3.2. Approaching Phase

3.2.1. Time to the Intersection at the Initiation of Braking

As shown in Figure 9a, a small significant effect of traffic density on the onset time of braking initiation (TTIa) (F(2, 371) = 3.97, p = 0.02) was observed. According to the post hoc comparisons with Bonferroni adjustments, there were main significant differences in TTIa (p < 0.001) between sparse and dense levels of traffic density. This phenomenon has also appeared between medium and dense levels of traffic density. Especially, the dense traffic density led to an increment of 4.25 s in TTIa, as compared to sparse traffic density.
A significant effect of the traffic light on TTIa (F(1, 372) = 8.255, p = 0.004) was observed, as shown in Figure 9b. Furthermore, the red traffic light led to an increment of 2.89 s in TTIa, as compared to the green light condition.
Additionally, there was no significant interaction between traffic density and traffic light state on TTIa (F(1, 372) = 2.63, p = 0.07).

3.2.2. Maximum Deceleration

Traffic density was observed with no significant effect on maximum deceleration (Decmax) (F(2, 371) = 0.004, p = 1), and no significant difference among all levels of traffic density was observed according to the post hoc comparisons with Bonferroni adjustments (p > 0.05). However, there was a main significant effect of the traffic light on Decmax (F(1, 372) = 5.18, p = 0.025), as shown in Figure 10. However, no significant interaction between traffic density and traffic light state on Decmax (F(1, 372) = 0.021, p = 0.98) was observed.

3.3. Stop–Go Phase

3.3.1. Number of Stops

During the stop–go phase, vehicles may go through a series of stop–go cycles. Thus, the number of stops (Numstop) was categorized into four groups as zero, one, two, and over three (i.e., three or more than three) in this study, as shown in Figure 11.
Since the distribution of Numstop was not normally allocated, the Chi-square (x2) test was used to check the effect of traffic density and the traffic light state on Numstop. The result indicated that the traffic light state (x2(3, 374) = 168.27, p < 0.001) and the traffic density (x2(6, 374) = 42.17, p < 0.001) had a significant influence on Numstop. As shown in Figure 12a, the Numstop increased with the increase of the traffic density. For instance, the average of Numstop in the dense traffic density increased by 0.67 more than in sparse traffic density. In addition, as shown in Figure 12b, the average of Numstop at the red traffic light was 0.83 larger than at the green light.

3.3.2. Duration of Stop–Go Phase

As shown in Figure 13a, although no significant effect of traffic density on the duration of the stop–go phase (Duras) (F(2, 371) = 1.38, p = 0.25) was observed, the post hoc comparisons with Bonferroni adjustments showed that dense traffic density produced increments of 35.75 (p < 0.001) and 29.01 (p < 0.001) in Duras as compared to sparse and medium traffic densities, respectively. However, there was no significant difference in Duras between sparse and medium traffic density (p = 0.29).
As shown in Figure 13b, the results showed that the traffic light condition (F(1, 372) = 40.82, p < 0.001) had a main significant effect on the duration of the stop–go phase (Duras). In addition, the red traffic light condition led to 39.01 s increments in Duras, compared to the green light condition.
Additionally, no significant interaction effect between traffic density and traffic light condition on Duras was observed (F(1, 372) = 0.25, p = 0.17).

3.4. Traversal Phase

3.4.1. Starting Acceleration

As shown in Figure 14a, the average starting accelerations at traversal phase (Accstart) in conditions of sparse, medium, and dense traffic density were 0.91 ± 0.06, 0.89 ± 0.05, and 1.02 ± 0.06 m/s2, respectively. It indicated that traffic congestion may induce greater acceleration. However, no significant effect of traffic density on Accstart was observed (F(2, 371) = 0.98, p = 0.38), and there was an insignificant difference in Accstart among different traffic densities according to the post hoc comparisons with Bonferroni adjustments (p > 0.05).
In contrast, the traffic light had a significant effect on Accstart (F(1, 372) = 26.94, p < 0.001), as shown in Figure 14b. Specifically, the red traffic light led to 0.68 increments in Accstart, compared to the green light condition. Furthermore, no significant interaction effects between traffic density and traffic light state on Accstart were observed (F(1, 372) = 0.105, p = 0.35).

3.4.2. Maximum Acceleration

As shown in Figure 15a, the average maximum accelerations at traversal phase (Accmax) in conditions of sparse, medium, and dense traffic density were 1.54 ± 0.05, 1.63 ± 0.04, and 1.71 ± 0.04 m/s2, respectively, and there was a significant effect of traffic density on the Accmax (F(2, 371) = 3.21, p = 0.041). According to the post hoc comparisons with Bonferroni adjustments, dense traffic density may induce greater accelerations compared to sparse (p = 0.03). The traffic light also had a significant effect on Accmax (F(1, 372) = 23.92, p < 0.001), as shown in Figure 15b. Specifically, the red traffic light led to 0.53 increments in Accmax, compared to the green light condition. Furthermore, no significant interaction effects between traffic density and traffic light state on Accstart were observed (F(1, 372) = 1.73, p = 0.18).

4. Discussion

The present study explored the driving behavior of left-turn vehicles at the signalized intersection and the effect of traffic conditions (i.e., traffic density, traffic signal state, intersection type, and the left-turn waiting area) based on NDS in China. Specifically, the driving behavior during turning left at the intersection was divided into three phases, including approaching, stop–go, and traversal, based on the reaction of braking, stopping, and accelerating. The onset location of the reaction was used to elucidate the spatial characteristic of driving behavior at each phase. The reaction distance of braking (DTIa) was related to the traffic light state, not to other variables (i.e., traffic density, intersection type, and left-turn waiting area). The reaction distance of stop (DTIs) was related to traffic light state and traffic density, not to intersection type and left-turn waiting area. The reaction distance of accelerating (DTIt) was not related to variables of the traffic condition in this study, that is, traffic light state, traffic density, intersection type, and left-turn waiting area. However, there were significant interaction effects between traffic density and LWA on the reaction distance of stopping and accelerating. The phenomenon is reasonable because the left-turning traffic flows within intersections would be reorganized and the capacity for the left-turn movement would be increased by using a left-turn waiting area [43]. In summary, drivers tend to decelerate and stop farther from the stop to prepare for a left turn at the intersection when they see that the traffic light is red. Whilst, the denser traffic density may cause an earlier first stop, probably because the leading vehicle stopped before the ego vehicle. Therefore, the influence of the leading vehicle and the car-following behavior (e.g., time to collision) on the longitudinal driving behavior at signalized intersections would be worth further study in the future. Especially, the interaction effects between traffic density and LWA on the reaction distance of stop and acceleration must not be overlooked. Therefore, when designing a left-turn driving assistance system, the reaction distance of braking, stopping, and accelerating should focus on the traffic light and the interaction effects between traffic density and LWA.
Speed is a significant risk factor in traffic accidents [44]. The results of this study show that traffic light and traffic density have a significant influence on speed, and the significant level should change along the DTI. In particular, the traffic light state is the main effect of speed and acceleration when the vehicle is close to the intersection. Vehicles drive more slowly, decelerate more strongly and earlier at the approaching phase, and accelerate more quickly at the traversal phase under the condition of the red traffic light, compared to the continuous green traffic light. The results are consistent with the conclusions of [21] and [40]. The frequency contour of the acceleration (shown in Figure 8) also indicated that the red traffic light would lead to more varied acceleration. Furthermore, the jerk (i.e., the change rate of vehicle acceleration with respect to time) indicates how smoothly a driver accelerates and decelerates the vehicle. As shown in Figure 16, under the condition of the red traffic light, the 95th percentile of the positive jerk and negative jerk was larger, compared to the continuous green traffic light.
Conversely, traffic density did not affect speed when the vehicle was close to the stop line, while the LWA only had a significant effect on the speed near the stop line of the left-turn waiting area. This is because the left-turn waiting area significantly increased the number of stops for left-turning vehicles [45]. In a previous study, more accidents occurred at four-legged intersections due to more conflict points than at T-shaped intersections [26]. However, it was found that, in this study, the intersection shape did not affect the driving behavior significantly, neither speed nor the reaction distance of preparation for turning left at signalized intersections. This result is consistent with the conclusions for the speed behavior of right-turning drivers at signalized intersections in China [28]. Therefore, the speed behavior when the vehicle was close to the stop line was only related to the traffic light, not to other variables (i.e., traffic density, intersection type, and left-turn waiting area). This should be considered when designing a left-turn driving assistance system.
When the approaching speed was high, drivers had longer reaction distances to avoid hazards or ensure driving comfort [46]. That is to say that drivers decide to decelerate before the intersection according to the time to the intersection [30]. Therefore, the time to the intersection at the beginning of braking (TTIa) and the maximum deceleration (Decmax) at the approaching phase are the important parameters for warning, decision, and action at the intersection in AVs. The maximum deceleration discovered in this study could be considered as a reference for the design objective in AV’s control strategy. As the variation of acceleration and deceleration needs to be controlled in a comfortable range, if the maximum deceleration of the AV exceeds this reference within the intersection area, the subjective riding experience may be negatively influenced and the trust in AVs could further deteriorate. The results in this study indicated that drivers prefer to press the brake pedal at a larger TTIa and decelerate at a larger Decmax when the traffic light is red, similar to the findings of Shino et al. [30]. The traffic light state also had a main significant effect on the number of stops (Numstop) and the duration of the stop–go phase (Duras). Furthermore, the red traffic light produced a significantly larger starting acceleration (Accstart) and maximum acceleration (Accmax). This may lead to left-turn crashes at signalized intersections when drivers do not have enough time to decelerate since this requires them to change their feet from the gas pedal to the brake pedal in response to the emergency. This result should be considered by AVs to predict the behavior of left-turning conventional vehicles when AVs need to interact with them.
Although the traffic density had a significant effect on the TTIa, the number of stops (Numstop), and the duration of the stop–go phase (Duras), there was only a significant difference between dense traffic density and the other two traffic density levels. In the condition of dense traffic density, vehicles tended to brake earlier, stop more times, and spend more time in the stop–go phases. Since congestion-related travel delays can lead to time pressure [47], traffic congestion is more likely to lead to aggressive driving behavior, such as higher speeds and greater accelerations [42]. Although a significant effect of traffic density on the maximum acceleration was observed in this study, traffic density did not affect the starting acceleration. Drivers tended to choose a greater acceleration in conditions of dense traffic density, but the starting acceleration increase was not significant due to other external traffic conditions (i.e., surrounding vehicles, speed limit).

5. Conclusions

This study introduced three phases to analyze the left-turn driving at signalized intersections, specifically approaching, stop–go, and traversal phases. The resulting information not only described the typical driving behavior of the left-turn at signalized intersections but also showed the influence of traffic conditions (i.e., traffic density, traffic signal state, intersection type, and the left-turn waiting area) on the driving behavior. The results can help AVs to predict the behavior of surrounding left-turning conventional vehicles at signalized intersections and provide inspiration for the decision and planning of a left-turn driving assistance system.
Firstly, to predict the behavior of surrounding left-turning conventional vehicles at signalized intersections, AVs should focus on the effects of the traffic light state and traffic density, rather than the intersection type or left-turn waiting area. Especially, when the vehicle approaches the stop line, the influence of the traffic light is enhanced. In this study, the red traffic light led to a significantly lower speed at −33 m < DTI < 52 m. Conversely, the sparse traffic density led to a higher driving speed at DTI > 6 m or DTI < −3 m.
Secondly, the red traffic light will lead to a larger variation of acceleration, a larger maximum deceleration, a larger starting acceleration, and a larger maximum acceleration. Meanwhile, dense traffic density or congestion will cause more stops and a longer duration of the stop–go phase, which is related to travel delay and to time pressure. Therefore, the driver tends to choose a greater maximum acceleration in the condition of dense traffic density. These results should be considered by AVs to predict the behavior of left-turning conventional vehicles when AVs need to interact with them.
Finally, the left-turn system should always brake, stop, and accelerate to approach and traverse a signalized intersection in safety and comfort. The reaction position of the three phases was mainly influenced by the traffic light condition and slightly influenced by the traffic density condition. Specifically, a red traffic light led to earlier initiation of all three phases compared to the green light condition, while an increased traffic density only caused an earlier initiation of the stop–go phase. Moreover, the approach speed also affects the reaction position brake. The time to the intersection at the beginning of braking (TTIa) should be introduced to describe when systems decide to brake. Both traffic density and traffic light have a significant effect on TTIa. In this study, the dense traffic density led to an increment of 4.25 s in TTIa, as compared to sparse traffic density. The red traffic light led to an increment of 2.89 s in TTIa, as compared to the green light condition.
This study was based on the NDS in China in different cities, and the traffic environments were diversiform and complex. Only the variables of traffic density, traffic signal state, intersection type, and the left-turn waiting area were introduced, and the sample sizes of the research were limited. Another limitation of this study was that the influence of the car-following behavior was not analyzed, although the traffic density was used as an indirect indication of the influence of the leading vehicle. Further studies should include more factors (e.g., road geometry, car-following behavior, and existence of other traffic participants) and increase the number of samples. This would help to increase the understanding of the driving behavior at the intersection. The intersection influence zone should be extended beyond 100 m in future research. Furthermore, modeling and prediction of the driving behavior at an intersection for the design, evaluation, and implementation of AVs should be studied in the future.

Author Contributions

Conceptualization, L.X. and P.L.; Data curation, Z.S.; Formal analysis, L.X.; Funding acquisition, L.X.; Investigation, L.X. and Z.S.; Methodology, L.X. and P.L.; Resources, T.C.; Supervision, T.C.; Writing—original draft, L.X.; Writing—review & editing, L.X., Z.S., P.L., Z.D. and D.S. All authors have read and agreed to the published version of the manuscript.

Funding

This research was funded by: (1) the Natural Science Foundation of Chongqing, China (No. cstc2020jcyj-bshX0082); (2) the 2021 Annual Open Foundation of State Key Laboratory of Vehicle NVH and Safety Technology (No. NVH-SKL-202110); (3) the Science and Technology Foundation of Education Department of Chongqing (No. KJQN202100845) (4) the Scientific Research Foundation of Chongqing Technology and Business University (No. 1956056 and No. 2152003). (5) the Technology Innovation and Application Development Program of Chongqing, China (No. cstc2019jscx-fxydX0041).

Institutional Review Board Statement

Not applicable.

Informed Consent Statement

Informed consent was obtained from all subjects involved in the study.

Data Availability Statement

Some or all data, models, or codes that support the findings of this study are available from the corresponding author upon reasonable request.

Conflicts of Interest

The authors declare no conflict of interest.

References

  1. SAE; Society of Automotive Engineers; On-Road Automated Vehicle Standards Committee. Taxonomy and Definitions for Terms Related to Driving Automation Systems for On-Road Motor Vehicles (R), J3016-202104. 2021. Available online: https://www.sae.org/standards/content/J3016_202104 (accessed on 30 April 2021).
  2. Kusano, K.D.; Gabler, H.C. Target population for intersection advanced driver assistance systems in the US. SAE Int. J. Transp. Saf. 2015, 3, 1–16. [Google Scholar] [CrossRef]
  3. Scanlon, J.M. Evaluating the Potential of an Intersection Driver Assistance System to Prevent US Intersection Crashes. Ph.D. Dissertation, Virginia Blacksburg, Blacksburg, VA, USA, 2017. [Google Scholar]
  4. Orlovska, J.; Novakazi, F.; Lars-Ola, B.; Karlsson, M.; Wickman, C.; Söderberg, R. Effects of the driving context on the usage of Automated Driver Assistance Systems (ADAS)-Naturalistic Driving Study for ADAS evaluation. Transp. Res. Interdiscip. Perspect. 2020, 4, 100093. [Google Scholar] [CrossRef]
  5. NHTSA. Traffic Safety Facts 2015 Data (DOT HS 812 353, Updated March 2017); National Highway Traffic Safety Administration: Washington, DC, USA, 2017. Available online: https://crashstats.nhtsa.dot.gov/Api/Public/Publication/812384 (accessed on 30 April 2021).
  6. Yurtsever, E.; Lambert, J.; Carballo, A.; Takeda, K. A survey of autonomous driving: Common practices and emerging technologies. IEEE Access 2020, 8, 58443–58469. [Google Scholar] [CrossRef]
  7. Fleming, J.M.; Allison, C.K.; Yan, X.; Lot, R.; Stanton, N.A. Adaptive driver modelling in ADAS to improve user acceptance: A study using naturalistic data. Saf. Sci. 2019, 119, 76–83. [Google Scholar] [CrossRef]
  8. Ma, Z.; Zhang, Y. Drivers trust, acceptance, and takeover behaviors in fully automated vehicles: Effects of automated driving styles and driver’s driving styles. Accid. Anal. Prev. 2021, 159, 106238. [Google Scholar] [CrossRef]
  9. Dixit, V.V.; Chand, S.; Nair, D.J. Autonomous vehicles: Disengagements, accidents and reaction times. PLoS ONE 2016, 11, e0168054. [Google Scholar] [CrossRef]
  10. Favarò, F.; Eurich, S.; Nader, N. Autonomous vehicles’ disengagements: Trends, triggers, and regulatory limitations. Accid. Anal. Prev. 2018, 110, 136–148. [Google Scholar] [CrossRef]
  11. Xu, C.; Ding, Z.; Wang, C.; Li, Z. Statistical analysis of the patterns and characteristics of connected and autonomous vehicle involved crashes. J. Saf. Res. 2019, 71, 41–47. [Google Scholar] [CrossRef]
  12. Liu, Q.; Wang, X.; Wu, X.; Glaser, Y.; He, L. Crash comparison of autonomous and conventional vehicles using pre-crash scenario typology. Accid. Anal. Prev. 2021, 159, 106281. [Google Scholar] [CrossRef]
  13. Werneke, J.; Vollrath, M. How do environmental characteristics at intersections change in their relevance for drivers before entering an intersection: Analysis of drivers’ gaze and driving behavior in a driving simulator study. Cogn. Technol. Work. 2014, 16, 157–169. [Google Scholar] [CrossRef]
  14. California Department of Motor Vehicles (California DMV). 2021b. Autonomous Vehicle Collision Reports. Available online: https://www.dmv.ca.gov/portal/vehicle-industry-services/autonomous-vehicles/autonomous-vehicle-collision-reports/ (accessed on 27 January 2021).
  15. NHTSA. Crash Factors in Intersection-Related Crashes: An On-Scene Perspective. Washington, DC: National Highway Traffic Safety Administration. 2010. Available online: https://crashstats.nhtsa.dot.gov/Api/Public/ViewPublication/811366 (accessed on 1 September 2010).
  16. Abdeljaber, O.; Younis, A.; Alhajyaseen, W. Analysis of the Trajectories of Left-turning Vehicles at Signalized Intersections. Transp. Res. Procedia 2020, 48, 1288–1295. [Google Scholar] [CrossRef]
  17. Liu, M.; Chen, Y.; Lu, G.; Wang, Y. Modeling crossing behavior of drivers at unsignalized intersections with consideration of risk perception. Transp. Res. Part F: Traffic Psychol. Behav. 2017, 45, 14–26. [Google Scholar] [CrossRef]
  18. Zyner, A.; Worrall, S.; Nebot, E. Naturalistic Driver Intention and Path Prediction Using Recurrent Neural Networks. IEEE Trans. Intell. Transp. Syst. 2020, 21, 1584–1594. [Google Scholar] [CrossRef]
  19. Happer, A.J.; Peck, M.D.; Hughes, M.C. Analysis of left-turning vehicles at a 4-way medium-sized signalized intersection. SAE Int. J. Passeng. Cars-Mech. Syst. 2009, 2, 359–370. [Google Scholar] [CrossRef]
  20. Almallah, M.; Alfahel, R.; Hussain, Q.; Alhajyaseen, W.K.M.; Dias, C. Empirical evaluation of drivers’ start-up behavior at signalized intersection using driving simulator. Procedia Comput. Sci. 2020, 170, 227–234. [Google Scholar] [CrossRef]
  21. Rittger, L.; Schmidt, G.; Maag, C.; Kiesel, A. Driving behaviour at traffic light intersections. Cogn. Technol. Work. 2015, 17, 593–605. [Google Scholar] [CrossRef]
  22. Horberry, T.; Anderson, J.; Regan, M.A.; Triggs, T.J.; Brown, J. Driver distraction: The effects of concurrent in-vehicle tasks, road environment complexity and age on driving performance. Accid. Anal. Prev. 2006, 38, 185–191. [Google Scholar] [CrossRef]
  23. Hamdar, S.H.; Qin, L.; Talebpour, A. Weather and road geometry impact on longitudinal driving behavior: Exploratory analysis using an empirically supported acceleration modeling framework. Transp. Res. Part C Emerg. Technol. 2016, 67, 193–213. [Google Scholar] [CrossRef]
  24. Hamzeie, R.; Savolainen, P.T.; Gates, T.J. Driver speed selection and crash risk: Insights from the naturalistic driving study. J. Saf. Res. 2017, 63, 187–194. [Google Scholar] [CrossRef]
  25. Jiang, X.; Zhang, G.; Bai, W.; Fan, W. Safety evaluation of signalized intersections with left-turn waiting area in China. Accid. Anal. Prev. 2016, 95, 461–469. [Google Scholar] [CrossRef] [Green Version]
  26. Morency, P.; Gauvin, L.; Plante, C.; Fournier, M.; Morency, C. Neighborhood social inequalities in road traffic injuries: The influence of traffic volume and road design. Am. J. Public Health 2012, 102, 1112. [Google Scholar] [CrossRef] [PubMed]
  27. Plavsic, M. Analysis and Modeling of Driver Behavior for Assistance Systems at Road Intersections. Ph.D. Dissertation, Technische Universität München, München, Germany, 2010. [Google Scholar]
  28. Yuan, T.; Zhao, X.; Liu, R.; Zhu, X.; Wang, S.; Yu, Q. Speed behaviour of right-turn drivers at signalized intersections in China. IET Intell. Transp. Syst. 2022, 1–13. [Google Scholar] [CrossRef]
  29. Tawfeek, M.H.; El-Basyouny, K. A context identification layer to the reasoning subsystem of context-aware driver assistance systems based on proximity to intersections. Transp. Res. Part C Emerg. Technol. 2020, 117, 102703. [Google Scholar] [CrossRef]
  30. Shino, M.; Minami, K.; Kamata, M.; Hiramatsu, M.; Sunda, T. Deceleration Timing Relating a Driver’s State Based on Naturalistic Driving Behavior Database during Approach to Intersection. Int. J. Automot. Eng. 2019, 10, 106–112. [Google Scholar] [CrossRef]
  31. Zöller, I.; Abendroth, B.; Bruder, R. Driver behaviour validity in driving simulators—Analysis of the moment of initiation of braking at urban intersections. Transp. Res. Part F Traffic Psychol. Behav. 2019, 61, 120–130. [Google Scholar] [CrossRef]
  32. Li, S.; Li, P.; Yao, Y.; Han, X.; Xu, Y.; Chen, L. Analysis of drivers’ deceleration behavior based on naturalistic driving data. Traffic Inj. Prev. 2020, 21, 42–47. [Google Scholar] [CrossRef]
  33. Li, X.; Oviedo-Trespalacios, O.; Rakotonirainy, A. Drivers’ gap acceptance behaviours at intersections: A driving simulator study to understand the impact of mobile phone visual-manual interactions. Accid. Anal. Prev. 2020, 138, 105486. [Google Scholar] [CrossRef]
  34. Hong, S.; Min, B.; Doi, S.; Suzuki, K. Approaching and stopping behaviors to the intersections of aged drivers compared with young drivers. Int. J. Ind. Ergon. 2016, 54, 32–41. [Google Scholar] [CrossRef]
  35. Carter, N.; Beier, S.; Cordero, R. Lateral and Tangential Accelerations of Left Turning Vehicles from Naturalistic Observations. SAE Technical Paper. 2019. Available online: https://assets.jsheld.com/uploads/PDFs/Lateral-and-Tangential-Accelerations-of-Left-Turning-Vehicles-from-Naturalistic-Observations.pdf (accessed on 30 April 2021).
  36. Petraki, V.; Ziakopoulos, A.; Yannis, G. Combined impact of road and traffic characteristic on driver behavior using smartphone sensor data. Accid. Anal. Prev. 2020, 144, 105657. [Google Scholar] [CrossRef]
  37. Chen, Z.; Yu, J.; Zhu, Y.; Chen, Y.; Li, M. Abnormal driving behaviors detection and identification using smartphone sensors. In Proceedings of the 2015 12th Annual IEEE International Conference on Sensing, Communication, and Networking (SECON), Seattle, WA, USA, 22–25 June 2015; pp. 524–532. [Google Scholar]
  38. Chauhan, B.P.; Joshi, G.J.; Parida, P. Driving cycle analysis to identify intersection influence zone for urban intersections under heterogeneous traffic condition. Sustain. Cities Soc. 2018, 41, 180–185. [Google Scholar] [CrossRef]
  39. Parker, M.R.; Zegeer, C.V. Traffic Conflict Techniques for Safety and Operations—Observers Manual. 1989. Available online: https://www.fhwa.dot.gov/publications/research/safety/88027/88027.pdf (accessed on 30 April 2021).
  40. Wang, X.; Abdel-Aty, M. Temporal and spatial analyses of rear-end crashes at signalized intersections. Accid. Anal. Prev. 2006, 38, 1137–1150. [Google Scholar] [CrossRef]
  41. Huang, F.; Liu, P.; Yu, H.; Wang, W. Identifying if VISSIM simulation model and SSAM provide reasonable estimates for field measured traffic conflicts at signalized intersections. Accid. Anal. Prev. 2013, 50, 1014–1024. [Google Scholar] [CrossRef] [PubMed]
  42. Li, G.; Lai, W.; Sui, X.; Li, X.; Qu, X.; Zhang, T.; Li, Y. Influence of traffic congestion on driver behavior in post-congestion driving. Accid. Anal. Prev. 2020, 141, 105508. [Google Scholar] [CrossRef] [PubMed]
  43. Yang, Z.; Liu, P.; Chen, Y.; Yu, H. Can Left-turn Waiting Areas Improve the Capacity of Left-turn Lanes at Signalized Intersections? Procedia—Soc. Behav. Sci. 2012, 43, 192–200. [Google Scholar] [CrossRef]
  44. Steinbakk, R.T.; Ulleberg, P.; Sagberg, F.; Fostervold, K.I. Effects of road work characteristics and drivers’ individual differences on speed preferences in a rural work zone. Accid. Anal. Prev. 2019, 132, 105263. [Google Scholar] [CrossRef]
  45. Ni, Y.; Li, K.; Xu, H. Research on waiting-area for left-turning vehicles in signalized intersection. Traffic Transp. 2006, 12, 32–36. [Google Scholar]
  46. Thapa, R.; Hallmark, S.; Oneyear, N. Braking behavior of major approach turning vehicles at rural two-way stop controlled intersections: A naturalistic driving study. Traffic Inj. Prev. 2020, 21, 308–312. [Google Scholar] [CrossRef]
  47. Huang, Y.; Sun, D.J.; Zhang, L.H. Effects of congestion on drivers’ speed choice: Assessing the mediating role of state aggressiveness based on taxi floating car data. Accid. Anal. Prev. 2018, 117, 318–327. [Google Scholar] [CrossRef]
Figure 1. Diagram illustrating the equipment installation.
Sustainability 14 11630 g001
Figure 2. An example of CAERI-NDS videos.
Sustainability 14 11630 g002
Figure 3. Left-turn waiting area.
Sustainability 14 11630 g003
Figure 4. Illustration of the driving behavior of one case with two stops. To be specific, Acc is the longitudinal acceleration and S_brake pedal is the brake pedal status, and S_brake pedal is equal to 1 as the brake pedal is pressed.
Sustainability 14 11630 g004
Figure 5. Average speeds in different traffic conditions.
Sustainability 14 11630 g005aSustainability 14 11630 g005b
Figure 6. Significance level of differences among different traffic conditions.
Sustainability 14 11630 g006aSustainability 14 11630 g006b
Figure 7. Longitudinal acceleration in conditions of different traffic densities. The area borders bounded by a dashed red line indicate that 90% of Acc-DTI samples fall in that area, and the area borders bounded by a solid red line indicate that 50% of Acc-DTI samples fall in that area.
Sustainability 14 11630 g007
Figure 8. Longitudinal acceleration in conditions of different traffic light states. The area borders bounded by a solid red line indicate that 90% of Acc-DTI samples fall in that area, and the area borders bounded by a dashed red line indicate that 50% of Acc-DTI samples fall in that area.
Sustainability 14 11630 g008
Figure 9. TTIa (TTI at the start of the approaching phase) in different traffic conditions. * p < 0.05, ** p < 0.01, *** p < 0.001.
Sustainability 14 11630 g009
Figure 10. Decmax (maximum deceleration at approaching phase) on different traffic conditions. * p < 0.05.
Sustainability 14 11630 g010
Figure 11. Curves of speed vs. DTI of the cases with different numbers of stops (Numstop).
Sustainability 14 11630 g011
Figure 12. Numstop (number of stops) in different traffic conditions. *** p < 0.001.
Sustainability 14 11630 g012
Figure 13. Duras (duration of stop–go phase) on different traffic conditions. *** p < 0.001.
Sustainability 14 11630 g013
Figure 14. Accstart (starting acceleration at traversal phase) in different traffic conditions. *** p < 0.001.
Sustainability 14 11630 g014
Figure 15. Accmax (maximum acceleration at traversal phase) in different traffic conditions. * for p < 0.05, *** for p < 0.001.
Sustainability 14 11630 g015
Figure 16. The 95th percentile of the positive and negative jerk under different traffic conditions.
Sustainability 14 11630 g016
Table 2. The details to be annotated for CAERI-NDS videos.
FieldValue(s)
File_IDUnique identifier for each vehicle trip
Frame at the stop lineFrame of the video when the stop line was last visible
Traffic density levelSparse, medium, dense
Left-turn waiting areaYes, No
Vehicle movementLeft turn, right turn, straight line
Intersection typeFour-legged intersection, T-type intersection, other
WeatherSunny, cloudy, rainy
Signalized intersectionYes, No
Pedestrian crossingYes, No
Traffic signal state of left turn Video frame at the onset of green, yellow, and red
Traffic signal state of right turn Video frame at the onset of green, yellow, and red
Traffic signal state of straight line Video frame at the onset of green, yellow, and red
Number of the lane0–6 (from left lane to right lane)
Lane change recordThe lane to change and the video frame at the onset of the changing lane
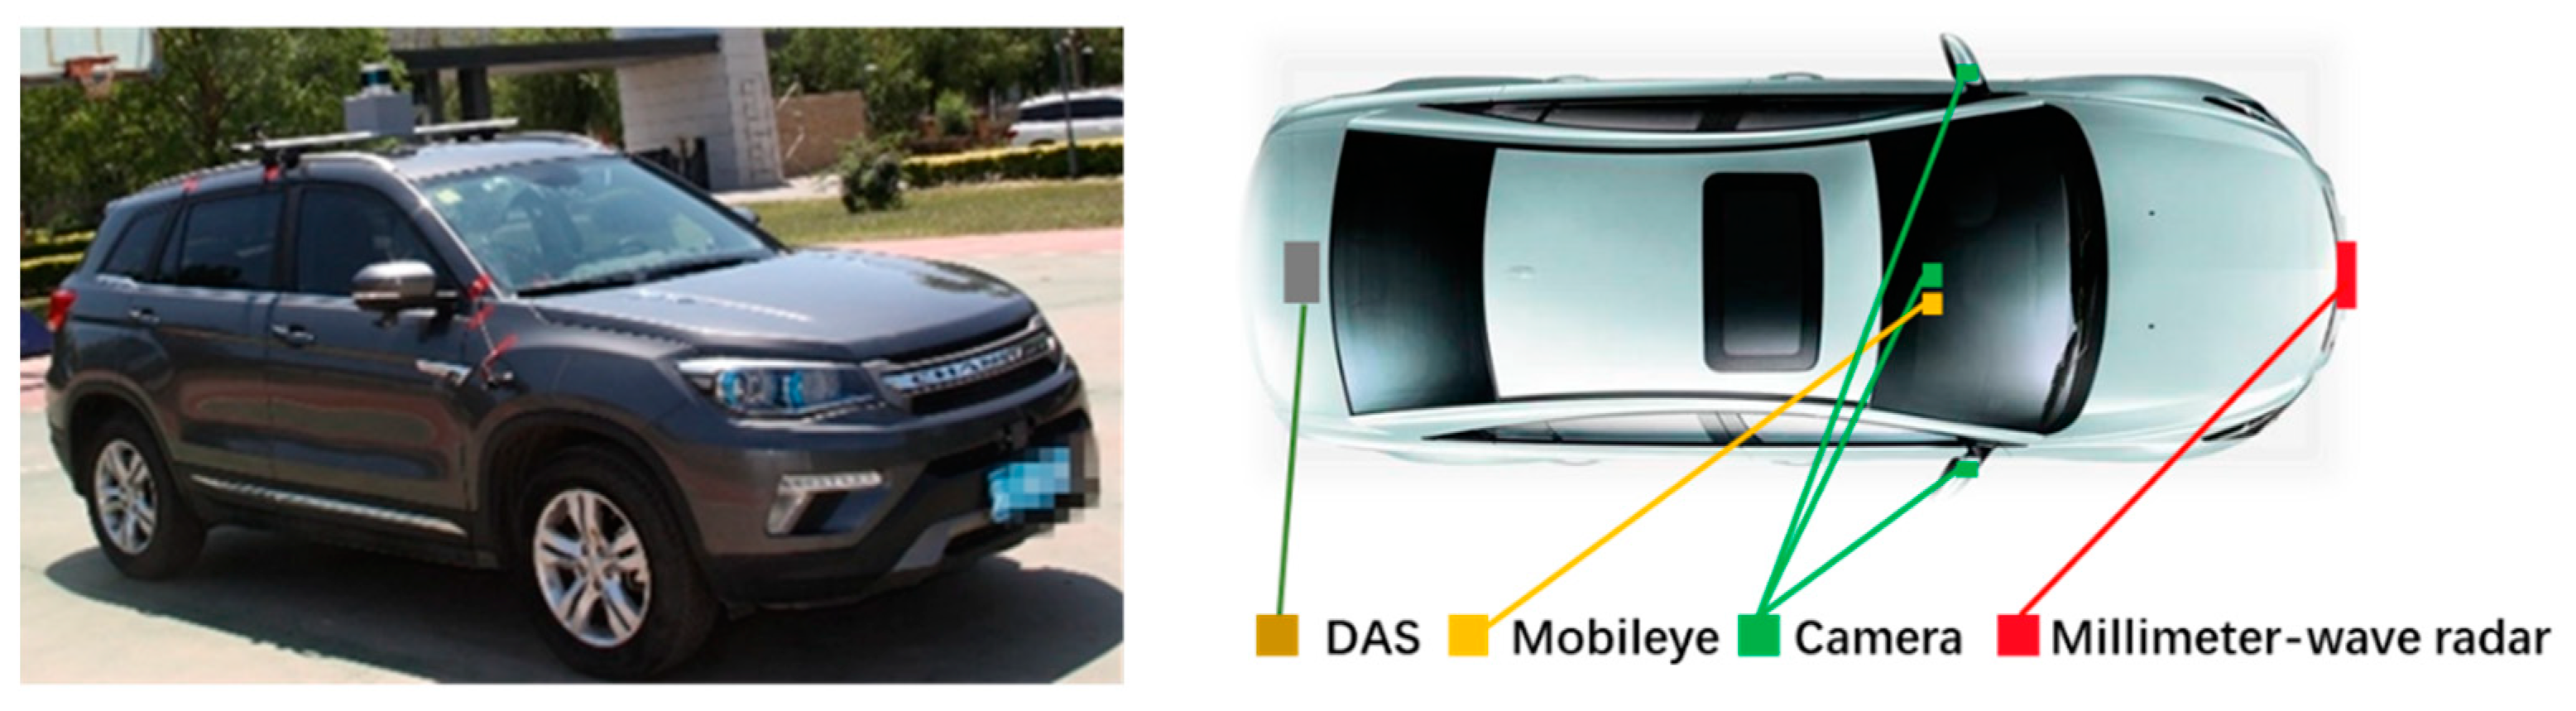
ME-IDUnique identifier for object collected by Mobileye
Radar-IDUnique identifier for object collected by Radar
Object typeMotorcycle, electric scooter, Bicycle, Vehicle, None
Table 3. Parameters for longitudinal driving behavior in the three different phases.
PhasesSymbol DefinitionCharacteristics
Approaching phaseDTIaDistance between the approaching starting point and the stop line.Position to trigger brake pedal activation
TTIaTime between approaching starting point and the stop line Time to trigger brake pedal activation
DecmaxMaximum deceleration during approaching phaseDeceleration level during approaching phase
Stop–go phaseDTIsDistance to the intersection at the approaching ending pointPosition to stop or minimize speed
NumstopNumber of stops per vehicle Capacity to travel through an intersection
DurasTime interval at stop–go phaseCapacity to travel through an intersection
Traversal phaseDTItDistance between the approaching ending point and the stop linePosition to traverse an intersection
ACCstartStarting acceleration at the traversal phase Urgency for acceleration after the stop line
ACCmaxMaximum acceleration at the traversal phaseComfort acceleration boundary drivers maintained at the traversal phase
Table 4. Spatial distribution of the three driving phases.
Independent VariableDependent VariableSignificant LevelMean (±Standard Errors)
Traffic densityDTIa (m)F(2, 371) = 0.66, p = 0.516Sparse: 46.72 (±2.74 SE)
Medium: 54.11 (±2.98 SE)
Dense: 67.05 (±3.70 SE)
DTIs (m)F(2, 371) = 4.31, p = 0.014 *Sparse: 0.57 (±2.02 SE)
Medium: 13.68 (±2.27 SE)
Dense: 33.73 (±3.37 SE)
DTIt (m)F(2, 371) = 1.88, p = 0.154Sparse: −4.57 (±1.80 SE)
Medium: 7.12 (±2.32 SE)
Dense: 14.67 (±2.88 SE)
Traffic light stateDTIa (m)F(1, 372) = 18.04, p < 0.001 ***Red: 58.50 (±1.80 SE)
Green: 32.06 (±5.24 SE)
DTIs (m)F(1, 372) = 6.39, p = 0.012 *Red: 15.39 (±1.37 SE)
Green: −4.08 (±5.57 SE)
DTIt (m)F(1, 372) = 1.22, p = 0.27Red: 5.80 (±1.20 SE)
Green: −4.09 (±5.25 SE)
Intersection typeDTIa (m)F(1, 372) = 1.63, p = 0.203Four-legged: 53.75 (±2.13 SE)
T-type: 54.08 (±3.48 SE)
DTIs (m)F(1, 372) = 3.55, p = 0.060Four-legged: 12.58 (±1.78 SE)
T-type: 12.63 (±2.99 SE)
DTIt (m)F(1, 372) = 2.85, p = 0.093Four-legged: 3.88 (±1.59 SE)
T-type: 4.55 (±2.64 SE)
Left-turn waiting areaDTIa (m)F(1, 372) = 0.009, p = 0.924Without LWA: 53.31 (±2.03 SE)
With LWA: 56.08 (±4.07 SE)
DTIs (m)F(1, 372) = 0.196, p = 0.659Without LWA: 12.84 (±1.70 SE)
With LWA: 11.58 (±3.47 SE)
DTIt (m)F(1, 372) = 0.924, p = 0.337Without LWA: 5.36 (±1.53 SE)
With LWA: −1.52 (±2.91 SE)
* p < 0.05, *** p < 0.001.
Publisher’s Note: MDPI stays neutral with regard to jurisdictional claims in published maps and institutional affiliations.

