1. Introduction
The development of the coal industry is far more than an economic issue; it is central to energy security, environmental protection, national defense, and livelihood [
1]. However, the coal industry is characterized by a geographical imbalance: resource-intensive areas are generally not demand-intensive areas. Coal must be transported to customers via different transportation modes. Maritime transportation, which enables low-cost, large-scale and long-distance transportation activities, has been identified as the backbone of global coal transportation. In 2018, nearly 30% of global seaborne trade was dry bulk cargo, and more than 20% of dry bulk cargo was coal [
2]. Improving the efficiency of the port-centric coal transportation chain (PCTC), which is the key component of both domestic and global coal transportation, has become a major task for coal industry management. As a first step in enhancing performance, a practical evaluation model is urgently needed that stakeholders can use to obtain a complete picture of the PCTC and identify its strengths and weaknesses considering the features of coal transportation.
The aim of this study is to propose an evaluation tool for the PCTC. The evaluation model orientation is a guiding indicator at the middle level. In practical applications, shippers can choose a route with a high accessibility indicator. From the port operators’ point of view, port operators can identify their weaknesses and strengths by comparing the sub-indicators of accessibility and further make corresponding adjustments to development planning and market positioning. To achieve the research goal, three aspects should be emphasized and considered.
First, there is no doubt that economic issues are crucial and must be considered. The U.S. Energy Information Administration highlighted transportation costs in their report on the coal price outlook, pointing out that the transportation cost is significant and sometimes more than the original price of coal at the mine. Statistical data have confirmed the significant proportion: Transportation cost was 41.28% of the delivered price in 2018 [
3]. In China, logistics costs have accounted for more than one-third of the coal price and have even reached 50% in some regions. Considering Shanxi thermal coal as an example, the transportation cost accounts for approximately 40% of the terminal price [
4]. Multimodal transportation operators and consignees want to deliver goods to their destinations at the lowest cost possible. Therefore, reducing transportation costs in the coal transportation chain could have a great effect on improving the competitiveness of carriers.
Second, environmental pollution is another key issue throughout the transportation chain. Emissions from the transportation sector accounted for the largest portion (29%) of the total U.S. greenhouse gas emissions in 2017 [
5]. In 2018, the China Coal Group’s social responsibility report showed that it emitted 6283 tons of sulfur dioxide, 7374 tons of nitrogen oxide, and 34 tons of ammonia nitrogen, resulting in serious coal pollution [
6]. Emissions reduction remains in the spotlight worldwide. For example, the International Maritime Organization (IMO) sharply cut the sulfur permitted by 70% in 2020, stimulating the sustainability revolution in the freight market. Emissions limitations impact every stakeholder in the freight market, such as port authorities [
7] (pp. 288–298) and shippers [
8]. Aside from common emissions content, coal dust during operation is a unique problem in coal transportation. Coal in port areas is usually stored and stacked in the open ground [
9] (pp. 6406–6420), and it erodes when exposed to open air. Coal particles move through spraying, suspension, rolling, creep, rebound, and other phenomena. Particulate matter emissions lead to not only air pollution (such as air quality degradation) but also a loss of raw materials for industries. According to a recent study [
10] (pp. 360–396), even when sitting in storage, coal dust increases the concentrations of airborne fine particulates within 25 miles. These authors also pointed out that the local air pollution cost is as high as USD 197 for every ton of stockpiled coal. To control pollution, the government promulgated an environmental protection tax law and other policies. Firms engaged in coal transportation must pay a certain amount of sewage fees or environmental taxes to compensate for pollution emissions. The staggering accumulated pollution cost underscores the great importance of promoting the green coal transportation chain, especially when the chain extends over long distances. With the international community focusing increasing attention on environmental protection, coal ports have undertaken relevant measures to control pollution [
11,
12]. For example, the National Energy Group, a large coal supplier, mentioned in its social responsibility report in 2019 that it invested CNY 8.462 billion in environmental protection, of which CNY 14.24 million were traded in carbon emissions [
13]. Thus, environmental pollution is one of the important factors to consider when evaluating the system.
Third, stakeholders emphasize concerns about seasonal demand fluctuations: Summer and winter are the peak coal transportation periods in China, during which the number of coal vessels increases sharply. In 2018, the demand for companies downstream of China’s thermal coal supply chain was approximately 820 million tons in the summer and approximately 830 million tons in the winter. The coal demand in the summer is approximately 70 million tons higher than that in the spring [
14]. Similarly, the United States consumed 196.3 million short tons of coal in the summer and 179.4 million short tons in the winter. The coal consumption in the summer is approximately 51 million short tons higher than in the spring [
15]. In the context of fluctuating demand, the capacity of the ports is fixed. Some ports could have idle resources during slack seasons while finding it difficult to manage the enormous cargo volume during peak seasons. The obvious seasonal fluctuation in cargo volume leads to a fluctuation in vessel waiting time. For example, in the peak season, the coal residence time on board is significantly longer than it is in the slack season since vessels must wait longer for operational resources in the peak season. In 2016, it was reported that nearly 350 ships were waiting to be loaded in the anchoring areas of the five ports around Bohai Bay (Qinhuangdao Port, Caofeidian Port, Jingtang Port, Huanghua Port and Tianjin Port). Qinhuangdao Port was the most congested, with more than 70 ships waiting to be loaded. The port operation capacity cannot keep up with the surge in ships, further resulting in a backlog of ships [
16]. Therefore, the ability of a port to handle the seasonal fluctuation of cargo volume, which is defined later as port operational adaptability, should also be considered.
In this context, we propose an accessibility evaluation system for the PCTC based on the gravity model. Not only economic issues but also emissions issues are included in the model. Since the port is the crucial point of the PCTC, we introduce the port operational adaptability indicator into the evaluation model to measure the port performance under the fluctuating coal transportation volume. The newly introduced indicator directly provides information about the port’s ability to handle peak volume, which is crucial for stakeholders. The output is a dimensionless annual mean value of the accessibility index used to evaluate the convenience of coal transportation.
The contributions of our paper are threefold. First, our comprehensive evaluation model involves multiple transportation modes, is based on actual easily accessed data, and can provide valuable information in practice. Second, by capturing the characteristics of the coal industry, a quantitative metric of port operational adaptability is introduced into our model. Finally, coal dust pollution is innovatively included in the environmental component of the model.
The remainder of the paper is organized as follows.
Section 1 is the introduction.
Section 2 conducts a literature review on accessibility and the coal transportation chain.
Section 3 introduces an evaluation accessibility model for the PCTC.
Section 4 provides an empirical study based on real data from four hub ports in northern China. Finally,
Section 5 presents the conclusion and discussion.
3. Accessibility of the Port-Centric Coal Transportation Chain
3.1. The Port-Centric Coal Transportation Chain
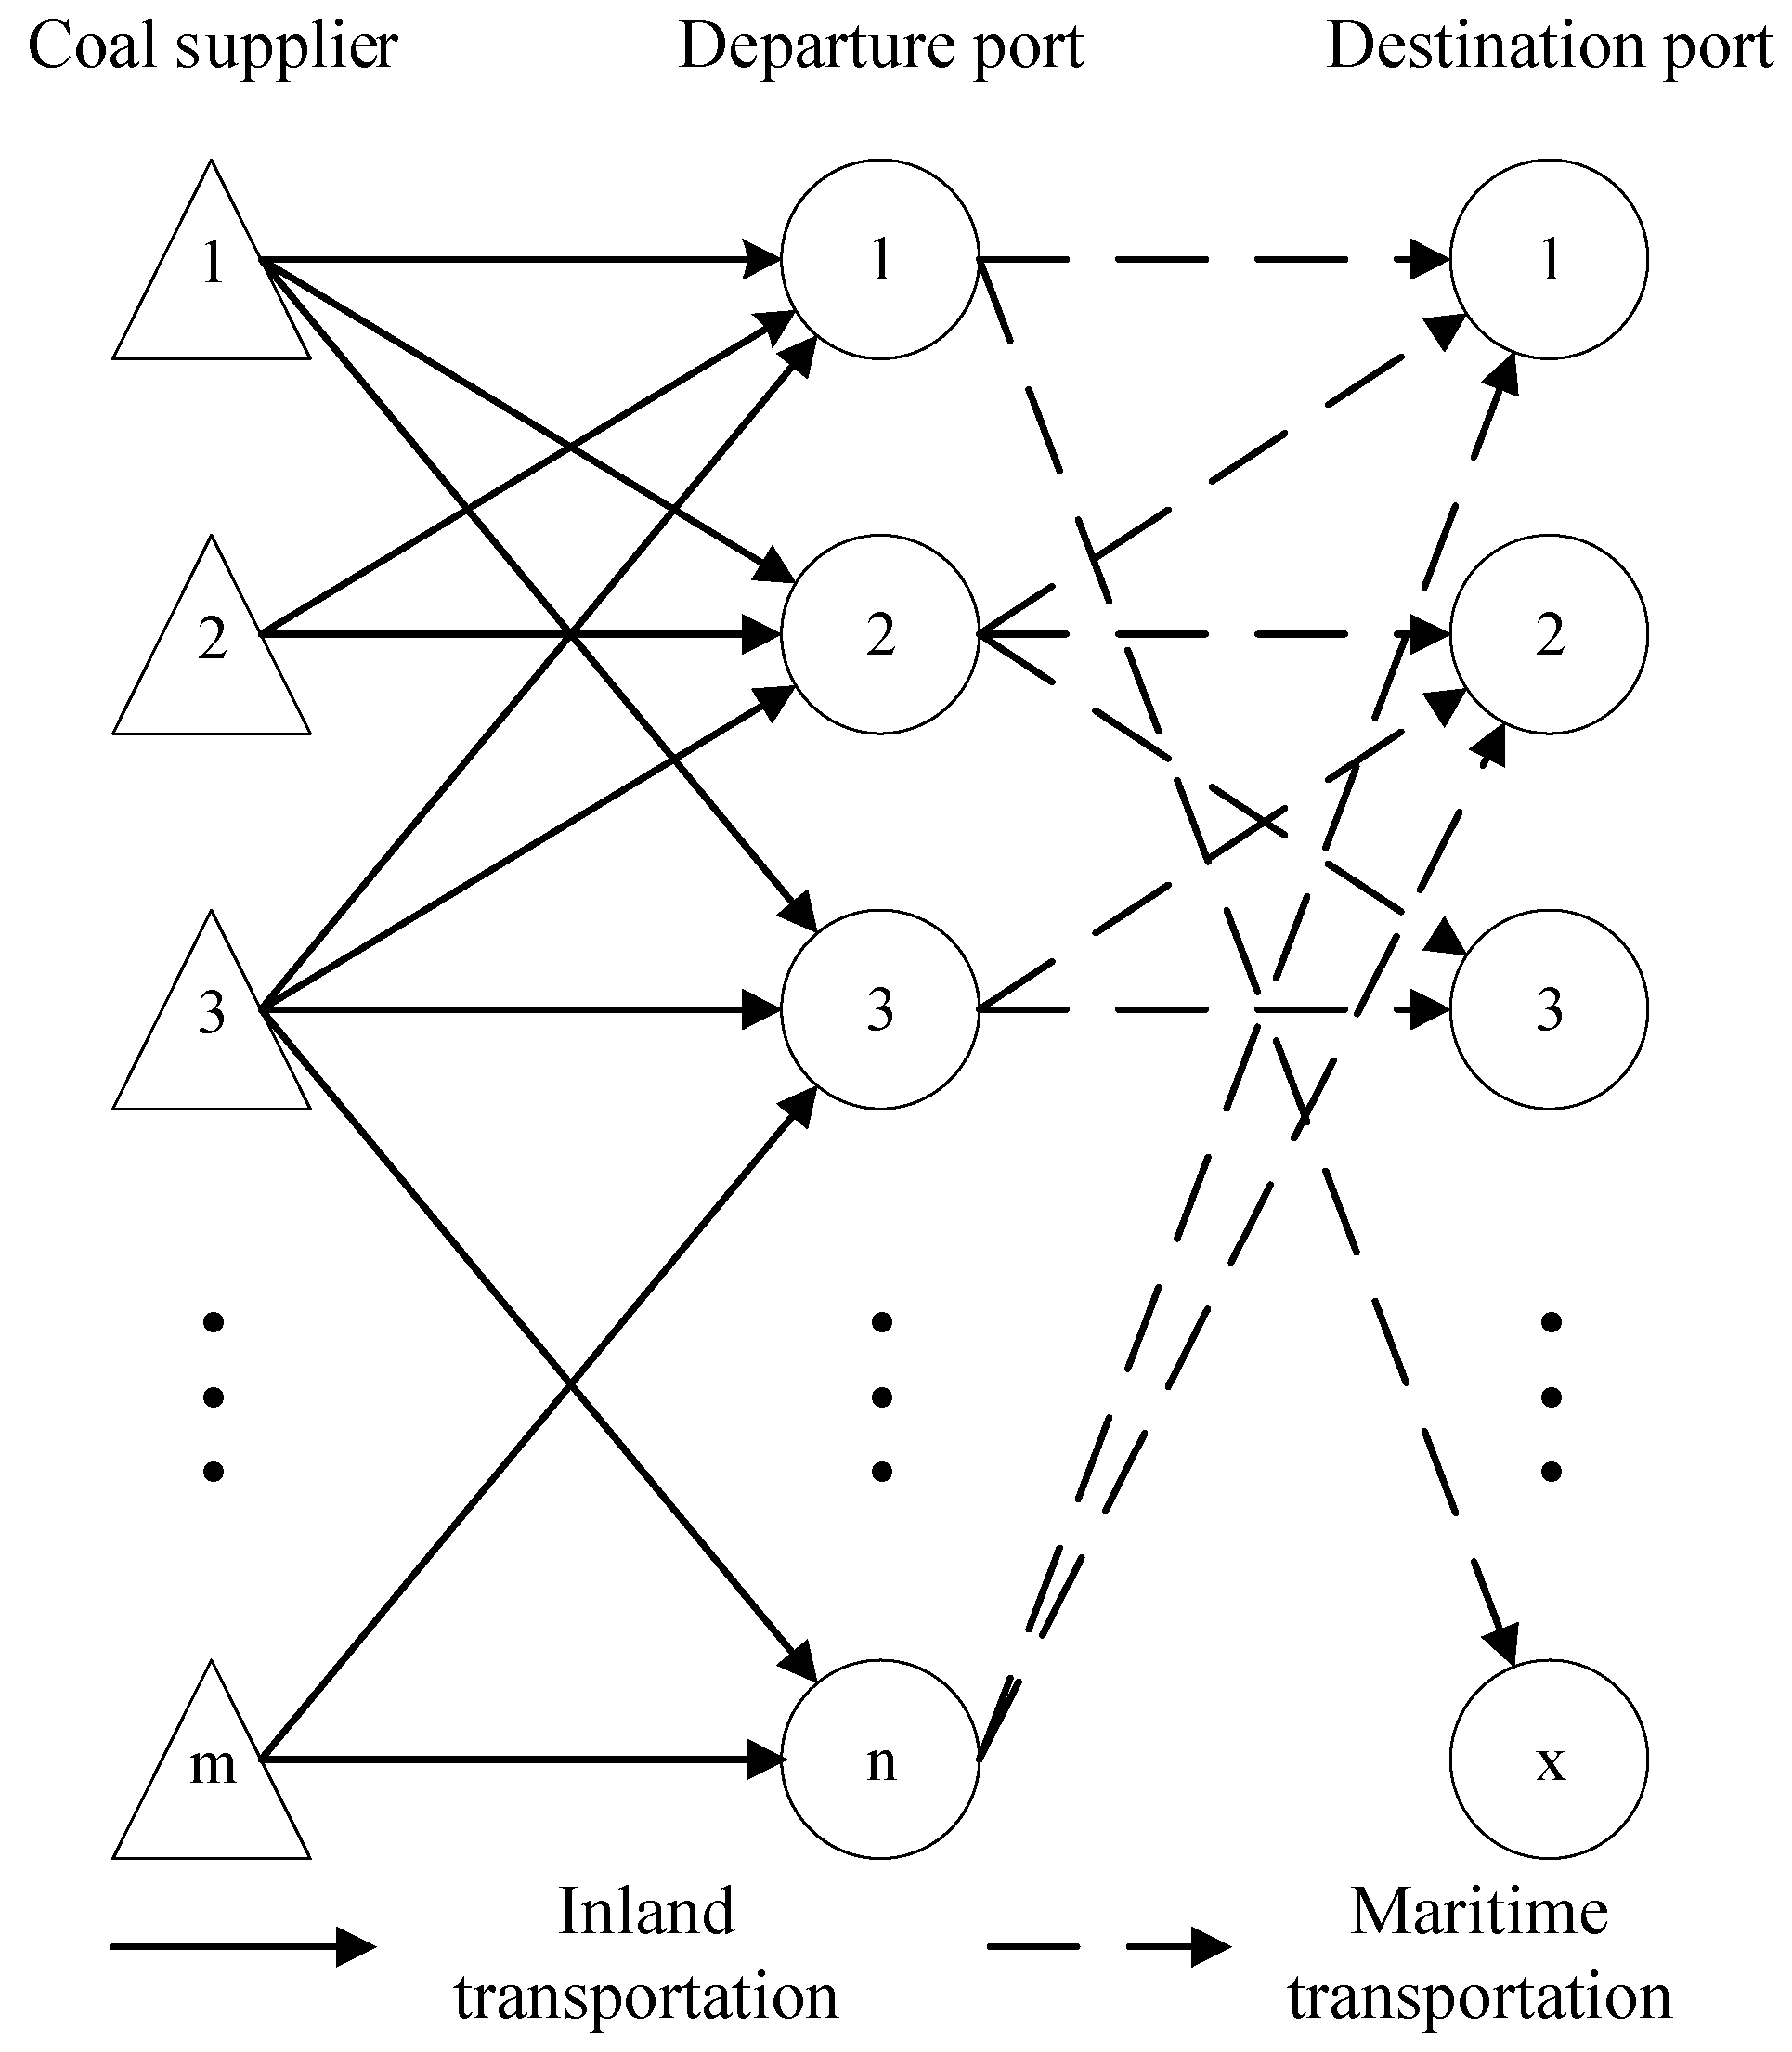
Figure 1 illustrates a typical PCTC. Initially, coal is transported via some inland transportation mode (trucks or trains) from the hinterlands to the departure port. When the coal arrives at a port, there is a series of operational activities (unloading, blending, loading on board, etc.) before maritime transportation begins. The efficiency of these operating activities will impact the performance of the transportation chain. Next, the coal is shipped to a destination port via maritime transportation. This paper focuses on the whole process from the suppliers in the hinterland to the destination port. Both inland transportation and maritime transportation are considered.
3.2. Gravity Model
The architecture of our accessibility evaluation model is based on the gravity model, which has been a widely used method for measuring accessibility [
55]. The idea behind the gravity model method derives from the universal gravitation law of physics: The accessibility of a point is measured by the sum of potential energy applied to the point by all the other attractive points. The original gravity model is shown in Equation (1). The trip impedance (distance, cost, time, etc.) function
between the attractive point and the measuring point is the key component of the gravity model. A trip impedance function can be an exponential function, power function, linear function, or logarithmic function.
is the attractiveness of node
k, which usually indicates the ability and desire to overcome the trip impedance. The gravity model method combines the attenuation of the spatial effect of each attraction point in space with distance and the attraction scale of each attraction point to measure the level of accessibility.
where
denotes the accessibility from measuring node
i to attractive node
k,
denotes the attraction of node
k, and
denotes the impedance function of distance with coefficient
.
The most prominent feature of the gravity model is that it integrates the transportation system and socioeconomic activities into a unified analytical framework. The attractive component of the model is usually related to the regional development level or economic development potential, while the impedance component is usually related to the distance, time, and cost between regions.
The accessibility model for the PCTC developed in this paper considers the generalized travel cost to the port, environmental pollution cost along the transportation chain, port operational adaptability, and coal annualized slot capacity of the port. As shown in Equation (2), to better reflect the impact of coal freight volume fluctuations on ship waiting times in different periods, the unit coal on-board residence time in ports is calculated on a weekly basis. Considering the variation in the coal on-board residence time, the weekly accessibility index is calculated to reflect the fluctuation of the accessibility index. Through the analysis of the weekly accessibility index, the influence of seasonal freight fluctuations on PCTC accessibility can be clearly observed. The final model output is an average annual accessibility index , which reflects the comprehensive level of coal transportation convenience. For a certain route, the higher the annual accessibility index, the more convenient the coal transportation.
Since maritime transportation is a key part of the PCTC, the attractiveness sector in the evaluation model should directly indicate the competitiveness of maritime transportation. The annualized slot capacity for coal, a widely used indicator displaying the foreland capacity of a port in a global logistics network [
54], is used to indicate the attractiveness of the molecule. For the distance impedance function, the generalized travel cost, port operational adaptability, and environmental pollution cost are used to represent the coal transportation impedance. Weight coefficients are introduced into the denominator to present the different shippers’ preferences when trading off between money and performance stability.
where
denotes the annual accessibility from shipper
i to port
k,
I ∈ I, I is the set of shippers,
k ∈ K, and K is the set of coal departure ports.
denotes the weekly accessibility index of week
w,
w ∈ W, W is the set of weeks,
N is the total number of weeks in 1 year,
denotes the standardized annualized slot capacity for coal of port
k,
denotes the standardized generalized travel cost per ton of coal from shipper
i to port
k,
denotes the standardized environmental pollution cost per ton of coal from shipper
i to port
k, and
denotes the standardized port operational adaptability of week
w.
,
, and
denote the weight coefficient of each impedance part. The differences between
and
indicate the differences in shippers’ preferences regarding cost issues and port performance stability.
The above factors and key parameters are all standardized by the generalized exponential method. The generalized exponential method compares the actual value with the standard value, as shown in Equation (3). In this paper, the standard value is the maximum value of the index.
where
denotes the standardized index,
denotes the index number,
denotes the original value of index
, and
denotes the maximum of index
.
3.3. The Key Parameters of the Port-Centric Coal Transportation Chain
This subsection presents how to calculate each sector in the accessibility model.
3.3.1. The Annualized Slot Capacity
The annualized slot capacity for coal, indicating the handling capacity and foreland connectivity of a port, is used as the attraction function. Annualized slot capacity has been widely used to evaluate the accessibility of maritime transportation. Higher annualized slot capacity indicates the capacity to manage a greater volume of coal and higher foreland connectivity, which can enhance a port’s competitiveness. According to previous studies, this index can be calculated based on the call number of each shipping line and vessel capacity [
39]. The expression is shown in Equation (4).
where
denotes the annualized slot capacity for coal of port
k;
denotes the average coal vessel capacity of a specific shipping line
j;
denotes the annual number of calls of coal shipping line
j,
j ∈ J; and J is the set of shipping lines.
3.3.2. Generalized Travel Cost
In the PCTC, different choices of departure port
k for shipper
i have different transportation costs. The distance-related cost and transfer cost have been widely used to describe the impedance between the supplier and the departure port. Equation (5) shows the calculation of generalized travel cost
based on distance:
where
denotes the generalized travel costs per ton of coal shipped from shipper
i to port
k,
denotes the unit railway transportation cost for coal,
denotes the shortest rail transportation distance from shipper
i to port
k,
denotes the unit road transportation cost for coal,
denotes the shortest road transportation distance from shipper
i to port
k,
denotes the average speed of railway transportation,
denotes the average speed of road transportation,
denotes the unit time value of coal, and
denotes the unit coal handling cost of port
k. It must be emphasized that travel speed is more accurate than technical speed when measuring transportation convenience.
3.3.3. Environmental Pollution Cost
Another component of the impedance function is a function of environmental pollution. High environmental costs will decrease the accessibility index, which is unfavorable. Analysis of the pollution of various transportation modes demonstrates that the emissions factors of different transportation modes vary widely. In this paper, the pollution cost is calculated based on the pollutant emissions factors of unit freight volume and the unit price of pollutant emissions. In addition, coal dust pollution, which is a unique result of coal transportation, is considered.
where
denotes the unit coal environmental pollution cost when shipped from shipper
i to port
k, and
and
denote the emissions factors of pollutant
g for railway and road transportation, respectively.
denotes the emission cost of coal fugitive dust, and
denotes the unit coal fugitive dust emissions at port
k.Coal fugitive dust emissions are calculated according to the Specifications for Environmental Impact Assessment of Port Engineering (JTS105-1-2011) [
56]. Equation (7) presents the calculation in detail.
where
denotes the dust adjustment coefficient based on coal type;
denotes the wind speed in port
k, where the wind speed on the surface of a multiple yard is 89% that of a single pile;
denotes the speed at which wind starts to affect mixed-size particles;
denotes the pile surface area of port
k;
denotes the coefficient of the operation mode;
denotes the operation drop height;
denotes the coefficient of moisture action;
denotes the critical value of the water action effect;
denotes the moisture content;
denotes the operational volume; and
denotes the wind speed at which the dust volume from operations reaches 50% of the maximum dust volume.
3.3.4. Port Operational Adaptability
It is important to study operational adaptability because it impacts the coal turnover frequency and transportation delays. The seasonal fluctuation of coal demand drives the fluctuation of coal volumes through the port. Since the resource capacity is fixed, vessels must sometimes wait for available resources (berths, loading and unloading facilities, etc.) during peak seasons. A long on-board residence time will lead to delays in coal shipments, which will, in turn, bring economic losses in coal transportation. Therefore, as shown in Equation (8), the port operational adaptability (
) is measured by the economic losses caused by a long on-board residence time.
where
denotes the port
k operational adaptability of week
w; denotes the standard deviation of the unit coal on-board residence time of port
k;
denotes the average coal on-board residence time of port
k in week
w;
denotes the emission cost of pollutant
g,
g ∈ G; G is the set of pollutant types; and
denotes the emission factors of pollutant
g for waterway transportation.
The average coal on-board residence time per ton (
) can directly indicate the operational efficiency. It is calculated according to the arrival and departure times of port vessels. The calculation of
is shown in Equation (9). To obtain a quantitative metric for the fluctuation, the standard deviation of
is calculated. Equation (10) shows the calculation of the standard deviation
. A low standard deviation of
indicates that the port is highly consistent, while a high standard deviation of
indicates that
suffers from dramatic variation, which is unfavorable.
where
denotes the arrival time of vessel
z in port
k in week
w;
denotes the vessel departure time;
denotes the deadweight tonnage of the vessel,
z ∈ Z; and Z is the set of vessels.
where
denotes the annual average on-board residence time.
3.4. Model Implementation
For a more comprehensive assessment, the model includes three parts of the data. The first part consists of the data related to the land collection and distribution system, the second part consists of the data related to the port, and the third part consists of the data related to the maritime foreland. The data on the land collection and distribution system include the railway transportation distance, average transportation velocity, coal railway transportation cost, pollution emissions factor, and unit transportation price. These parameters are used to calculate the generalized transportation cost and part of the environmental pollution cost. For port data, the unit coal on-board residence time is calculated based on the arrival and departure times of coal ships at the port. The calculation of coal dust requires data such as the pile surface area, operation drop height, and wind speed. For the foreland part, the data used to calculate the annualized slot capacity include the arriving coal vessels and their capacity.
The output of the gravity model is a dimensionless accessibility index used to evaluate the convenience of coal transportation. The accessibility index is expected to act as an annual indicator published by transport coordinators or government departments. For example, Hebei Port Group is a large enterprise integrating the four major port resources of Caofeidian Port, Huanghua Port, Jingtang Port, and Qinhuangdao Port. Based on the accessibility index, the port group can horizontally evaluate the advantages and disadvantages of each port (such as port operational adaptability and annualized slot capacity for coal) and provide a reference for the next stage of port positioning development. In addition, the accessibility index could also be a guideline for shippers and suppliers. The shippers or suppliers could choose the appropriate long-term and short-term port partners.
4. Case Study
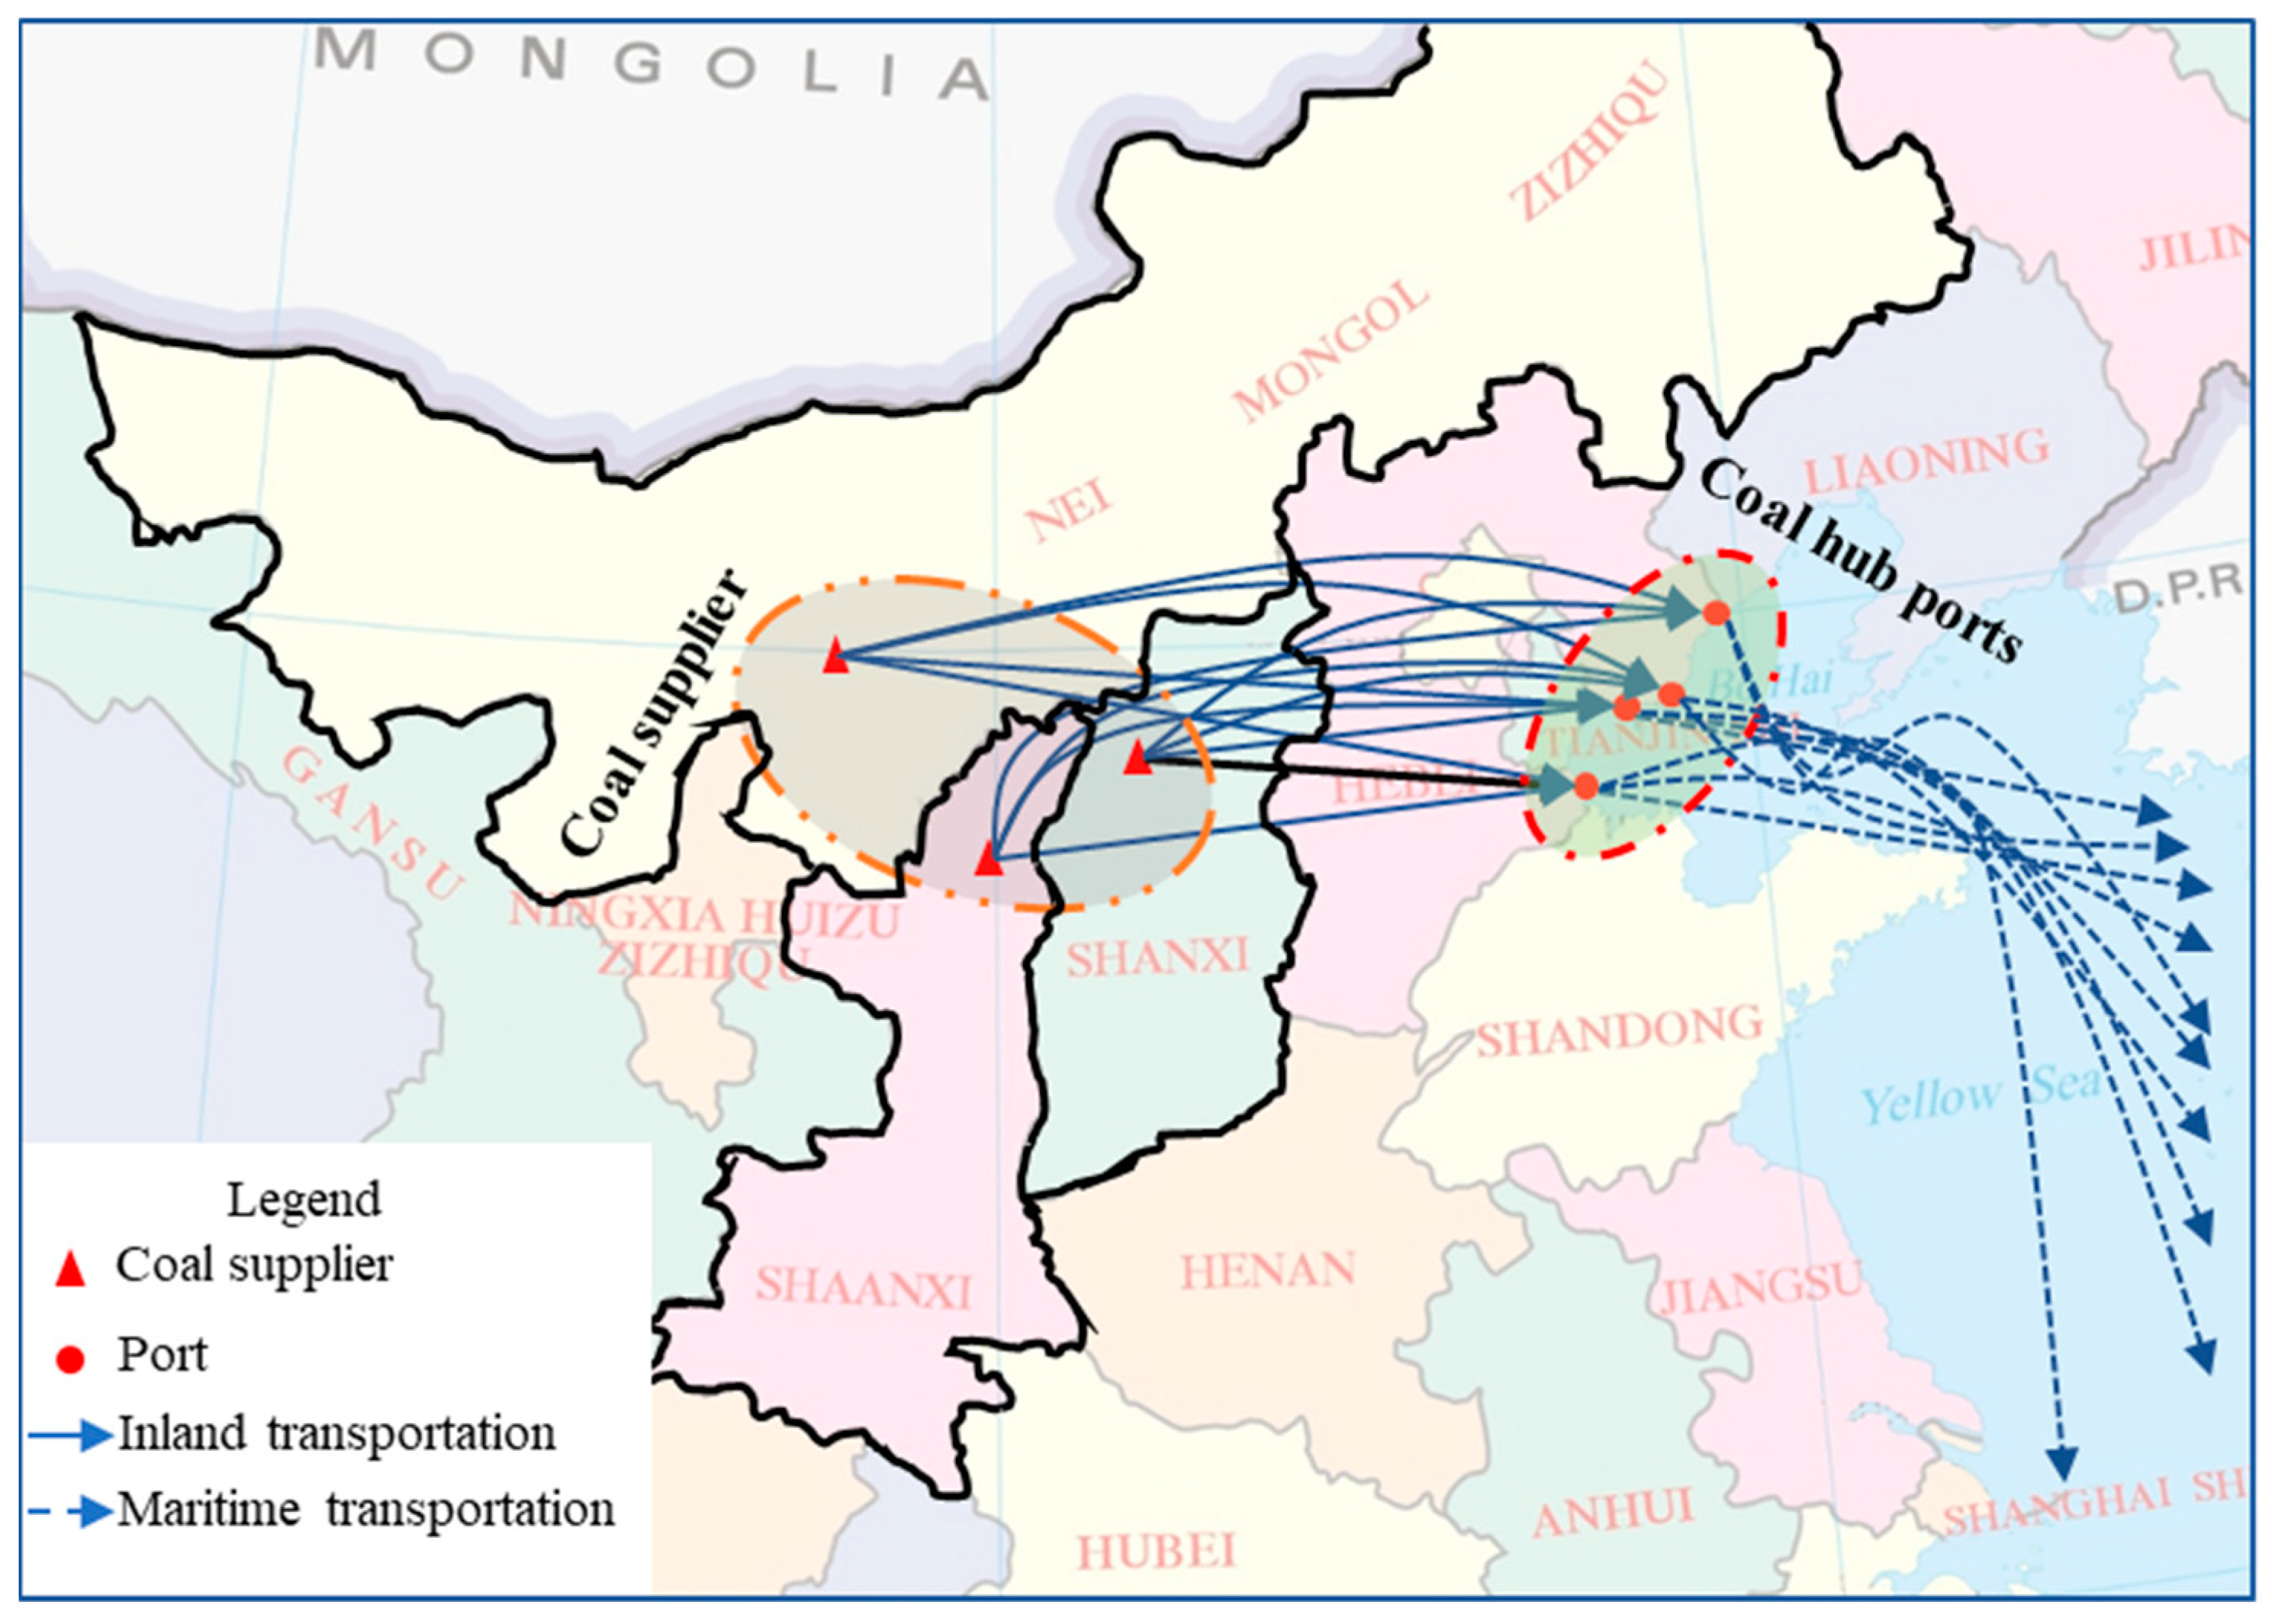
Coal mines in China are mostly located in the north-central area, such as in Inner Mongolia, Shanxi Province, and Shaanxi Province. As shown in
Figure 2, ports in Bohai Bay, the nearest choices for coal suppliers in the north-central area, naturally form the largest coal export port group of China. Qinhuangdao Port, Caofeidian Port, Huanghua Port, and Jingtang Port are four major coal ports in Bohai Bay. The annual quantity of coal shipped from these four ports accounts for nearly 80% of the total quantity produced in China. From those ports, coal is transported to both domestic consumption nodes, such as plants located in the Yangtze River Delta and the Pearl River Delta, and overseas consumption nodes.
In this context, a case study of the coal export transportation chain through four major ports in the Bohai economic circle (Qinhuangdao Port, Caofeidian Port, Huanghua Port and Jingtang Port) from three original supply regions (Inner Mongolia, Shanxi Province, and Shaanxi Province) was conducted.
4.1. Input Data Collection
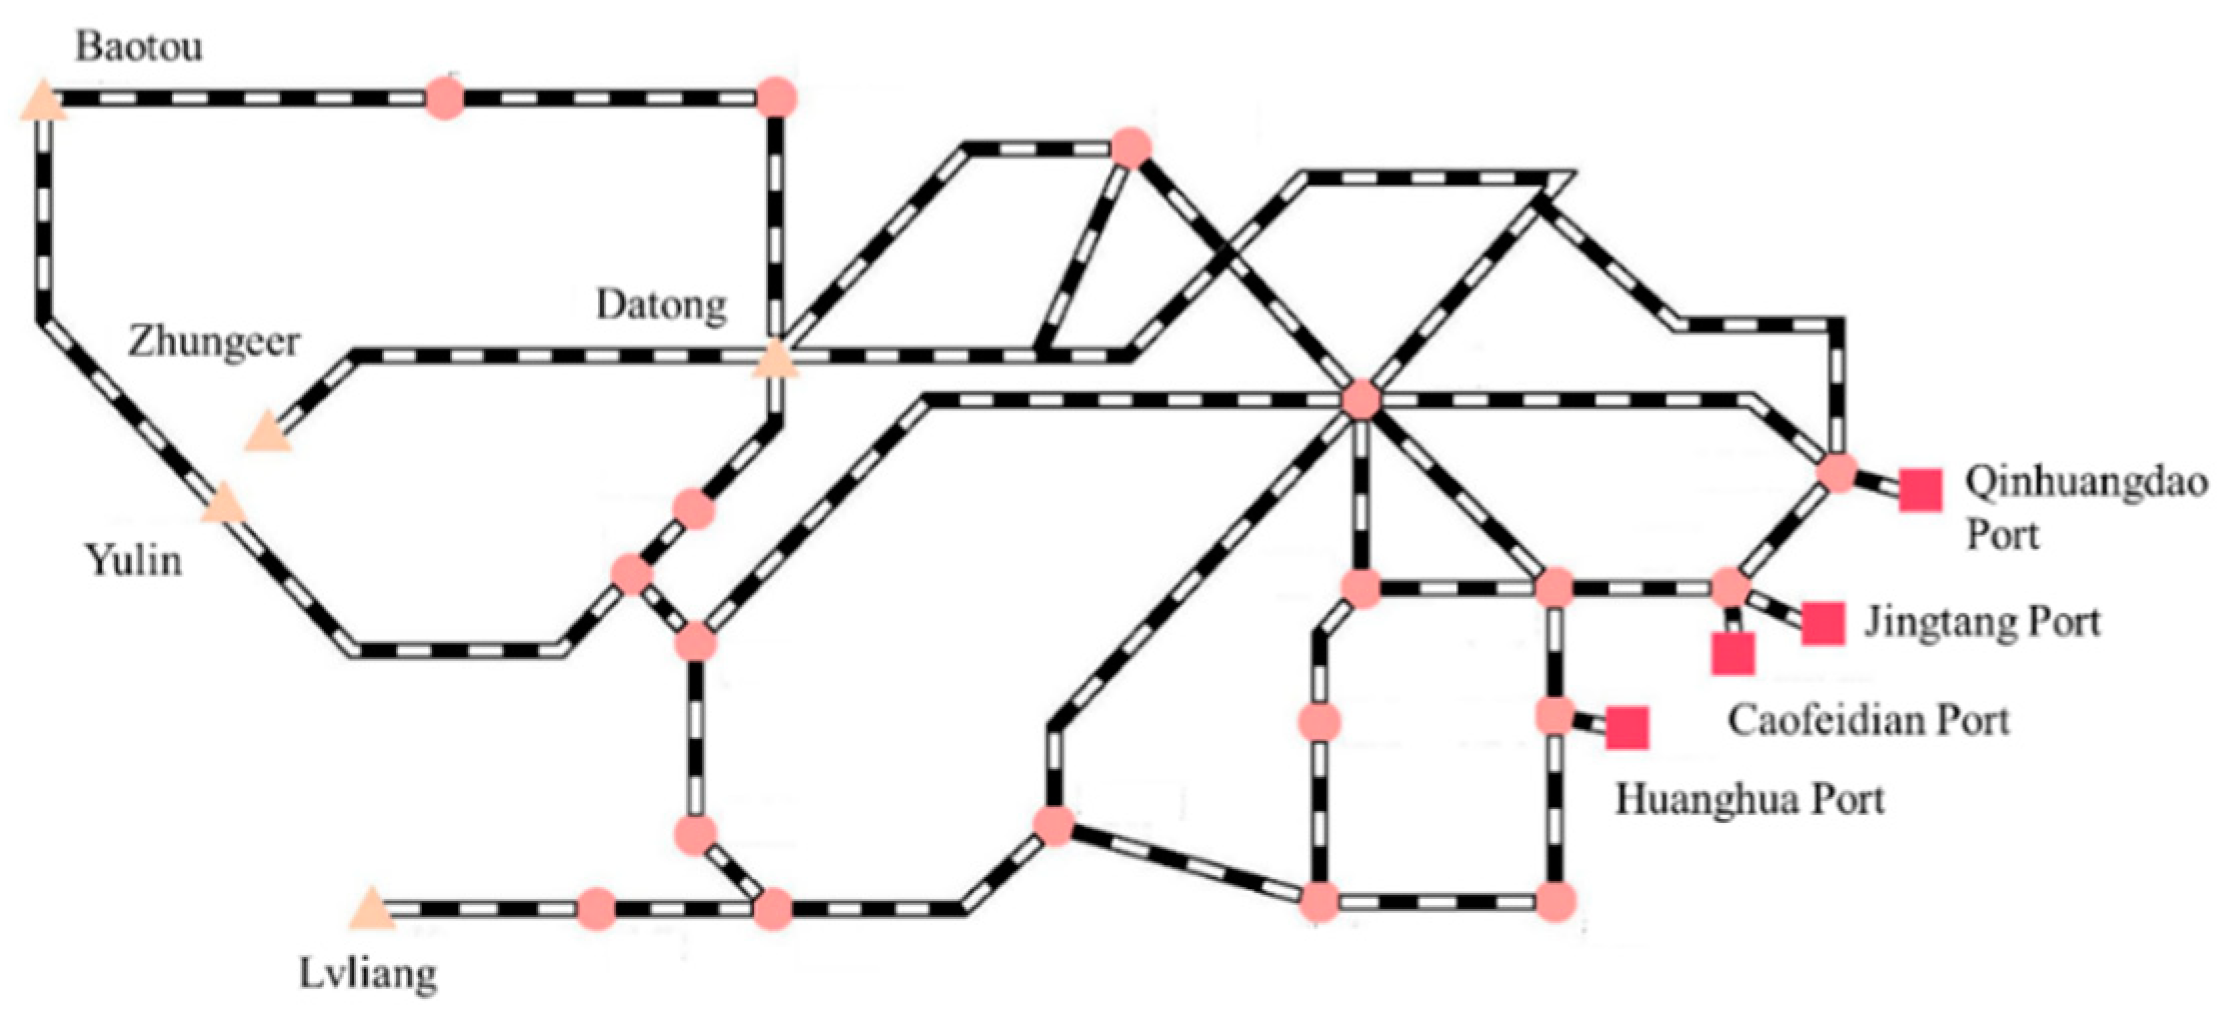
First, we collected data to calculate the generalized travel cost. According to China’s related arrangements for strengthening green development, energy conservation and emission reduction, railway transportation is the only choice for inland coal transportation. Hence, in the case study, inland transportation only refers to railway transportation. Five representative coal supplier cities in Inner Mongolia, Shanxi Province, and Shaanxi Province were selected. We collected the coal railway network data from these cities to the studied ports, as shown in
Figure 3. The railway transportation distances from the hinterlands to ports were collected from the official website of the China Railway Customer Service Center (
www.12306.cn, accessed on 1 August 2020) and are shown in
Table 1.
Based on the published railway freight rates promulgated by the National Development and Reform Commission, the fixed railway coal transportation cost is CNY 16.3/t, and the cost related to distance is CNY 0.098/(t·km) [
57]. The time value is calculated according to the method of the Alford-Bangs model [
58], and the unit time value of coal is CNY 0.016/(t·h). The operational adaptability is calculated from the basic data of port coal vessels according to Formula (8) in
Section 3.
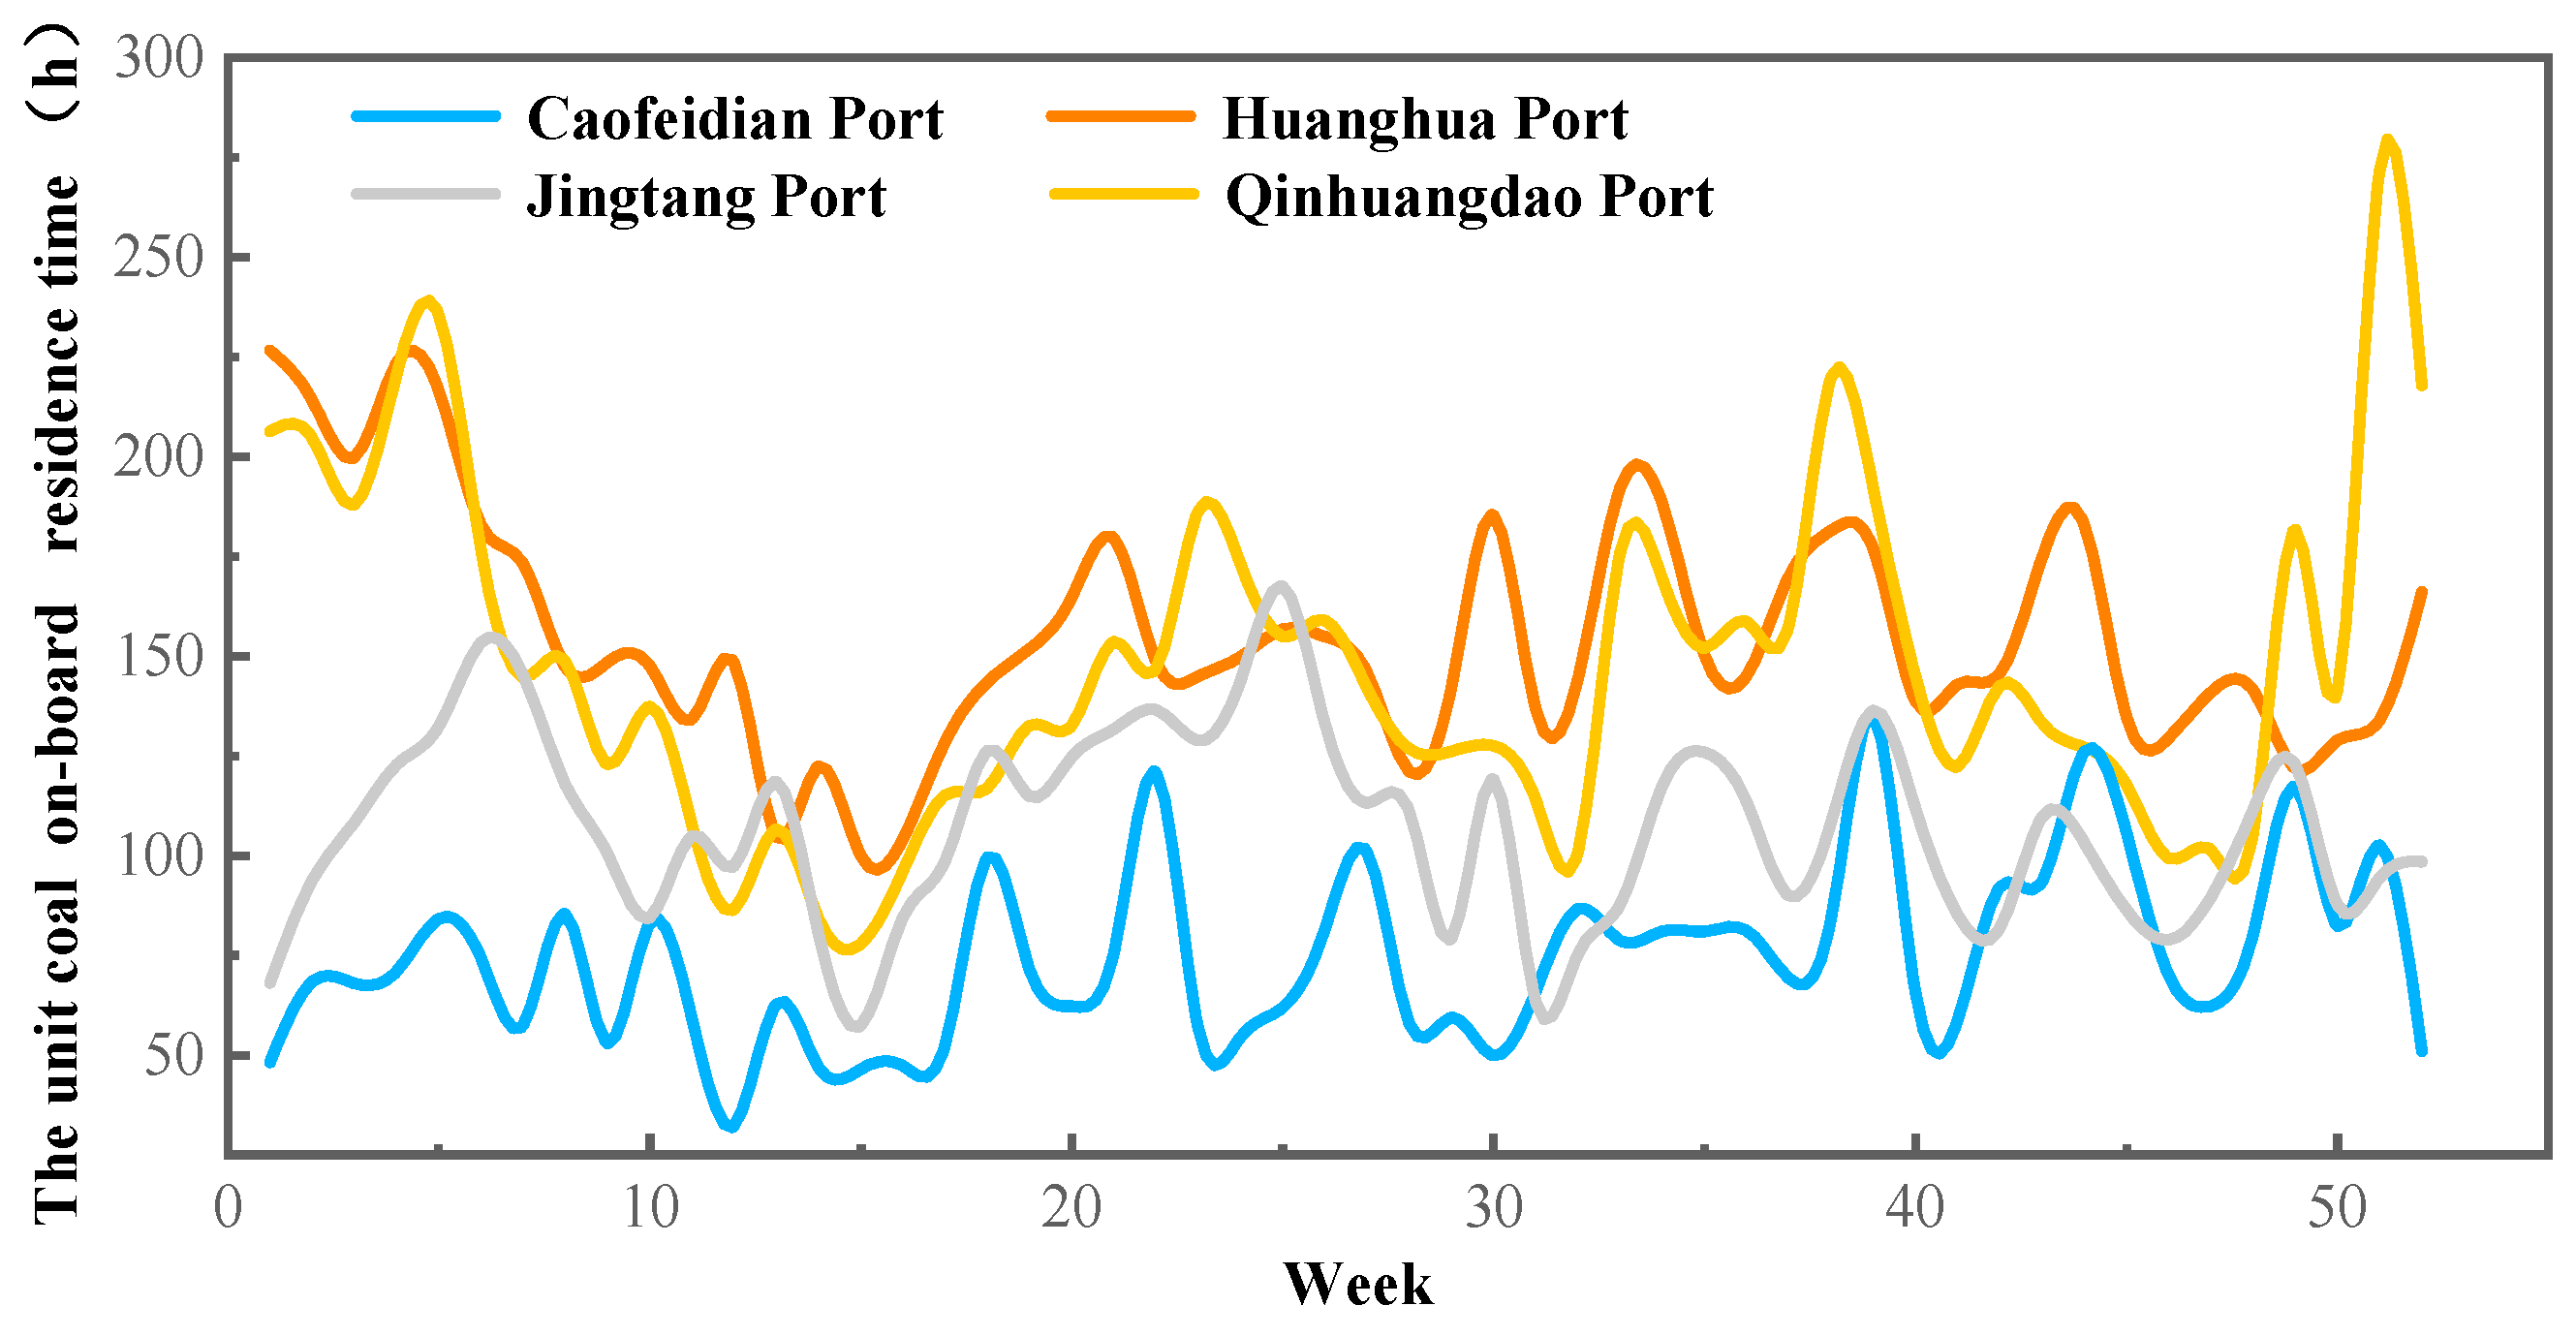
Appendix A provides the statistical indicators of the unit coal on-board residence time.
Figure 4 shows the historical weekly on-board residence time of coal vessels in the four ports in 2018. Different colors are used to represent different ports. The unit coal on-board residence time in port has a significant upward trend in the 5th, 22nd, 34th, and 50th weeks. The unit coal on-board residence time in ports is usually very unstable in January, July, August, and December. The annualized slot capacity is calculated based on the arriving coal vessels. The handling cost, annualized slot capacity for coal, and other operational data of each port in 2018 are shown in
Table 2.
Table 1.
Coal railway transportation distance of the coal transportation chain.
Table 1.
Coal railway transportation distance of the coal transportation chain.
| Distance (km) | Caofeidian Port | Huanghua Port | Jingtang Port | Qinhuangdao Port |
|---|
| BaoTou | 1494 | 1510 | 1391 | 1104 |
| Zhungeer | 1482 | 1568 | 1379 | 1092 |
| Yulin | 1323 | 1275 | 1220 | 1057 |
| Datong | 1052 | 1138 | 949 | 662 |
| Lvliang | 1215 | 947 | 1112 | 1121 |
There are two types of pollutants addressed in the environmental data collection. During transportation, major traffic-related pollution includes particulate matter (PM10, PM2.5), nitrogen oxides (NO
X), sulfur dioxide (SO
2), hydrocarbons (HC), carbon dioxide (CO
2), etc. Gerilla et al. [
60] (pp. 3167–3182) calculated the emissions rate for multiple pollutants. Here, the unit price of pollutant emissions was determined based on the domestic pricing level, as shown in
Table 3. The other type of pollutant is coal dust generated during coal storage and loading and unloading operations. This part of the calculation requires port wind speed, yard surface area, and other data.
Appendix B lists other relevant parameter values for the coal dust calculation, obtained based on the planning report of each port.
, , and reflect shippers’ behavioral preferences that are not fixed in practice. Multiple complex factors, such as government policy, customer behavior, and market trends, all impact shippers’ behavioral preferences. To obtain a better comparison, a sensitivity analysis of the weight coefficients is conducted.
4.2. Results Analysis
In this section, the results of the case study are presented, and comparisons of different aspects are conducted to show how the model can be used in practice.
4.2.1. Baseline Scenario
First, a horizontal comparison when shippers show no obvious preference is conducted. In this scenario, the weight coefficients of port operational adaptability and cost issues are both 0.5. This scenario serves as a baseline.
Table 4 presents the annual accessibility index of the PCTC. Huanghua Port and Qinhuangdao Port belong to the first echelon, and the PCTC accessibility index values for these two ports are relatively higher than those for Caofeidian Port and Jingtang Port. Jingtang Port is in the second echelon, and Caofeidian Port has the lowest PCTC accessibility index, placing it in the third echelon. The accessibility value of Huanghua Port is approximately 1.37 times that of Jingtang Port and approximately 2.34 times that of Caofeidian Port. In the first echelon, the annual accessibility index of the transportation chain from Yulin and Lvliang to Huanghua Port is greater than that of Qinhuangdao Port. The PCTC of Qinhuangdao Port performs better in Datong, Zhungeer, and Baotou.
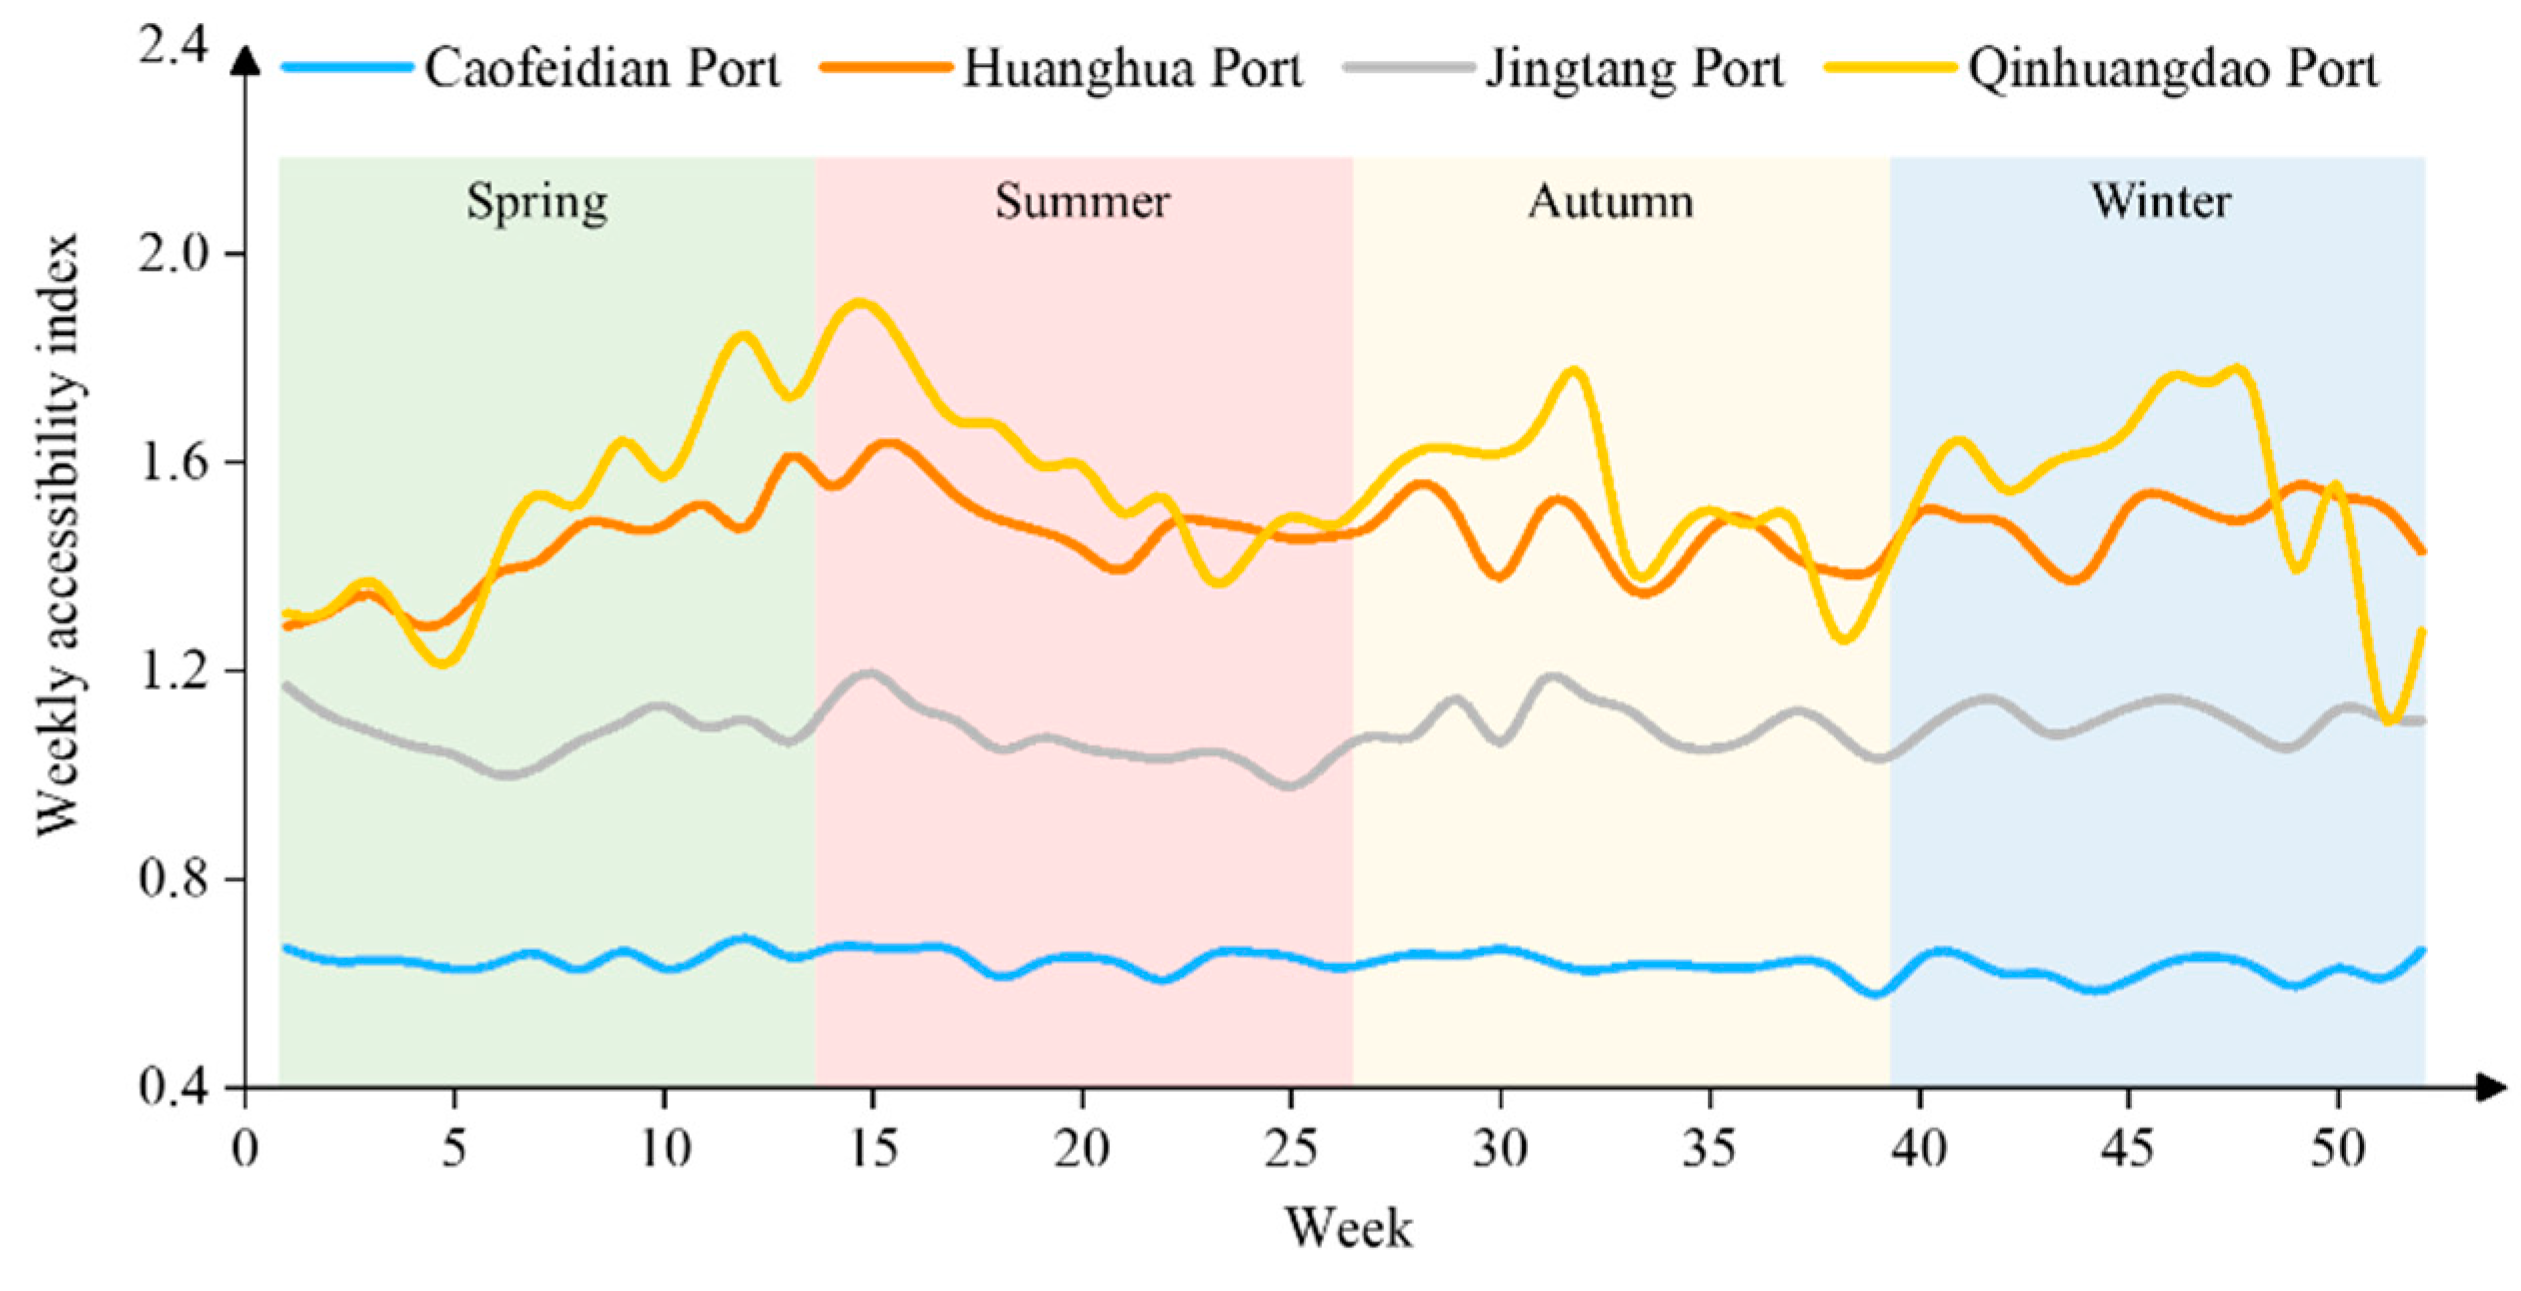
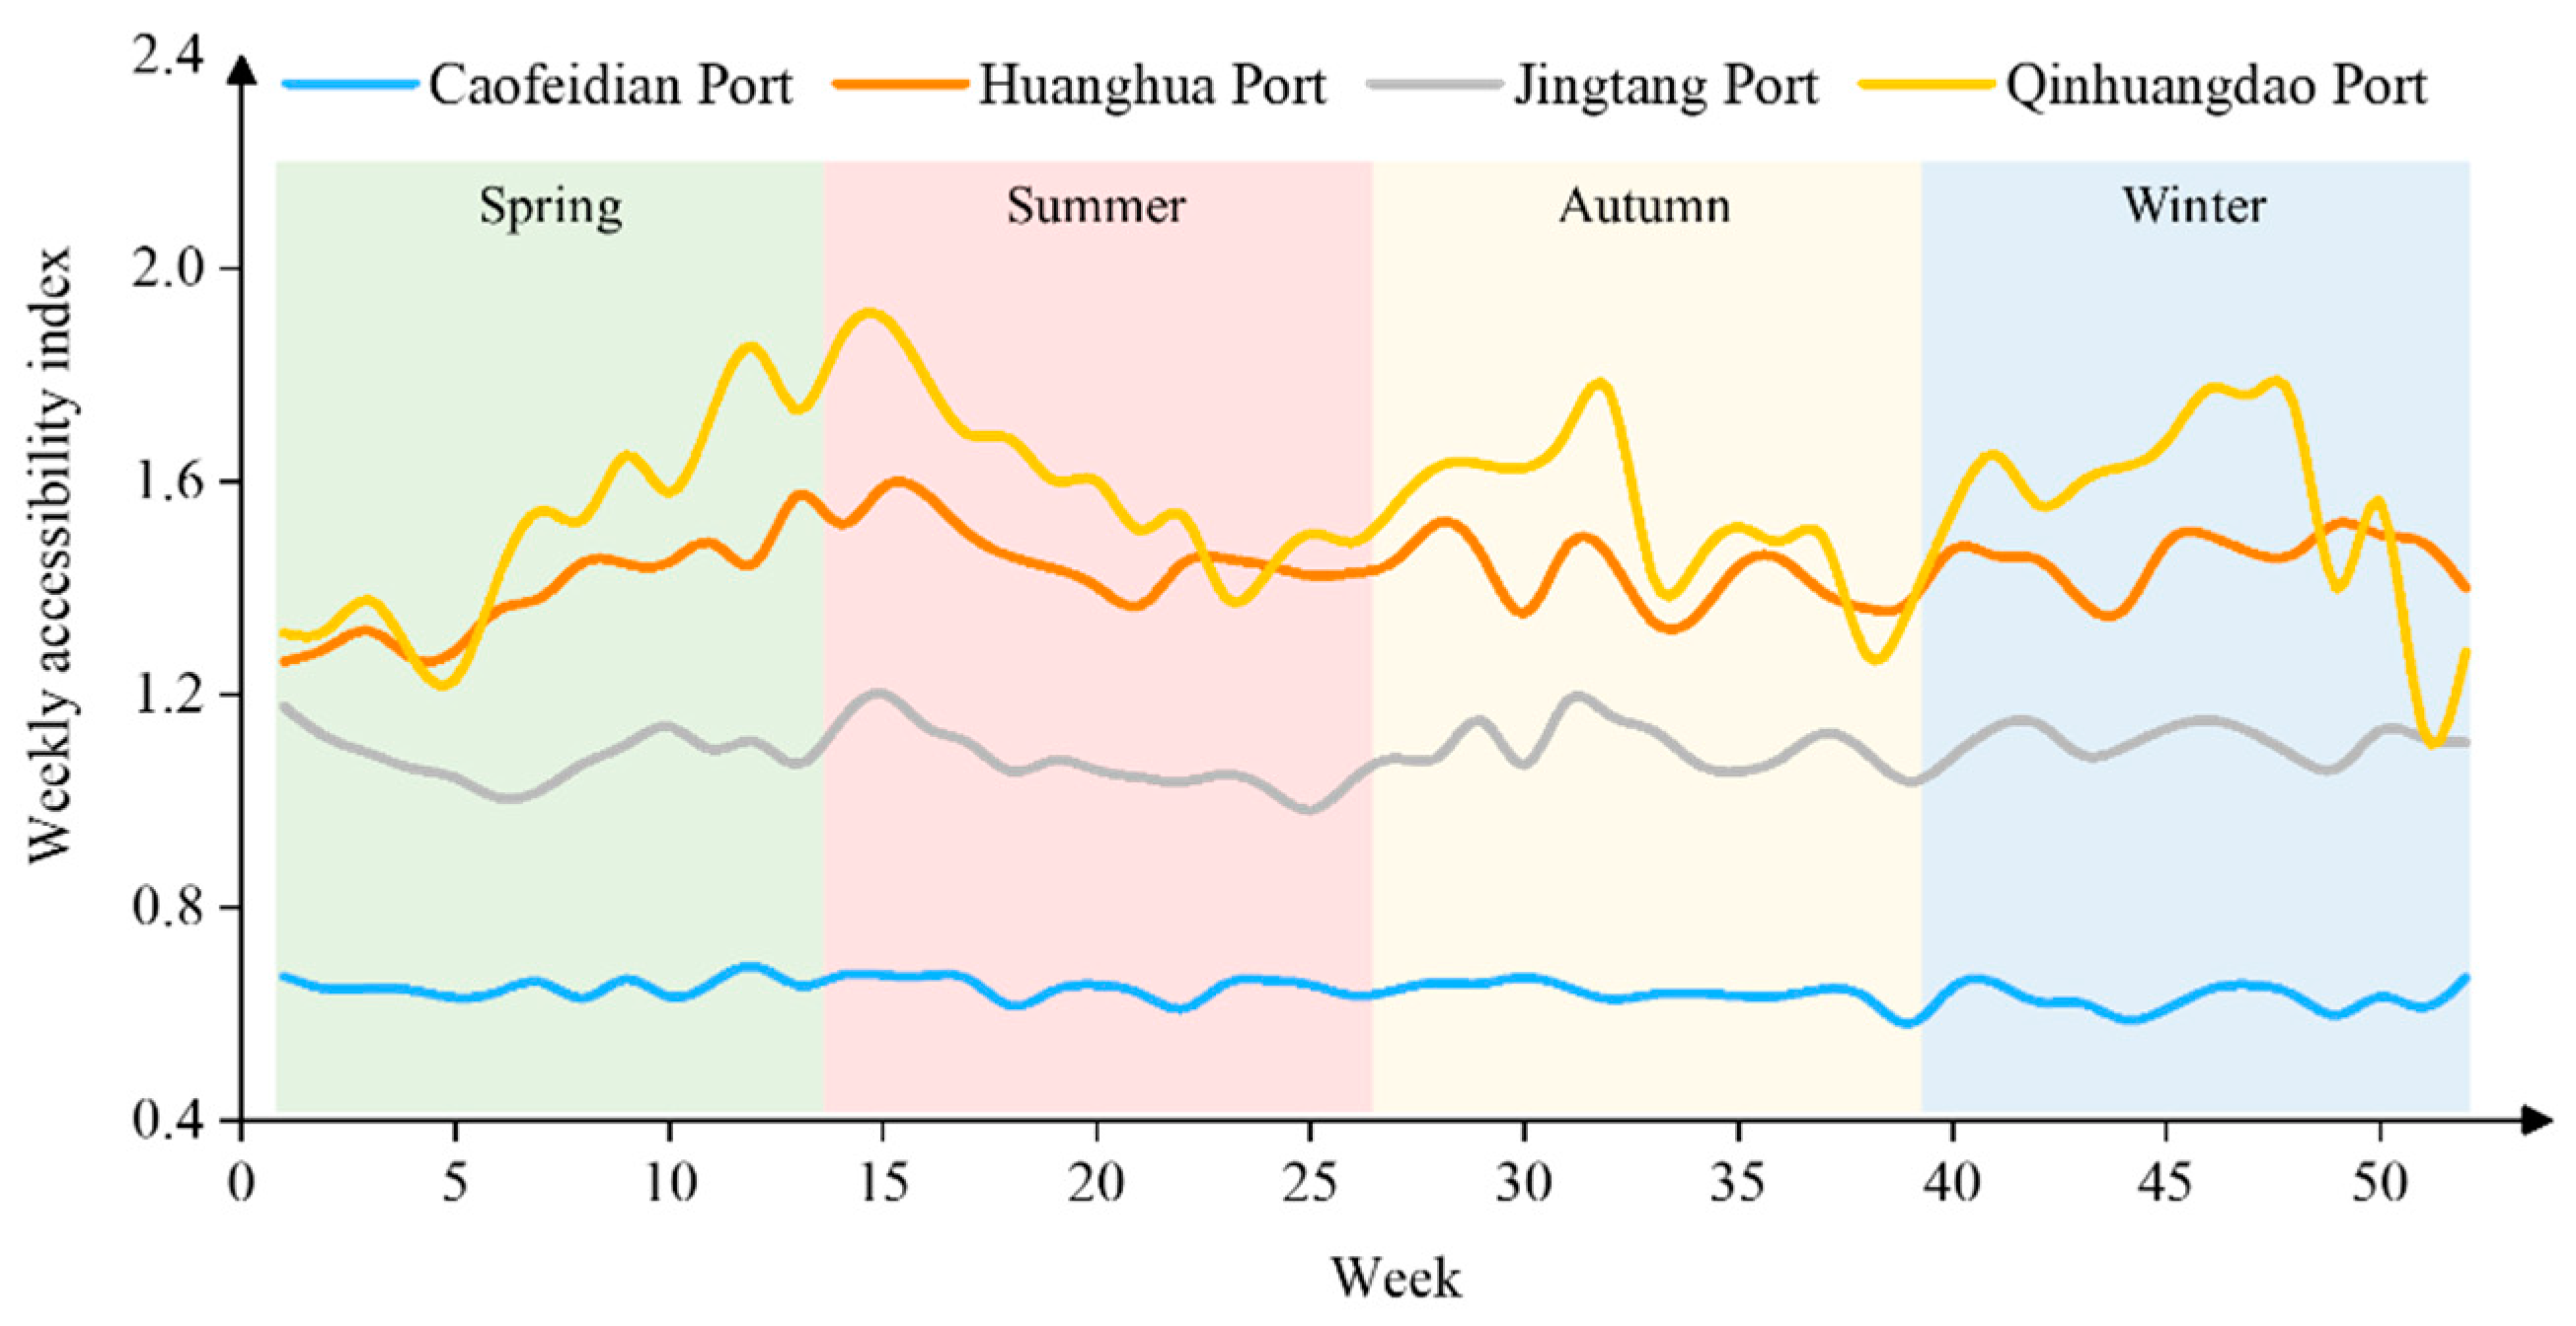
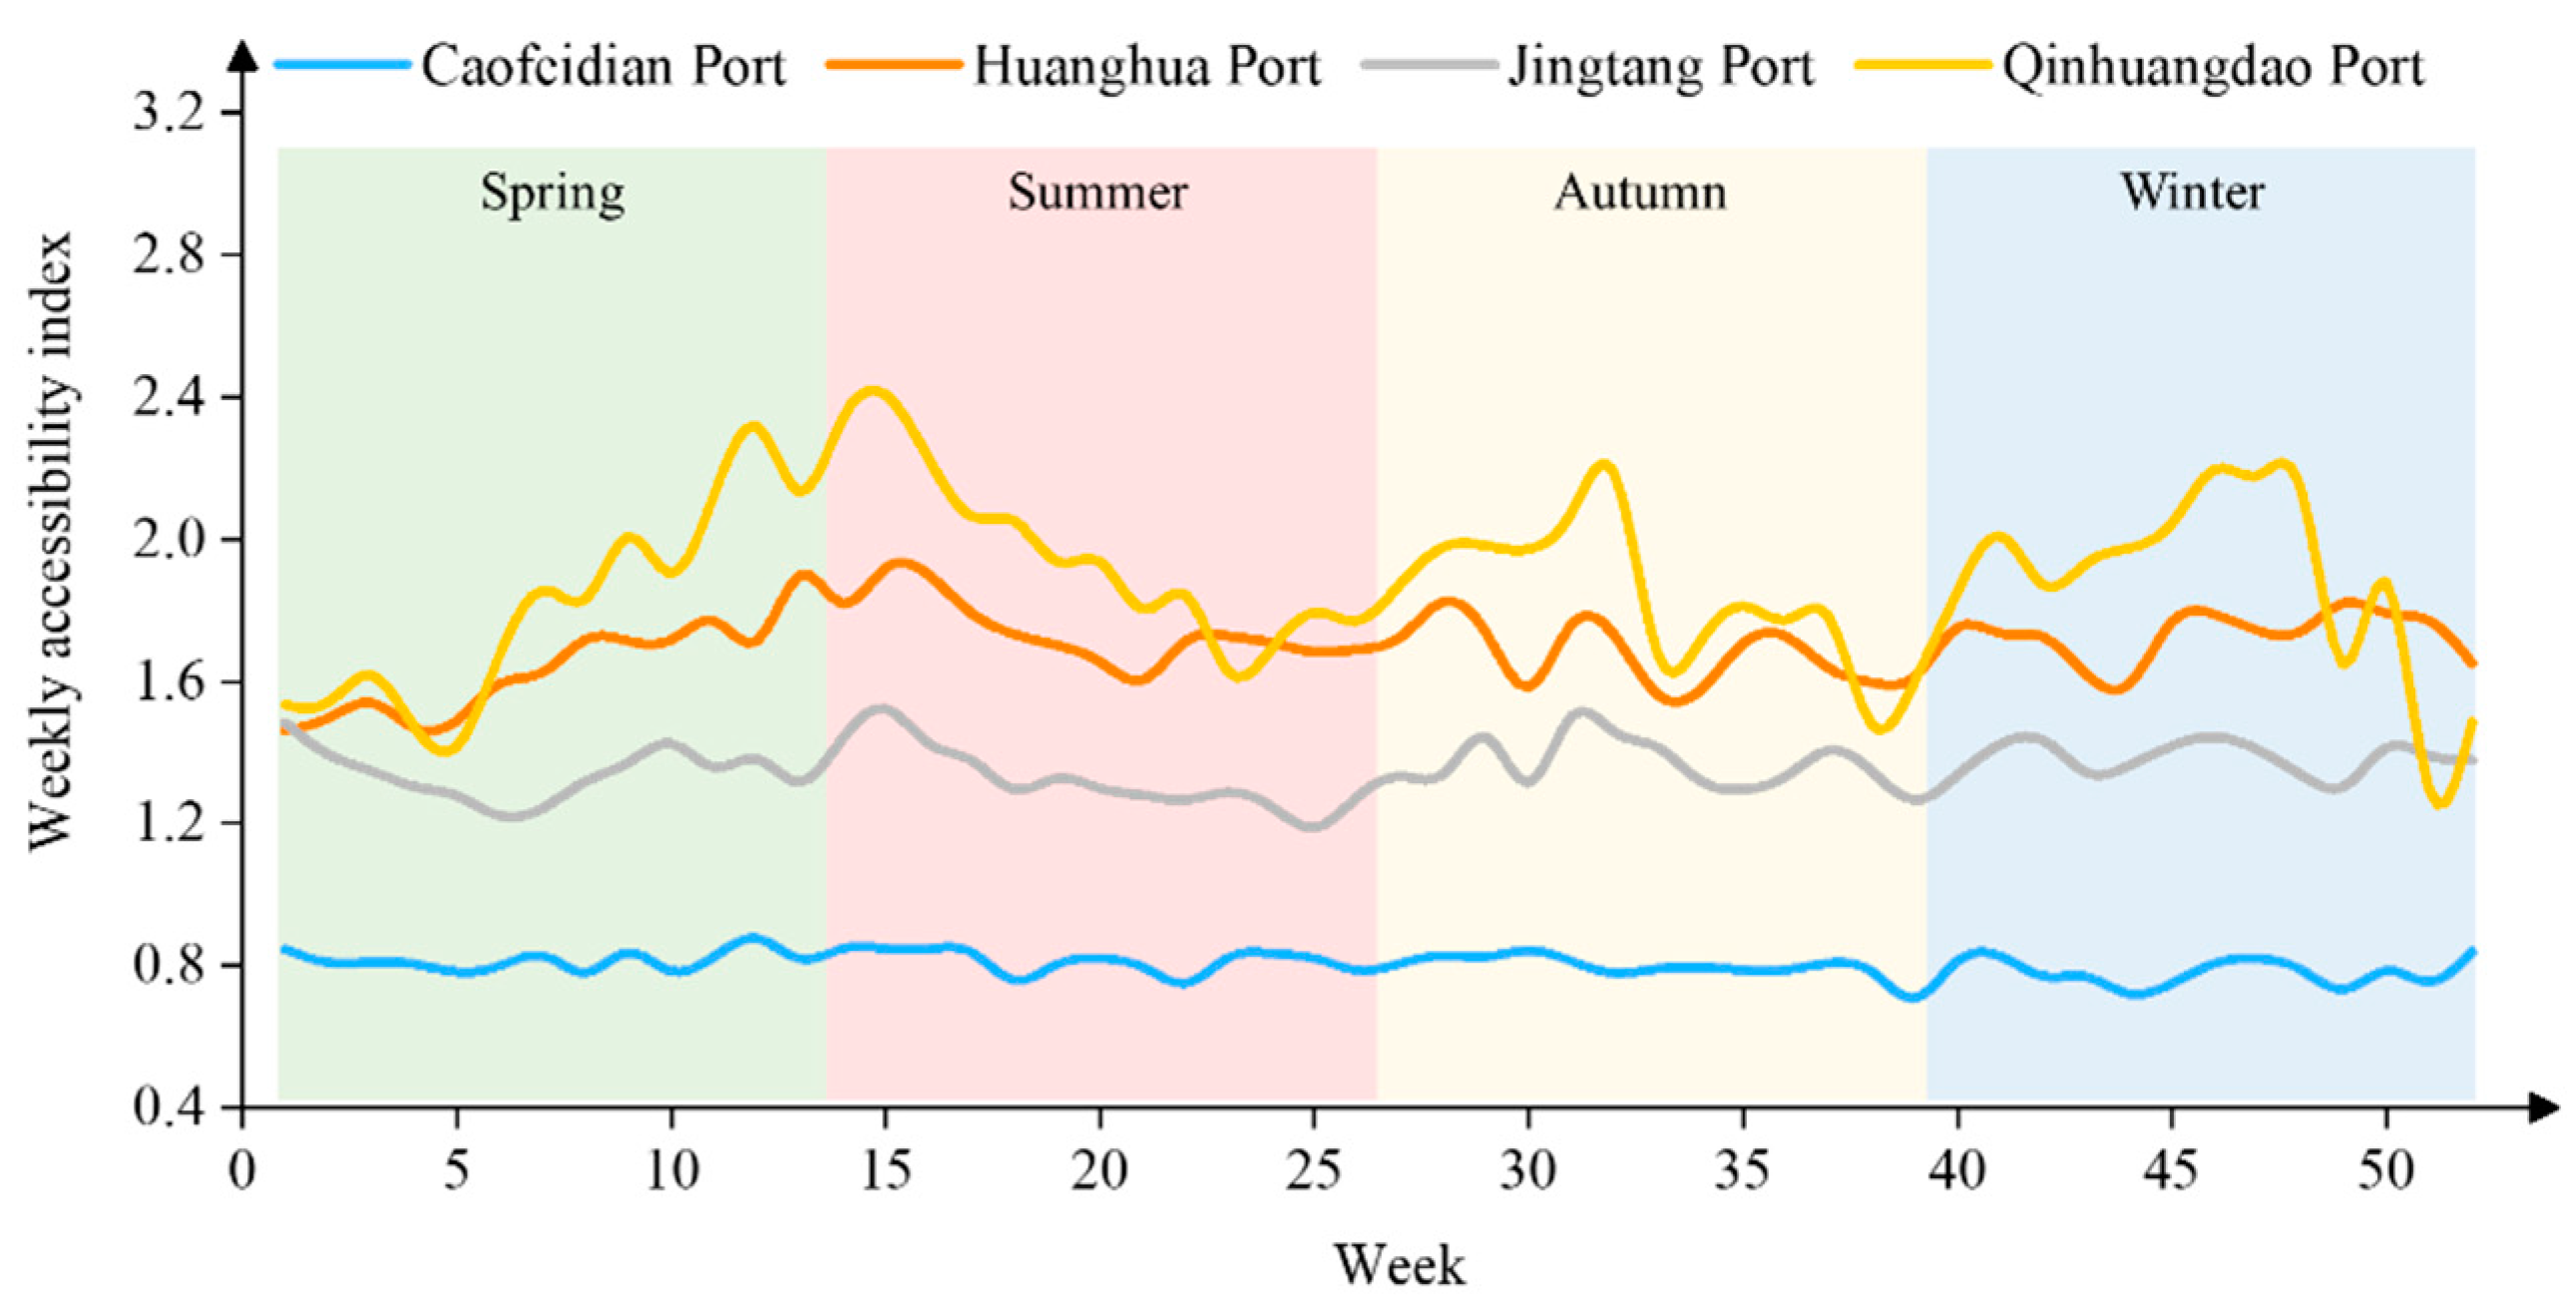
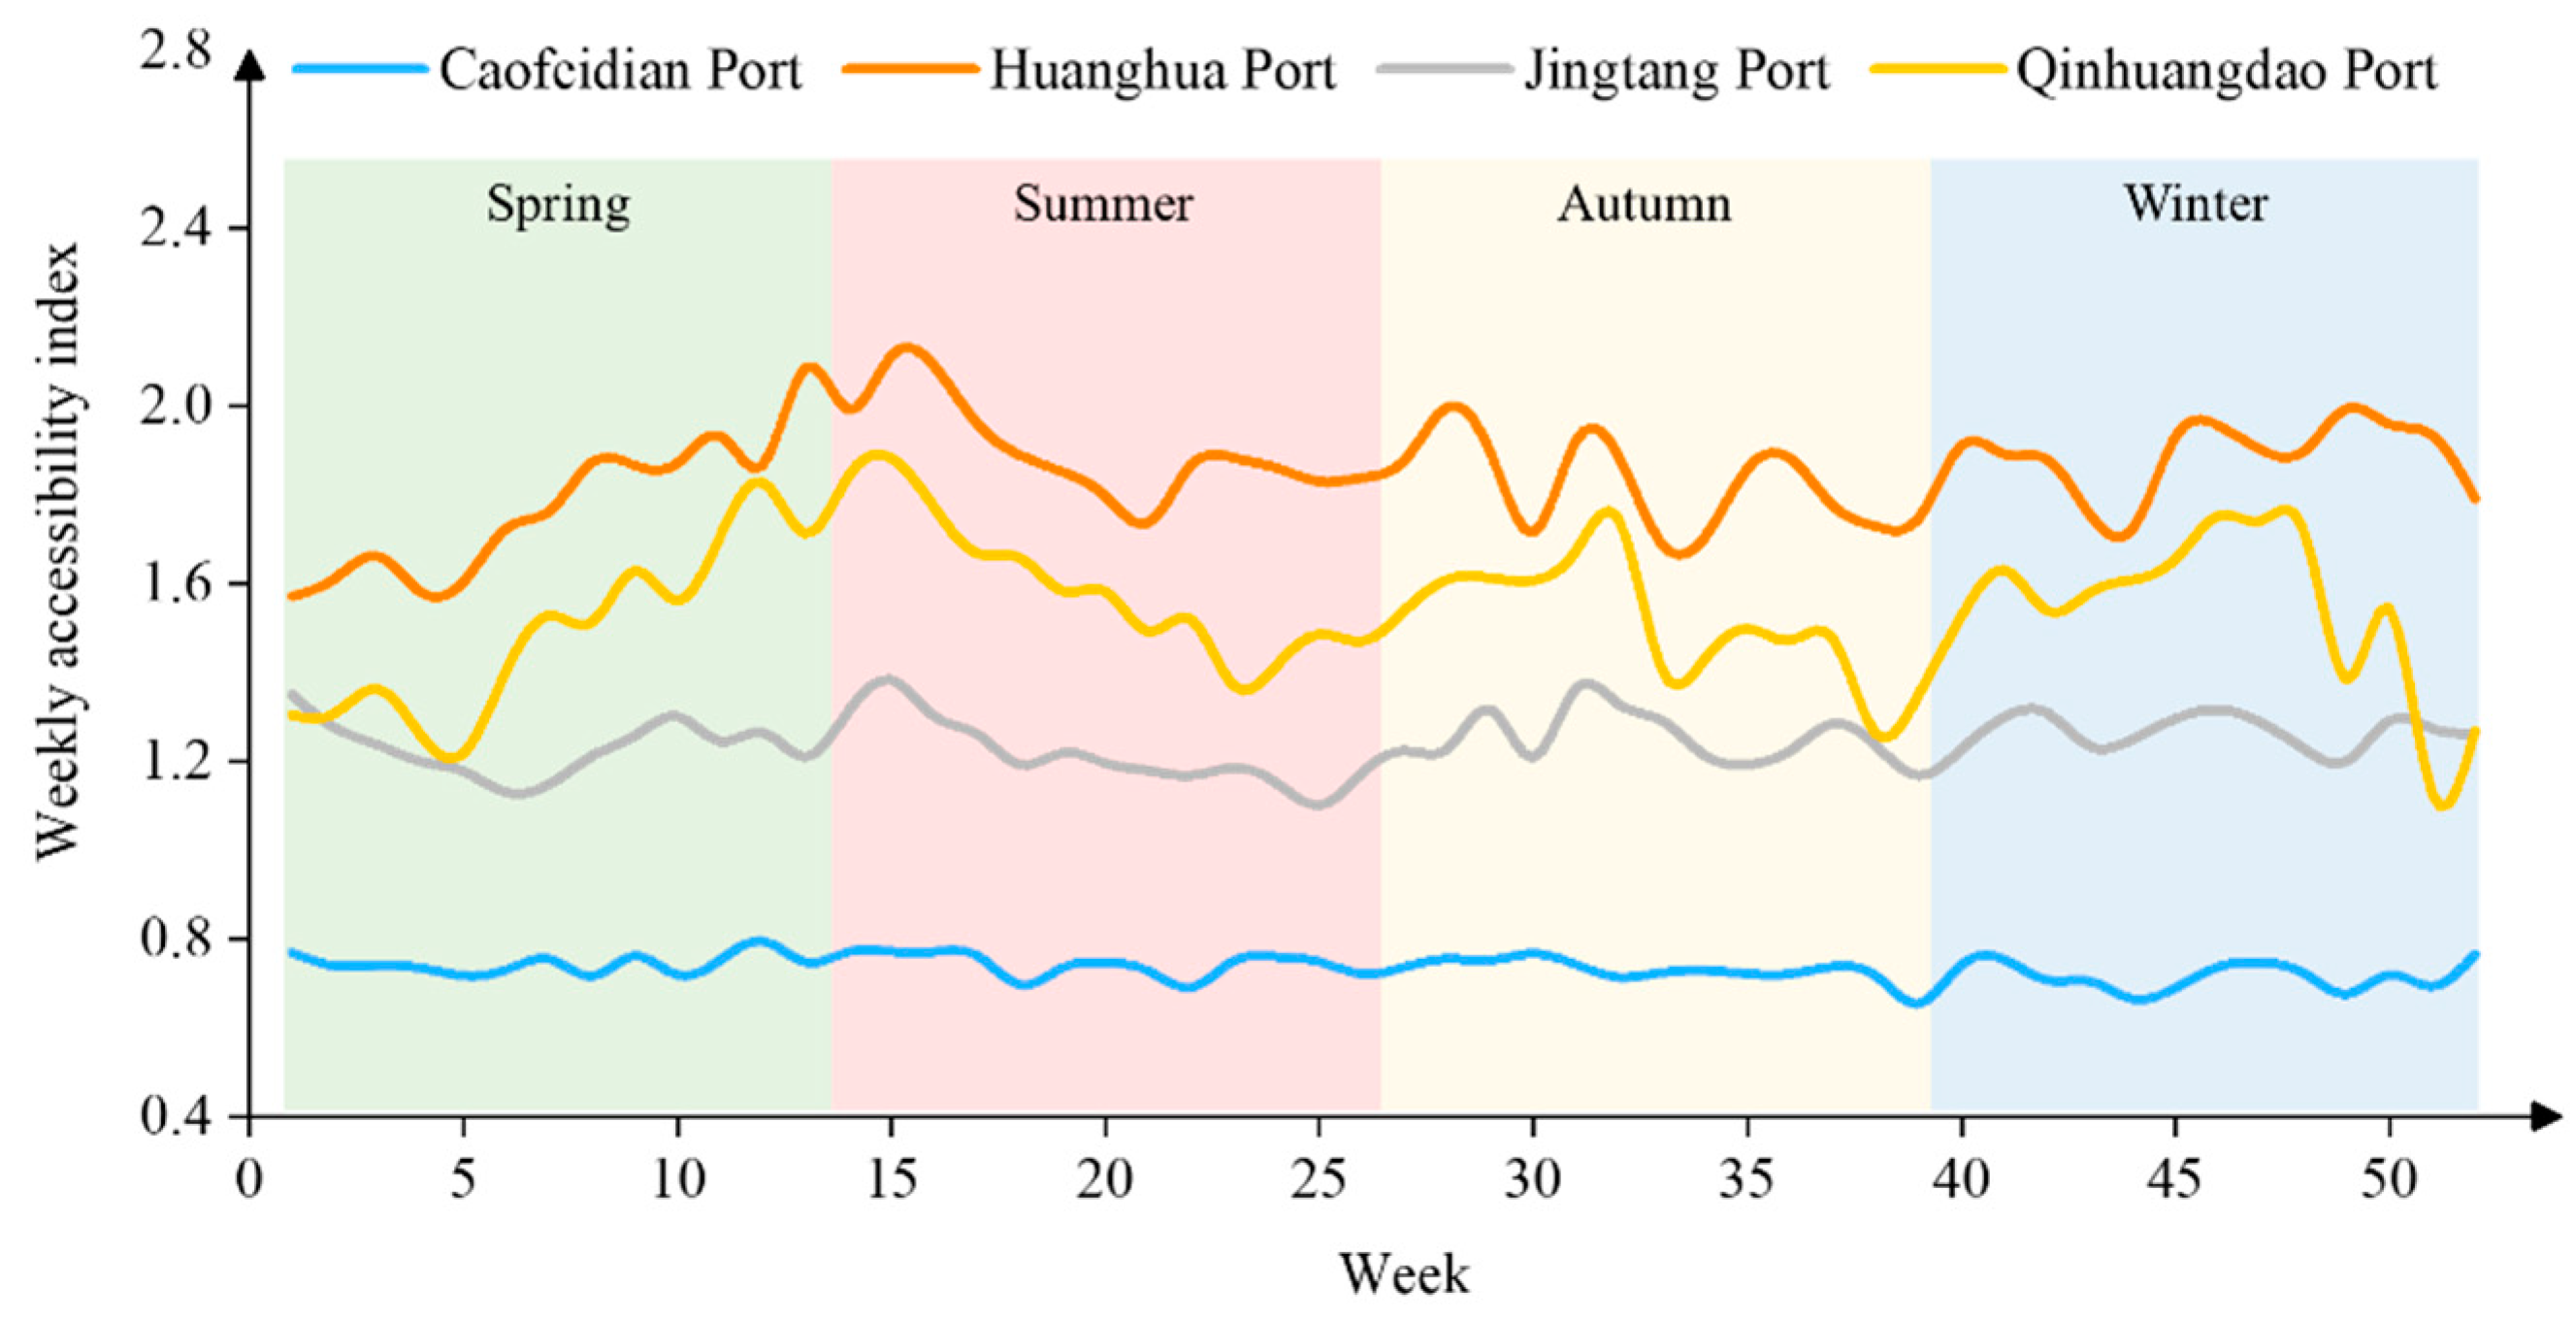
To better reflect the impact of seasonal fluctuations in coal freight on transportation chain accessibility, the weekly accessibility index is calculated. The weekly PCTC accessibility indices of the four ports for cargo from five representative cities are shown in
Figure 5,
Figure 6,
Figure 7,
Figure 8 and
Figure 9. The vertical axis represents the values of the weekly accessibility index for each port, and the horizontal axis represents the week of the year. A higher value indicates better accessibility. As shown in
Figure 5,
Figure 6,
Figure 7,
Figure 8 and
Figure 9, all five cities experience a similar accessibility index fluctuation trend. In the winter and summer, the weekly PCTC accessibility indices of these four ports fluctuate significantly, while the trend in the autumn is relatively flat. Considering Qinhuangdao Port as an example, in summer, the weekly PCTC accessibility index has an obvious downward trend, accompanied by a steep rise and fall. In
Figure 5, the maximum weekly accessibility index of Qinhuangdao Port in the winter is 1.766, which is 56.03% higher than the minimum value. The maximum value of the weekly accessibility index of Qinhuangdao Port in the autumn is only 38.3% higher than the minimum value.
To obtain more valuable information for port owners,
Figure 10 illustrates sub-indicators of accessibility: the annual mean value for the generalized travel cost, port operational adaptability, environmental pollution cost, and annualized slot capacity of each port. The value in
Figure 10 is the average value for the five supply regions. The annualized slot capacity for coal has a positive relationship with the accessibility index, while the other three have negative correlations with accessibility. It can be observed that the annualized slot capacity for coal at the ports in the first echelon (Qinhuangdao Port and Huanghua Port) is much higher than that for the other two ports. The annualized slot capacity for Huanghua Port coal is approximately 1.62 times and 2.85 times the annualized slot capacity for Jingtang Port and Caofeidian Port, respectively. The annualized slot capacity for coal at Caofeidian Port is the lowest among the four ports. The weakness in the shipping networks of Caofeidian Port and Jingtang Port decreases their accessibility value. The gaps in environmental pollution cost and generalized travel cost between each port are relatively small. Qinhuangdao Port and Jingtang Port have superiority over hinterland transportation costs. Regarding port operational adaptability, the port operation adaptability of Caofeidian Port and Jingtang Port is better than that of Huanghua Port and Qinhuangdao Port.
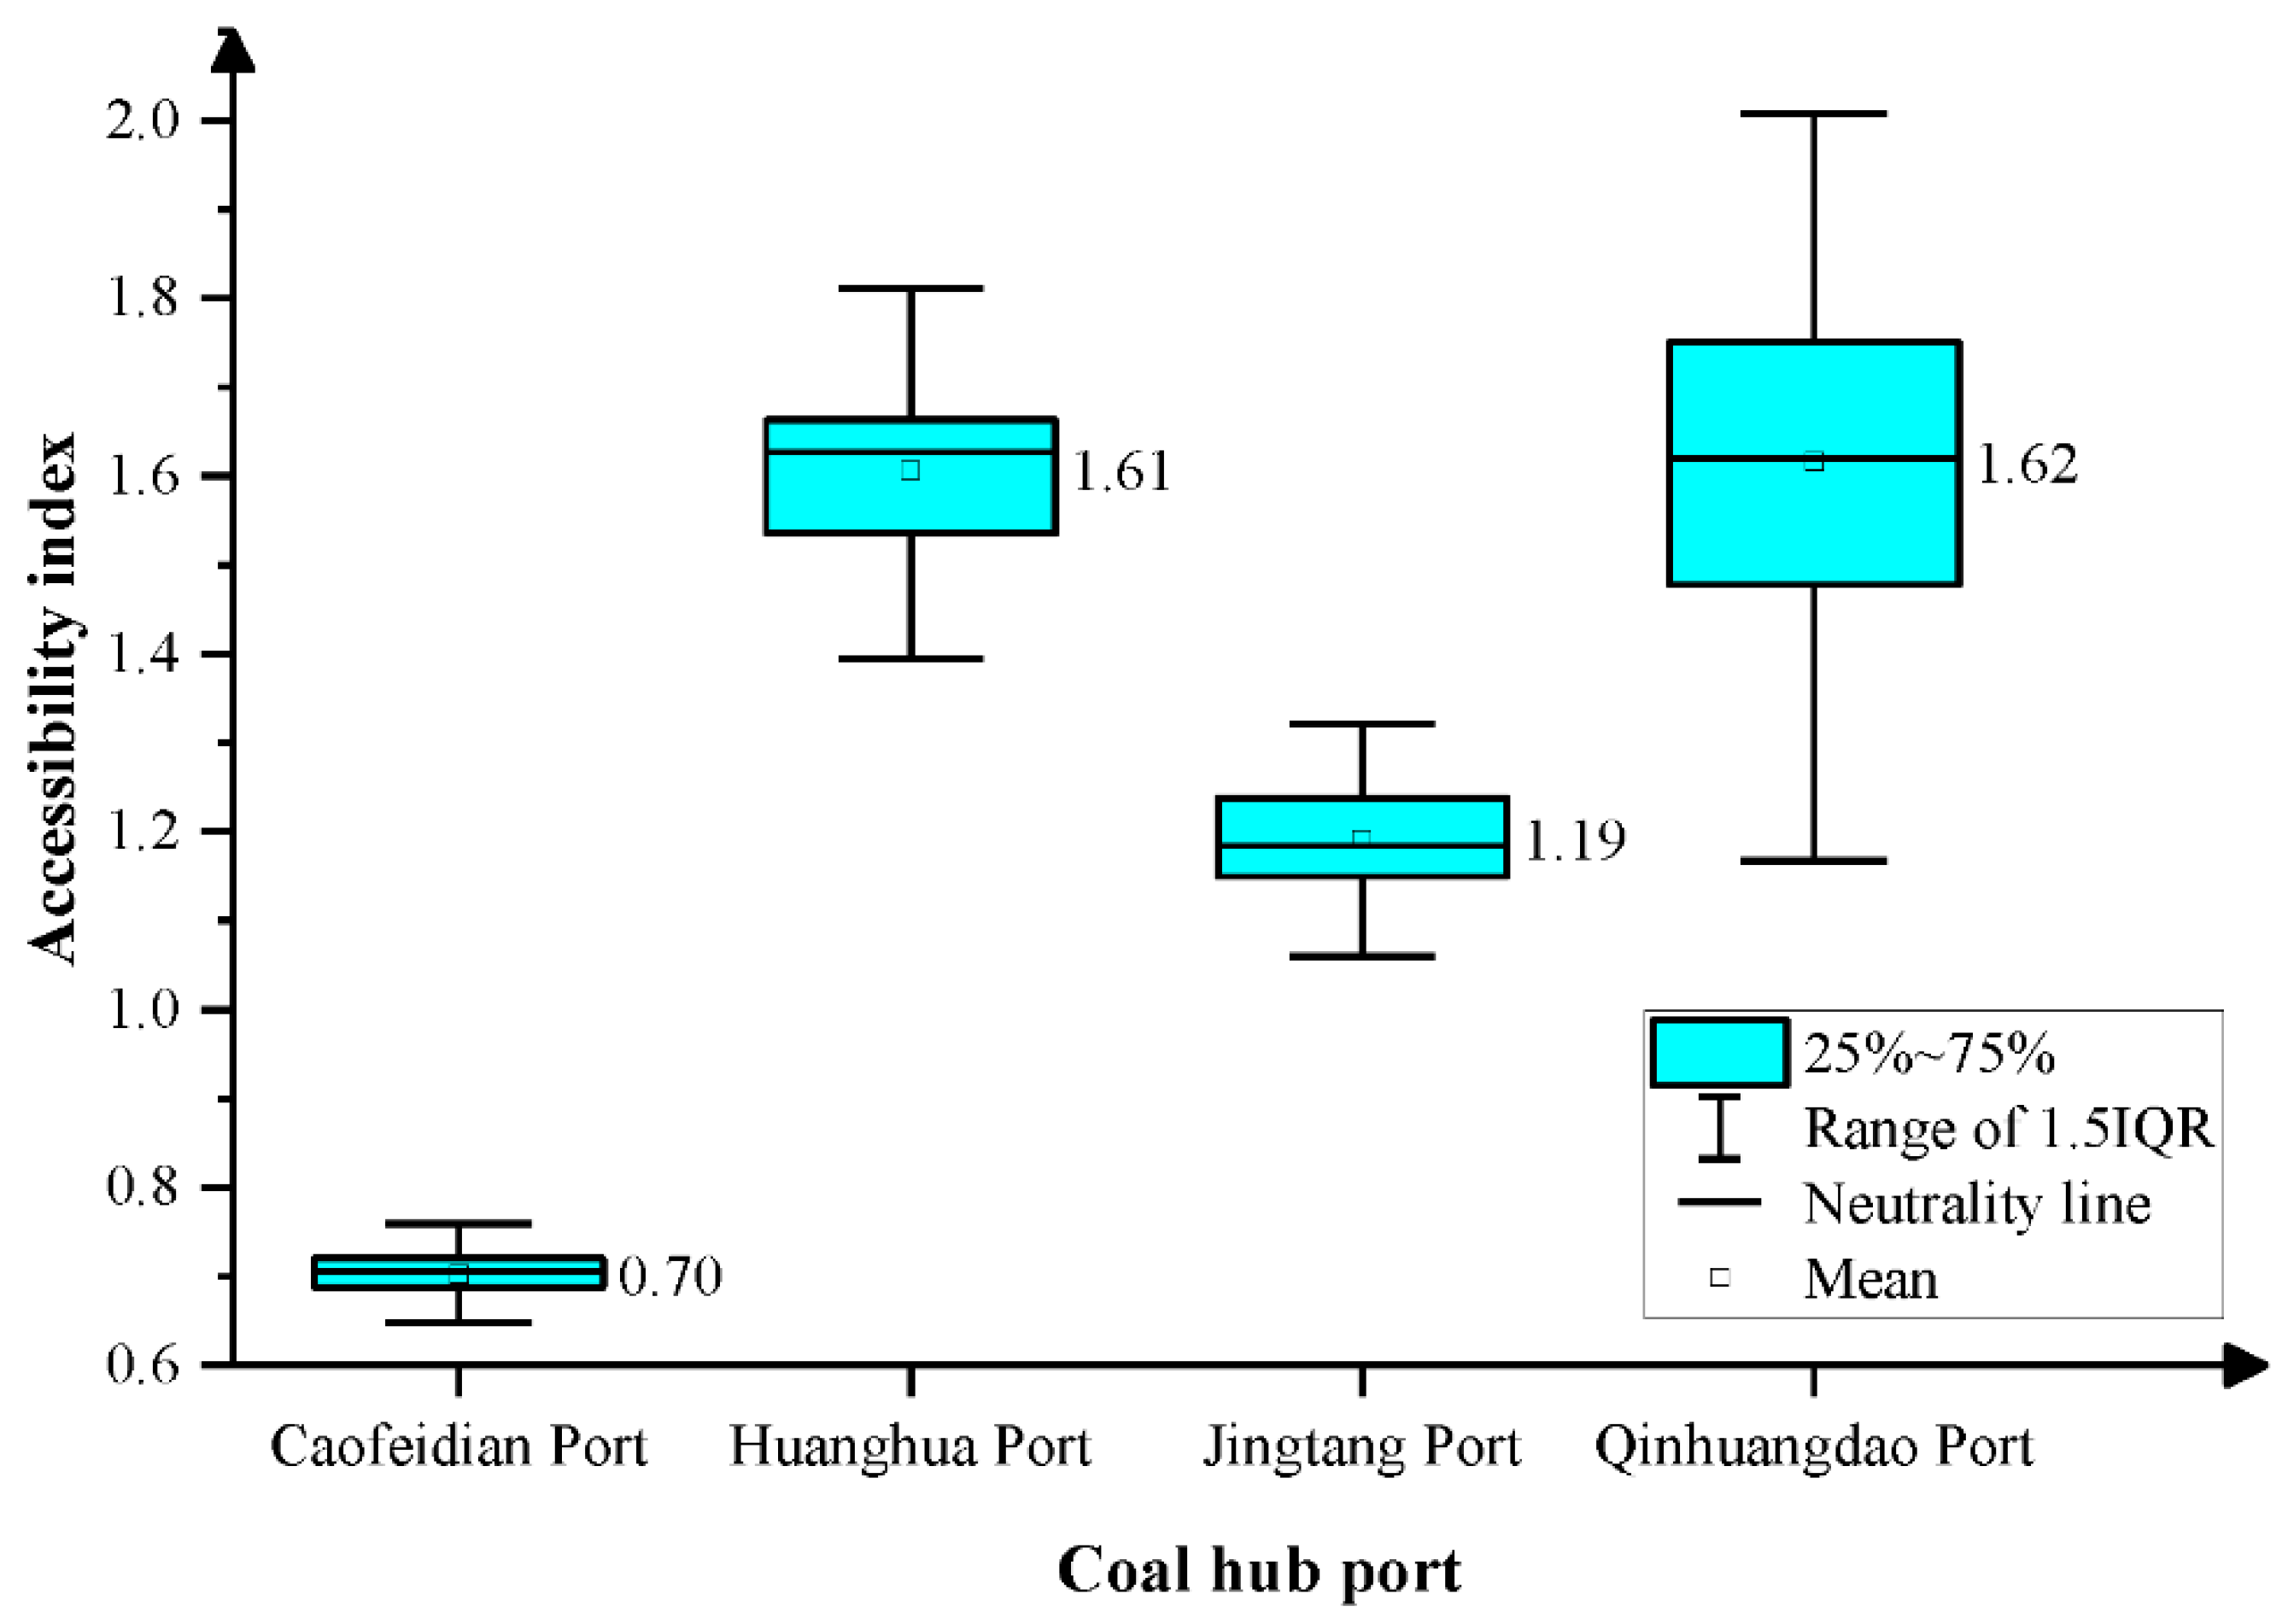
To further investigate the operational adaptability, which indicates the stability of performance,
Figure 11 presents the box plot of the weekly PCTC accessibility index. The quartile sizes of the box can provide us with information about whether the distribution of the data batch is centralized or decentralized. The larger the interquartile gap, the more discrete the data distribution. The PCTC accessibility indices of Caofeidian Port and Jingtang Port are relatively concentrated compared with those of the other two ports in the first echelon, indicating that Caofeidian Port and Jingtang Port can adapt well to cargo volume fluctuations. The higher degree of dispersion for the PCTC accessibility indices of Qinhuangdao Port and Huanghua Port indicates that the performance of these two ports undergoes severe seasonal fluctuations. In the peak season, Qinhuangdao Port and Huanghua Port could experience a sharp increase in on-board residence time.
4.2.2. Sensitivity Analyses of Different Preferences
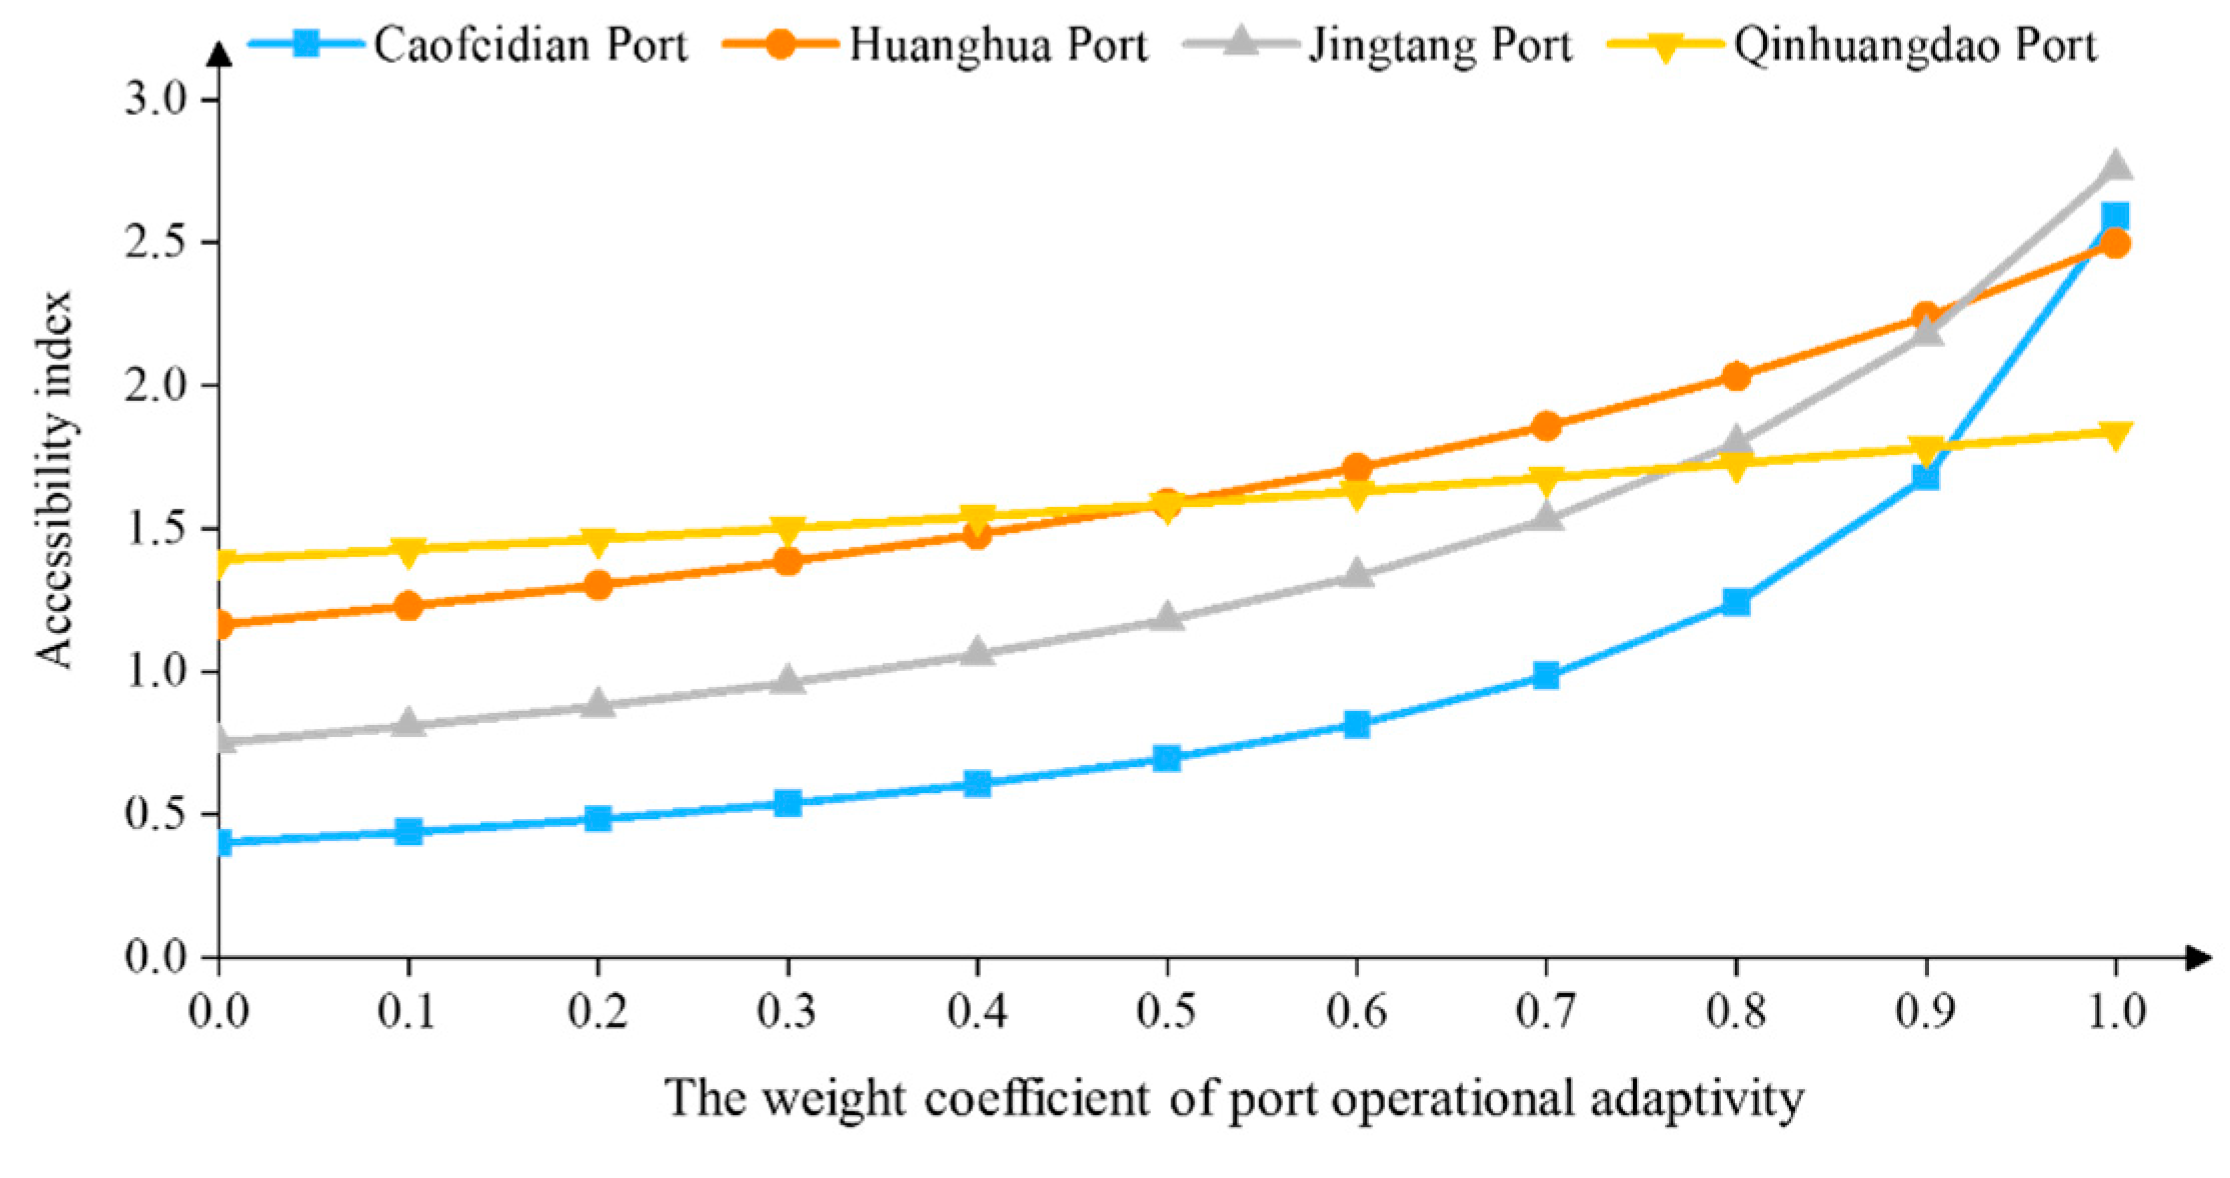
Different stakeholders could have different preferences for costs and port operational adaptivity. When choosing a long-term cooperative partner, shippers might prefer a PCTC with better operational adaptivity. For short-term or occasional trade, PCTCs with lower costs could have higher priorities. In this subsection, a sensitivity analysis of port operational adaptivity preference is conducted by changing the weight coefficient of the port operational adaptivity. The results are shown in
Figure 12. When the weight coefficient of the port operational adaptivity is 0, shippers ignore the port operation performance in the coal transportation process. When the coefficient increases to 0.9, it indicates that shippers attach great importance to the port’s operation ability. There is an obvious increase in the accessibility index of Caofeidian Port with the increase in the port operational adaptivity weight coefficient. When the weight coefficient of the port operational adaptivity increases from 0 to 1, the smallest increase in annual accessibility is observed in Qinhuangdao Port. Qinhuangdao Port only increases by 32.1%. That is, when shippers want to choose a long-term partner and are more concerned about the port’s operational adaptivity, Jingtang Port and Caofeidian Port will show advantages in the competition. In terms of growth rate, Caofeidian Port has the highest rate among these four ports.
4.3. Summary and Implications
In this section, we present how to implement our evaluation system in practice. The analysis results show that the proposed method can directly determine the performance of different PCTCs. By comparing the subindex among different PCTCs, the competitive advantage and weaknesses can easily be identified. In addition, our newly introduced port operational adaptability indicator intuitively communicates the port’s ability to handle fluctuating coal transportation volumes, which is a crucial ability for shippers to choose long-term partners.
The considerable real-world significance of the model is based on two aspects. First, the input data used in the model are easily accessible, which is a crucial foundation for a practical and easy-to-use evaluation system. Second, both shippers and port operators can extract valuable information from the model. The four conclusions can be summarized as follows.
- (1)
Based on the annual mean value of the accessibility index, the ports are divided into three echelons. Huanghua Port and Qinhuangdao Port are in the first echelon. The annual accessibility index of Huanghua Port is approximately 2.28 times that of Caofeidian Port.
- (2)
Qinhuangdao Port and Huanghua Port, which are in the first echelon, have obvious advantages in their annualized slot capacities for coal compared with Jingtang Port and Caofeidian Port. The annual slot capacity is nearly the same for Qinhuangdao Port and Huanghua Port. The annual slot capacity of Qinhuangdao Port is approximately 1.62 times and 2.85 times that of Jingtang Port and Caofeidian Port, respectively. Caofeidian Port and Jingtang Port should open more shipping lines to transport coal.
- (3)
The accessibility index has significant seasonal fluctuations for all four ports. From the box plot, the Caofeidian Port accessibility index distribution is the most concentrated. The operational adaptability of Caofeidian Port is the best among the four ports. From the perspective of transportation stability, it would be most suitable for shippers to choose Caofeidian Port.
- (4)
An increase in the weight coefficient for port operational adaptability leads to a change in the annual mean accessibility of the PCTC. Caofeidian Port has the highest growth rate in the accessibility index, while Qinhuangdao Port has the lowest rate of increase.
Based on the conclusions, several recommendations can be made. From the perspective of shippers, a PCTC with better operational adaptability should be the main priority of long-term cooperative choices. For small enterprises, it would be better to choose PCTCs flexibly according to the accessibility index of the corresponding period. For a port authority, after comparing the sub-indicator metric with other ports, investment decisions should be made according to the weakness. For example, if Caofeidian Port and Jingtang Port want to improve their competitiveness, they must strengthen their maritime transportation capacity.
5. Conclusions and Discussion
A stable and efficient coal transportation chain is an important part of energy security. Aiming to provide a practical evaluation tool for port-centric coal transportation chains, this paper established an accessibility evaluation system for a PCTC based on the gravity model. The foreland capacity is used as the attraction measure, while the hinterland transportation cost and port operational adaptivity work are used as the impedance indicators. Based on real data, a case study is conducted to show how the model can be used in practice.
Compared with previous studies, the model developed in this paper captures the specific features of the coal industry. Considering the significant fluctuations in coal transportation volume, we introduce operational adaptability to measure the port’s performance. Not only economic issues but also environmental factors are included in the evaluation system. This comprehensive evaluation system provides us with a complete picture of the coal transportation chain.
By analyzing the annual mean value and the fluctuation of the PCTC accessibility index, stakeholders can identify the appropriate port with a high accessibility index and further make a reasonable decision about route choice. Through the horizontal comparison of each port, the port’s strengths and weaknesses can be determined by comparing the sub-indicators in the accessibility model. The index enables ports to enhance their competitiveness with targeted solutions. In addition, this paper conducts a sensitivity analysis of PCTC accessibility under different environmental preferences of shippers. By observing the changes in accessibility, ports that have advantages in the process of greening coal transportation can be identified.
There are still limitations that could be addressed by future work. This study did not consider the impact of information connectivity between upstream and downstream enterprises on accessibility. Information sharing among enterprises could improve the performance of transportation and reduce costs and transportation time. Second, this paper does not study how policies change preferences, which is quite a complex issue that might require long-term follow-up studies.


