Article

Resilience Analysis of Container Port Shipping Network Structure: The Case of China

1
College of Earth and Environmental Sciences, Lanzhou University, Lanzhou 730000, China
2
Key Laboratory of Western China’s Environmental Systems, Ministry of Education of the People’s Republic of China, Lanzhou University, Lanzhou 730000, China
3
College of Urban and Environmental Sciences, Peking University, Beijing 100871, China
*
Author to whom correspondence should be addressed.
Sustainability 2022, 14(15), 9489; https://doi.org/10.3390/su14159489
Submission received: 23 June 2022 / Revised: 28 July 2022 / Accepted: 29 July 2022 / Published: 2 August 2022
(This article belongs to the Collection Sustainable Maritime Policy and Management)

Abstract

:
The increased port outages caused by events such as war and public health emergencies have motivated the study of container port shipping network (CPSN) resilience. This paper proposes a resilience framework, which includes prevention, resistance, restoration, adaption, and optimization. The framework is used to analyze the resilience of the CPSN by detecting changing performance of the network indicators before and after the random attack or one of the deliberate attacks. The indicators include the network resilience index, degree distribution, independent path, cluster coefficient, network efficiency and connectivity. The comparative analysis is based on the statistics of China’s cases in 2005 and 2017. The results indicate that, first, the resilience of the structure of China’s container port shipping network (CCPSN) in 2017 has improved when comparing the 2015 situation. Second, the performance of indicators under betweenness attack (BA) decreases faster than other attacks; the resilience index of deliberate attacks is poorer, when compared with the random attack (RA). Third, network resilience can be improved by protecting and adding hub port nodes. Priority should be given to restoring the hub port nodes during the recovery process. The same network indicator recovers similarly after facing different attacks, while different indicator shows various recovery process. Thus, it is necessary to consider the different recovery performances of network indicators when the damaged CPSN selects recovery mode.

1. Introduction

Although the routes and nodes of maritime transport are more flexible than terrestrial transport, they could still be affected by political (trade regulations, embargoes, and war), geographic (climatic conditions and tidal ranges), and technical factors (port accessibility and costs). The impacts might increase the risks of interrupting the shipping lines and ports. However, most maritime transport planning focuses on preparing for frequent and observable disruptions and less on unpredictable events that have not yet occurred. For example, an explosion occurred in Tianjin port on 12 August 2015, which caused severe damage to the port [1]. The local authorities in Tianjin immediately announced restrictions on ships carrying commodities in and out of that port [2]. As one of the largest ports in the world, Tianjin Port is the main gateway for goods from North China to the world. This emergency had a negative impact on domestic and international supply chains. The iron ore trade was suspended, due to regulations of transporting dangerous commodities in the port; as a consequence, the economy was hit. Such emergencies disrupted the regular trade of the ports worldwide, seriously affecting the logistics economy and the supply chain operation [2].
Unpredictable disruption events are beyond the normal scope of planning and analysis, which are unpredictable in space and time and unknown, or even random, in nature [3]. Although people have realized that the integration of the supply chain is crucial for globalization, it could still be disrupted by the events such as pandemics [4] or cyber failure. The supply chain partners, including ports, will operate the reactions to eliminate the adverse effects of the above events. For instance, the loss of shipping routes may lead to a decrease in port revenue and market share, thus increasing the competition among ports. Especially in port transshipment operations, the competing ports can serve to transfer more cargo, since the exchange location is replaceable [5]. Therefore, the disruptions affect the long-term competitive position of affected ports, potentially preventing them from regaining their pre-disaster market share, even after capacity is wholly restored [5]. If disruptions occur frequently, the reliability and reputation of the port will be affected, regardless of whether it is directly delayed due to an event, such as pandemics, at a particular port or not. Many shipping companies are directly or indirectly responsible for delays and losses when choosing routes. To avoid delays caused by port disruption, material manufacturers and suppliers that rely on maritime transportation to deliver or receive goods might request that the shippers consider multiple alternative routes [6]. Therefore, ports need to make preventive investments to reduce vulnerability and maintain and increase their market share.
Hence, governments have taken various actions to mitigate the consequences of emergencies and achieve rapid recovery. Recognizing the importance of maintaining the regular operation of critical infrastructure, the US Presidential Policy Directive 21 [7] formally called for strengthening the function and resilience of the nation’s critical infrastructure, including transportation systems. The UK government launched a strategy in 2014 to improve traffic resilience in planning, performance, and response [8]. The Chinese government issued the Outline of the National Comprehensive Three-dimensional Transport Network Plan in 2021, which took the resilience of the transport network as one of the leading indicators [9]. The current traffic planning practice situations have shown that resilience research needs to be integrated into the planning procedures, in order to cope with uncertain events and emerging risks.
With the progress and development of port transport equipment, the port’s position in the shipping network reflects the importance and function of the port [10]. Some studies prove that theory of a complex network is an appropriate method to analyze the complexity of shipping network [10,11]. The methods of the complex network could be used to analyze the statistical characteristics of the shipping network, model the evolution of network statistical properties, and reflect network’s formation mechanism and internal mechanism [11,12,13]. Based on this theory, Guo and He [13] analyzed the characteristics of the CCPSN within the coastal region, and they found that the network has changed from a local to a unified two-layer hub-spoke network. The differences among China’s regions were analyzed, and the authors concluded that the vertex strength of the connections among the four regional ports had increased in China [14].
The maritime transport is easily affected by natural disasters and human factors, such as war [15], economic crisis [16], natural disaster [17], and political change [18]. The literature usually adopts an agent-centered approach to simulate the consequences of the above shocks. It might not easily compare, due to the lack of complex and deep knowledge of how actors (e.g., port authorities, shippers, etc.) make decisions [19] in different historical and geographical contexts. On the other hand, the relational approach, or network, has proved to be a possible way to elucidate the comparability of shocks [20].
Meanwhile, applying complex network methods promotes understanding the network dynamics [21,22] from different perspectives. Some scientists evaluate the ability of shipping network under specific disasters. For instance, Shen et al. [23] investigated the vulnerability of ocean networks in the northwest Pacific and northern Indian Oceans to tropical cyclone impacts and attempted to identify the most vulnerable parts of port systems in the network. Fang et al. [24] studied the influence of international events, such as military conflicts, lifting of economic sanctions, and government elections, on the dynamics of global ocean networks. Verschuur et al. [25] analyzed the impact of 141 port disruptions caused by natural disasters on port and logistics across 74 ports, the results showed a median disruption duration of 6 days, with the 95th percentile of 22.2 days. Other researchers deploy simulation models to investigate how unpredictable shocks threaten the network. Wang et al. [26] compare China and the United States and analyze the evolutionary pattern of the container shipping network of both countries under random or deliberate attacks, respectively. They also conduct the vulnerability assessment. Reggiani et al. [27] suggested using connectivity as a unified framework to consider the resilience and vulnerability of transport networks. He et al. [28] analyzed the vulnerability of China’s coastal container port shipping network from the perspective of disruption simulation.
As shown above, existing studies of the dealing risks ability of CPSN involve various concepts, such as robustness, vulnerability, reliability, and resilience [26,27,28]. The definitions of “reliability”, “vulnerability”, “robustness”, and “resilience” are highly correlated, but there are still differences among them. Hence, related research should distinguish between the differences among these concepts. “Reliability” is the ability of a system and its components to perform required functions within the specified conditions and periods [29]. “Vulnerability” is defined as the sensitivity to disturbance. For example, the vulnerability of a traffic network measures the degree of impact on network connectivity if the network is attacked or partially fails [12]. “Robustness” is the ability of a network to maintain its topological and functional state when a certain level of disruptions on stations coincides [30]. Scientists interpret “resilience” from different perspectives. The concept of resilience is firstly used in an ecological research framework [31]. After that, the resilience is applied to different disciplines, such as environmental management, engineering, transportation network, architecture [32,33,34], and other fields [35,36]. Holling [31] defines resilience as a systems’ persistence and ability to absorb changes and disturbances. Many researchers adopt a similar definition and focus on the ability of the system to resist and absorb the potential damage caused by destructive events [37,38], but with a lack of consideration regarding the ability to recover. Some researchers argue that resilience only refers to recovering, without considering the resistance and absorptive capacity. Iervolino and Giorgio [39] regarded seismic resilience as one of the system’s characteristics, which measures the system’s capability to recover from a shock rapidly. In contrast, some researchers took a holistic view of resilience, combining various notions, such as resistance, absorption, and restoration. For example, Haime [40] defined resilience as the ability of a system to withstand and recover from significant disruptions, within acceptable degradation parameters and an acceptable amount of time, at a reasonable cost. The National Infrastructure Advisory Committee (NIAC) defines infrastructure systems’ resilience as predicting, absorbing, adapting, and quickly recovering from destructive events, such as natural disasters.
Vulnerability mainly refers to the degree to which the system is affected by disruptive events, and it more refers to the degree of damage to the system. The robustness and reliability of a system refer to the system’s resistance to maintaining operation after encountering disruptive events from the network and engineering field perspectives, respectively. The system’s resilience, from a holistic view, is quite different from the former, which emphasizing the acceptance of external challenges, preparations to absorb changes, and development of new strategies to adapt to system changes. In this sense, the system should continuously improve its learning ability (learning from experience), self-organization ability (self-recovery), and transformation ability (creating a new system) [41].
The above literature review shows that there are still many gaps in the current research on CPSN. Despite increasing research on shocks by focusing on the robustness, vulnerability, and reliability, as well as others, of CPSN [12,42], compared with other transportation networks, the resilience of shipping networks receives little attention [43]. Meanwhile, the above literature review shows that the definitions of resilience are different in many pieces of the literature. The resilience of the shipping network, from the holistic perspective, still needs more investigation. The impacts of specific disasters on the network have been analyzed in some studies [25,44], but they lack comprehensive research regarding the shipping network resilience when the network faces different emergencies and disasters. Network connectivity or efficiency has been applied in some studies [27,45,46] to measure the specific performance of the network to cope with risk. However, quantitative analysis of one year, based on a single indicator (network connectivity or network efficiency), cannot wholly explain the dynamic performances of network resilience. In the research of Verschuur et al. [25], all analyzed events show that multiple ports are affected simultaneously, thus challenging some studies that only focus on the disruption of a single port. Therefore, it is necessary to discuss the impact of continuous disruptions of multiple ports on the CPSN.
Therefore, this paper tries to answer the following questions regarding the above gaps. (1) How can we analyze the resilience of CPSN’s structure comprehensively? (2) How can we simulate the changing of the resilience of network structure under disruptive events? (3) What are the differences in network performance reflected by different indicators under the scenario simulation? To answer the above questions, this paper proposes the following solutions, correspondingly, (1) a resilience framework from a holistic view is proposed; (2) the occurrence of disruptive events and subsequent recovery of nodes are simulated by attacking and adding port nodes (including the shipping routes of a port node), respectively, and four ways are selected to simulate the process of attack and recover in this paper; (3) the changes of the resilience of network structure are compared and analyzed by using the different network indicators, such as degree distribution, independent path, cluster coefficients, and connectivity.
Additionally, the reason for choosing China’s cases is that the percentage of domestic trade among China’s ports is expected to enlarge under the government’s strategies of ‘dual circulation’, which emphasizes the role of the domestic economic cycle. There are three reasons for choosing 2005 and 2017 as the year of research: (1) the earliest available data of China’s container shipping routes is 2005; (2) COVID-19 has started affecting CCPSN since 2019; (3) the growth rate of China’s container throughput in 2017 is significantly higher in recent ten years. Given the above situations, the data in 2005 and 2017 were selected to analyze the dynamic evolution of CCPSN’s resilience.
The contribution of this research is to provide a framework for analyzing the resilience of shipping network when facing different emergencies and disasters. Meanwhile, this paper selects China’s case, in order to empirically analyze network resilience’s dynamic performances. In addition, the comparative analysis of multiple indicators under scenario simulation also provides a new idea for the quantitative study of resilience. This contribution could improve the research of shipping network structure resilience and fill the gaps in China’ case. The results could provide guidance to improve the effective connectivity among ports and enhance the security and sustainability of the shipping network. The rest of the paper is organized as follows. Section 2 includes the framework of CPSN. Section 3 presents our data and methodology. Section 4 provides the analysis results of the resilience of CCPSN in 2005 and 2017. The discussion and conclusions are delivered in Section 5 and Section 6, respectively.

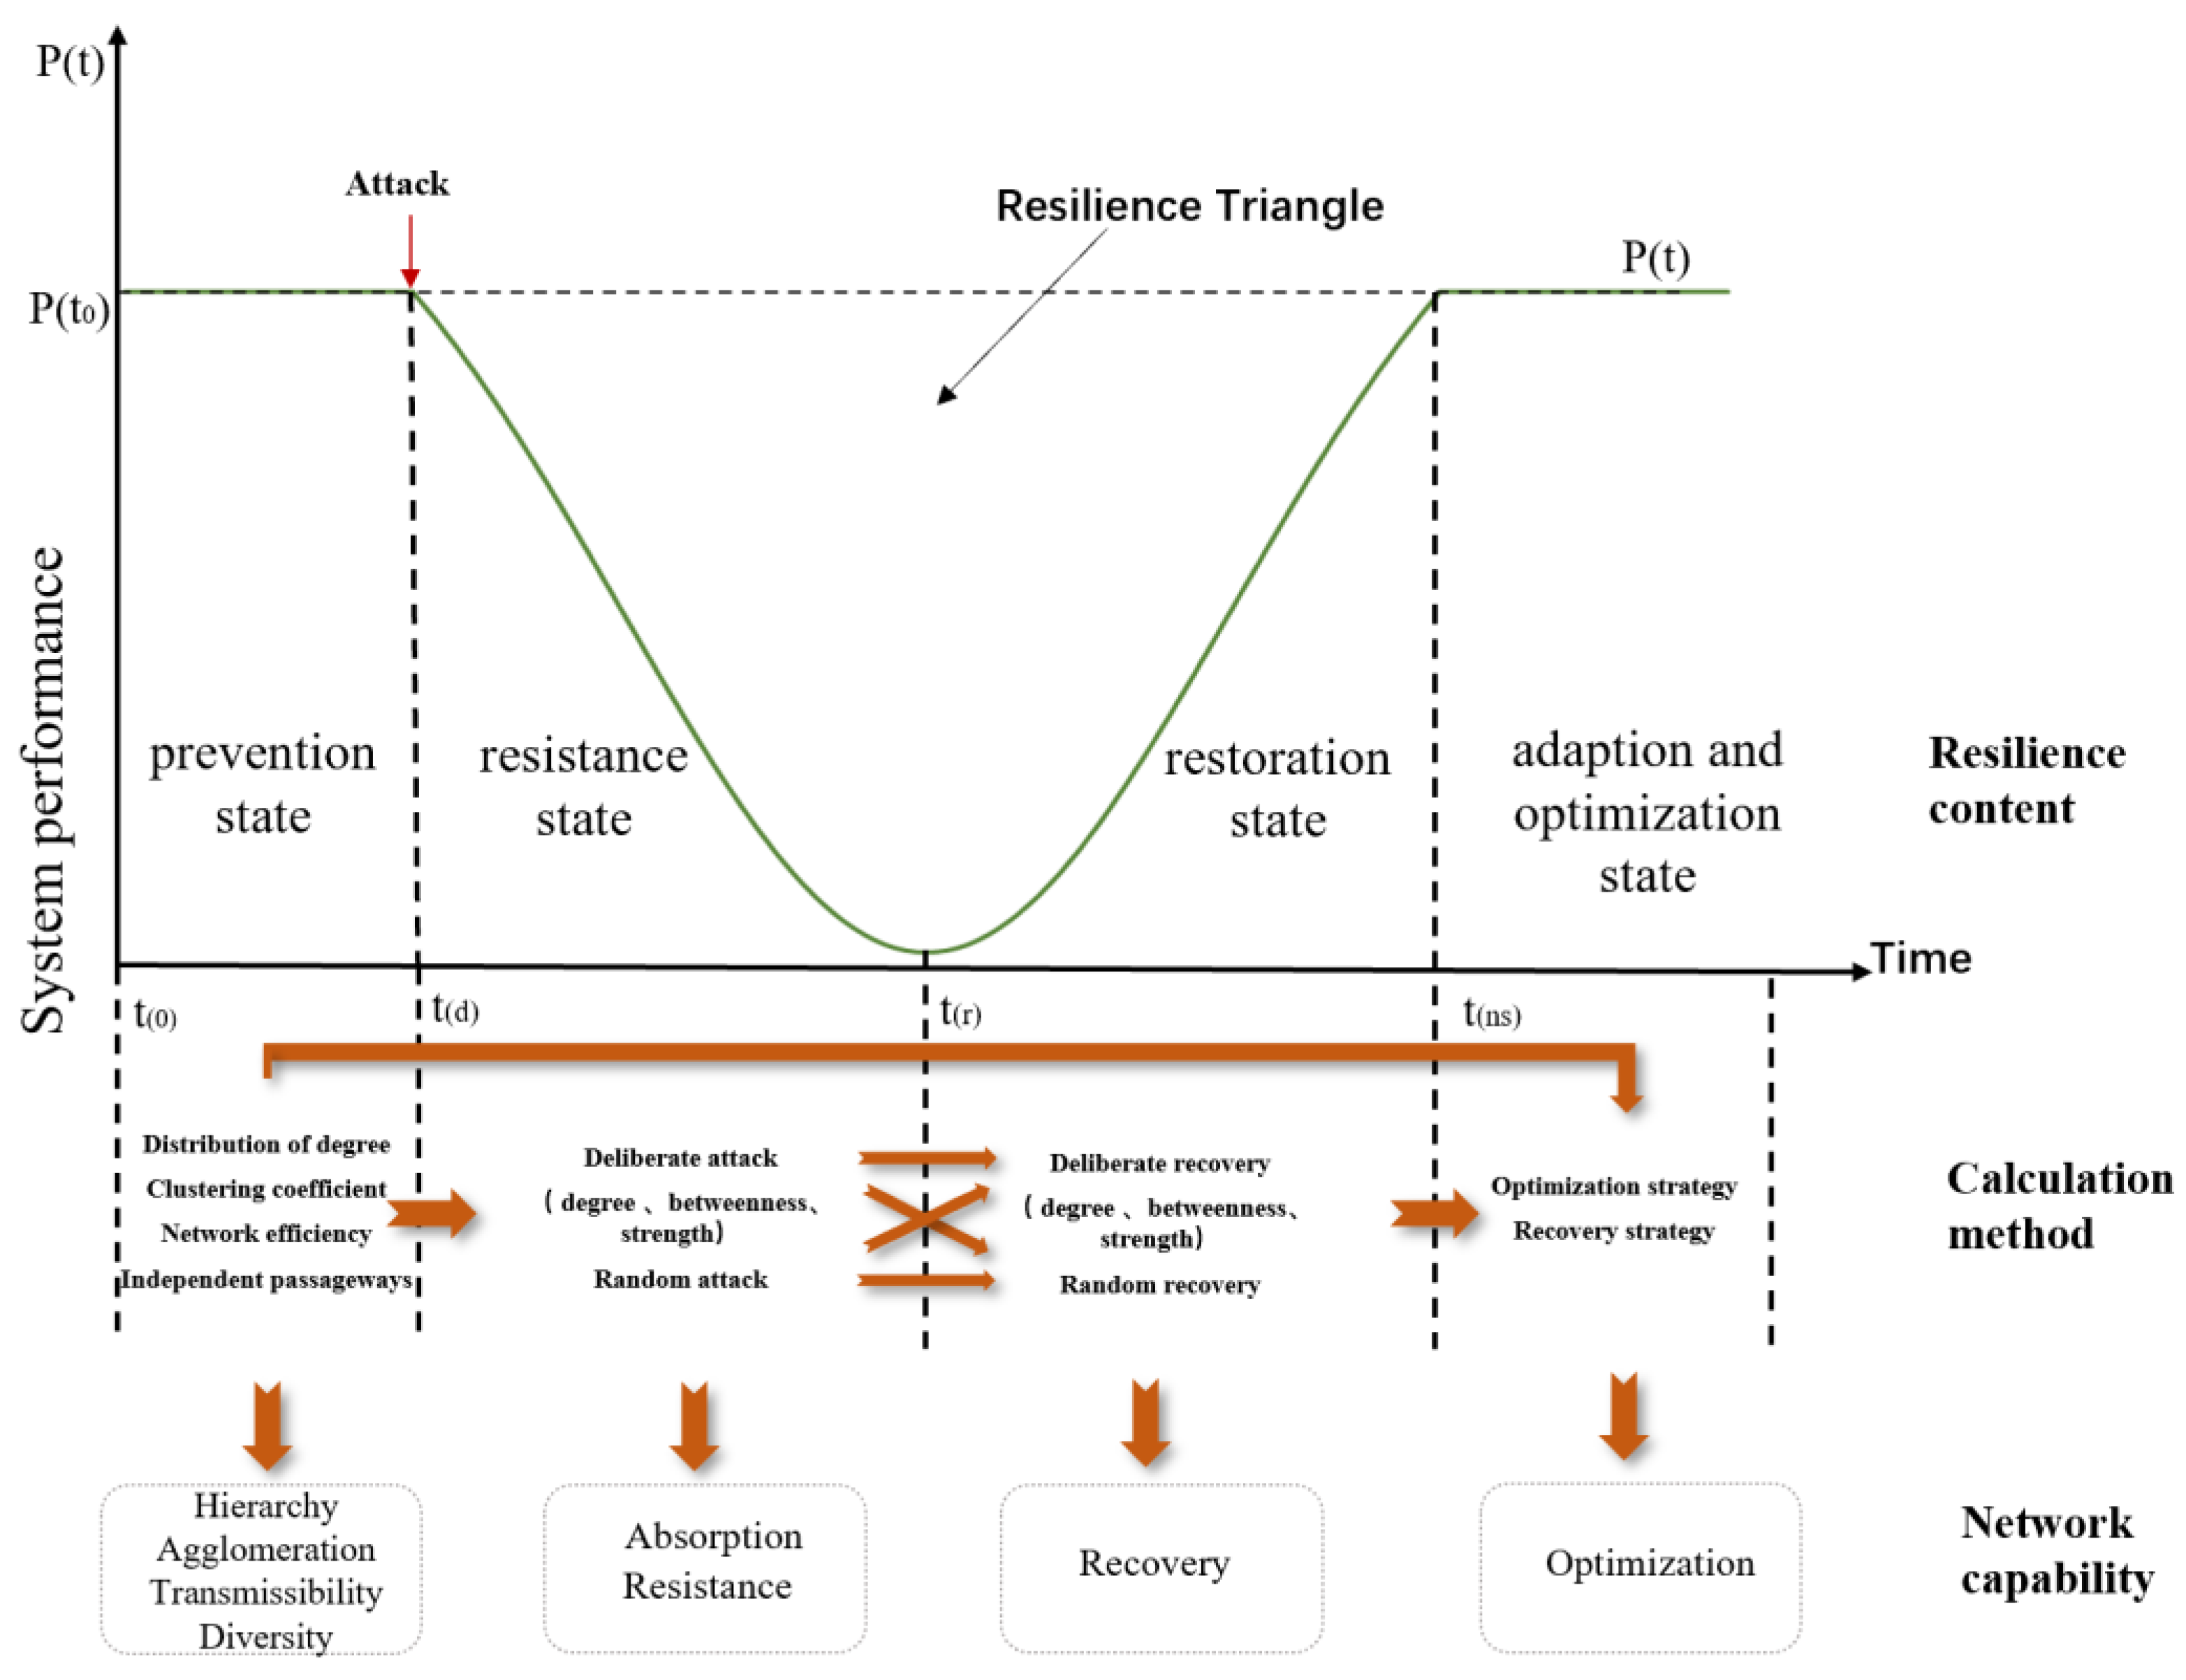
2. Resilience Framework of CPSN

Some specific properties can be extracted by further studying the definition of resilience in the literature. Woods [47] proposed four basic concepts underneath diverse uses, i.e., rebound, robustness, graceful extensibility, and architectures for sustained adaptability. The Multidisciplinary Research Center for Earthquake Engineering (MCEER) [48] divided the dimensions of resilience into robustness, redundancy, resourcefulness, and rapidity, which are known as the “4R” dimensions of resilience. Madni [29] describes resilience as a multifaceted ability, including avoiding, absorbing, adapting, and recovering from disruption. Alexis [49] defines resilience metrics as withstanding capability, restoration speed, preparation/planning capacity, and adaptation capability.
Combined with the above typical properties and resilience definition, this study argues that the key to the sustainability of the overall network structure lies in its resilience [50,51]. Resilience is the ability of a system to (1) prevent and avoid damages, (2) absorb damages while still maintaining its function, form, and structure, (3) recover at an appropriate time and reasonable cost, and (4) learn and adapt to the changing environment. Based on this definition, an analytical framework of CPSN’s resilience (Figure 1) is proposed from a holistic perspective. The framework includes four states: prevention, resistance, restoration, adaptation, and optimization. The x-axis represents the time that node attack occurs and the periods that the system declines and recovers; the y-axis represents the changing performance of the system.
(1).
Prevention state (t(0) ≤ tt(d))
The port disruptions affected by exceptional events need to be foreseen, which requires measuring the ability of the existing CPSN and taking positive measures to avoid the consequences of the interference [44]. Under this state of CPSN, this paper regards the network as under regular operation, and ports can normally provide all the shipping functions. This is mainly to prevent the possible risks inherent in the network. The research also analyzed the network performance through the network indicators to predict the system’s ability to respond to risk. The network indicators reflect network hierarchy, agglomeration, transmission, and diversity.
(2).
Resistance state (t(d) ≤ tt(r))
The resistance state occurs at t(d) when the network encounters a risk crisis and continues until the network system (P) reaches t(r). If corresponding actions are not taken after the shock, the network performance will decline without stopping, until it reaches 0. This stage mainly measures the network resistance, which is the ability of the CPSN to resist and absorb the adverse effects after the attack. The network connectivity, efficiency, and independent path are calculated to analyze the network performance in the resistance state.
This paper conducts an attack scenario by simulating the network interruption, in which the node and its connected path will be deleted if the node fails. The core ports are often attacked by various deliberate or uncertain events in the real world. By focusing on various attack-simulation methods in the theory of complex network, these events in our simulation model could be categorized as the deliberate attacks (including the degree attack (DA), betweenness attack (BA), strength attack (SA)), and random attack (RA). For DA, BA, and SA, the sequence of deleting procedure would follow the number of node’s degree, betweenness or strength, from large to small, respectively. RA simulates 200 random sequence attacks, and the average value of each network indicator is taken.
Under different network structures, the resistance of the network is different. Zhang et al. [21] divided networks into four types, specifically: type 1 (highly connected)—grid, matching pair, complete grid, and diamond networks; type 2 (centrally connected)—hub-and-spoke, double tree, ring, diverging tails, and crossing paths networks; type 3 (circuit-like connected)—central ring, double U, and converging tails; type 4 (randomly connected)—random, scale-free, and small-world networks. By analyzing the resistance of the above four types of networks, they find that type 2 has poor inherent coping capacities. This situation is because the type 2 network contains center nodes that connect many other nodes; if the center nodes are damaged, the network will be disconnected.
(3).
Restoration state(t(r) ≤tt(ns))
The restoration state is when the network recovers from damage to the initial status t(ns) by taking appropriate measures. This paper assumes it is always in the restoration state, unless the network reaches its initial status. A system’s recovery process would be undertaken by solving the existing problems and rebuilding the damaged part through solid learning ability. The network connectivity, efficiency, and independent path are still chosen to analyze the network performance in the restoration state.
This paper conducts a recovery scenario simulation, in which the nodes and their connected paths are added to the shipping network if the specific nodes recover. To find a better recovery mode in the restoration state, the deliberate recoveries (including degree recovery (DR), betweenness recovery (BR), and strength recovery (SR)), and random recovery (RR) are simulated after the network is attacked. For DR, BR, and SR, the sequence of adding nodes would follow the number of node’s degree, betweenness or strength, from large to small, respectively. RR simulates 200 random sequence recoveries. The average value of each network indicator is taken.
Diamond [52] points out three pauses on the road to failure, and the third one is that there is no attempt to solve the problems that have been found. A collapsed society can be seen as an extreme case of lacking resilience, and the same standards could apply to individuals, organizations, and systems. Zhang et al. [21] indicate that the type 2 network mentioned above is the least resilient. However, the type 2 networks are also the most responsive to the shocks. They could gain the most from the shocks when their response actions are appropriate, thus implying that the preparations for dealing with the disasters are crucial for networks with a such structure. The CCPSN is the hub-spoke model belong to type 2 [13,14]; therefore, it is necessary to find the appropriate recovery mode of CCPSN to deal with the disasters.
(4).
Adaption and optimization state(tt(ns))
The state of adaptation and optimization is the state that the system learns, recovers, and optimizes from the shocks. The system’s ability to deal with emergencies could, again, be strengthened. Alexis [49] argued that network resilience is a continuous process, and the optimization and promotion of networks must be considered. Jufri et al. [44] suggested that the adaption and optimization state is long-term and preventive. It is necessary to evaluate the effects of the latest incidents and identify the weaknesses in the network during the preventive state for the strategies of long-term enhancement.
In the following parts, the evolution of each indicator of three modes of networks (the original, attacked, and recovered network) will be analyzed. Based on the comparison results, this paper proposes optimizing and recovery strategies for the shipping network, in order to deal with the future crisis.

3. Materials and Methods

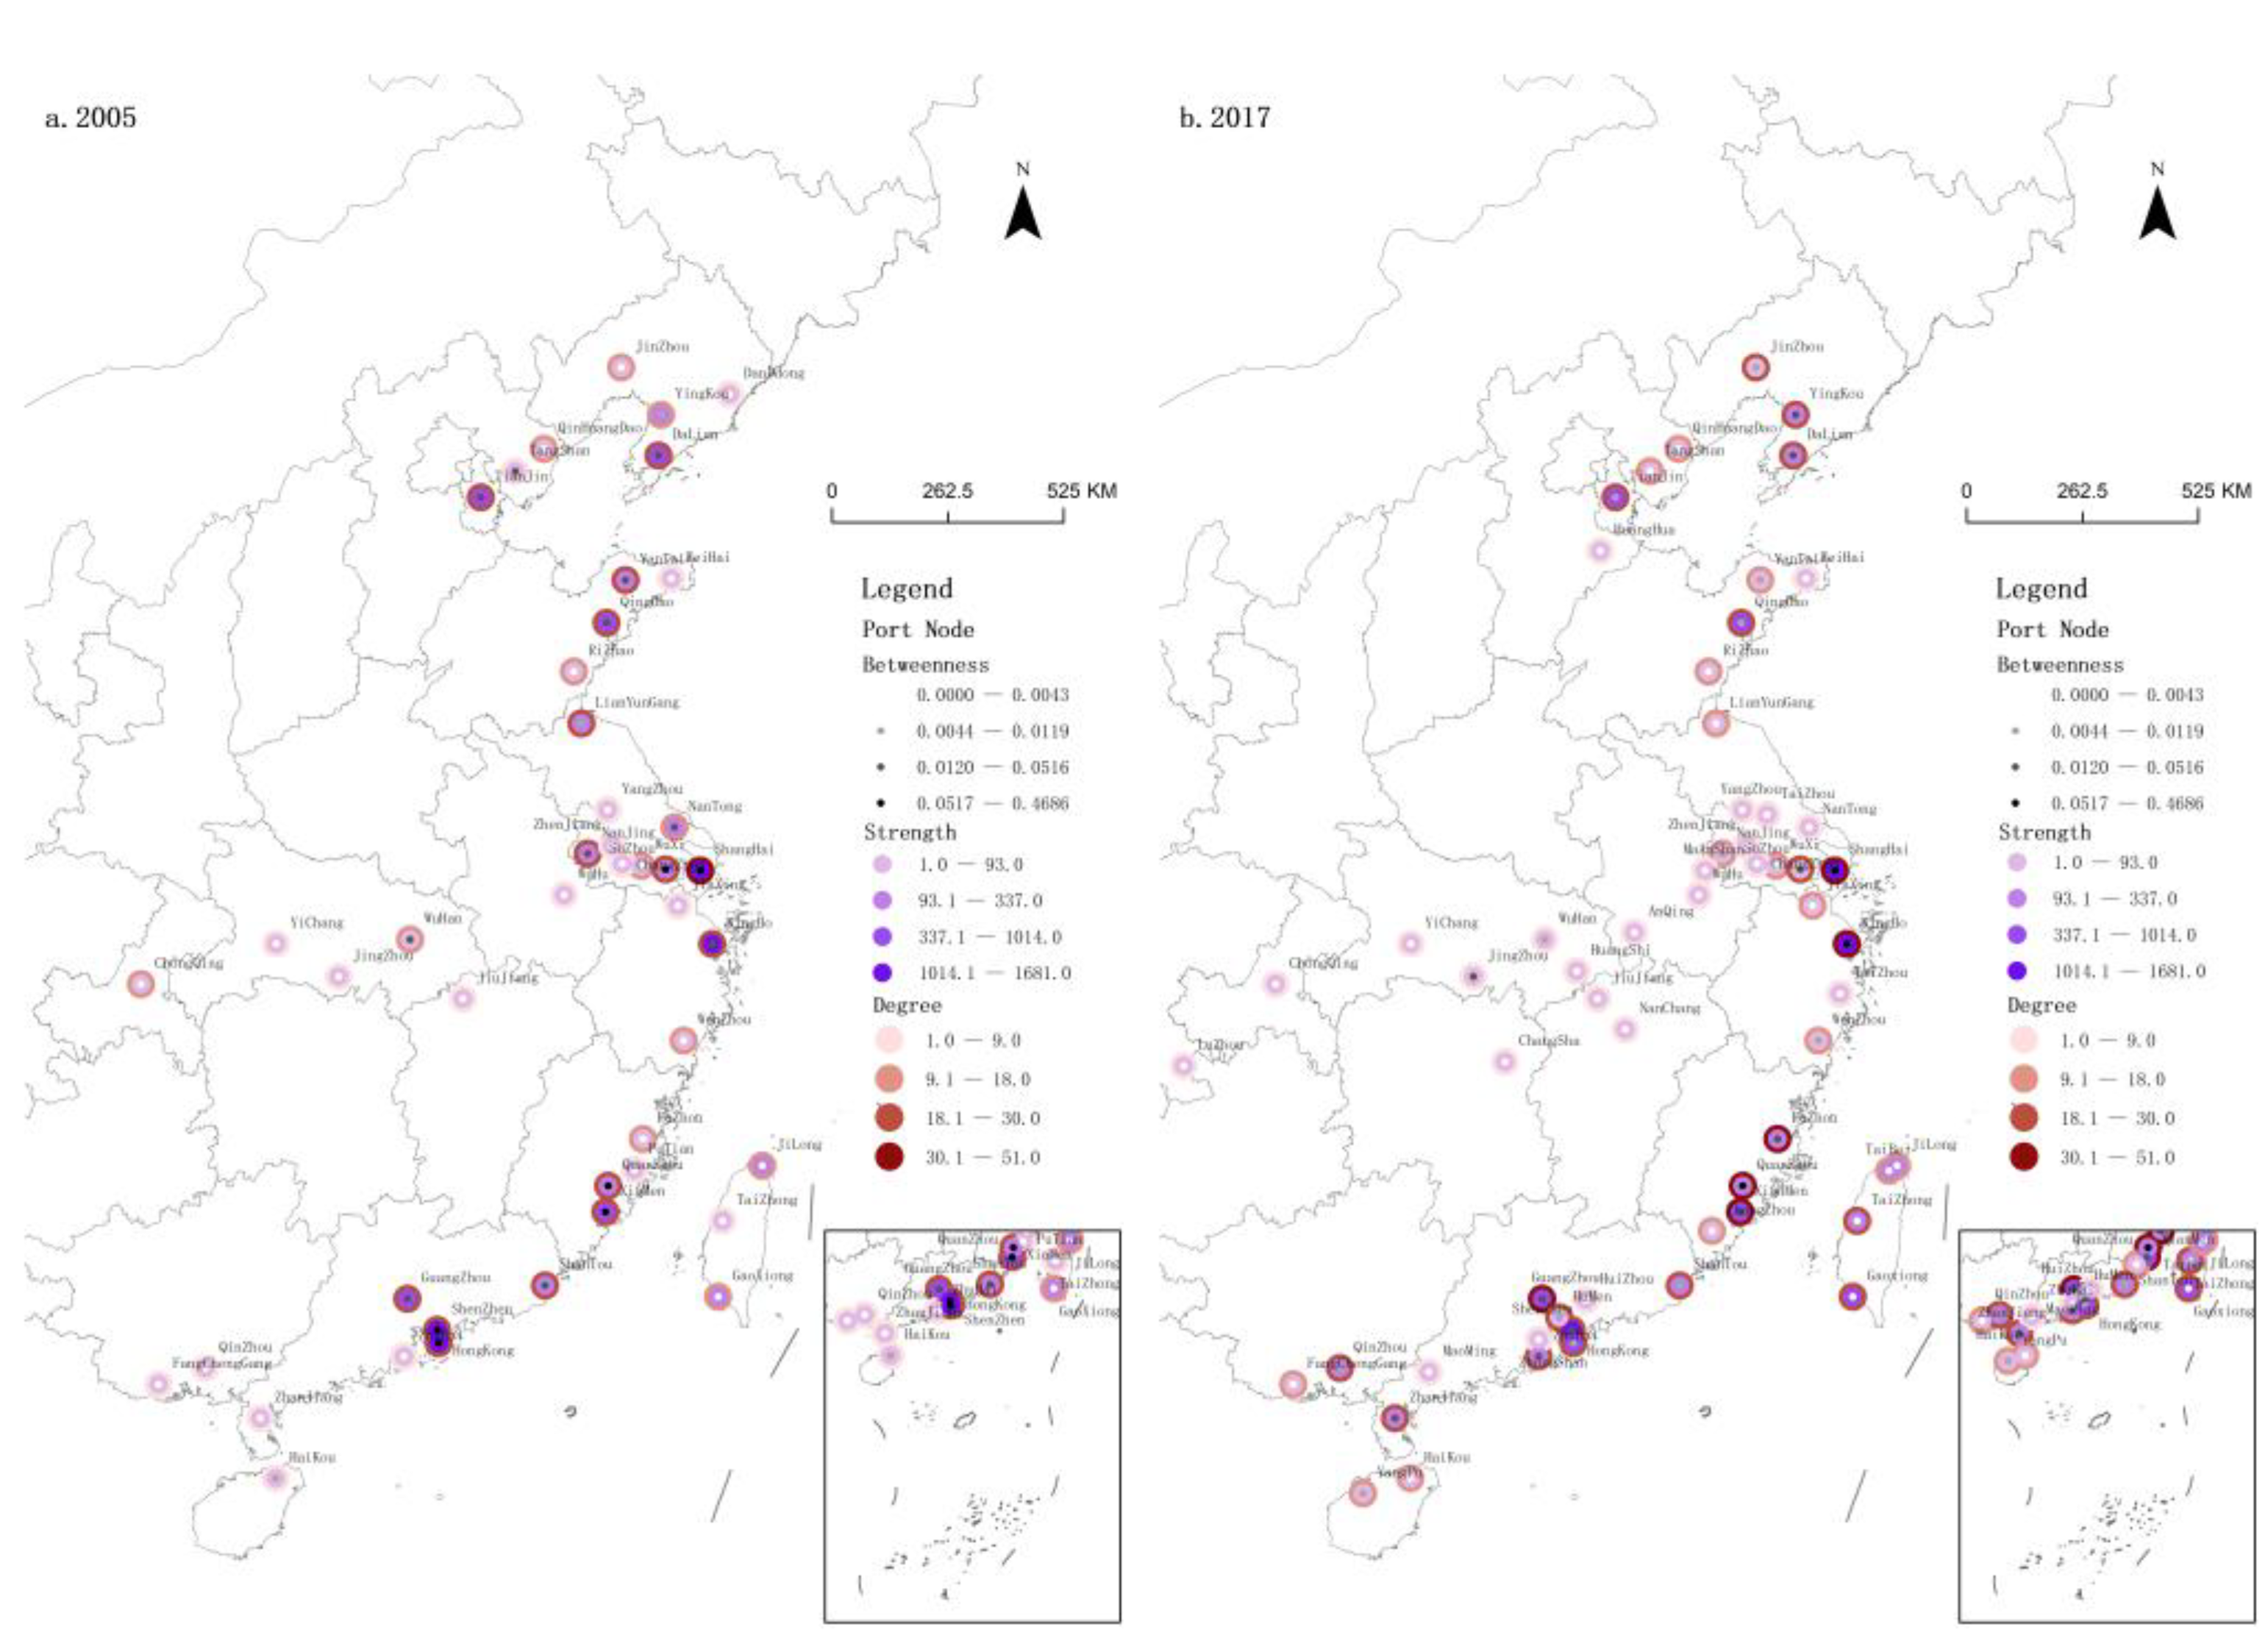
3.1. Study Area and Data

The data of container shipping routes (including domestic routes and domestic routes of foreign trade) of China’s ports were collected from the Yearbook of China Ports (2006 and 2018) and China Shipping Gazette (2005 and 2017). The China Shipping Gazette is sponsored by China Communications and Transport Association. The repeated routes were removed, and the ports were regarded as nodes; the nodes were connected if there are routes among the following ports. The number of shipping routes between ports was considered as edge weight, in order to establish a weighted CCPSN. To facilitate some indicators’ calculation, if one pair of nodes with shipping routes, the edge between this pair of nodes will be represented as 1; otherwise, the edge will be represented as 0, and an unweighted CCPSN is built. The CCPSN in 2005 or 2017 was constructed using Gephi 0.9.2 software.

3.2. Methods

(1)
Degree and degree distribution
The node’s degree represents the sum of edges that one node has in unweighted network. The greater the degree of the node, the more connections it has with other nodes in the network. Crespo et al. [53] believed that the degree distribution of nodes can reflect the network hierarchy. The more significant slope of the degree distribution is, the more apparent the hierarchical structure between nodes will be. The network with a hierarchy structure shows the characteristics of prominent core ports [53]. By referring to the rank-size rule, all nodes in the network are sorted from large to small, according to the degree value of nodes, and then the curve between the node’s rank and degree will be drawn and attempt to fit into the power-law curve. The formula [28] can be processed as:
ln ( K i ) = ln ( C ) + a ln ( K i * )
where Ki is the degree of node i; Ki* indicates the ranking of degree of node i in the network; C is constant; a is the slope of the degree distribution.
(2)
Betweenness
The shortest path between non-contiguous nodes Vj and Vl in the network will pass through some nodes. If many other shortest paths pass node Vi, it means that the node is essentially important in the network, and its importance or influence can be characterized by the node’s betweenness Bi [28].
B i = 1 j l N j i l [ n j l ( i ) n j l ]
where njl is the number of shortest paths between nodes Vj and Vl, and njl(i) is the number of shortest paths between nodes Vj and Vl through node Vi in the unweighted network.
(3)
Strength
The strength of node Vi is the sum of edge weights associated with node i. The formula is as follows [13]:
S i = j G i w i j
where Gi is the set of adjacent points with node Vi, and wij is the number of shipping routes between nodes Vi and Vj in the weighted CCPSN.
(4)
Clustering coefficient
The clustering coefficient could be represented into two forms: local clustering coefficient Ci and global clustering coefficient C. Global clustering coefficient C is the average local clustering coefficient of all nodes in the network. The clusters in the shipping network can be measured according to the network clustering coefficient. The more significant value of the clustering coefficient of the port network refers to the closer connections among nodes in the network, and it is easy for these nodes to form a closed thinking habit. The formula is as follows [28]:
C i = 2 E i K i ( K i 1 )
C = 1 N V i V C i
where Ci is the local clustering coefficient of node i, and Ei is the actual number of edges between the neighbors of node i. N is the number of nodes in the network.
(5)
Network efficiency
Network efficiency is defined as the average reciprocal of the shortest distance between nodes. Many empirical studies have proved the accuracy of network efficiency as a resilience measure indicator [54]. Network transmissibility can be measured based on network efficiency, mainly related to the shortest path length between nodes. Generally, higher transmissibility means that the nodes in the network could efficiently exchange information, goods, and other elements, promote learning and innovation among ports, and enhance the regional network resistance to the crisis. Paths with fewer transits are more reliable when responding to shocks [55], for they could quickly respond to external changes and smoothly deal with disturbances. The formula is as follows [56]:
E ( G ) = i j G 1 d i j N ( N 1 )
where E(G) represents network efficiency, 0 ≤ E(G) ≤ 1; dij is the shortest path between node i and node j in the unweighted network.
(6)
Network independent path
If a path set contains all the connected path between nodes, and there are no same edges between the paths. Then, the set is the independent path between nodes [57]. Another primary variable of our interest is network diversity, which describes the network tolerance for faults. The network diversity is measured by the number of independent paths [57]. Other paths will ensure the network’s regular and stable operation if a particular path is affected by a crisis. The formula is defined as [57]:
V ( G ) = i j G n i j N ( N 1 )
where V(G) is the average number of independent paths; nij is the number of independent paths between nodes i and j in the unweighted network.
(7)
Network connectivity
The subgraph with the most connected nodes is the largest connected subgraph. The network connectivity is represented by the relative value of the largest connected subgraph, which is the ratio of the number of nodes in the largest connected subgraph to the total number of nodes in the original network [45].
F = N N
where F is the relative value of the largest connected subgraph, which can measure the degree of network collapse. N′ is the number of nodes in the largest connected subgraph.
(8)
Resilience index
To calculate the overall loss of performance of the system during the resistance and restoration states, this paper used the following resilience index (RI) to measure system’s resilience [58].
R I = t d t n s p ( t ) d t t d t n s p ( t 0 ) d t
where RI is the resilience index of the system, and P is the system’s performance showing the time when the node is attacked and recovered. The resilience triangle reflects the loss of the system performance caused by the damage. It can be seen from Figure 1 and RI that the value of the resilience triangle is 1 − RI. The resilience of the system can be increased by improving the performance of the system (vertical axis) and reducing the recovery time (horizontal axis), in order to reduce the area of the resilience triangle (Figure 1).

3.3. Degree, Betweenness, and Strength of Nodes

The importance of different Chinese port nodes is quite different, the value of betweenness, degree, and strength of port nodes in 2017 has been divided into four levels by Natural Breaks in ArcGIS; network indicators values in 2005 also were divided into four levels by the same settings as 2017(Figure 2). Higher node’s values mean that this node reflects greater betweenness, degree, and strength and plays a critical important role in the network. It can be seen from Figure 1 that Shanghai, Ningbo, Shenzhen, Hong Kong, Guangzhou, Qingdao, Tianjin, Dalian, and Xiamen ports have consistently been ranked at three or four levels, which emerge as the essential hub ports in CCPSN, from 2005 to 2017. Nodes with higher levels were also the first nodes to be attacked and recovered in the following attack and recovery modes.

4. Results

4.1. Prevention State

In this state, the following empirical results were obtained. First, from 2005 to 2017, the number of ports with stable container shipping routes increased from 45 to 59, with a growth rate of 31.11%. Second, the slope of degree distribution fitting curve |a| of the network increased from 0.7688 to 0.9678. In 2017, the hierarchy of the shipping network was higher, status of core ports was more prominent, and heterogeneity of the network was apparent [53]. The network’s vulnerability might increase if the attack disrupts the core ports. What is more, the network efficiency decreased from 0.6481 to 0.6208, and the network clustering coefficient decreased from 0.7374 to 0.6815. While the number of ports increased by 31.11%, the network efficiency and clustering coefficients decreased by 4.21% and 7.58%, respectively. The main reason is that most of the increased ports are inland ports, which are located at the edge of the shipping network. The network’s transmission, diffusion, and agglomeration may decrease due to these ports, and the speed of response among ports to external interference may decline. Additionally, the network’s average number of independent paths increased from 8.9172 to 9.0683, and the diversity of the port network increased in 2017. If a port were disrupted due to the attack, other ports would still have more alternative paths to select for transportation [57]. Overall, the prevention ability of CCPSN improved from 2015 to 2017.

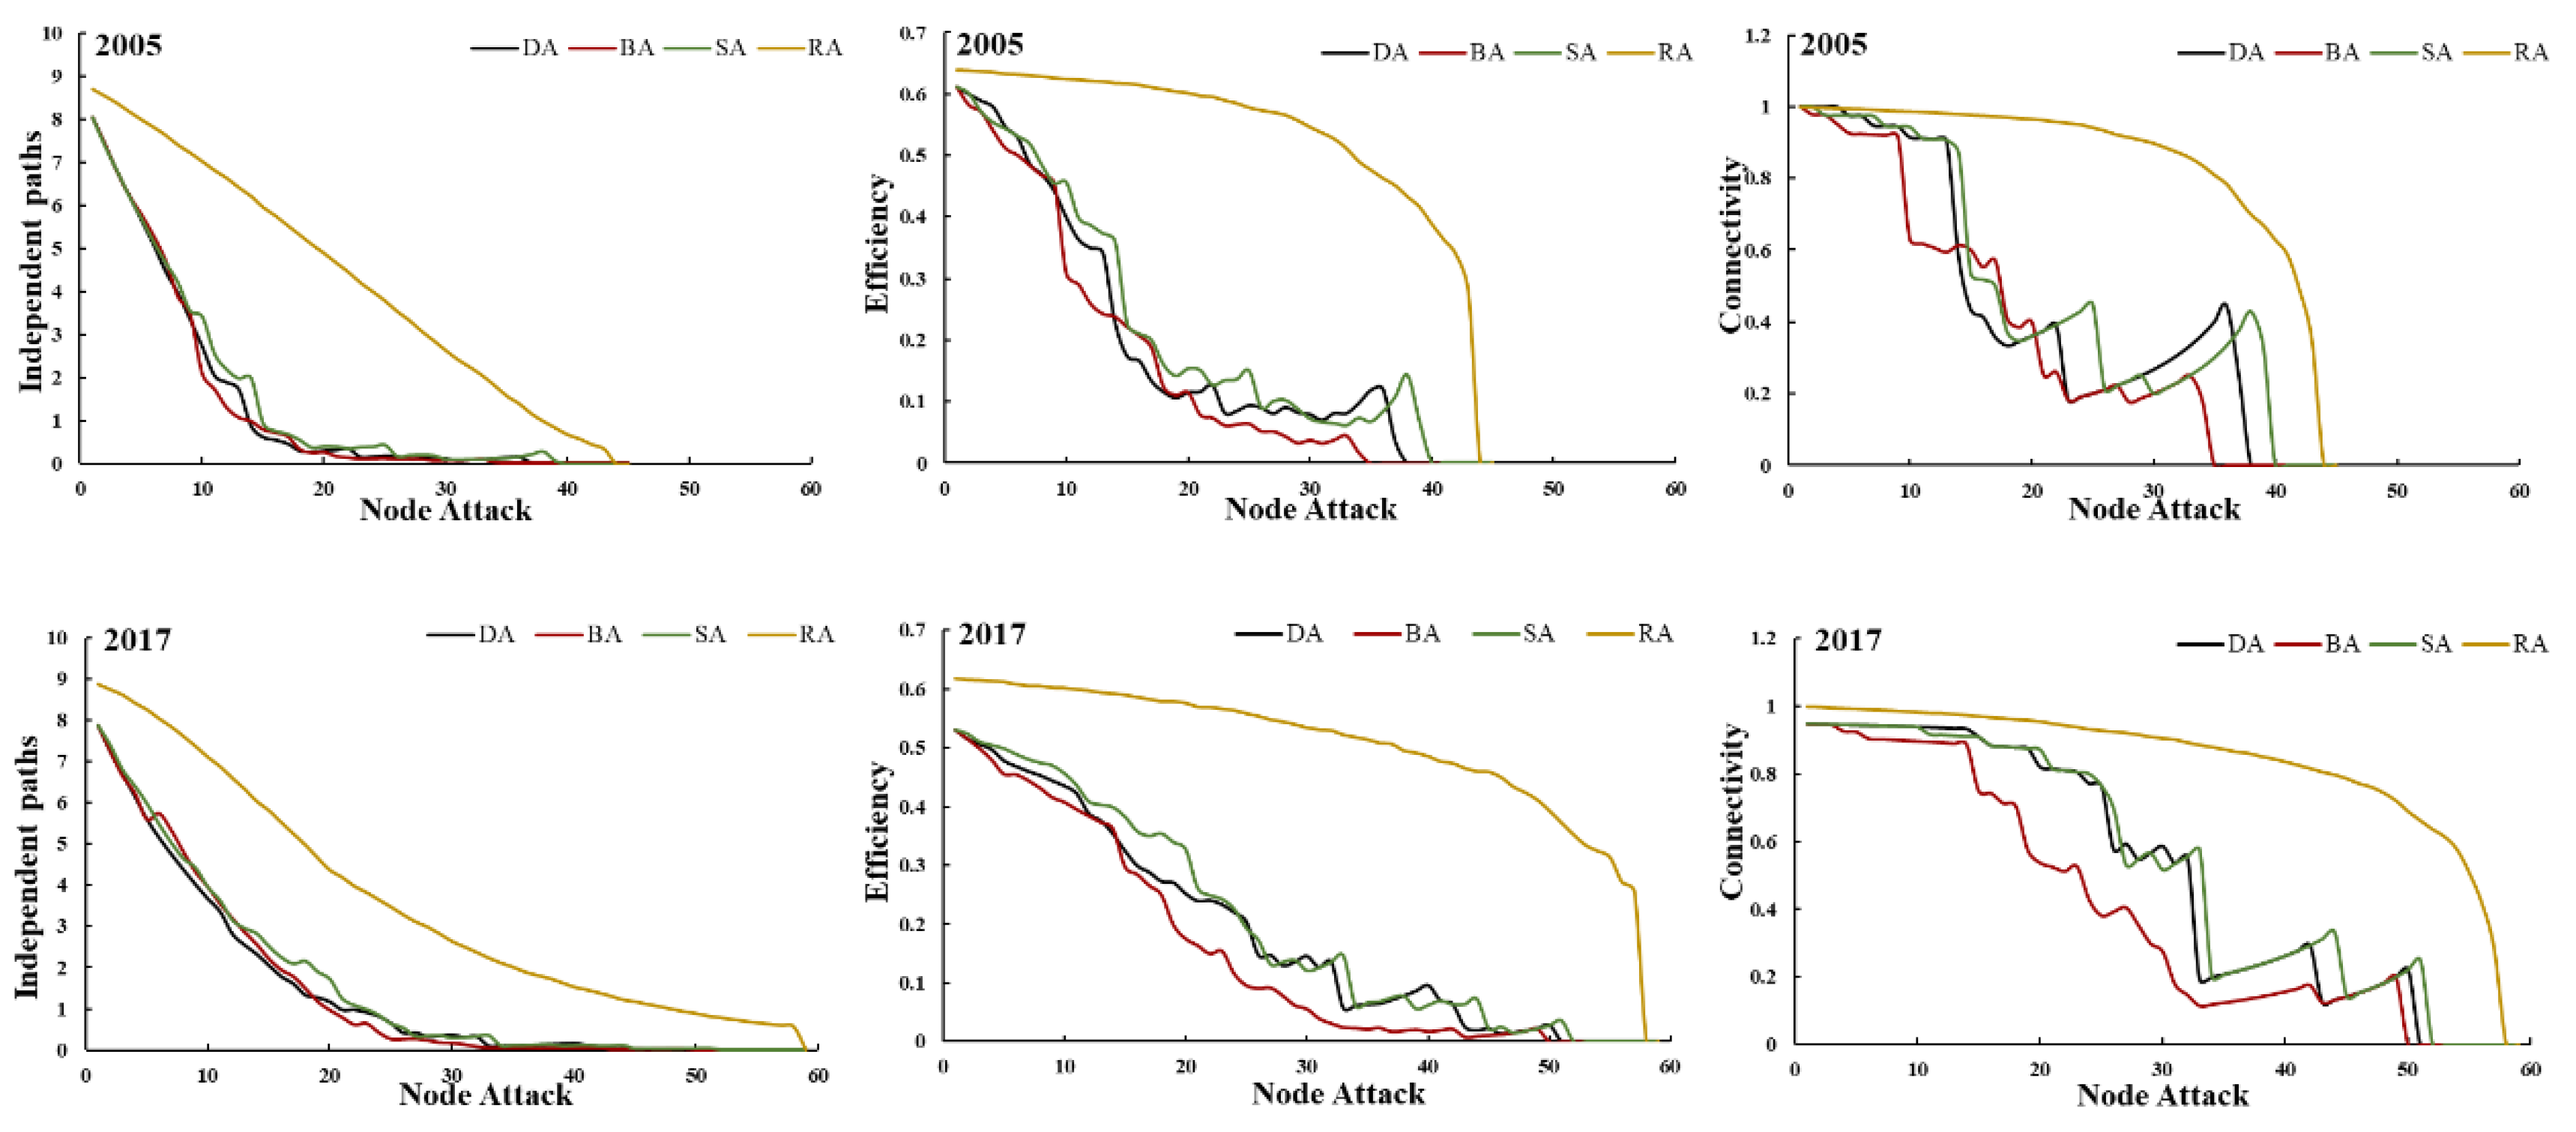
4.2. Resistance State
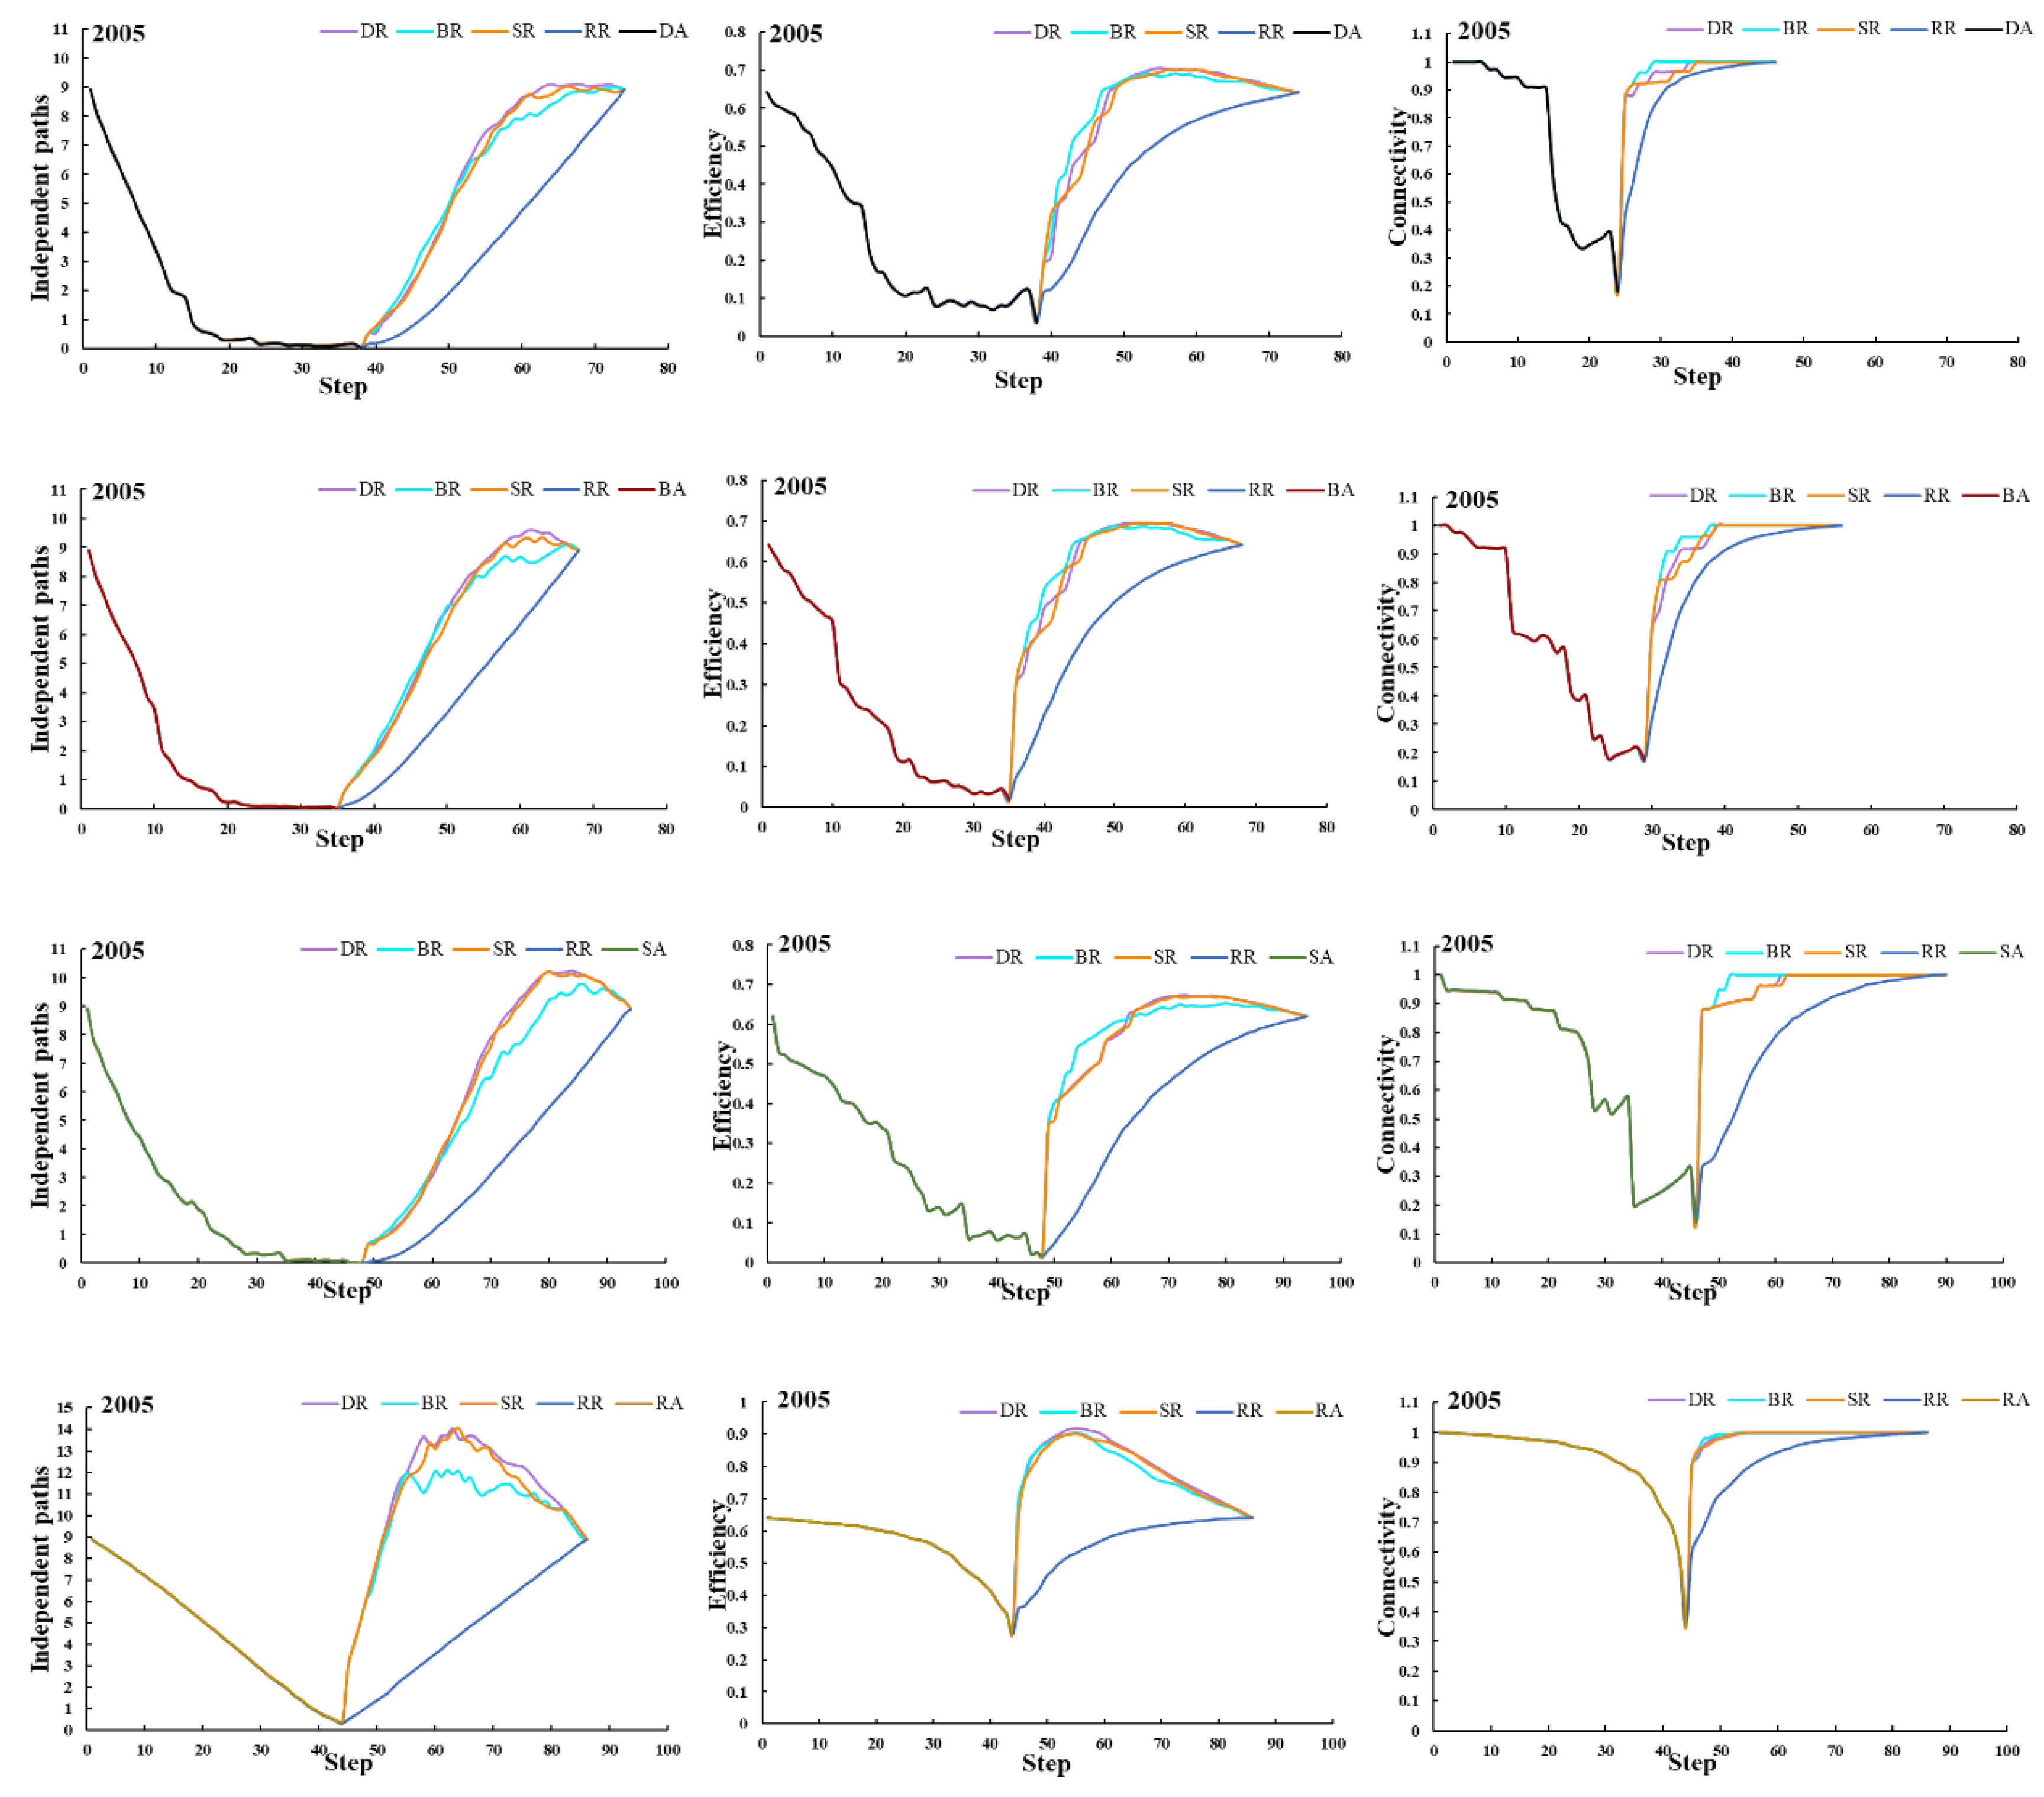
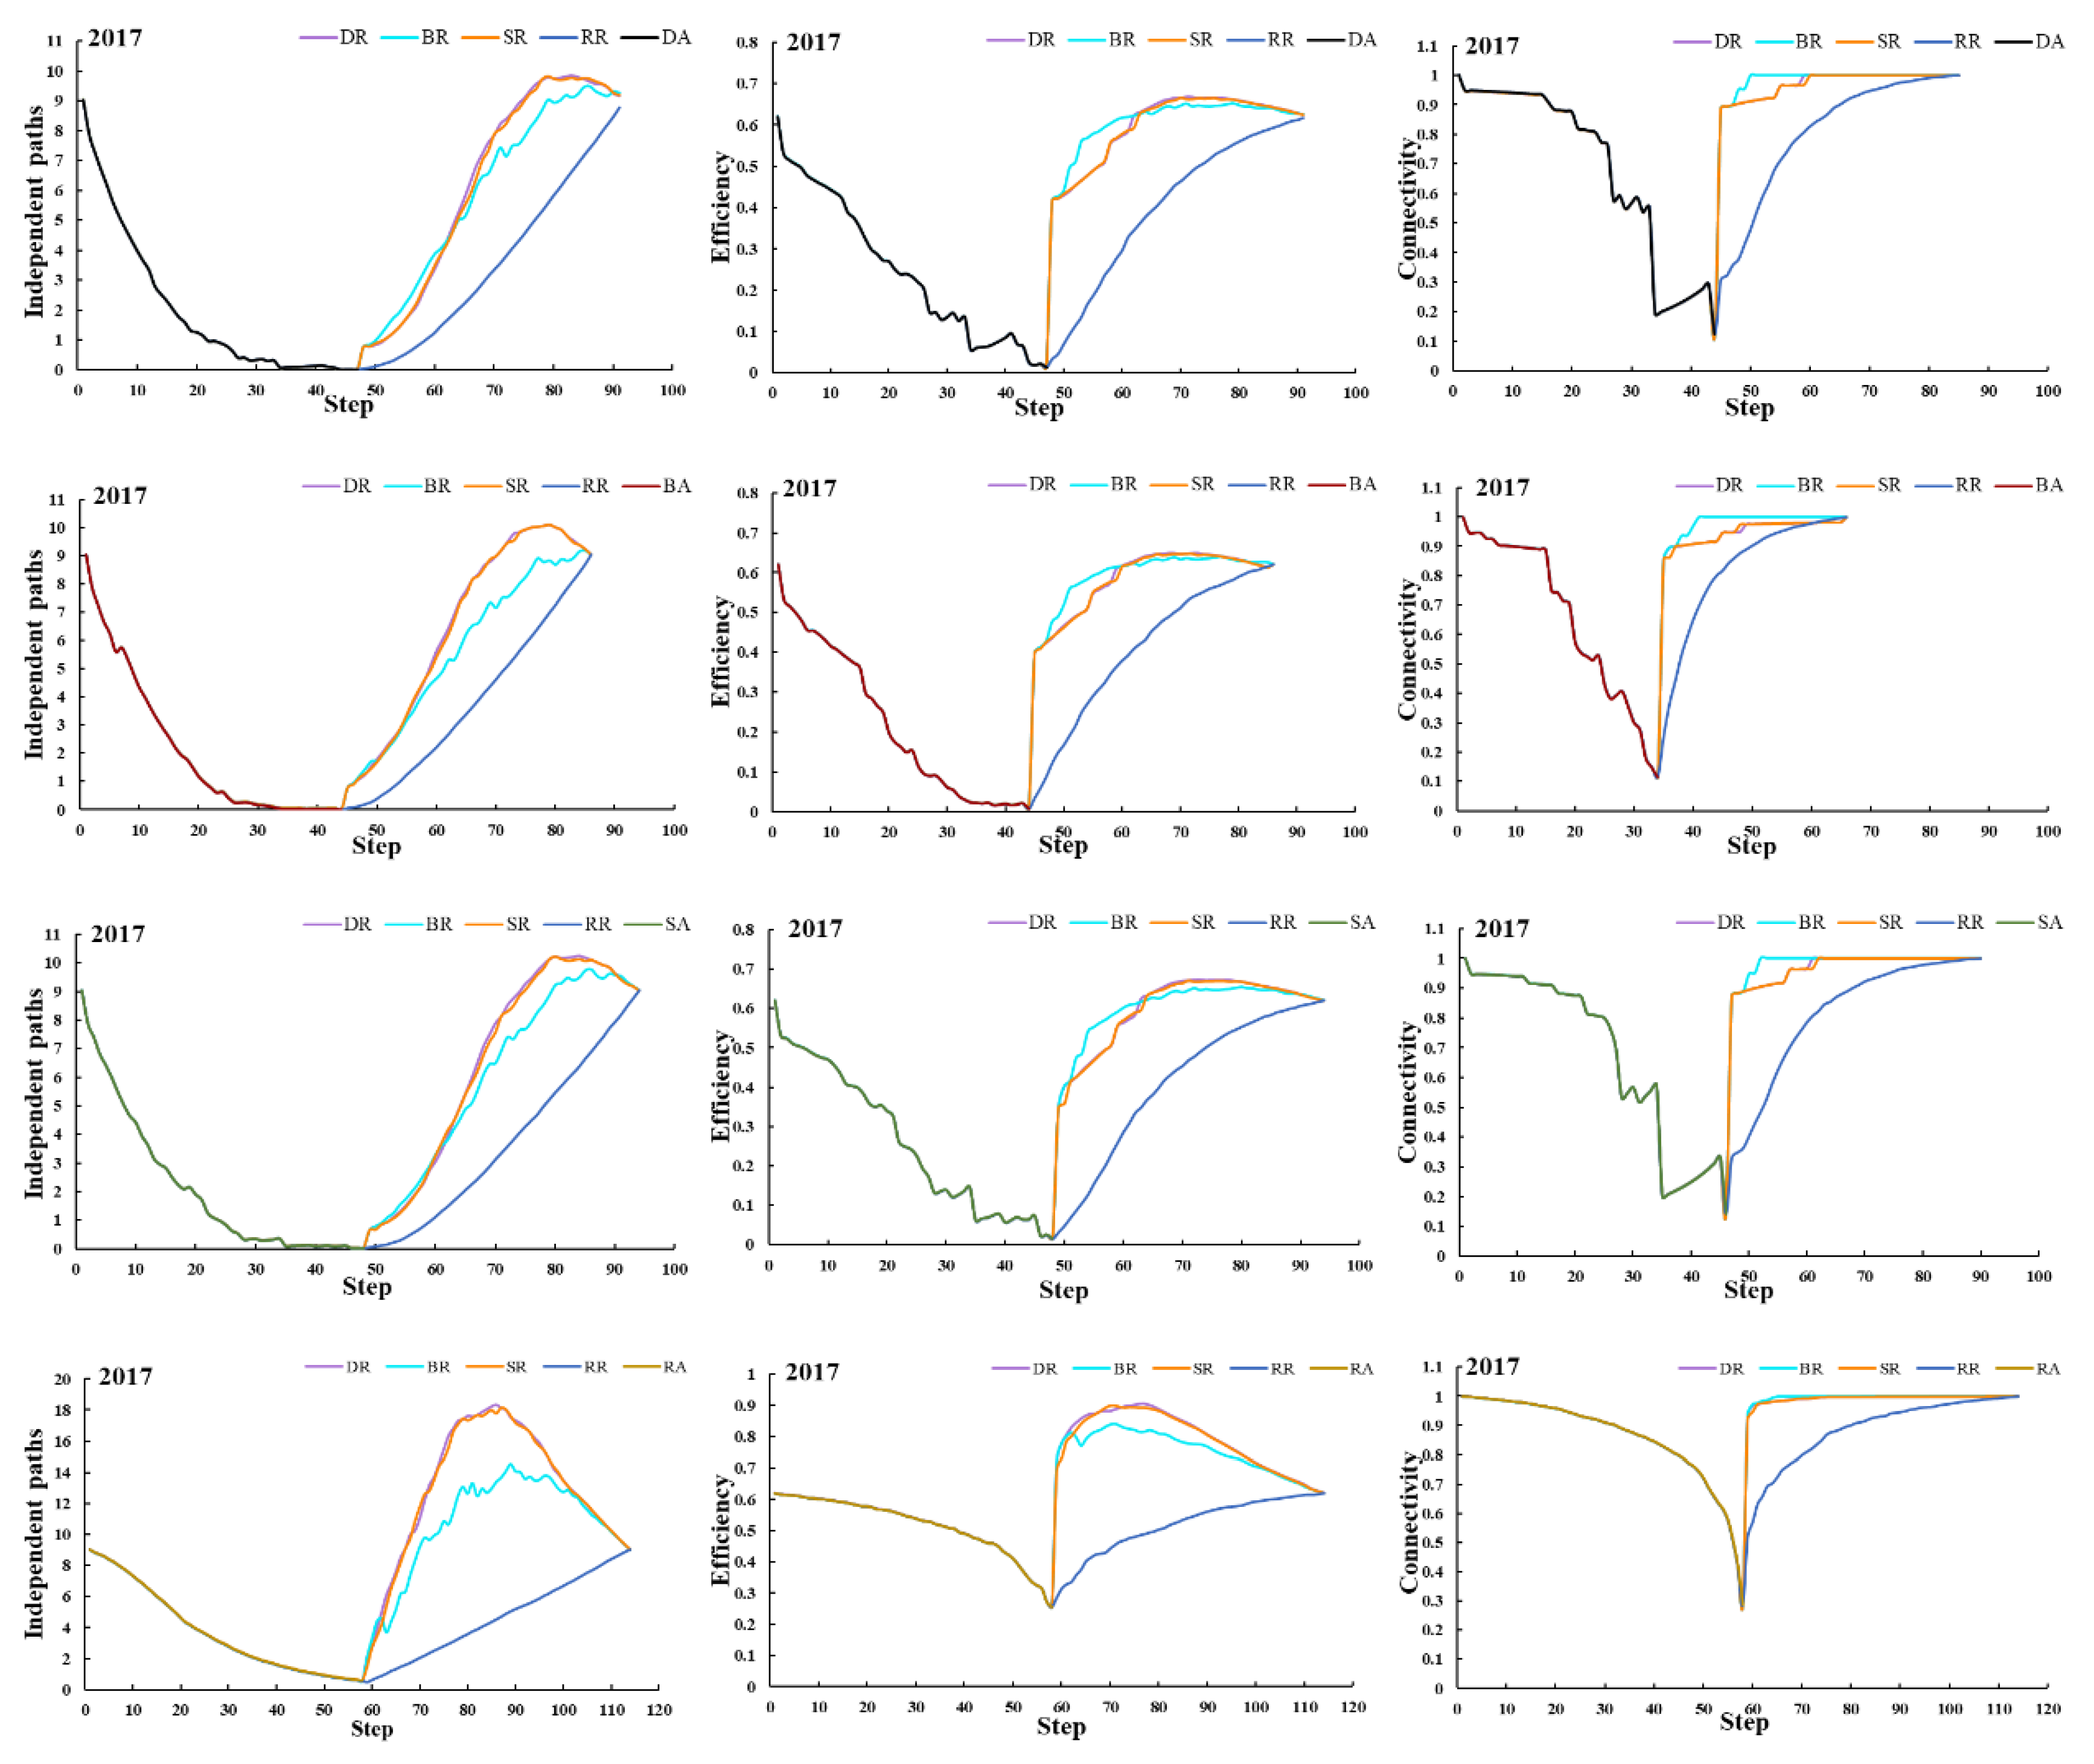
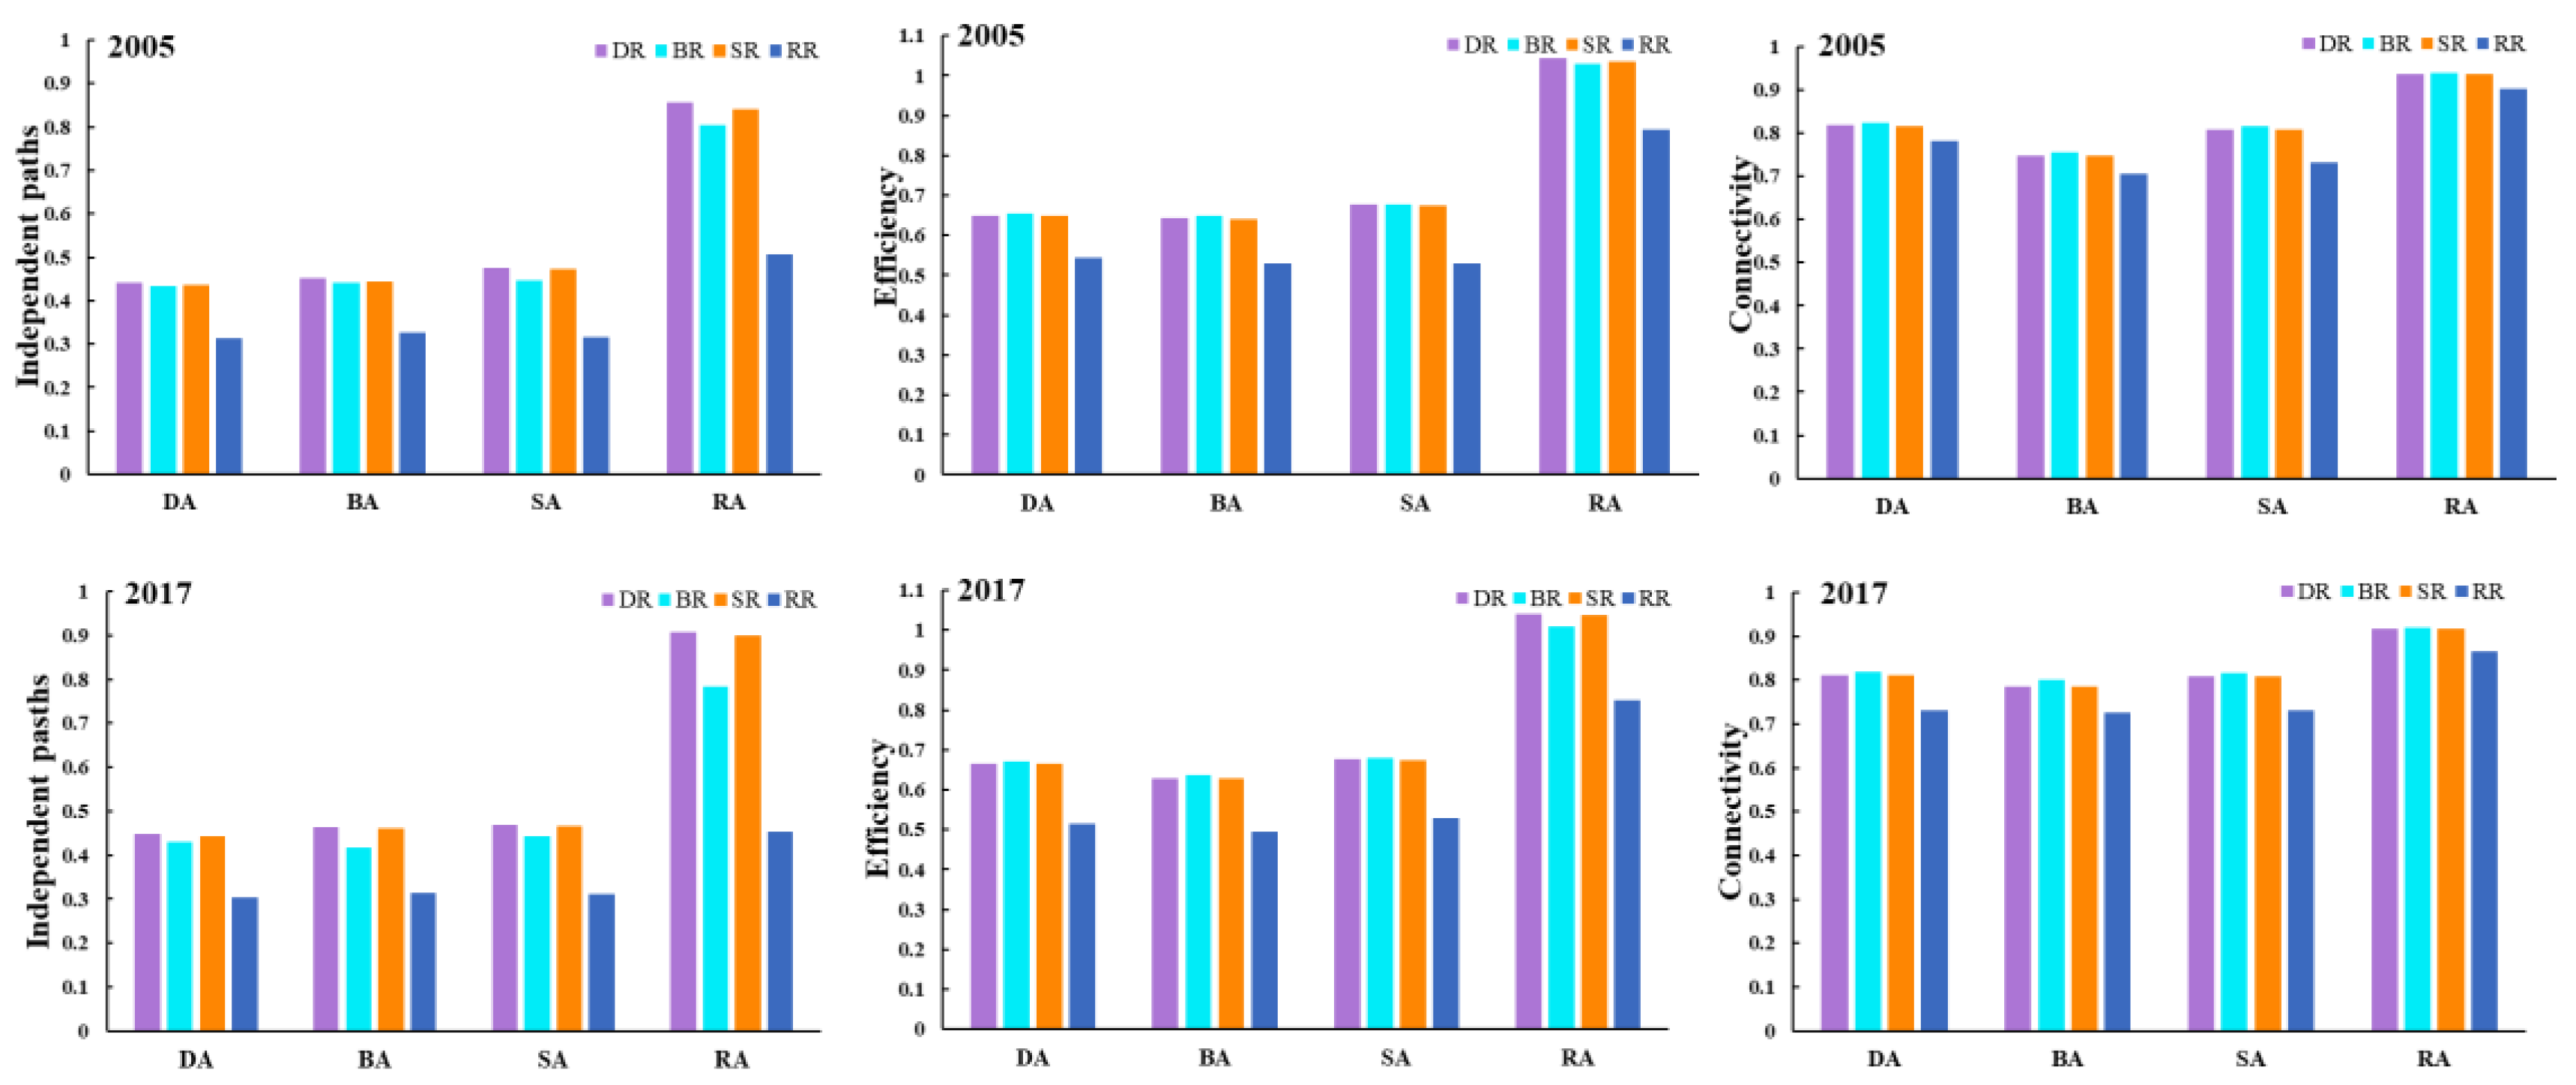
Figure 3 showed how the network indicators (y-axis: the number of independent paths, network efficiency, and network connectivity) evolved in two scenarios (the graphs in the first line (2005) or the graphs in the second line: (2007)) as the nodes were sequentially deleted (named degree attack (DA), betweenness attack (BA), and strength attack (SA), from largest node to the lowest one) or randomly deleted (named random attack (RA)). The number of deleted nodes (x-axis) would increase as the node attacks continuously occur. The growth of deleted nodes could also be regarded as the increasing time as the network starts to face the attack. In this paper, the moment of network collapse state was defined the moment the network each indicator value reaches its 0; the moment of network near-collapse state was defined then, during which the network system could still run; however, after the next node was deleted, the network system could not operate normally. The lowest value of indicators can be obtained in the moment of a network near-collapse state. In the resistance state, t(r) was simulated the moment of network collapse state.
For all subgraphs in Figure 3, each network indicator showed a fluctuating downward trend under different attack modes. Each indicator has different responses to attacks at various scales. The curves under RA mode are always observed as being resistant to absorbing more attacks, until they reach the collapse state. On the contrary, the curve under BA mode always drops and collapses the fastest, which means that the network performance under BA mode has low resistance, and the failure of nodes with high betweenness value will cause the greatest damage to the network. When considering the lowest value of each indicator under different attack modes in 2005, the network efficiency, connectivity, and independent path reduced to 0.0182, 0.177, and 0.0182, respectively, and the corresponding indicator decreased 97.16%, 82.35%, and 99.80%, compared with the initial value of the original network. In 2017, the network efficiency, connectivity and independent path reduced to 0.008, 0.115, and 0.008, respectively, 98.66%, 88.46%, and 99.91% lower than the initial value of the original network. The lowest value of the same indicator was lower in 2017, compared with 2015. However, the 2017 attacked network still did not collapse, which reflected the enhanced endurance and resistance of CCPSN.

4.3. Recovery State

Figure 4 and Figure 5 described the changes of each network indicator under the 2005 and 2017 scenarios, respectively. It indicated that the attacked networks, which collapsed from different types of node attacks, followed by a heterogeneous path to recover under different node recovery (named degree recovery (DR), betweenness recovery (BR), strength recovery (SR), and random recovery (RR)). In the recovery state, t(r) was simulated the moment of network near-collapse state.
There were similarities results between the 2005 and 2017. First, the recovery speed under RR always slower than other recovery modes, the recovery speed under BR was faster than other recovery modes initially. Secondly, different network indicators responded differently under the same recovery mode when considering the same type of attack (the three subgraphs shown in the same line). The recovery of the independent path was relatively more gradual, and its speed was slower than the other two types of indicators, no matter what kind of recovery mode. On the contrary, the connectivity showed the instant response to the relatively small increase of recovery nodes. For efficiency, its recovery speed was higher than the independent path, but its fluctuation period was longer than that of network connectivity. Additionally, each network indicator (the four subgraphs in the same column) showed a similar recovery mode after facing different attacks. For connectivity and efficiency, BR was always the faster recovery mode, i.e., for recovery to original network value than other recovery modes, no matter what kind of attack mode. For independent path, DR always was the faster recovery mode than other recovery modes. What is more, no matter what node attack or recovery type, the results always were that: (1) the highest value of network connectivity during the recovery process reached its original level; (2) the highest value of efficiency and independent path raised beyond the original level. The main reason is the following: according to the sequence of node’s degree, betweenness, or strength for selecting the recovery nodes, the national hub nodes will start to work first. The result could be expected that the operation of hub nodes could accelerate the recovery process of the overall network. Next, the local hub ports in the network had strong connections with the national hub ports. The recovery of local hub ports further increased the network efficiency and independent path beyond the original values of the two indicators, respectively. Finally, the recovery state would turn to the periphery ports in the network. The network efficiency and independent path would decrease because the periphery ports were only connected with the hub ports.
The main difference between 2005 and 2017 is that speed of recovery to the original value of network indicators is different. By calculating the average proportion of nodes that need to be restored to the original value of network indicators under different attack and recovery modes, the results were that 28.89% of nodes were restored in 2005, while 25.42% were restored in 2017. This decrease in the proportion indicated that the overall recovery speed of CCPSN increased in 2017.
The resilience index (RI) was calculated from the beginning of the attack to the final full recovery in 2005 or 2017, as shown in Figure 6. The results showed that the difference in resilience index between 2005 and 2017 was slight. The RI under every kind of deliberate attacks was lower than that in the random attack situation. Different network indicators show different performances on the RI. The connectivity’s RI was better, but the independent path’s RI was relatively poor. This result is illustrated by Figure 4 and Figure 5. The connectivity dropped and recovered fastest, and the resilience triangle area of connectivity was small. However, the independent path was the opposite. Moreover, four recovery modes led to the differences in the RI, and the RI under RR was always smaller than that under other recovery modes.

4.4. Adaption and Optimization State

(1).
Optimization strategy
In 2017, the CCPSN showed a higher hierarchy, and the main reason was that the hub-spoke organization model of CCPSN was enhanced [13,14]. In the hub-spoke organization model, feeder ports converge to hub ports and transport through hub ports, and the transport mode represents the importance of hub nodes. Therefore, the hub ports are also the import transit nodes. The nodes with high betweenness value have better transit capacity [14]. In 2017, the network efficiency and connectivity declined much faster than other attack modes under the BA mode, thus proving the importance of transit nodes. Lewis (2006) also argued that nodes are more critical than links in hub-spoke networks. Therefore, in order to enhance the resilience of the hub-spoke network, the importance of hub nodes should be emphasized, and the infrastructure and route of important hub nodes should be protected and improved. According to the research of hub-spork structure, preparations for risks are critical for the national hub nodes. Additionally, the government should take emergency policies and measures in advance to improve the port shipping system’s performance and reduce the area of the resilience triangle.
Furthermore, in O’Kelly’s [22] article, the author followed Barabási’s idea regarding the resilience of the hub network: the failure of a significant node in the network could cause tremendous damage, and the importance of hub nodes can be hidden by duplicating them to decrease the risk of failure and maximize the resilience of the whole system. Therefore, for CCPSN, the growth of local hub ports should be paid attention to, and more ports should be allowed to play a more critical role in the shipping network to reduce the damage caused by hub node interruption.
(2).
Recovery strategy
The same network indicators show a similar recovery pattern after facing different attacks. Based on this result, the differences in network characteristics should be considered when selecting recovery mode. For example, according to the analysis of CCPSN, if the policy-makers aim to recover network connectivity, they should propose and follow the recovery strategies based on BR. If they mainly want to recover network diversity, they should work on DR.
In addition, Lewis believes that in the hub-spoke network, the hub represents the degree of vulnerability of the network. Still, it is the source of recovery [22]. It could also be seen from the recovery measures of CCPSN that deliberate recoveries, which focused on the sequence of nodes, had a faster recovery rate than the random one. Therefore, when the attack disrupts many ports, the important ones should be sorted out, thus prioritizing the recovery.

5. Discussion

This paper only considers the recovery measures when the shipping network is damaged to the near-collapse state. However, in real life, the stakeholders rarely start to take corresponding measures under such circumstances. Although some studies indicate that the recovering process should start from 25% or 50% of all nodes [45], it is apparent that such starting points are too static to reflect the complex and dynamic nature of reality. Therefore, more research is needed to consider when and how to restore the shipping network.
Additionally, in complex networks, nodes carry various services, and the transmission of each node and connection edge provides users with the corresponding service information. If some nodes fail or are attacked, the traffic carried by them will be directed to nearby nodes. If these nearby nodes collapse, due to overload, a new process of traffic redistribution and node failure will be initiated, which will expand the scope of failure and produce cascading failure [59]. Similar cascading failures will occur in CPSN. However, this article counts the shipping routes between ports, without considering various sizes of the container ships and throughput among container ports. Due to data limitations, the redistribution of containers in the port suffering from destructive events were not considered during the attack. These problems need to be considered and solved in the further research.
The 21st century is an era of globalization, and the trades among the ports connect different regions of the world. China’s economy is still growing, and its foreign trade volume has raised up to the first in the world, which show relatively strong connections between China and other parts of the world. However, the world’s economy and supply chain are not stable. During the global spread of the COVID-19, various countries underwent political and economic changes, and the geopolitical and economic environment became more complex. A more refined analysis of resilience of the shipping network between China and other countries is needed, in order to assist the goals regarding the sustainable economic development of the world. It is also worthy of further research.

6. Conclusions

This paper proposed a resilience framework of CPSN from the holistic perspective, including the preventive, resistance, restoration, and adaption and optimization states. The framework and network indicators could thoroughly analyze the changes in the overall system performance of the CPSN, both before and after the crisis. The structure resilience of CCPSN between 2005 and 2017 was compared and analyzed, which reflects the evolution of resilience of CCPSN. Overall, the resilience of CCSPN improved in 2017, compared to 2005.
For details, first, in 2017, CCPSN had a higher hierarchy structure of nodes, more independent paths, lower network agglomeration, and lower network efficiency, which indicates that: (1) the status of core ports was more prominent, and heterogeneity of the network was apparent, (2) the standby path increased, (3) the node connections were weakened, and (4) the transmission efficiency was lower. Second, under different attack modes, CCPSN’s abilities to absorb risks and resist the changes, which are heterogenous. Specifically, the network under BA has a weak capacity, network under RA has a more substantial capacity. In 2017, the lowest value of network indicators, under different attack modes, was lower than 2015’s situation; however, the whole network did not collapse, which means that the endurance and resistance of CCPSN enhanced. Third, there are many similarities between the recovery processes in 2005 and 2017, as follows: the similar recovery speed under different recovery modes; different network indicators responding differently under the same recovery mode, when considering the same type of attack; the same one network indicator (the four subgraphs in the same column) showing a similar recovery mode after facing different attacks. For connectivity and efficiency, BR was always the faster recovery mode, regarding the recovery to original network value, rather than other recovery modes, no matter what kind of attack mode. For independent path, DR always was the faster recovery mode than other recovery modes. The main difference between 2005 and 2017 was that the average proportion of nodes that needed to be restored to the original level from attacks was lower than the 2005 statistic, thus indicating that the overall recovery speed of CCPSN increased in 2017. The resilience index of various network indicators is different (e.g., network connectivity shows higher resilience on the attacks than other indicators). Finally, shipping network optimization and recovery strategies are proposed, according to the prevention state, resistance state, and restoration state analysis. More hub ports should be established, in order to share the risks of core ports in the hub-spoke network, and emergency measures should be taken for important hub ports in advance. The recovery strategies for the ports should follow the sequence of ports ordered by the recovery modes in different contexts (considering the characteristics of the shipping network and applications to choose the recovery mode).
The above conclusions show that the resilience framework of CPSN, from the holistic perspective, can comprehensively analyze the resilience of CPSN’s structure. Different attack models can better simulate destructive events, and the calculation of network indicators can better analyze the changes of the resilience of network structure, both before and after destructive events; Meanwhile, the differences of network efficiency, independent path, and connectivity were mainly reflected in the recovery speed, recovery mode, and resilience index under the scenario simulation, all of which better answers the aforementioned questions.

Author Contributions

Conceptualization, Y.H. and Y.Y.; methodology, Y.H.; software, Y.H.; validation, Y.H.; formal analysis, Y.H.; investigation, Y.H. and X.Z.; resources, Y.H.; data curation, Y.H.; writing—original draft preparation, Y.H.; writing—review and editing, Y.H., Y.Y., M.W. and X.Z.; visualization, Y.H.; supervision, Y.Y.; funding acquisition, Y.Y. All authors have read and agreed to the published version of the manuscript.

Funding

National Natural Science Foundation of China (41971198, 41571155).

Institutional Review Board Statement

Not applicable.

Informed Consent Statement

Not applicable.

Data Availability Statement

Not applicable.

Conflicts of Interest

The authors declare no conflict of interest.

References

  1. Investigation Report on the Particularly Serious Fire and Explosion Accident in the Dangerous Goods Warehouse of Ruihai Company in Tianjin Port. Available online: http://www.gov.cn/foot/2016-02/05/content_5039788.htm (accessed on 19 July 2022).
  2. Tianjin Binhai Explosion Accident: The Explosion Affects the Operation of Tianjin Port, and the Iron Ore Trade May Be Impacted. Available online: https://tv.cctv.com/2015/08/14/VIDE1439512658440860.shtml (accessed on 19 July 2022).
  3. Ganin, A.A.; Mersky, A.C.; Jin, A.S.; Kitsak, M.; Keisler, J.M.; Linkov, I. Resilience in Intelligent Transportation Systems (ITS). Transp. Res. Part C Emerg. Technol. 2019, 100, 318–329. [Google Scholar] [CrossRef]
  4. Notteboom, T.; Pallis, T.; Rodrigue, J.-P. Disruptions and resilience in global container shipping and ports: The COVID-19 pandemic versus the 2008–2009 financial crisis. Marit. Econ. Logist. 2021, 23, 179–210. [Google Scholar] [CrossRef]
  5. Chang, S.E. Disasters and transport systems: Loss, recovery and competition at the Port of Kobe after the 1995 earthquake. J. Transp. Geogr. 2000, 8, 53–65. [Google Scholar] [CrossRef]
  6. Tang, C.S. Robust strategies for mitigating supply chain disruptions. Int. J. Logist. Res. Appl. 2006, 9, 33–45. [Google Scholar] [CrossRef]
  7. Obama, B. Presidential Policy Directive–Critical Infrastructure Security and Resilience. Available online: https://obamawhitehouse.archives.gov/the-press-office/2013/02/12/presidential-policy-directive-critical-infrastructure-security-and-resil (accessed on 23 June 2022).
  8. Department for Transport Transport Resilience Review: Recommendations. Available online: https://www.gov.uk/government/publications/transport-resilience-review-recommendations (accessed on 23 June 2022).
  9. Outline of the National Comprehensive Three-Dimensional Transport Network Plan in 2021. Available online: http://www.gov.cn/zhengce/2021-02/24/content_5588654.htm (accessed on 19 July 2022).
  10. Ducruet, C.; Notteboom, T. The worldwide maritime network of container shipping: Spatial structure and regional dynamics. Glob. Netw. 2012, 12, 395–423. [Google Scholar] [CrossRef] [Green Version]
  11. Ducruet, C.; Rozenblat, C.; Zaidi, F. Ports in multi-level maritime networks: Evidence from the Atlantic (1996–2006). J. Transp. Geogr. 2010, 18, 508–518. [Google Scholar] [CrossRef] [Green Version]
  12. Wu, D.; Wang, N.; Yu, A.; Guan, L. Vulnerability and risk management in the Maritime Silk Road container shipping network. Acta Geogr. Sin. 2018, 73, 1133–1148. [Google Scholar] [CrossRef]
  13. Guo, J.; He, Y.; Wang, S.; Wu, L. Rank-size distribution changes and transportation network connections of the coastal container port system in Chinese mainland since 1985. Geogr. Res. 2019, 38, 869–883. [Google Scholar] [CrossRef]
  14. Guo, J.; He, Y.; Hou, Y. Spatial connection and regional difference of the coastal container port shipping network of China. Prog. Geogr. 2018, 37, 1499–1509. [Google Scholar] [CrossRef]
  15. Walker, A.R. Recessional and Gulf war impacts on port development and shipping in the Gulf States in the 1980’s. GeoJournal 1989, 18, 273–284. [Google Scholar] [CrossRef]
  16. Monie, G.; Rodrigue, J.-P.; Notteboom, T. Economic Cycles in Maritime Shipping and Ports: The Path to the Crisis of 2008. Integr. Seapt. Trade Corridors 2009. Available online: https://www.researchgate.net/publication/229045634_Economic_Cycles_in_Maritime_Shipping_and_Ports_The_Path_to_the_Crisis_of_2008 (accessed on 31 July 2022).
  17. Xu, H.; Itoh, H. Density economies and transport geography: Evidence from the container shipping industry. J. Urban Econ. 2018, 105, 121–132. [Google Scholar] [CrossRef] [Green Version]
  18. Wang, C.; Ducruet, C. Regional Resilience and Spatial Cycles: Long-Term Evolution of the Chinese Port System (221bc–2010ad). Tijdschr. Voor Econ. En Soc. Geogr. 2013, 104, 521–538. [Google Scholar] [CrossRef] [Green Version]
  19. Rousset, L.; Ducruet, C. Disruptions in Spatial Networks: A Comparative Study of Major Shocks Affecting Ports and Shipping Patterns. Netw. Spat. Econ. 2020, 20, 423–447. [Google Scholar] [CrossRef]
  20. Justice, V.; Bhaskar, P.; Pateman, H.; Cain, P.; Cahoon, S. US container port resilience in a complex and dynamic world. Marit. Policy Manag. 2016, 43, 179–191. [Google Scholar] [CrossRef]
  21. Zhang, X.; Miller-Hooks, E.; Denny, K. Assessing the role of network topology in transportation network resilience. J. Transp. Geogr. 2015, 46, 35–45. [Google Scholar] [CrossRef] [Green Version]
  22. O’Kelly, M.E. Network Hub Structure and Resilience. Netw. Spat. Econ. 2015, 15, 235–251. [Google Scholar] [CrossRef]
  23. Shen, Z.; Xu, X.; Li, J.; Wang, S. Vulnerability of the Maritime Network to Tropical Cyclones in the Northwest Pacific and the Northern Indian Ocean. Sustainability 2019, 11, 6176. [Google Scholar] [CrossRef] [Green Version]
  24. Fang, Z.; Yu, H.; Lu, F.; Feng, M.; Huang, M. Maritime network dynamics before and after international events. J. Geogr. Sci. 2018, 28, 937–956. [Google Scholar] [CrossRef] [Green Version]
  25. Verschuur, J.; Koks, E.E.; Hall, J.W. Port disruptions due to natural disasters: Insights into port and logistics resilience. Transp. Res. Part Transp. Environ. 2020, 85, 102393. [Google Scholar] [CrossRef]
  26. Wang, L.; Ye, F.; Zheng, Y. The Assessment of Sino-US Container Shipping Network Evolution and vulnerability. Econ. Geogr. 2020, 40, 136–144. [Google Scholar]
  27. Reggiani, A.; Nijkamp, P.; Lanzi, D. Transport resilience and vulnerability: The role of connectivity. Transp. Res. Part Policy Pract. 2015, 81, 4–15. [Google Scholar] [CrossRef]
  28. He, Y.; Yang, Y.; Guo, J. Vulnerability of the shipping network of China’s coastal container ports under disruption simulation. Resour. Sci. 2022, 44, 414–424. [Google Scholar] [CrossRef]
  29. Madni, A.M.; Jackson, S. Towards a Conceptual Framework for Resilience Engineering. IEEE Syst. J. 2009, 3, 181–191. [Google Scholar] [CrossRef]
  30. Li, Y.; Kim, H. Assessing Survivability of the Beijing Subway System. Int. J. Geospat. Environ. Res. 2014, 1, 3. [Google Scholar]
  31. Holling, C.S. Resilience and Stability of Ecological Systems. Annu. Rev. Ecol. Syst. 1973, 4, 1–23. [Google Scholar] [CrossRef] [Green Version]
  32. Cox, A.; Prager, F.; Rose, A. Transportation security and the role of resilience: A foundation for operational metrics. Transp. Policy 2011, 18, 307–317. [Google Scholar] [CrossRef]
  33. Ahern, J. Urban landscape sustainability and resilience: The promise and challenges of integrating ecology with urban planning and design. Landsc. Ecol. 2013, 28, 1203–1212. [Google Scholar] [CrossRef]
  34. Alderson, D.L.; Brown, G.G.; Carlyle, W.M. Operational Models of Infrastructure Resilience. Risk Anal. 2015, 35, 562–586. [Google Scholar] [CrossRef] [PubMed] [Green Version]
  35. Fletcher, D.; Sarkar, M. Psychological resilience: A review and critique of definitions, concepts, and theory. Eur. Psychol. 2013, 18, 12–23. [Google Scholar] [CrossRef] [Green Version]
  36. Martin, R.; Sunley, P. On the notion of regional economic resilience: Conceptualization and explanation. J. Econ. Geogr. 2015, 15, 1–42. [Google Scholar] [CrossRef] [Green Version]
  37. Wears, R. Resilience Engineering: Concepts and Precepts | BMJ Quality & Safety. BMJ Qual. Saf. 2006, 15, 447–448. [Google Scholar]
  38. Pregenzer, A.L. Systems Resilience: A New Analytical Framework for Nuclear Nonproliferation; Sandia National Laboratories (SNL): Albuquerque, NM, USA; Livermore, CA, USA, 2011. [Google Scholar]
  39. Iervolino, I.; Giorgio, M. Stochastic Modeling of Recovery from Seismic Shocks. In Proceedings of the 12th International Conference on Applications of Statistics and Probability in Civil Engineering, Vancouver, BC, Canada, 12–15 July 2015. [Google Scholar]
  40. Haimes, Y.Y. On the Definition of Resilience in Systems. Risk Anal. 2013, 29, 498–501. [Google Scholar] [CrossRef] [PubMed]
  41. Eraydin, A.; Taşan-Kok, T. Resilience Thinking in Urban Planning. 2013. Available online: https://www.researchgate.net/publication/321612017_Resilience_Thinking_in_Urban_Planning (accessed on 1 August 2022).
  42. Ducruet, C.; Lee, S.-W.; Ng, A.K.Y. Centrality and vulnerability in liner shipping networks: Revisiting the Northeast Asian port hierarchy. Marit. Policy Manag. 2010, 37, 17–36. [Google Scholar] [CrossRef]
  43. Kaluza, P.; Kölzsch, A.; Gastner, M.T.; Blasius, B. The complex network of global cargo ship movements. J. R. Soc. Interface 2010, 7, 1093. [Google Scholar] [CrossRef]
  44. Jufri, F.H.; Widiputra, V.; Jung, J. State-of-the-art review on power grid resilience to extreme weather events: Definitions, frameworks, quantitative assessment methodologies, and enhancement strategies. Appl. Energy 2019, 239, 1049–1065. [Google Scholar] [CrossRef]
  45. Chen, M.; Lu, H. Analysis of Transportation Network Vulnerability and Resilience within an Urban Agglomeration: Case Study of the Greater Bay Area, China. Sustainability 2020, 12, 7410. [Google Scholar] [CrossRef]
  46. Wang, X.; Miao, S.; Tang, J. Vulnerability and Resilience Analysis of the Air Traffic Control Sector Network in China. Sustainability 2020, 12, 3749. [Google Scholar] [CrossRef]
  47. Woods, D.D. Four concepts for resilience and the implications for the future of resilience engineering. Reliab. Eng. Syst. Saf. 2015, 141, 5–9. [Google Scholar] [CrossRef]
  48. Bruneau, M.; Chang, S.E.; Eguchi, R.T.; Lee, G.C.; O’Rourke, T.D.; Reinhorn, A.M.; Shinozuka, M.; Tierney, K.; Wallace, W.A.; von Winterfeldt, D. A Framework to Quantitatively Assess and Enhance the Seismic Resilience of Communities. Earthq. Spectra 2003, 19, 733–752. [Google Scholar] [CrossRef] [Green Version]
  49. Kwasinski, A. Quantitative Model and Metrics of Electrical Grids’ Resilience Evaluated at a Power Distribution Level. Energies 2016, 9, 93. [Google Scholar] [CrossRef]
  50. Folke, C. Resilience: The emergence of a perspective for social–ecological systems analyses. Glob. Environ. Chang. 2006, 16, 253–267. [Google Scholar] [CrossRef]
  51. Omer, M.; Mostashari, A.; Nilchiani, R.; Mansouri, M. A framework for assessing resiliency of maritime transportation systems. Marit. Policy Manag. 2012, 39, 685–703. [Google Scholar] [CrossRef]
  52. Amatriaín, J.M.I. Collapse: How Societies Choose to Fail or Surviveby Jared Diamond. Reis 2005, 111, 201–206. [Google Scholar] [CrossRef]
  53. Crespo, J.; Suire, R.; Vicente, J. Lock-in or lock-out? How structural properties of knowledge networks affect regional resilience. J. Econ. Geogr. 2014, 14, 199–219. [Google Scholar] [CrossRef]
  54. Huang, C.; Hu, B. Simulation Modeling and Analysis of the Group Relationship’s Resilience. Chin. J. Manag. Sci. 2014, 22, 686–690. [Google Scholar]
  55. Rao, Y.; Lin, J.; Hou, D. Evaluation method for network invulnerability based on shortest route number. J. Commun. 2009, 30, 113–117. [Google Scholar] [CrossRef]
  56. Xu, Y. Study of Robustness in Cmplex Interconnected System and Networks; Publishing House of Electronics Industry: Beijing, China, 2015; pp. 30–45. [Google Scholar]
  57. Ip, W.H.; Wang, D. Resilience and Friability of Transportation Networks: Evaluation, Analysis and Optimization. IEEE Syst. J. 2011, 5, 189–198. [Google Scholar] [CrossRef]
  58. Ouyang, M.; Dueñas-Osorio, L. Time-dependent resilience assessment and improvement of urban infrastructure systems. Chaos Interdiscip. J. Nonlinear Sci. 2012, 22, 033122. [Google Scholar] [CrossRef] [PubMed] [Green Version]
  59. Gao, Z.; Cao, H.; Zhang, K.; Liu, Y.; Geng, P. Research on Cascading of Complex Networks Based on Node Degree Attack. Informatiz. Res. 2020, 46, 47–51. [Google Scholar]
Figure 1. Structure resilience framework of CPSN.
Sustainability 14 09489 g001
Figure 2. Betweenness, degree, and strength of port nodes in China (2005, 2017).
Sustainability 14 09489 g002
Figure 3. Variations of network indicators under four attack modes.
Sustainability 14 09489 g003
Figure 4. Line graph of network indicators under four recovery modes in 2005.
Sustainability 14 09489 g004
Figure 5. Line graph of network indicators under four recovery modes in 2017.
Sustainability 14 09489 g005
Figure 6. Network resilience index in 2005 and 2017.
Sustainability 14 09489 g006
Publisher’s Note: MDPI stays neutral with regard to jurisdictional claims in published maps and institutional affiliations.

