Article

Fuzzy Analytic Hierarchy Process Used to Determine the Significance of the Contributing Factors for Generalized Travel Satisfaction

1
Research Institute of Highway, MOT, Transportation Industry Research and Development Center of Big Data Processing and Application Technologies for Comprehensive Transport, (HSTG), Beijing 100088, China
2
Beijing Key Laboratory of Traffic Engineering, College of Metropolitan Transportation, Beijing University of Technology, Beijing 100124, China
*
Author to whom correspondence should be addressed.
Sustainability 2022, 14(18), 11509; https://doi.org/10.3390/su141811509
Submission received: 8 August 2022 / Revised: 9 September 2022 / Accepted: 10 September 2022 / Published: 14 September 2022

Abstract

:
This study develops the Generalized Satisfaction with Travel Scale covering travelers’ all-round emotional experience and cognitive evaluation. After checking the validity by factor analysis, the key influencing factors are extracted by optimal scale regression, and then the influence degree of key influencing factors is determined based on the Analytic Hierarchy Process. The reliability and validity of the developed Generalized Satisfaction with Travel Scale meet the requirements. The dynamic travel parameters (travel pattern, travel duration, etc.) (βs1 = 0.448) have the most important impact on generalized travel satisfaction, followed by the demographic information (age, occupation, etc.) (βs2 = 0.220) and static travel parameters (travel period, travel purpose, etc.) (βs3 = 0.178), whereas the main travel areas (residential area, work/study area) (βs4 = 0.154) have the weakest influence. This study aims at developing a Generalized Satisfaction with Travel Scale for Chinese travelers and exploring the influencing factors so as to provide an efficient travel experience survey mechanism for relevant departments.

1. Introduction

The analysis of the travel decision process is crucial for travelers’ travel-behavior choice and the improvement of transportation-service level. In previous studies, researchers have generally used the utility theory to analyze the decision process of travel behavior. However, many researchers have deduced that the people’s travel-behavior decisions do not exactly follow the algorithms or models deduced from mathematical logic. In other words, the travel behavior does not exactly follow the utility theory [1]. This is due to the fact that the decision process of travel behavior is often subjective, and the random-utility theory has limitations in the analysis of subjectivity. To make up for the shortcomings of the utility theory in the study of travel behavior, many researchers have proposed using subjective well-being in order to analyze travel behavior [2] and explore the relationship between decision utility and experience utility from the perspective of well-being, which helps to deeply analyze the mechanism of transportation-mode selection and its inner law [3,4]. Subjective well-being refers to the overall satisfaction with life, including both emotional feelings and cognitive evaluation [5], which can be measured by a reliable scale [6]. Following the proliferation of studies on subjective well-being, studies on satisfaction in different areas of life have rapidly developed, and the study of travel satisfaction has attracted extensive attention in the transportation field. Travel satisfaction refers to the comprehensive evaluation of travelers on the transportation-service system and travel experience [7], whereas broad travel satisfaction includes narrow travel satisfaction (cognitive-evaluation level) and travel well-being (emotional-experience level). The travel process has a certain degree of influence on the physiological and psychological state of travelers, but the influence mechanism still needs to be further explored and studied. Therefore, the multidimensional feelings generated by travel, and how the travel process affects the traveler’s biopsychological state, is an important part of this study’s investigation. This paper mainly focuses on the systematic and detailed measurement of broad travel satisfaction, as well as the exploration of internal and external influencing factors of travel satisfaction.
This paper is organized as follows. Section 2 presents the employed materials and measures, including the improved Satisfaction with Travel Scale (STS), the broad travel-satisfaction questionnaire, and the data analysis. Section 3 presents the results of the improved broad travel-satisfaction scale survey. Section 4 provides a discussion of the results.

2. Literature Review

Well-being studies have shown that long commutes are one of the least satisfying daily activities [8] and that low levels of travel satisfaction spill over to low levels of life satisfaction [9,10]. Moreover, when there is a lack of comprehensive understanding for the broad travel satisfaction of the traveler’s travel process and its influencing factors, it will also constrain the level of transportation services. Therefore, it is necessary to study the traveler’s travel experience in the travel process, and we conducted a literature review from travel satisfaction-measurement methods and influencing factors.
In order to measure travel satisfaction more comprehensively, we reviewed the studies conducted by domestic and international scholars on the measurement of broad travel satisfaction. A series of scales have been developed and continuously validated in practice. For instance, Clark et al. [11] used the Subjective Well-Being Scale (SWB) and the General Health Questionnaire (GHQ-12) (including 12 questions to detect the phenomenon of psychological stress) to measure the emotional experience of broad travel satisfaction. In addition, the more authoritative American Time Use Survey (ATUS) [12] includes two positive-emotion items (happy, meaningful) and four negative-emotion items (sad, tired, stressed, painful), and the emotional intensity is used to measure emotional feelings related to travel. Moreover, the five-item Life Satisfaction with Life Scale (SWLS) [13] and a single-item question [14] are used to measure the cognitive-evaluation component of broad travel satisfaction. Furthermore, the Satisfaction with Travel Scale (STS) [15], which is developed based on the Swedish Core Affect Scales (SCAS) [16] and the SWLS, contains three separate constructs: cognitive evaluation, positive deactivation–negative activation, and positive deactivation–cognitive evaluation. De Vos [17] and Friman [18] evaluated the applicability of the STS. They deduced that the STS can reliably assess transportation policies. Other researchers measured the cognitive aspects of broad travel satisfaction through comprehensive evaluation questionnaires of transportation services. They borrowed foreign scales for their studies, and no common paradigm was formed. Wang [19] investigated four types of broad travel satisfaction using a homemade questionnaire: convenience, comfort, reliability, and safety. Wang [20] investigated metro satisfaction by designing an online questionnaire. Guo [21] explored satisfaction with bicycle travel through simple questions. Yin [22] investigated the broad travel satisfaction of travelers through a rough translation of the STS. In general, the understanding of broad travel satisfaction in China is not deep enough to provide basic support for decision-makers of relevant departments to improve the level of residents’ travel satisfaction.
To explore the factors influencing travel satisfaction, we sorted out two aspects based on the idea of a travel chain, including both travel-characteristic information and demographic information. Travel-characteristic information can reflect the objective dimension that affects travel satisfaction. Friman et al. [23] showed that the emotional experience after a work commute is related to transportation mode, travel time, etc. Leonhard et al. [24] explained the differences in narrow travel satisfaction under different transportation modes by studying the effects of the travel starting time, travel duration, travel distance, interaction during travel, etc. Li [25] used the ordered logistic model to analyze the factors affecting the travel experience. The study showed that the travel characteristics affecting travel experience mainly consist of travel duration, travel purpose, and whether there are interactions with others during the trip.
Demographic information, on the other hand, can reflect the subjective aspects that influence travel satisfaction. Susan et al. [26] showed that the commuting quality varies depending on the place of residence, commuting mode, occupation, and gender. Based on structural-equation modeling, Cao [27] showed that personal attributes (income, education, transportation costs, etc.) and travel characteristics (purpose of travel, length of time using motor vehicles, and period of time using motor vehicles) significantly affect travel expediency, travel comfort, and travel safety. Zhu [28] used the Analytic Hierarchy Process to show that personal rest, health status, interaction with others during travel, travel purpose, and education have more important impacts on the emotional experience of travel.
In summary, foreign researchers have conducted more systematic and detailed research on travelers’ broad traffic satisfaction, whereas domestic researchers have focused more on the cognitive evaluation of broad travel satisfaction, lacking measurement tools that include both fine-grained emotional experience and cognitive evaluation. Consequently, this paper aims at developing a more systematic and comprehensive Generalized Satisfaction with Travel Scale after standardizing foreign scales in Chinese and adapting them to the level of understanding of Chinese travelers. It then explores the key variables and importance of demographic information and travel-characteristic information that affect broad travel satisfaction. By deeply understanding the full range of travel satisfaction and its influencing factors in travelers’ travel process, this study provides basic support for government departments to measure and analyze broad travel satisfaction.

3. Materials and Methods

3.1. Questionnaire Design

The questionnaire contains three parts:
The first part is the demographic information, which includes gender, age, education, marital status, and other information.
The second part is the travel-characteristic information, which integrates the above-mentioned large number of references, as well as the travel-chain idea, and divides 3 travel patterns (Figure 1) with the current traffic situation in Beijing, including the information on connection time, travel duration, travel period, travel distance, and number of transfers.
The third part is the design of the Generalized Satisfaction with Travel Scale. Besides considering the cognition and emotion, fine-grained divisions of emotion were considered: mood states, mental states, temporal feelings, and states of exuberance. The scale was based on STS [15], combined with SWLS [13] and SCAS [16] in order to select English mood-word pairs or English question items, and combined with the English and Chinese interpretations of the Oxford Dictionary to form the interview information of the Generalized Satisfaction with Travel Scale. Afterwards, in order to obtain the general understanding of English emotional word pairs and English question items, interviews were performed based on the Constructivist’s Approach to Grounded Theory [29]. Based on the interview results, the first draft of the Generalized Satisfaction with Travel Scale was formed after several discussions and arguments. Finally, several experts in the field of transportation were invited to correct and revise the scale. Furthermore, the scale grading was considered. The scale was generally graded 5-point scale [30], 7-point scale [31] or 9-point scale [15], considering that a too-fine grading would make the items less distinguishable and a too-coarse grading would make the measured subjective feelings not detailed enough. Therefore, this paper uses a moderate grading of 7 scales to test the respondents’ agreement level, where 1 indicates the least agreement and 7 indicates the highest one. The Generalized Satisfaction with Travel Scale is shown in Table 1.

3.2. Scale Design Interview

In the process of the questionnaire design, an interview based on rooting theory was performed. Rooting theory refers to building a theory on the basis of empirical information, starting from actual observations, inducting empirical generalizations from primary sources, and then rising to a theory. As mentioned by Wang et al. [32], the rooting theory is a systematic inductive method that explores the motives behind phenomena through the observation of actual phenomena, and it explains complex social phenomena. After continuous studies, three main methodologies of rooting theory exist, which are the three major schools of rooting theory: the classical rooting theory (original version), the procedural grounding theory, and the constructive rooting theory [33].
The major difference between the constructive rooting theory and the other two theories is that the other two emphasize that the researcher should maintain an appropriate distance during the research process so as not to infiltrate personal biases and pre-assumptions, whereas the constructive rooting theory follows constructivism and emphasizes that it is the researcher and the research participants who co-construct the meaning during the collection and analysis of data. Constructive rooting-theory research is a more flexible approach emphasizing the interaction between the researcher and the research participants. It is more suitable for the research of this topic, i.e., the real world is complex and diverse. In addition, any findings should come from the process of interaction, the interactive communication between the researcher and the participants should also be emphasized in the research process, and the theory should be co-constructed in the process [26]. Since the subject of this interview is the standardization of the Chinese Travel Perception Scale, the interview was conducted based on the constructive rooting theory. The interview topic was first determined. The interview process was then designed and the interview outline was written. Afterwards, the interviewers were recruited and the interview work was performed. Finally, the first draft of the Travel Satisfaction Scale was formed based on the interview results.

3.3. Questionnaire Survey

The questionnaire was divided into a pre-survey and a formal survey. The pre-survey was performed within a Driving Behavior Laboratory. A total of 24 travelers who had traveled on the same day were selected. They were told to propose questions that were not understood and ambiguous. The questionnaire was revised after the researcher collected feedback from the subjects. The formal test was distributed on the Questionnaire Star platform, limiting the IP address of the respondents to Beijing. In addition, there were trips in Beijing on the same day. The length of filling out the questionnaire was at least 100 s, and the valid questionnaire fillers were rewarded with a bonus of 6–8 RMB after the audit.

3.4. Data Analysis

The scale structure was tested using Cronbach’s coefficient and Confirmatory Factor Analysis (CFA). CFA mainly deals with the relationship between observed and latent variables. It is a valid tool for testing the structural validity of the scale [34].
Influence-factor screening was performed using optimal scale-regression analysis. Optimal scale regression can convert categorical variables into numerical types for statistical analysis, which greatly improves the processing ability of categorical variable data, breaks through the limitations of categorical variables on traditional regression analysis models, and expands the application ability of regression analysis [35]. Since the variable contained categorical variables of gender and transportation mode, the optimal scale-regression model was considered to ensure that the meaning of the categorical variables themselves was not missing.
The importance of the influencing factors was identified using the Fuzzy Analytic Hierarchy Process (FAHP). In the process of dealing with human perceptual decision-making problems, human preferences and judgments are often vague and uncertain. FAHP effectively combines the Analytic Hierarchy Process (AHP) and fuzzy comprehensive evaluation, which uses the fuzzy-evaluation method to quantify fuzzy problem thinking and can better help evaluate more subjective decision-making problems [36].

4. Results

4.1. Statistics Analysis

4.1.1. Demographic Analysis

We collected travel data from a total of 425 subjects and obtained travel data from 409 subjects after eliminating invalid responses based on problems such as short response time and inconsistent answers. The proportion of males and females among those who completed the questionnaire was 51.00% and 49.00%, respectively. This distribution is similar to the gender ratio of the 7th census in Beijing (male: 51.10%, female: 48.90%). Their average age was 38.80, with an SD of 12.304. A total of 25.62% had less than a college education, 74.38% had a bachelor degree or above, 61.19% were married, 44.28% had no children, and 55.72% had one or more children. The percentage of employees in the career, enterprise, and service industry was 61.19%, and that of students and others was 38.81%. The percentage of those having a monthly income below CNY 4500, in the range of CNY 4500–20,000, and greater than CNY 20,000 was 31.09%, 61.69%, and 7.22%, respectively.

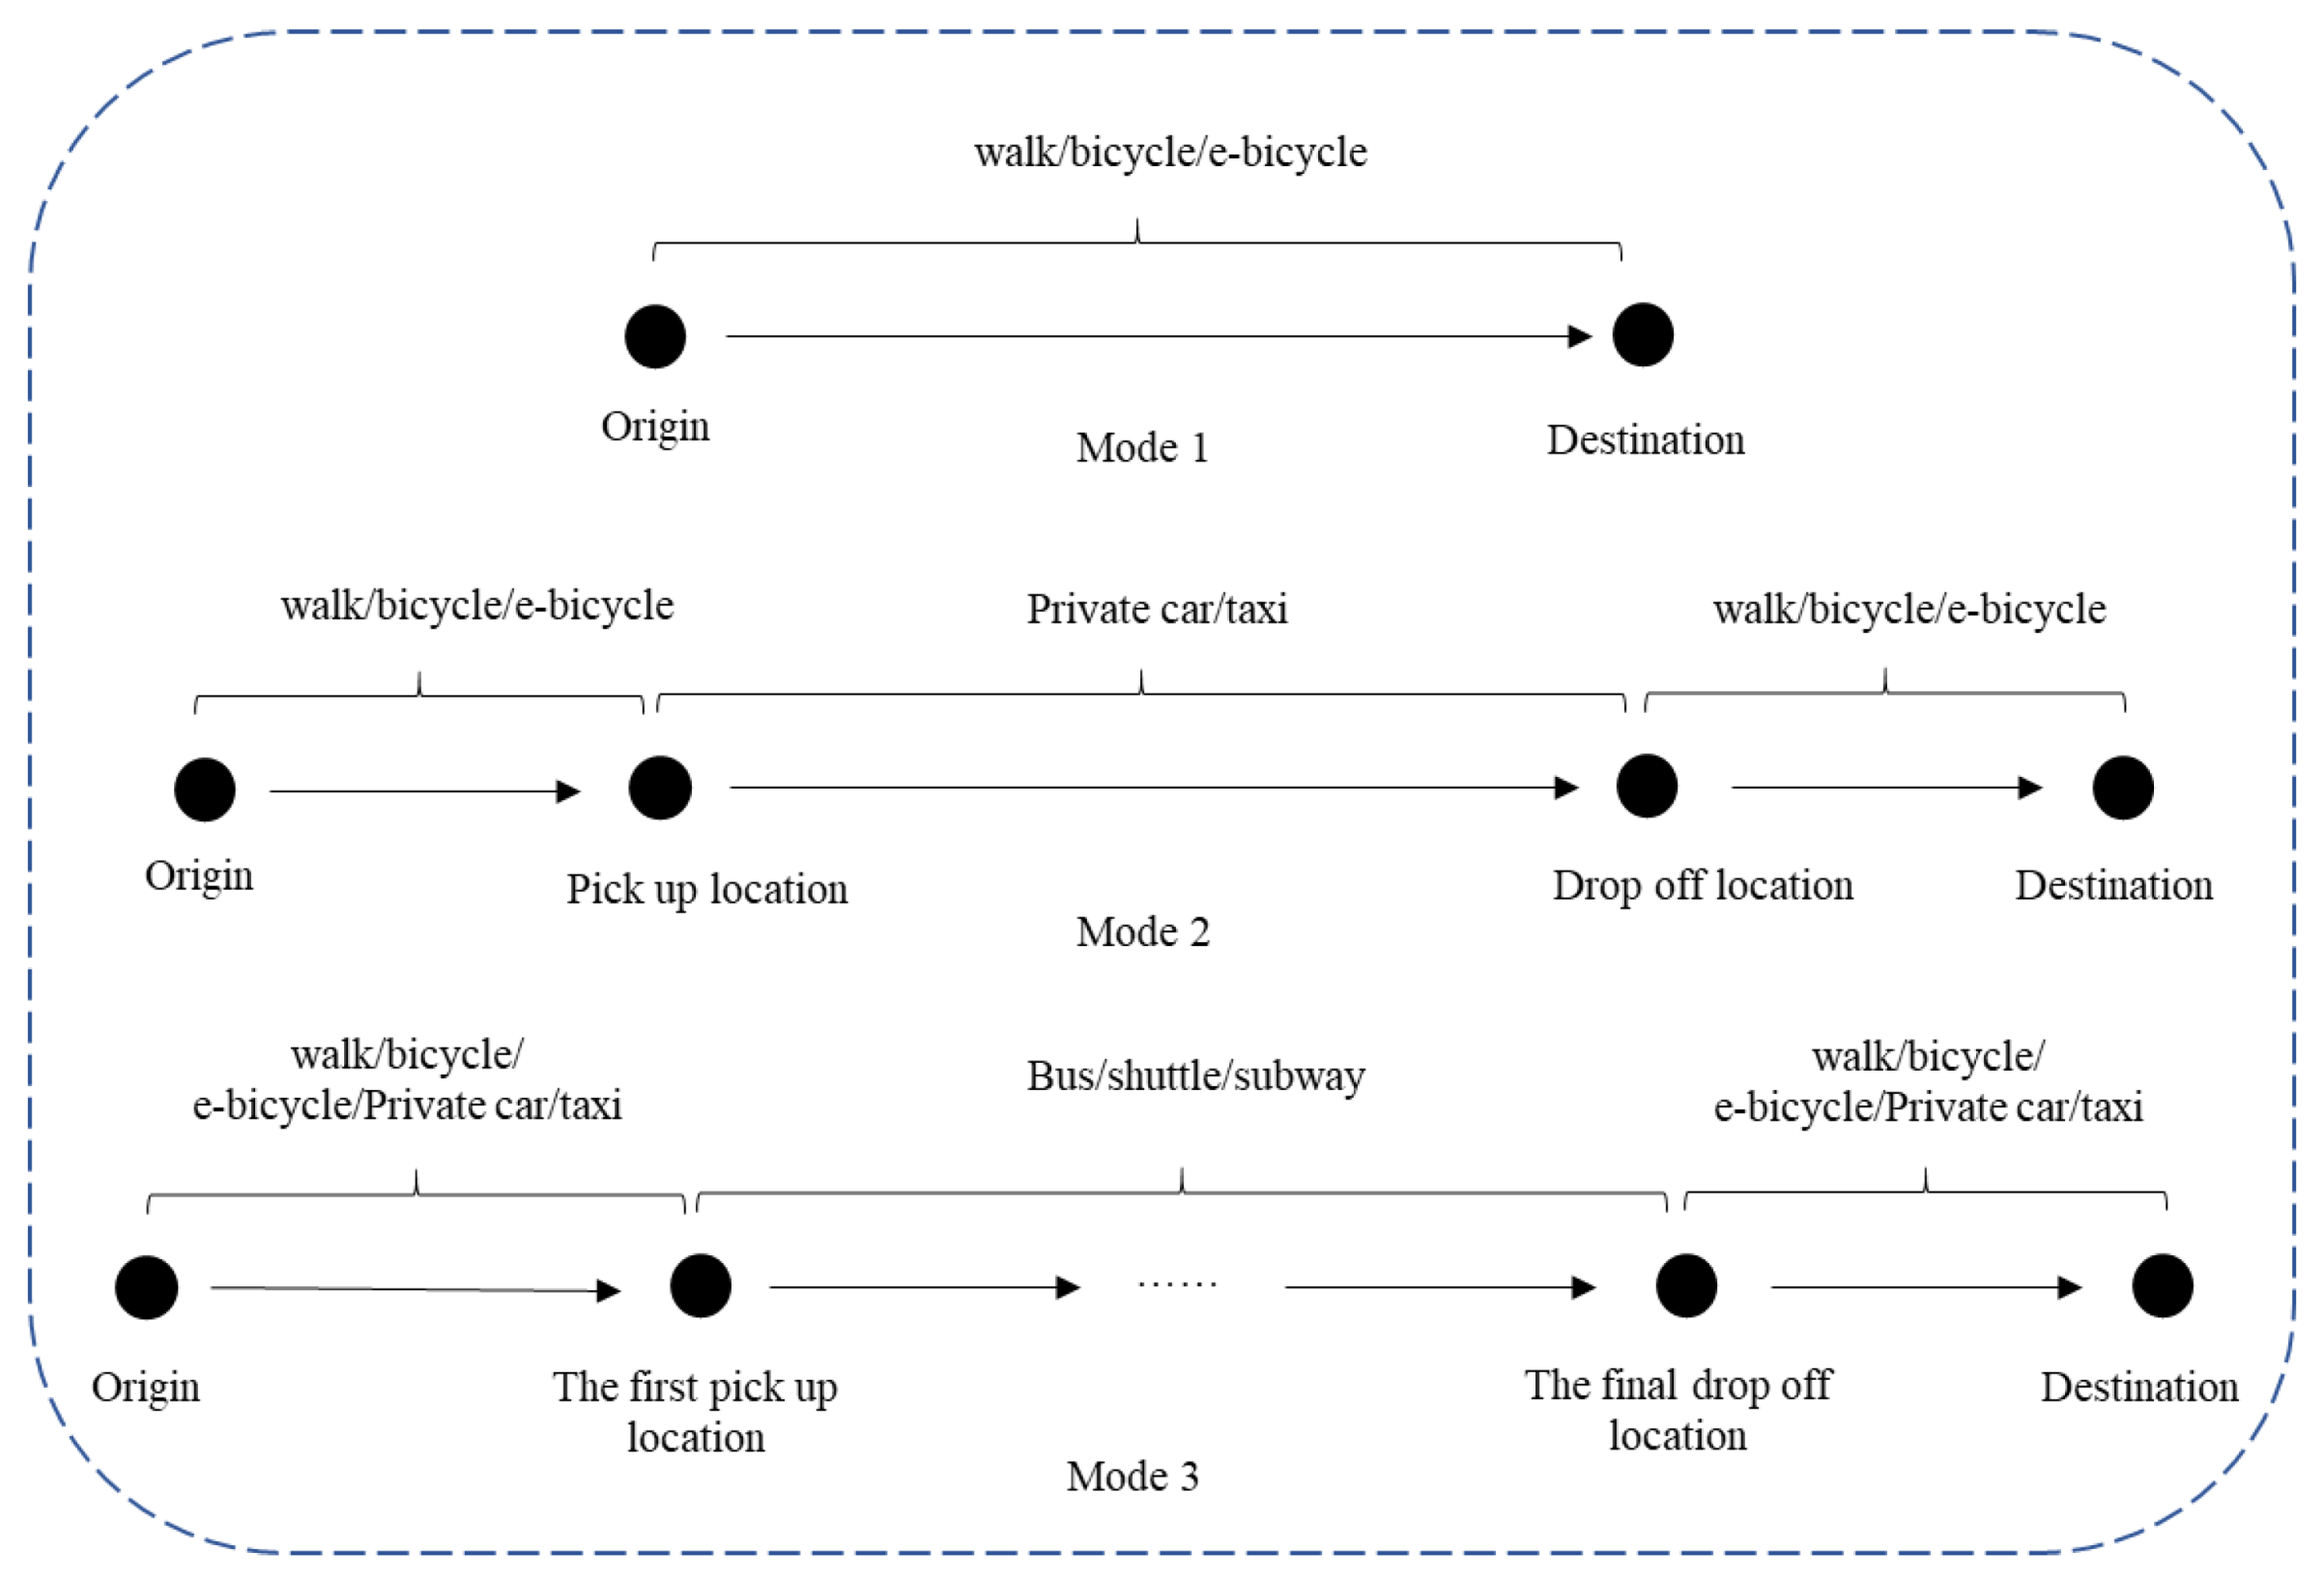
4.1.2. Transportation-Mode Statistics

The frequency of use of each mode of transport in the three kinds of travel patterns is shown in Table 2. Among the respondents, the frequencies of the three modes of transportation in travel pattern 1 were comparable, with more people walking and fewer people traveling by electric car. In addition, in travel pattern 2, more people traveled by private car, and was significantly higher than the number of cab trips. In travel pattern 3, the number of people traveling by subway was the highest, and the number of people traveling by shuttle bus was the lowest.
The frequency of each connection mode of the three kinds of travel patterns is shown in Table 3. The connection modes of travel pattern 2 included walking, bicycle, and electric vehicle, where walking was the main departure connection mode. The connection modes of travel pattern 3 included walking, bicycle, electric vehicle, cab, and private car. In addition, the main connection mode was also walking, followed by bicycle. The departure connection mode included private car but did not include cab, whereas the arrival connection mode included cab but not private car.

4.2. Validation of Scale Structure

Validated factor analysis was performed using AMOS 24.0, which requires a sample size of 5–10 times the observed variables [37]. The sample size selected for this study was 175, with 16 observed variables, which met the requirements. In addition, χ2/df = 2.411, GFI = 0.901, RMSEA = 0.076, NFI = 0.927, CFI = 0.967, and IFI = 0.967, which met the evaluation criteria [38]. The overall Clone Bach coefficient was 0.960, which is greater than 0.7. The total item correlation coefficient should be greater than 0.4. The factor-loading value should be higher than 0.60, the combined reliability should be greater than 0.7, and the mean extracted-variance value should be greater than 0.5 [38], as shown in Table 4. Moreover, all the items met the evaluation criteria. An exploratory factor analysis was also used to analyze the scale structure, and the results show that all the factor variables met their dimensional settings.

4.3. Influencing-Factor Screening

The dependent variable was the mean score of overall travel satisfaction. The demographic variables and travel-characteristic variables were used as independent variables for optimal scale-regression analysis. The complex correlation-coefficient R of the model was 0.524, which indicates that the linear-regression relationship between the independent and dependent variables was relatively close, and it is generally considered that an R greater than 0.4 is good enough in social-science studies [39]. In addition, the adjusted R2 was 13.9%, and the fitted model (p < 0.001) was statistically significant. The independent variables screened according to significance (<0.05) are shown in Table 5.

4.4. Identification of the Importance of the Influencing Factors

4.4.1. Exploratory Factor Analysis

Exploratory Factor Analysis (EFA) is able to synthesize intricate variable relationships into a few core factors [40]. The core factors are used to analyze as the intermediate layer. The KMO and Bartlett’s spherical test were used to determine whether it was suitable for factor analysis. The KMO value was 0.780 (>0.7) and the Bartlett’s spherical test p-value was less than 0.05, which was suitable for factor analysis. The maximum variance method was then used to extract the principal components and identify the core factors. The cumulative variance contribution of the core factors was 86.16%, which met the requirements of 50% [27]. As shown in Table 6, the absolute values of the factor loadings were greater than 0.5 [16], and four core factors were extracted among the 15 key influencing factors: dynamic travel parameters, demographic information, static travel parameters, and major travel areas. The overall Cronbach’s α coefficient was 0.619, and the Cronbach’s α coefficient for each scale was greater than 0.45 (cf. Table 7), which indicates that the internal consistency of the scales was acceptable [41].

4.4.2. Fuzzy Analytic Hierarchy Process

  • Building a hierarchical model
The hierarchical model was constructed by decomposing the results of factor analysis layer by layer. The system evaluation objectives, core factors, and evaluation indicators were divided into the highest, middle, and lowest levels according to their interrelationships [42] (cf. Figure 2).
  • Constructing the judgment matrix
When determining the weights between levels and factors, qualitative analysis is often not accurate enough, and a two-by-two comparison can reduce the difficulty of comparing different factors with each other. Based on the factor-analysis eigenvalues and optimal scale-importance coefficient, the relative importance of secondary and tertiary indicators (two by two) was determined with the 0.1~0.9 nine-scale method (Table 8). The fuzzy judgment matrix was constructed are shown in Figure 3.
The constructed fuzzy judgment matrix is shown in Figure 3:
  • Fuzzy consistency matrix construction
When comparing two factors, there is the influence of judgment subjectivity and problem complexity, which often leads to the construction of a non-consistent matrix, so the fuzzy judgment matrix needs to be adjusted to a fuzzy consistency matrix. The row sum-transformation method was used for the consistency of the fuzzy judgment matrix. The fuzzy consistency matrix was constructed using Equations (1) and (2) (Figure 4).
r i = j = 1 n a i j , i = 1 , 2 , , n , j = 1 , 2 , , n
r i j = r i r j 2 n + 0.5
  • The accuracy of the weight-error checking
It is important to test the accuracy of the weights for each index. The weight-error accuracy indicates whether the calculated index weights are consistent with the subjective human perception. When the calibration error is 0, it indicates complete consistency, but generally speaking, an error < 0.1 can be considered to satisfy the requirements. The correction method of complementary matrix weights is not perfect, but the mutual inverse type is well established. Therefore, the matrix A = (aij)n × n was transformed into the mutual inverse judgment matrix B = (bij)n × n and then tested using Equations (2) and (3). The test results show (Table 9) that the constructed judgment matrix had good consistency.
b i j = a i j a j i
C I = λ m a x n n 1
CR = C I R I
where
λ m a x is the eigenvalue of the fuzzy mutual inverse-type consistency judgment matrix
n is the dimension of the fuzzy mutual inverse-type consistency judgment matrix
RI is the consistency coefficient, considered according to Table 10.
Table 9. Consistency test results.
VariablesRICICRConsistency
Middle hierarchy indicators0.900.0470.042Fine
Demographic information0.900.0110.009Fine
Static travel parameters0.580.0090.005Fine
Major travel areas000Fine
Dynamic travel parameters1.240.0230.028Fine
  • Hierarchical ranking
The weights of the fuzzy consistency matrix R = (rij)n × n were obtained according to the weight formula, and then the weights of the lowest-level index and the middle-level index were multiplied and summed up layer by layer to obtain the comprehensive weights (Table 11).
w i = 1 n 1 2 θ + 1 n × θ k = 1 n r i k , i = 1 , 2 , , n ,   θ = n 1 2
The weights of the middle hierarchies responded to the influence degree of the middle hierarchies on generalized travel satisfaction. Dynamic travel parameters had the greatest influence on generalized travel satisfaction (WM1 = 0.383), followed by demographic information and static travel parameters (WM2 = 0.239, WM3 = 0.206), and the least was major travel areas (WM4 = 0.172).
The weights of lowest hierarchies responded to the influence degree of indicators within each dimension on different dimensions. Among the dynamic travel parameters, the most influential were travel pattern and mode of transportation (WL11 = 0.215, WL12 = 0.215), followed by travel duration, arrival pickup time, and transfer time (WL13 = 0.175, WL14 = 0.151, WL15 = 0.143), and the least influential was departure pickup time (WL16 = 0.103). Among the demographic information, the most influential were age and number of children (WL21 = 0.339, WL22 = 0.306), followed by occupation (WL23 = 0.0228), and the least influential was education (WL23 = 0.128). Among the static travel parameters, the most influential was travel period (WL31 = 0.458), followed by total number of trips (WL32 = 0.383), and the least influential was (WL33 = 0.158). Among the main work areas, the most influential was the residential area (WL41 = 0.567) and the least influential was the work/study area (WL42 = 0.433).
In the synthetic weights, the impact of each indicator on broad travel satisfaction was reflected. The area of residence (SW1 = 0.098), travel period (SW2 = 0.094), travel pattern (SW3 = 0.082), mode of transportation (SW4 = 0.082), and age (SW5 = 0.081) had more critical effects on the generalized travel satisfaction. In addition, the more significant effects were the number of trips (SW6 = 0.079), work/study area (SW7 = 0.075), number of children (SW8 = 0.073), and travel duration (SW9 = 0.067). The arrival pickup time (SW10 = 0.058), transfer time (SW11 = 0.055), occupation (SW12 = 0.054), departure pickup time (SW13 = 0.039), trip purpose (SW14 = 0.033), and education (SW15 = 0.031) had less influence on broad travel satisfaction.

5. Discussion

As travel efficiency continues to improve, the subjective experience of the travel process begins to become a more important concern. This paper aimed to propose a more comprehensive travel-satisfaction scale and explore the relative importance and hierarchical structure that affects broad travel satisfaction. First, we proposed a Generalized Satisfaction with Travel Scale from the perspective of well-being, which includes travelers’ emotional feelings and cognitive evaluation of the travel process. In addition, the influencing factors of generalized travel satisfaction were explored based on the idea of the travel chain, which mainly includes two parts: the influence of primary indicators on generalized travel satisfaction and the comprehensive influence of secondary indicators on generalized travel satisfaction.
The proposed Generalized Satisfaction with Travel Scale can measure travelers’ travel satisfaction in more detail and overcome the problems of measuring travel satisfaction in China, which is often specific to specific transportation modes and directly translated from foreign scales. The Generalized Satisfaction with Travel Scale was based on the STS, SWLS, and SCAS, and it expands the emotional and cognitive dimensions of the STS to evaluate the emotional feelings of travelers in four dimensions in more detail. The evaluation of domestic travel satisfaction often suffers from the problem of targeting specific transportation modes and direct translation [43]. The proposed scale can measure the travel chain and takes into account the level of understanding of Chinese travelers in the case of cultural differences.
With the factors that are most likely to influence broad travel satisfaction a three-level evaluation system was constructed. In the established evaluation system, the dynamic travel parameter was the most important primary indicator, indicating that the combination of travel time and travel mode remains a key factor influencing broad travel satisfaction [44]. In addition, it is interesting to note the greater degree of influence of demographic information, which is consistent with Liu’s study [45]. It is not surprising that individual attributes of travelers often lead to large differences in perceptions of the travel process; for example, occupation may produce differences in time flexibility. Thus, different travel perceptions may arise between different individual attributes. Second, the effect of static travel parameters on generalized travel satisfaction was small, which differs significantly from Chen’s [46] study. This may be due to the more refined emotional feelings and cognitive evaluations. Finally, the main travel areas had the least impact.
Among the secondary indicators, the area of residence and travel period had the most significant impact on broad travel satisfaction. The area of residence relates to traffic conditions, which affect subjective perceptions of the traveler, such as accessibility and delays on the road. Whether the travel period was at a flat peak played a key role in broad travel satisfaction, which is consistent with previous studies [47]. In addition, the effects of travel pattern, mode of transportation, and age were very important. There is an interaction between different modes of travel and travel perceptions. Fan [48] showed that bicyclists have a more positive impact on travelers, whereas public transportation is more likely to produce negative feelings such as fear of being late and having a sense of stress. The effect of age on broad travel satisfaction may be due to the stressful life of the traveler. The effects of total number of trips, work/study area, and number of children on broad trip satisfaction were also more important. When the number of travelers is higher, more interactions during the trip will enhance happiness during the trip [28]. The environment of the work/study area, which is the main travel area of the traveler, significantly affects broad travel satisfaction [49]. The mechanism of how the number of children affects travel satisfaction remains unclear, possibly through patience, but the mechanism underlying this effect still needs to be explored in more detail. Interestingly, the travel-time category had a smaller impact on broad travel satisfaction, which may be due to the more complex impact of travel time. On the one hand, travel time itself is not necessarily a waste of time for the traveler, but may be an enjoyment [50]. On the other hand, efficient use of time during travel may relieve the stress of the traveler [51]. This stress and enjoyment play an important role simultaneously [52] and may weaken the effect on travel satisfaction due to the large differences in travel patterns. Therefore, the effect of travel time-type indicators on broad travel satisfaction deserves more qualitative research to try to explain the existence of this complex relationship.
The main limitation of this paper is that the comprehensiveness of the sample needs to be further enhanced, and in the future, an expanded sample will be conducted in different cities and regions, and a tracking survey on the travel process of travelers is expected to be conducted using an app in order to obtain more accurate and comprehensive findings. In addition, the study can further explore the interaction between influencing factors, such as the influence of travel time of different travel modes on travel satisfaction.

6. Conclusions

This study first develops a Generalized Satisfaction with Travel Scale after standardizing and improving the SWLS, STS, and SCAS in Chinese, and uses validation factor analysis to test the structural validity of the scale. The optimal scale regression analysis is then used to extract the key influencing factors. Afterward, hierarchical analysis is used to further determine the importance of each key influencing factor. The findings of the study are summarized as follows.
(1) The developed Generalized Satisfaction with Travel Scale, covering emotional experience and cognitive evaluation, can efficiently measure broad travel satisfaction. The measured emotions are detailed and systematic, which is conducive to identifying all-round travel satisfaction.
(2) The key influencing factors of generalized travel satisfaction can be divided into four dimensions: dynamic travel parameters, demographic information, static travel parameters, and major travel areas.
(3) The dynamic travel parameters have the greatest impact on broad travel satisfaction, which is determined by the expectation of travel. This also indicates that the speed of travelers’ movement in time and space has a greater impact on their cognitive evaluation and on their fine-grained emotional experience, which cannot be ignored. In addition, the influence of demographic information on travel satisfaction is also more significant, and the impact of differences such as flexibility time determined by individual attributes on travel satisfaction should also be taken into account. Finally, although the impact of static travel parameters and major travel areas on broad travel satisfaction is relatively small, the impact of some of their indicators on broad travel satisfaction should also be carefully considered.
The standardized Generalized Satisfaction with Travel Scale developed in this paper is suitable for Chinese travelers. It not only provides a fine-grained portrayal of travelers’ emotional feelings in the process of travel from multidimensional emotional states, but also overcomes the problem of cognitive evaluation of a single mode in most previous studies. The study aims to provide an effective tool for government departments to measure the broad travel satisfaction of Chinese travelers in a comprehensive manner, and to inject fresh blood of “traveler’s emotional experience” into transportation planning and design from a human-centered perspective. It is also expected to help traffic planners and traffic managers to take targeted traffic-management measures to improve the traffic-service level by effectively identifying the influence of multiple individual attributes and travel characteristics on broad travel satisfaction.

Author Contributions

Conceptualization, L.Z., H.Z., D.L., L.Y. and X.Z.; methodology, L.Z., H.Z., D.L., L.Y. and X.Z.; software, L.Z., H.Z., D.L., L.Y. and X.Z.; validation, L.Z., H.Z., D.L., L.Y. and X.Z.; formal analysis, L.Z., H.Z., D.L., L.Y. and X.Z.; investigation, H.Z., L.Y. and X.Z.; resources, L.Z., H.Z., D.L., L.Y. and X.Z.; data curation, L.Z., H.Z., D.L., L.Y. and X.Z.; writing—original draft preparation, H.Z., L.Y. and X.Z.; writing—review and editing, L.Z., H.Z., D.L., L.Y. and X.Z.; visualization, L.Z., H.Z., D.L., L.Y. and X.Z.; supervision, L.Z., H.Z., D.L., L.Y. and X.Z.; project administration, L.Z. and D.L.; funding acquisition, L.Z. and D.L. All authors have read and agreed to the published version of the manuscript.

Funding

This research was funded by the National Key Research and Development Program of China, grant number [2018YFB1601300]; the Central Public-interest Scientific Institution Basal Research Fund, grant number [2019-0111, S262018049]; and the Urban Travel Perceptions Measurement Project, grant number [40038001202042].

Institutional Review Board Statement

Since the questionnaire did not involve questions of a private nature and the subjects were informed before answering the questionnaire, ethical review and approval were waived for this study.

Informed Consent Statement

Informed consent was obtained from all subjects involved in the study.

Data Availability Statement

Not applicable.

Conflicts of Interest

The authors declare no conflict of interest. The funder had no role in the design of the study; in the collection, analyses, or interpretation of data; in the writing of the manuscript, or in the decision to publish the results.

References

  1. Ru, Y.; Ge, W.; Qing, F. A study on low carbon travel awareness, travel behavior and travel well-being. Hebei Ind. Sci. Technol. 2020, 37, 381–387. Available online: https://kns.cnki.net/kcms/detail/detail.aspx?FileName=HBGY202006001&DbName=CJFQ2020 (accessed on 8 May 2022).
  2. Ettema, D.; Gärling, T.; Olsson, L.E.; Friman, M. Out-of-Home Activities, Daily Travel, and Subjective Well-Being. Transp. Res. Part A Policy Pract. 2010, 44, 723–732. [Google Scholar] [CrossRef]
  3. Cao, Y. A Study of Travel Mode Choice Behavior from the Perspective of Happiness; Southeast University: Nanjing, China, 2018; Available online: https://kns.cnki.net/KCMS/detail/detail.aspx?dbname=CMFD201901&filename=1019822613.nh (accessed on 8 May 2022).
  4. Gan, Z.; Feng, T.; Yang, M. Exploring the Effects of Car Ownership and Commuting on Subjective Well-Being: A Nationwide Questionnaire Study. Sustainability 2018, 11, 84. [Google Scholar] [CrossRef]
  5. Ettema, D.; Gärling, T.; Olsson, L.E.; Friman, M.; Moerdijk, S. The road to happiness: Measuring Dutch car drivers’ satisfaction with travel. Transp. Policy 2013, 27, 171–178. [Google Scholar] [CrossRef]
  6. Bergstad, C.J.; Gamble, A.; Gärling, T.; Hagman, O.; Polk, M.; Ettema, D.; Friman, M.; Olsson, L.E. Subjective well-being related to satisfaction with daily travel. Transportation 2011, 38, 1–15. [Google Scholar] [CrossRef]
  7. Yanan, G. A Study on Travel Satisfaction and Subjective Well-Being Based on Behavioral Model; Chang’an University: Xi’an, China, 2018; Available online: https://kns.cnki.net/KCMS/detail/detail.aspx?dbname=CDFDLAST2019&filename=1018791555.nh (accessed on 4 September 2022).
  8. Lancée, S.; Veenhoven, R.; Burger, M. Mood during Commute in the Netherlands: What Way of Travel Feels Best for What Kind of People? Transp. Res. Part A Policy Pract. 2017, 104, 195–208. [Google Scholar] [CrossRef]
  9. De Vos, J. Analysing the Effect of Trip Satisfaction on Satisfaction with the Leisure Activity at the Destination of the Trip, in Relationship with Life Satisfaction. Transportation 2019, 46, 623–645. [Google Scholar] [CrossRef]
  10. Friman, M.; Gärling, T.; Ettema, D.; Olsson, L.E. How Does Travel Affect Emotional Well-Being and Life Satisfaction? Transp. Res. Part A Policy Pract. 2017, 106, 170–180. [Google Scholar] [CrossRef]
  11. Clark, B.; Chatterjee, K.; Martin, A.; Davis, A. How Commuting Affects Subjective Wellbeing. Transportation 2020, 47, 2777–2805. [Google Scholar] [CrossRef]
  12. Morris, E.A.; Guerra, E. Are We There yet? Trip Duration and Mood during Travel. Transp. Res. Part F Traffic Psychol. Behav. 2015, 33, 38–47. [Google Scholar] [CrossRef]
  13. Apply, H.T.; Service, C.; Watson, D.; Clark, L.A.; Cohen, S.; Measures, P.; Americans, A.; Gross, C.; Spielberger, C.; Diener, E.; et al. The Satisfaction with Life Scale. J. Personal. Assess. 1985, 49, 71–75. [Google Scholar] [CrossRef]
  14. Minkov, M. World Values Survey. In The Wiley-Blackwell Encyclopedia of Globalization; American Cancer Society: Atlanta, GA, USA, 2012. [Google Scholar] [CrossRef]
  15. Ettema, D.; Gärling, T.; Eriksson, L.; Friman, M.; Olsson, L.E.; Fujii, S. Satisfaction with Travel and Subjective Well-Being: Development and Test of a Measurement Tool. Transp. Res. Part F Traffic Psychol. Behav. 2011, 14, 167–175. [Google Scholar] [CrossRef]
  16. Västfjäll, D.; Friman, M.; Gärling, T.; Kleiner, M. The Measurement of Core Affect: A Swedish Self-Report Measure Derived from the Affect Circumplex. Scand. J. Psychol. 2002, 43, 19–31. [Google Scholar] [CrossRef]
  17. De Vos, J.; Schwanen, T.; Van Acker, V.; Witlox, F. How Satisfying Is the Scale for Travel Satisfaction? Transp. Res. Part F Traffic Psychol. Behav. 2015, 29, 121–130. [Google Scholar] [CrossRef]
  18. Friman, M.; Fujii, S.; Ettema, D.; Gärling, T.; Olsson, L.E. Psychometric Analysis of the Satisfaction with Travel Scale. Transp. Res. Part A Policy Pract. 2013, 48, 132–145. [Google Scholar] [CrossRef]
  19. Qian, W. A Comparative Study of Multi-Modal Travel Behavior Based on Structural Equation Modeling; Chang’an University: Xi’an, China, 2017; Available online: https://kns.cnki.net/KCMS/detail/detail.aspx?dbname=CMFD201801&filename=1017869833.nh (accessed on 12 May 2022).
  20. Wang, A. Research on Comprehensive Service Level of Urban Rail Transit Based on Passenger Perception; Wuhan University of Technology: Wuhan, China, 2018; Available online: https://kns.cnki.net/KCMS/detail/detail.aspx?dbname=CMFD201902&filename=1019832617.nh (accessed on 12 May 2022).
  21. Guo, C. A Study of Bicycle Rider Satisfaction on Urban Roads; Chang’an University: Xi’an, China, 2014; Available online: https://kns.cnki.net/KCMS/detail/detail.aspx?dbname=CMFD201501&filename=1014070563.nh (accessed on 12 May 2022).
  22. Yin, X. A Study on the Travel Well-Being of Urban Slow-Moving Transportation Travelers; Chang’an University: Xi’an, China, 2019; Available online: https://kns.cnki.net/KCMS/detail/detail.aspx?dbname=CMFD202001&filename=1019674223.nh (accessed on 12 May 2022).
  23. Friman, M.; Olsson, L.E.; Ståhl, M.; Ettema, D.; Gärling, T. Travel and Residual Emotional Well-Being. Transp. Res. Part F Traffic Psychol. Behav. 2017, 49, 159–176. [Google Scholar] [CrossRef]
  24. Lades, L.K.; Kelly, A.; Kelleher, L. Why Is Active Travel More Satisfying than Motorized Travel? Evidence from Dublin. Transp. Res. Part A Policy Pract. 2020, 136, 318–333. [Google Scholar] [CrossRef]
  25. Li, S. Analysis of the Relationship between Residents’ Travel Characteristics and Travel Well-Being and Health; Southeast University: Nanjing, China, 2019; Available online: https://kns.cnki.net/KCMS/detail/detail.aspx?dbname=CMFD202001&filename=1020720531.nh (accessed on 12 June 2022).
  26. Handy, S.; Thigpen, C. Commute Quality and Its Implications for Commute Satisfaction: Exploring the Role of Mode, Location, and Other Factors. Travel Behav. Soc. 2019, 16, 241–248. [Google Scholar] [CrossRef]
  27. Xing, C. Research on the Effectiveness of Traffic Demand Management in Beijing Based on Structural Equation Model; Beijing Jiaotong University: Beijing, China, 2016. [Google Scholar]
  28. Zhu, J.; Chen, S.; Li, S.; Cao, Z.; Zhang, Y.; Ding, X. The Influencing Factors of Travel Well- Being and Suggestions for Planning and Policy. J. Northwest Univ. Sci. Ed. 2020, 50, 8. [Google Scholar]
  29. Lian, Z. Analysis of factors influencing the integration of digital archival resources: A study based on constructive rooting theory. Arch. Lett. 2015, 226, 52–56. [Google Scholar] [CrossRef]
  30. Xing, S. An Empirical Study on the Satisfaction of Bicycle Sharing Trips among Business People Based on SEM; Shijiazhuang Railway University: Shijiazhuang, China, 2020; Available online: https://kns.cnki.net/KCMS/detail/detail.aspx?dbname=CMFD202101&filename=1020366912.nh (accessed on 12 June 2022).
  31. Ramos, É.M.S.; Bergstad, C.J.; Nässén, J. Understanding Daily Car Use: Driving Habits, Motives, Attitudes, and Norms across Trip Purposes. Transp. Res. Part F Traffic Psychol. Behav. 2020, 68, 306–315. [Google Scholar] [CrossRef]
  32. Wang, X.; Tan, Q. Research on user preference mining and recommendation mechanism of Internet platforms—An exploration based on classical rooting theory. Intell. Sci. 2020, 38, 49–56, 87. [Google Scholar] [CrossRef]
  33. Wang, H. A New Approach to Theoretical Constructs in Psychology—Rooting Theory; Jilin University: Changchun, China, 2008; Available online: https://kns.cnki.net/KCMS/detail/detail.aspx?dbname=CMFD2008&filename=2008065517.nh (accessed on 5 September 2022).
  34. Yang, Y.H.; Li, H.Y.; Jiang, X.; Zheng, X.; Xu, X.Y.; Zhang, Q.Y. Los of Pedestrian Perception for Corridor in Subway Station Considering the Reliability and Validity. Jiaotong Yunshu Xitong Gongcheng Yu Xinxi/J. Transp. Syst. Eng. Inf. Technol. 2016, 16, 212–218. [Google Scholar] [CrossRef]
  35. Cao, Y.; Yang, N. Regression method based on SPSS optimal scaling. Stat. Decis. Mak. 2019, 35, 72–74. [Google Scholar] [CrossRef]
  36. Peng, H. Traffic Congestion Detection Based on Fuzzy Hierarchical Analysis; Dalian University of Technology: Dalian, China, 2021; Available online: https://kns.cnki.net/KCMS/detail/detail.aspx?dbname=CMFD202201&filename=1021699027.nh (accessed on 7 September 2022).
  37. Cao, X.; Wang, F.; Zhao, S.; Xin, W.; Zhang, H. A Validity Analysis of Drunk Driving Questionnaire among Driving School Students in Xi’an. Foreign Med. Sci. (Medgeography) 2017, 38, 248–250, 254. [Google Scholar]
  38. Yang, L.; Bian, Y.; Zhao, X.; Liu, X.; Yao, X. Drivers’ acceptance of mobile navigation applications: An extended technology acceptance model considering drivers’ sense of direction, navigation application affinity and distraction perception. Int. J. Hum.-Comput. Stud. 2021, 145, 102507. [Google Scholar] [CrossRef]
  39. Feng, F. Analysis and Evaluation of the Factors Influencing the Comfort of Highway Travel Based on SP Survey; Chang’an University: Xi’an, China, 2020; Available online: https://kns.cnki.net/KCMS/detail/detail.aspx?dbname=CMFD202101&filename=1021566141.nh (accessed on 6 September 2022).
  40. Ma, S.; Yang, Y.; Wang, Y.; Han, S. Analysis of Public Bicycle Choice Behavior of Xi’an Based on the Method of EFA and CFA. J. Chongqing Jiao Tong Univ. Sci. 2018, 37, 97–104. [Google Scholar] [CrossRef]
  41. Qian, C.; Wei, D. Factors of Service Quality for Urban Rail Transit Based on Structural Equation Modeling. J. Transp. Eng. Inf. 2019, 17, 58–64. Available online: https://kns.cnki.net/kcms/detail/detail.aspx?FileName=JTGC201902008&DbName=CJFQ2019 (accessed on 4 September 2022).
  42. Yao, Q.; Huang, L.; Wang, P.; Zhu, J.; Zhang, S.; Yang, R. Power and economy analysis of electric passenger cars based on hierarchical analysis. Pract. Automot. Technol. 2021, 46, 3–10. [Google Scholar] [CrossRef]
  43. Jia, S. Study on the Influence of Travel Happiness on the Willingness to Re-Use Conventional Public Transportation; Beijing Jiaotong University: Beijing, China, 2020; Available online: https://kns.cnki.net/KCMS/detail/detail.aspx?dbname=CMFD202101&filename=1020441964.nh (accessed on 6 September 2022).
  44. Mouratidis, K.; Ettema, D.; Næss, P. Urban form, travel behavior, and travel satisfaction. Transp. Res. Part A Policy Pract. 2019, 129, 306–320. [Google Scholar] [CrossRef]
  45. Liu, L. Research on Factors Influencing Online Taxi Passenger Experience in Big Data Environment; Hunan Normal University: Changsha, China, 2018; Available online: https://kns.cnki.net/KCMS/detail/detail.aspx?dbname=CMFD201901&filename=1018154376.nh (accessed on 6 September 2022).
  46. Chen, S.; Fan, Y.; Cao, Y.; Khattak, A. Assessing the Relative Importance of Factors Influencing Travel Happiness. Travel Behav. Soc. 2019, 16, 185–191. [Google Scholar] [CrossRef]
  47. Morris, E.A.; Hirsch, J.A. Does Rush Hour See a Rush of Emotions? Driver Mood in Conditions Likely to Exhibit Congestion. Travel Behav. Soc. 2016, 5, 5–13. [Google Scholar] [CrossRef] [PubMed]
  48. Fan, A. A Study on the Effect of Traffic Interventions on Mode Choice and Travel Perception Considering Heterogeneity; Beijing Jiaotong University: Beijing, China, 2020; Available online: https://kns.cnki.net/KCMS/detail/detail.aspx?dbname=CDFDLAST2021&filename=1020444616.nh (accessed on 6 September 2022).
  49. Shao, Y.; Fan, Y.; Jiang, J.; Ouyang, X.; Brown, R. A study of travel well-being based on travel chains and emotional feelings. Urban Transp. 2019, 17, 1–7. [Google Scholar] [CrossRef]
  50. Ory, D.T.; Mokhtarian, P.L.; Redmond, L.S.; Salomon, I.; Collantes, G.O.; Choo, S. When Is Commuting Desirable to the Individual? Growth Chang. 2004, 35, 334–359. [Google Scholar] [CrossRef]
  51. Gärling, T.; Ettema, D.; Friman, M. Satisfaction and Travel Choices Handbook of Sustainable Travel. In Handbook of Sustainable Travel; Springer: New York, NY, USA, 2014; pp. 53–65. [Google Scholar] [CrossRef]
  52. Abou-Zeid, M.; Ben-Akiva, M. The Effect of Social Comparisons on Commute Well-Being. Transp. Res. Part A Policy Pract. 2011, 45, 345–361. [Google Scholar] [CrossRef]
Figure 1. Analysis chart of the three travel patterns.
Sustainability 14 11509 g001
Figure 2. Hierarchical analysis model.
Sustainability 14 11509 g002
Figure 3. Constructed judgment matrix.
Sustainability 14 11509 g003
Figure 4. Constructed fuzzy consistency matrix.
Sustainability 14 11509 g004
Table 1. Satisfaction with Travel Scale.
Valence (V, adapted from SCAS [16])Displeased (1)—Pleased (7) (V1)
Sad (1)—Glad (7) (V2)
Depressed (1)—Happy (7) (V3)
Activation (A, adapted from SCAS [16])Dull (1)—Peppy (7) (A1)
Sleepy (1)—Awake (7) (A2)
Passive (1)—Active (7) (A3)
Positive deactivation—negative activation(PD, adapted from STS [15])Time pressed (1)—Relaxed (7) (PD1)
Worried I would not be on time (1)—Confident I would be on time (7) (PD2)
Stressed (1)—Calm (7) (PD3)
Positive activation—Negative deactivation (PA, adapted from STS [15])Tired (1)—Alert (7) (PA1)
Bored (1)—Enthusiastic (7) (PA2)
Fed up (1)—Engaged (7) (PA3)
Cognitive evaluation (C, adapted from STS [15] and SWLS [13])Travel was the worst (1)—Best I can think of (7) (C1)
Travel was low (1)—High standard (7) (C2)
Travel worked well (1)—Poorly (7) (C3)
Travel was satisfying (1)—Unsatisfying (7) (C4)
Note: For the imported Satisfaction with Travel Scale, the NPS 7-level scale is used for scoring. The first column in parentheses presents the abbreviations and sources. The second column in parentheses shows the abbreviations and the highest/lowest scores.
Table 2. Frequency of vehicles by travel pattern.
Transportation ModePattern 1Pattern 2Pattern 3
Walk54--
Bicycle48--
E-bicycle36--
Taxi-17-
Private-71-
Bus--56
Shuttle--6
Subway--115
Table 3. Frequency of connection modes by travel pattern.
Connection TypeTransportation ModePattern 2Pattern 3
The departure connection modeWalk77126
Bicycle537
E-bicycle67
Taxi--
Private-3
The arrival connection modeWalk77128
Bicycle439
E-bicycle72
Taxi-2
Private--
Table 4. Internal-reliability and polymeric-validity test.
ItemItem—Total CorrelationFactor LoadingCronbach’αAVECR
Valence (V)V30.7310.7910.9040.77420.911
V20.8680.935
V10.8380.907
Activation (A)A30.8600.9040.9350.82510.934
A20.8710.906
A10.8670.915
Positive deactivation—negative activation (PD)PD30.6830.7140.9360.69580.8713
PD20.8080.948
PD10.7570.824
Positive activation—negative deactivation (PA)PA30.8450.8970.8680.82940.9358
PA20.8780.917
PA10.8780.918
Cognitive evaluation (C)C40.8640.9090.9260.76160.9274
C30.8200.862
C20.8000.832
C10.8340.886
Table 5. Independent variable-screening results.
VariableSig.Important Factor
Gender 0.2220.008
Education background0.0020.128
Marriage status0.1770.010
Number of children0.0160.030
Profession0.006−0.015
Monthly income0.0910.069
Living area0.0000.048
Place of work and study0.0120.028
Travel purpose0.010−0.003
Total number of travelers0.0380.038
Travel period0.0000.043
Travel distance0.660−0.025
Travel pattern0.0000.869
Transportation mode0.000−0.810
Departure connection mode0.781−0.011
Arrive connection mode0.6330.030
Travel duration0.0020.265
Transfer time0.872−0.015
Age0.0000.099
Arrival connection time0.0360.121
Waiting time0.9850.015
Transfer time0.0050.098
Departure connection time0.002−0.020
Note: Red font are key indicators that have a significant impact on broad travel satisfaction, while black font is for indicators that do not have a significant impact on broad travel satisfaction.
Table 6. Rotated core factor matrix.
ItemFactor Loading
1234
Travel pattern0.944
Departure connection time0.915
Transportation mode0.914
Arrival connection time0.900
Transfer time0.705
Travel duration0.659
Number of children 0.777
Education background −0.765
Age 0.763
Travel purpose 0.745
Profession 0.604
Total number of travelers 0.582
Travel period 0.498
Living area 0.851
Place of work and study 0.816
Table 7. Cronbach coefficients.
Core FactorsCronbach’α
Demographic information0.669
Static travel parameters0.457
Dynamic travel parameters0.903
Major travel areas0.613
Table 8. The 0.1–0.9 nine-scale quantitative scale.
Judgment ScaleMeaning
0.5The two indexes are of equal importance.
0.6One factor is slightly more important than the other.
0.7One factor is significantly more important than the other.
0.8One factor is strongly more important than the other.
0.9On factor has extreme importance over another.
0.1~0.4If the value of A is compared to B, then B compared to A is 1-a.
Table 10. 0.1–0.9 nine-scale quantity scale.
Number of Orders1234567
RI000.580.901.121.241.32
Table 11. Results of the hierarchical ranking.
Highest HierarchiesMiddle HierarchiesWeightsLowest HierarchiesWeightsSynthetic Weights
Broad travel-satisfaction evaluationDynamic travel parameters0.383 Travel pattern0.215 0.082
Transportation mode0.215 0.082
Travel duration0.175 0.067
Arrival connection time0.151 0.058
Transfer time0.143 0.055
Departure connection time0.103 0.039
Demographic information0.239 Age0.339 0.081
Number of children0.306 0.073
Profession0.228 0.054
Education background0.128 0.031
Static travel parameters0.206 Travel period0.458 0.094
Total number of travelers0.383 0.079
Travel purpose0.158 0.033
Major travel areas0.172 Living area0.567 0.095
Place of work and study0.433 0.075
Note: In the lowest layer, the first column number is the influence coefficient of the lowest layer on the middle layer, and the second column number is the influence coefficient of the lowest layer on the highest layer.
Publisher’s Note: MDPI stays neutral with regard to jurisdictional claims in published maps and institutional affiliations.

