Article

Does Cross-Border E-Commerce Promote Economic Growth? Empirical Research on China’s Pilot Zones

School of Economics and Finance, Xi’an Jiaotong University, Xi’an 710061, China
*
Author to whom correspondence should be addressed.
Sustainability 2022, 14(17), 11032; https://doi.org/10.3390/su141711032
Submission received: 1 August 2022 / Revised: 30 August 2022 / Accepted: 31 August 2022 / Published: 4 September 2022

Abstract

:
Whether the construction of China’s cross-border e-commerce (CBEC) comprehensive pilot zones can promote economic growth and social sustainable development is an important question worthy of discussion. This paper uses the difference-in-differences (DID) method to test the impact of the establishment of CBEC comprehensive pilot zones on economic growth and discusses the impact mechanism. The results are as follows. (1) The construction of CBEC comprehensive pilot zones can promote economic growth. After testing with parallel trend, placebo, and other robustness methods, the results are still valid. (2) The economic promotion effect of the construction of CBEC comprehensive pilot zones will be more evident in the coastal and eastern regions. The economic promotion effect of the first, second, and third batch of CBEC comprehensive pilot zones is clear. (3) The main ways that the construction of CBEC comprehensive pilot zones can facilitate economic growth are through urban digitalization, trade openness, and information service industry agglomeration.

1. Introduction

Cross-border e-commerce (CBEC) is a new form of international trade in the internet era. Compared with traditional trade, CBEC has fewer trade links, low transaction costs, and fewer intermediary links [1,2], which gradually stimulates the growth of international trade and facilitates economic growth for all countries [3]. In recent years, China’s CBEC has developed rapidly. In 2021, the scale of China’s CBEC market was CNY 14.2 trillion, including CNY 11 trillion for exports and CNY 3.2 trillion for imports. China’s CBEC transactions accounted for 36.32% of its total import and export value of CNY 39.1 trillion of goods trade in 2021, which means that the penetration rate of the CBEC industry still exceeded 35%. It can be predicted that in the future, with the continuous growth of the industry scale, the penetration rate of the CBEC industry will also continue to increase. In addition to the advantages of CBEC, the achievements of China’s CBEC depend on the strong support of, and promotion by, the Chinese government. From 2014 to 2022, the Chinese government work report has mentioned CBEC for nine consecutive years, emphasizing the need to accelerate the development of CBEC and other new formats and models, while expanding the CBEC market has become an important part of the construction of China’s new double circulation development pattern.
Although CBEC has many advantages over traditional trade, in the early stage of CBEC development in China, due to the novel mode, China’s rules and regulations lagged behind the practice, resulting in serious obstacles with regard to logistics, payment, customs clearance, taxation, foreign exchange settlement, and other CBEC trade links. Among them, the factors restricting the development of CBEC mainly include the following: first, the low efficiency of customs clearance caused by the fragmentation of CBEC transactions. CBEC orders have the characteristics of small batches, high frequency, multiple categories, and low value, which manifests in a large number of express deliveries and parcels. This leads to cumbersome customs formalities for imported and exported goods, which not only consumes a lot of manpower and material resources but also greatly prolongs the customs clearance time and reduces customs clearance efficiency. Second, CBEC procurement is relatively decentralized, which gives rise to trade cost problems. A large number of enterprises purchase goods from individuals or self-employed households. The lack of documents and tickets forces many enterprises to conduct business using gray customs clearance. The increase in relevant costs seriously hinders the development and expansion of the CBEC industry. Third, CBEC enterprises face funding constraints due to their small scale. As the main CBEC participants are small and medium-sized enterprises (SMEs), the internal ability of these small and medium-sized enterprises to stabilize capital flow is generally poor, and the external financing constraints are high. In addition, it is difficult for some CBEC enterprises to obtain legal and effective purchase vouchers, meaning they are unable to obtain export tax rebates. These factors cause heavy financial constraints for SMEs engaged in CBEC.
To promote the healthy development of China’s CBEC and to implement a higher level of opening up to the outside world, China launched the CBEC comprehensive pilot zone project in 2015. Exploring appropriate policy tools by establishing pilot areas and promoting them nationwide is a method often used by the Chinese government to promote progressive reform [4,5]. According to the traditional economic growth theory, institutional innovation is a decisive factor in economic growth [6]. The Chinese government attempted to solve the institutional problems faced in the development of the CBEC industry in the pilot area by establishing CBEC comprehensive pilot zones to achieve economic growth. The CBEC comprehensive pilot zones focus on facilitating the business process of CBEC, improving the information and digital construction of the city, promoting the agglomeration of the CBEC industry, and forming a complete supply chain, thus solving the institutional problems that have arisen in the development of the CBEC industry.
The Chinese government launched the first batch of CBEC comprehensive pilot zones in March 2015, including only one city, Hangzhou. In January 2016, China promoted and copied the experience of the Hangzhou CBEC comprehensive pilot zone and launched the second batch of CEBC comprehensive pilot zones in 12 cities, including Tianjin and Hefei. In July 2018, the Chinese government replicated and promoted the mature practices of the first and second batch of 13 CBEC comprehensive pilot zones in 12 aspects, formed by the “six systems and two platforms”, to the whole country, launching the third batch of CBEC comprehensive pilot zones in 22 cities, including Beijing. To date, the Chinese government has launched six batches of CBEC pilot zones, covering 30 provinces, autonomous regions, and cities, and forming a pattern of land–sea interaction and east–west mutual assistance. However, due to the late establishment of the latter three batches and the limited availability of data, our paper only explores the implementation effect of the first three batches.
China’s CBEC has developed rapidly, and the first batch of CBEC comprehensive pilot zones has been operating for over 7 years. Through an economic effect evaluation of China’s CBEC pilot zone policy, our paper aims to answer the following three questions: (1) In the context of China’s development of the digital economy, are there differences between pilot and non-pilot zones for CBEC development? In other words, is the pilot policy effective? (2) What are the factors and mechanisms that impact the effectiveness of the pilot zone policy? In other words, what is the key to the effective implementation of the pilot policy? (3) After the implementation of the pilot zone policy, are there obvious changes in the pilot zones? In other words, which cities have effective pilot zone policies? To conduct systematic and rigorous research, our paper proposes a time-varying difference-in-differences (DID) model to evaluate the effectiveness of the CBEC comprehensive pilot zone policy based on panel data of Chinese prefecture-level cities from 2011 to 2019. The DID model is a widely used policy evaluation method that evaluates the net impact before and after the implementation of a policy by eliminating the influence of individual heterogeneity differences and time change factors. On this basis, we analyze the differences in policy effects in eastern, central, and western China, the differences in policy effects in coastal and inland areas, as well as the differences in policy effects in the first, second, and third batches of CBEC pilot zones. In addition, the robustness of benchmark regression is tested from three aspects. Finally, our paper analyzes the impact mechanism of the CBEC pilot zone policy and proposes policy suggestions to promote the development of China’s CBEC pilot zone.
The main contributions of our paper lie in both the theoretical and practical aspects. Specifically, we use the time-varying DID model to innovatively study the economic effects of the batch implementation of policies in China’s CBEC comprehensive pilot zone. Most importantly, in addition to the effect of policy implementation in the pilot area at the national level, we also compare the effect of policies in different regions with different levels of economic development and different batches. At the same time, we discuss the cumulative and dynamic effects of the CBEC pilot zone policy. In addition, we analyze the path of policy impact from three perspectives: the level of urban digitalization, the degree of trade openness, and information service industry agglomeration. Finally, we present suggestions for promoting the implementation of the CBEC comprehensive pilot zone policy in China and around the world.
The rest of our paper is organized as follows: Section 2 contains a review of the literature; Section 3 discusses the methodology, including the theoretical mechanism and the empirical strategy; Section 4 analyzes the empirical results; Section 5 contains the discussion; and Section 6 comprises the conclusion and suggestions.

2. Literature Review

In recent years, CBEC has developed rapidly, and the transaction scale has increased significantly. In the past two years in particular, due to the global COVID-19 pandemic, the development of the traditional economy has been seriously hindered, while CBEC has grown and developed rapidly. It is estimated that by 2025, the revenue of global CBEC will increase from USD 250 billion to USD 350 billion [7].
Many scholars have begun to study how to better promote the development of CBEC. The research has found that, in addition to the basic driving factors, such as internet infrastructure, capital investment, convenient means of payment, per capita education level, and spillover effects of other countries [8], it is also important to break down the tax barriers, such as consumption tax and value added tax, for the effective development of cross-border online trade [9,10]. At the same time, many studies also believe that simplifying import and export process regulation and reducing the regulatory differences across regions are important steps to promote the growth of CBEC [11]. However, the above-mentioned studies employ logical deduction at the theoretical level and lack the support of empirical evidence.
In addition, many scholars have begun to study the economic effects of CBEC. Lendle and Vézina [2] found that CBEC platforms such as eBay can significantly increase a company’s export probability and export scale. Ma et al. [3] found that CBEC significantly promoted China’s import growth. Other scholars have focused on exploring the impact of CBEC on transaction costs [12] and labor productivity [13]. In general, although the existing literature examines the economic impact of CBEC on international trade, transaction costs, and productivity, there is a lack of discussion on the direct impact of CBEC on economic growth.
To promote the development of CBEC in China, the Chinese government has adopted a top-down model of CBEC comprehensive pilot zones. In this model, the policy objectives of China’s pilot zones to facilitate the construction of CBEC cities are formulated by the national government, while specific policy tools are formulated and issued by local governments. The direct goal of the policy is to promote international trade, but the ultimate goal is to achieve economic development. Therefore, our paper focuses on the impact of the construction of CBEC comprehensive pilot zones on the economic development of Chinese cities.
In the early stages, some scholars focused on the construction of a single CBEC comprehensive pilot zone. Lu and Wang [14] studied the development status and future competition direction of the Dalian and Tianjin comprehensive pilot zones. Jin et al. [15] examined the impact of the establishment of CBEC comprehensive pilot zones by analyzing the pilot zone in Henan Province from five aspects: transaction scale, growth space, industrial penetration, supporting environment, and platform agglomeration. With the gradual increase in CBEC comprehensive pilot zones, some scholars began to study the overall economic results of the pilot zones. Chen [16] found that the establishment of comprehensive pilot zones is closely related to economic growth by using the data of 35 CBEC pilot comprehensive zones, based on the gray correlation theory. Wang et al. [17] found that the CBEC comprehensive pilot zone policy has an important positive impact on the economic development of the pilot city by using the data of the first three batches of CBEC comprehensive pilot zones in China, based on the structural equation model.
In addition, some scholars have tested the effect of a policy tool through the synthetic control method (SCM) [18,19]. However, the SCM is usually suitable for comparative case studies, as the sample size for this method is small [20]. In addition, matching pilot cities by weight in SCM will lead to errors [21]. In contrast, the DID method regards the implementation of the policy in the pilot area as an independent variable, which not only limits the interaction between the independent variable and the dependent variable but also avoids the common endogenous problem in panel regression. In addition, because the sample grouping of cities in the pilot area is independent of individual heterogeneity, DID can control the impact of unobservable individual heterogeneity on dependent variables and extract the actual policy effect of the pilot area policy. Therefore, our paper focuses on the impact of the construction of CBEC comprehensive pilot zones on economic development, thus obtaining the “net effect” of the policy more effectively. However, considering the phased launch and implementation characteristics of China’s CBEC comprehensive pilot zone policy, we use the time-varying DID model to more accurately analyze the effect of the policy.
In summary, recent research has mainly focused on the impact of CBEC on international trade but ignored economic growth. Furthermore, few people have explored the influence mechanism of CBEC on economic growth. Moreover, there is a lack of in-depth research on the heterogeneity between cities in the literature. In addition, most previous studies have provided static results rather than the possible dynamic impact of CBEC pilot zones. Therefore, the time-varying DID model is used to more accurately analyze the effect of the policy and the cumulative effect of the policy over time, as well as the different impacts on different regions of China.

3. Methodology

3.1. Theoretical Mechanism

The CBEC comprehensive pilot zone is a pilot economic zone with urban areas as the core, established with the support of national pilot policies. The CBEC comprehensive pilot zone approved by the Chinese government specifically refers to the adoption of specific management modes and special policy preferences for CBEC activities in some regions to achieve a more convenient CBEC. We combed the relevant documents approved by the Chinese government to unify the establishment of CBEC comprehensive pilot zones. It was found that the construction of CBEC comprehensive pilot zones mainly includes the following aspects.
First, each pilot zone focuses on innovating and improving the digital construction of the technical standards, business processes, regulatory models, and other CBEC transaction processes. Digital construction not only refers to the construction of information infrastructure but also includes the maintenance and updating of digital platforms, the realization of digital customs clearance, and the construction of online industrial parks.
Second, each pilot zone strives to improve trade facilitation in the CBEC comprehensive pilot zone. This is mainly reflected in the following aspects: first, in terms of tax supervision, the comprehensive pilot zone implemented the policy of “no ticket tax exemption”, so that the CBEC enterprises in the comprehensive pilot zone can enjoy the preferential treatment of exemption from value added tax and consumption tax; and second, in terms of import and export declaration and customs clearance, the process has been greatly simplified. The General Administration of Customs, the General Administration of Taxation, and other government departments have issued a series of policies to help improve the efficiency of customs clearance, such as simplifying the classification of import and export goods, and handling the import and export procedures of CBEC goods through a single window. It has been reported that, under the above measures, the import and export declaration time for goods in the Hangzhou CBEC comprehensive pilot zone was shortened from 4 h to an average of 1 min.
Third, each pilot zone focuses on encouraging information service enterprises to gather. The comprehensive pilot zone generally carries out the construction of CBEC industrial parks, encouraging well-known e-commerce platform enterprises, CBEC upstream and downstream enterprises, and related service enterprises to settle in, and it provides comprehensive supply chain services, such as finance, customs clearance, quarantine, logistics, and talent in the park, to create a CBEC industrial ecosystem and to promote the overall growth and strength of the enterprises in the comprehensive pilot zone.
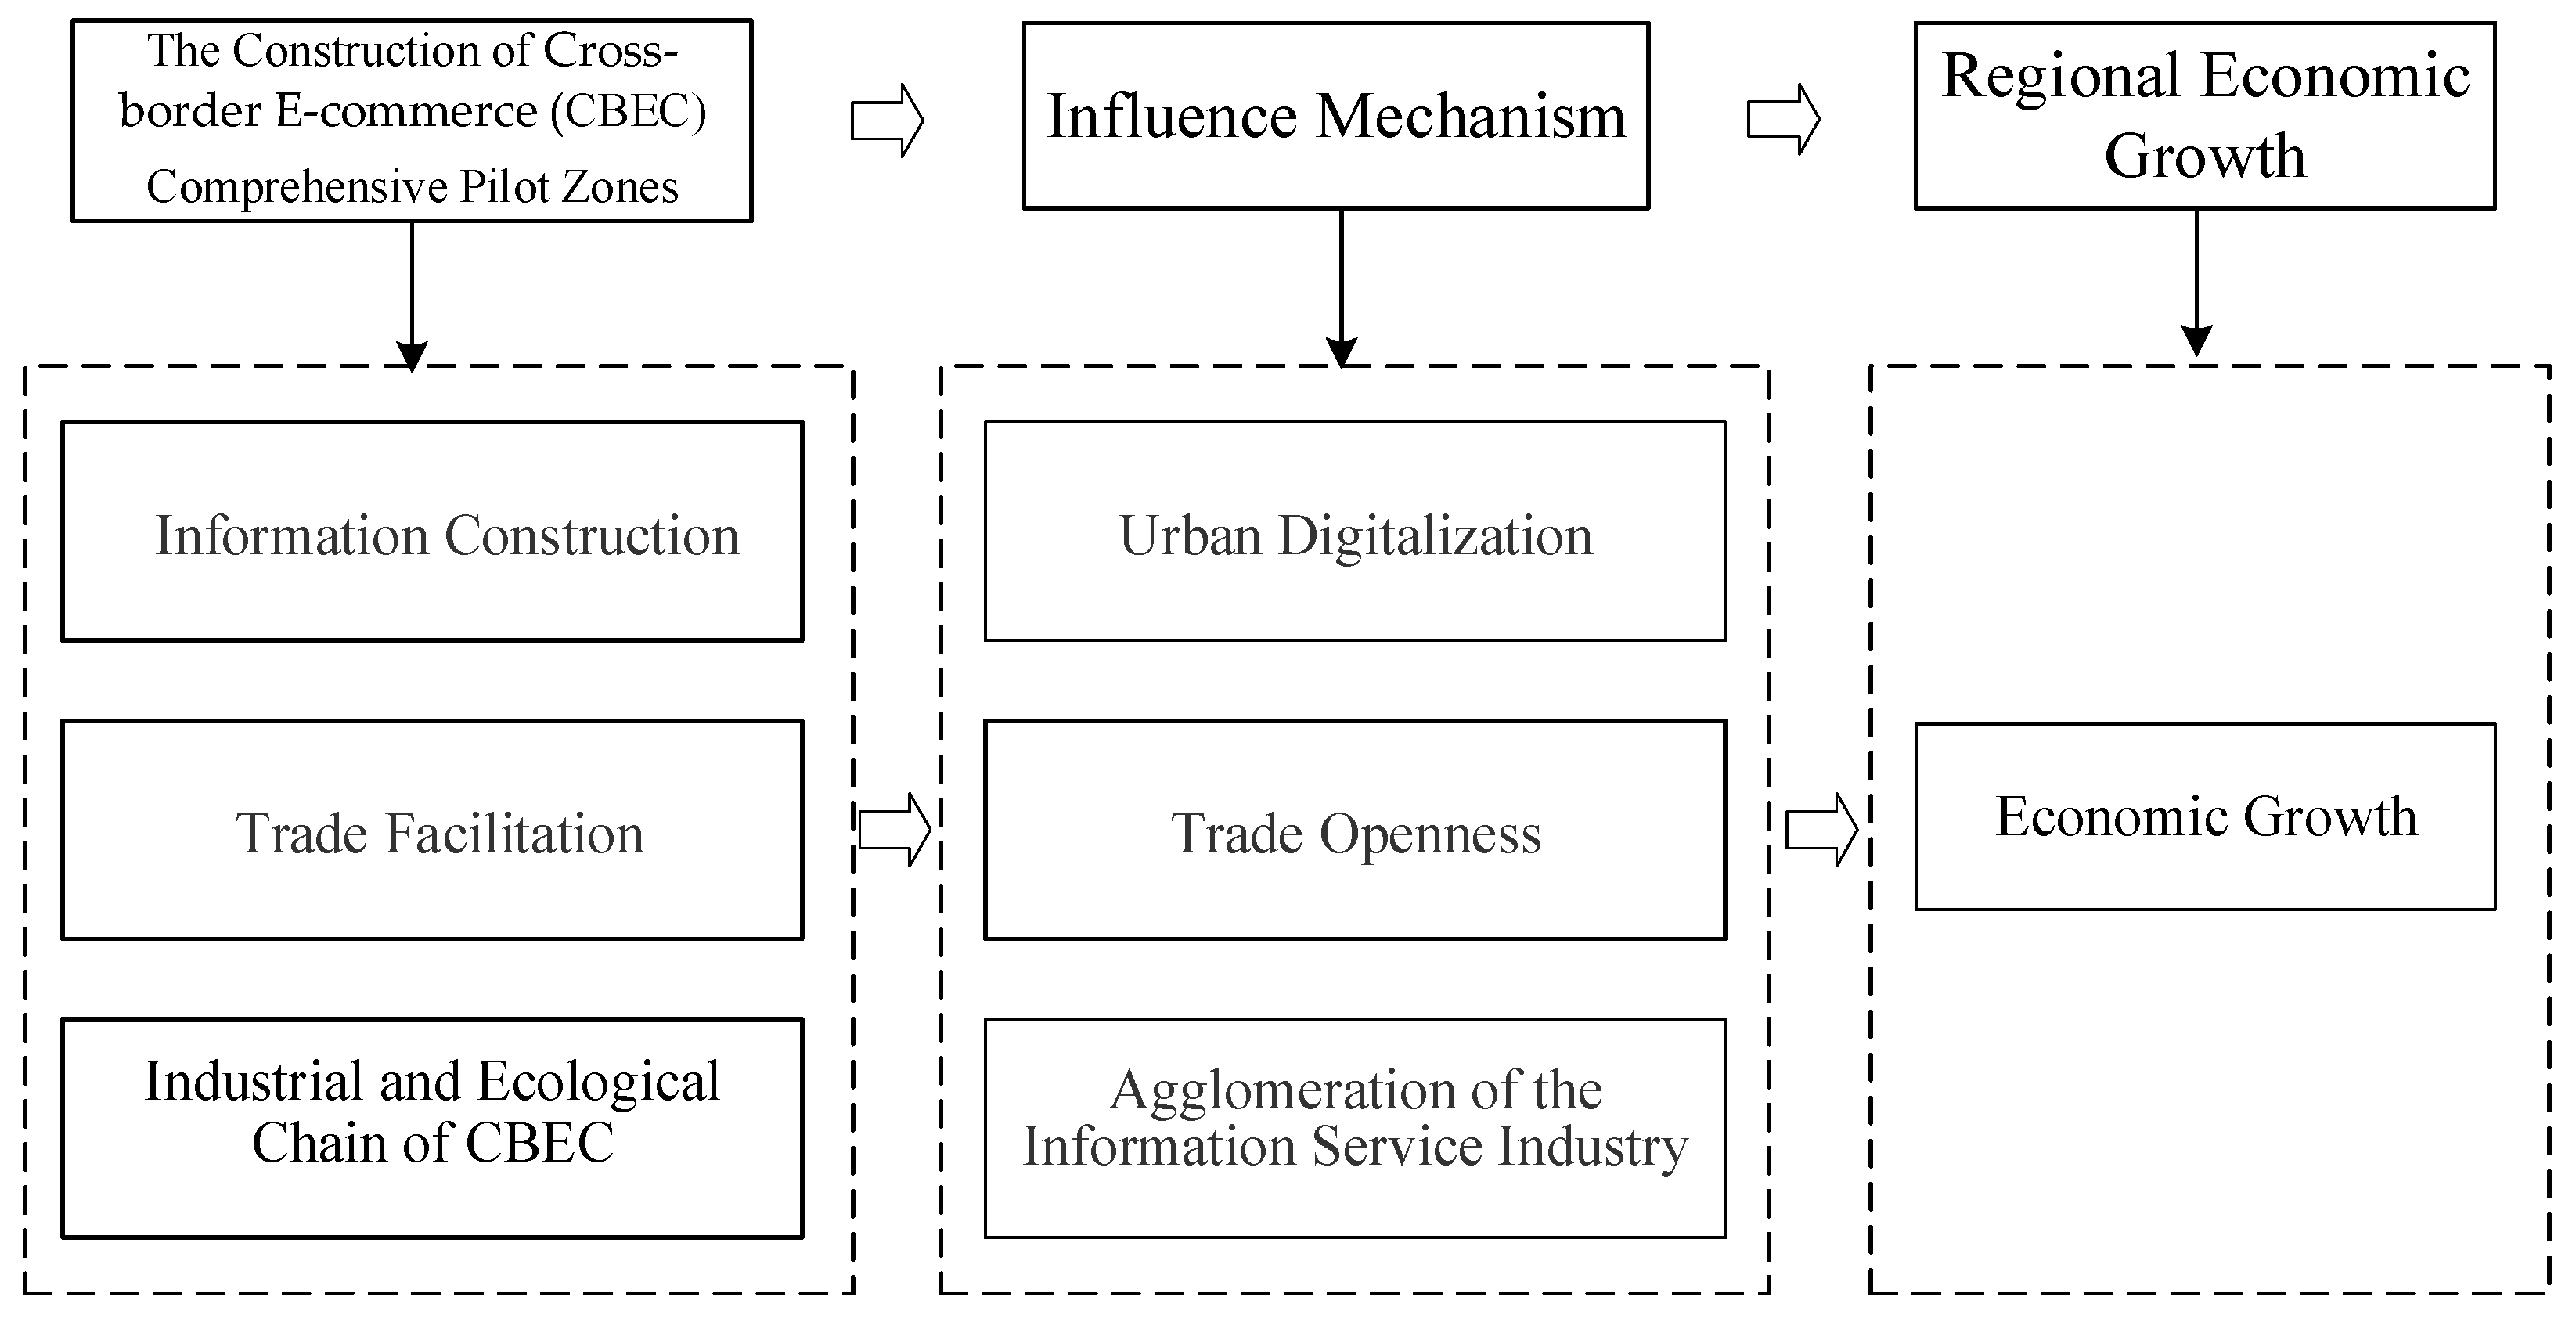
Based on the development background of the above comprehensive pilot zone, we believe that a CBEC comprehensive pilot zone will eventually achieve regional economic growth through the construction of urban digitization, an improvement in trade openness, and the realization of information service industry agglomeration. Therefore, based on the above analysis, we first construct a theoretical mechanism diagram (see Figure 1) of CBEC comprehensive pilot zone construction and the effects on regional economic growth, and then analyze these three mechanisms.
First, the policies of CBEC comprehensive pilot zones impact economic growth by affecting urban digital construction. The policies of CBEC comprehensive pilot zones focus on information construction to promote the digital transformation of cities, and the digital transformation of cities contributes to economic growth [22,23].
Second, CBEC comprehensive pilot zones influence economic growth by affecting the degree of trade openness. CBEC comprehensive pilot zones focus on building the growth of CBEC, a new trade format, to create new competitive advantages in international trade and to finally achieve trade promotion effects.
Third, CBEC comprehensive pilot zones have an effect on economic growth by facilitating the agglomeration of the information service industry. An important task of the pilot zones is to gather CBEC industries, create a complete CBEC industrial chain and ecological chain, and finally achieve economic growth. At present, the industrial agglomeration of China’s CBEC comprehensive pilot zones mainly reflects the agglomeration of online integrated service industries and offline industrial parks.

3.2. Empirical Strategy

3.2.1. Specification

The purpose of our study is to evaluate the effect of CBEC comprehensive pilot zones on promoting urban economic growth in China. The implementation of CBEC comprehensive pilot zones is regarded as a “quasi-natural experiment”. Specifically, a difference-in-differences model is applied to empirical research, in which the first difference is city, and the second difference is time. Therefore, in our study, the analysis of the DID model will focus on comparing the differences in economic growth between the cities in pilot areas and the cities in non-pilot areas before and after the implementation of the policy. Specifically, following Liu and Qiu [24], as well as Pierce and Schott [25], the specific model is as follows:
GDPP it = α + β 1 D it   + δ X it   + λ i   + λ t   + ε it
where i and t represent city and time; GDPP it denotes the per capita GDP of city i in year t; λ i is a time city-related fixed effect, which controls all the city-related factors that do not change with time; λ t refers to the time-related fixed effect, which controls all the time-related factors that do not change with the city; X it stands for a set of time-varying city-level variables; and ε it is the error term. Following Bertrand et al. [26], we cluster the samples to the urban level because of the potential heteroscedasticity and serial autocorrelation.
D it is the setting variable of the CBEC comprehensive pilot zone. If city i is a pilot city in year t, then D it   = 1 ; otherwise, D it = 0 . Thus, D it is the core explanatory variable in our paper, and β 1 is the core estimation coefficient, which is the average treatment effect of the establishment of CBEC pilot zones on economic growth. If the estimation coefficient β 1 is significantly positive, it means that the establishment of CBEC comprehensive pilot zones has a positive impact on economic growth. If the estimation coefficient β 1 is significantly negative, it means that the establishment of CBEC comprehensive pilot zones has a negative impact on economic growth.
To further test the mechanism of the establishment of comprehensive pilot zones affecting economic growth, the mediating effect model is used to analyze the influence mechanism of the pilot zones on economic growth [27]. The basic assumption of this model is that explanatory variables affect explained variables through mediating variables. Specifically, we build Equation (2) based on Equation (1) to determine whether there is a mediating effect. If β 2 is not significant, then the comprehensive pilot zone policy has no significant impact on the mediating variables, so the analysis is terminated. Otherwise, we then build Equation (3):
M it = α + β 2 D it + δ X it   + λ i   + λ t   + ε i t
GDPP it = α + β 3 D it   + τ M + δ X it   + λ i   + λ t   + ε it
In Equation (3), if τ   is not significant, M has no mediating effect. Otherwise, if the coefficient is significant, M has a mediating effect. After introducing the mediating variable M , if β 3 is not significant in Equation (3), M is the only confirmed mediating variable. In other words, the influence path of the comprehensive pilot zone policy is unique and certain. Otherwise, there are other mediating variables or other influencing ways. In Equations (2) and (3), the mediating variables M include the degree of urban digitalization, trade openness, and the agglomeration level of the information service industry.

3.2.2. Data

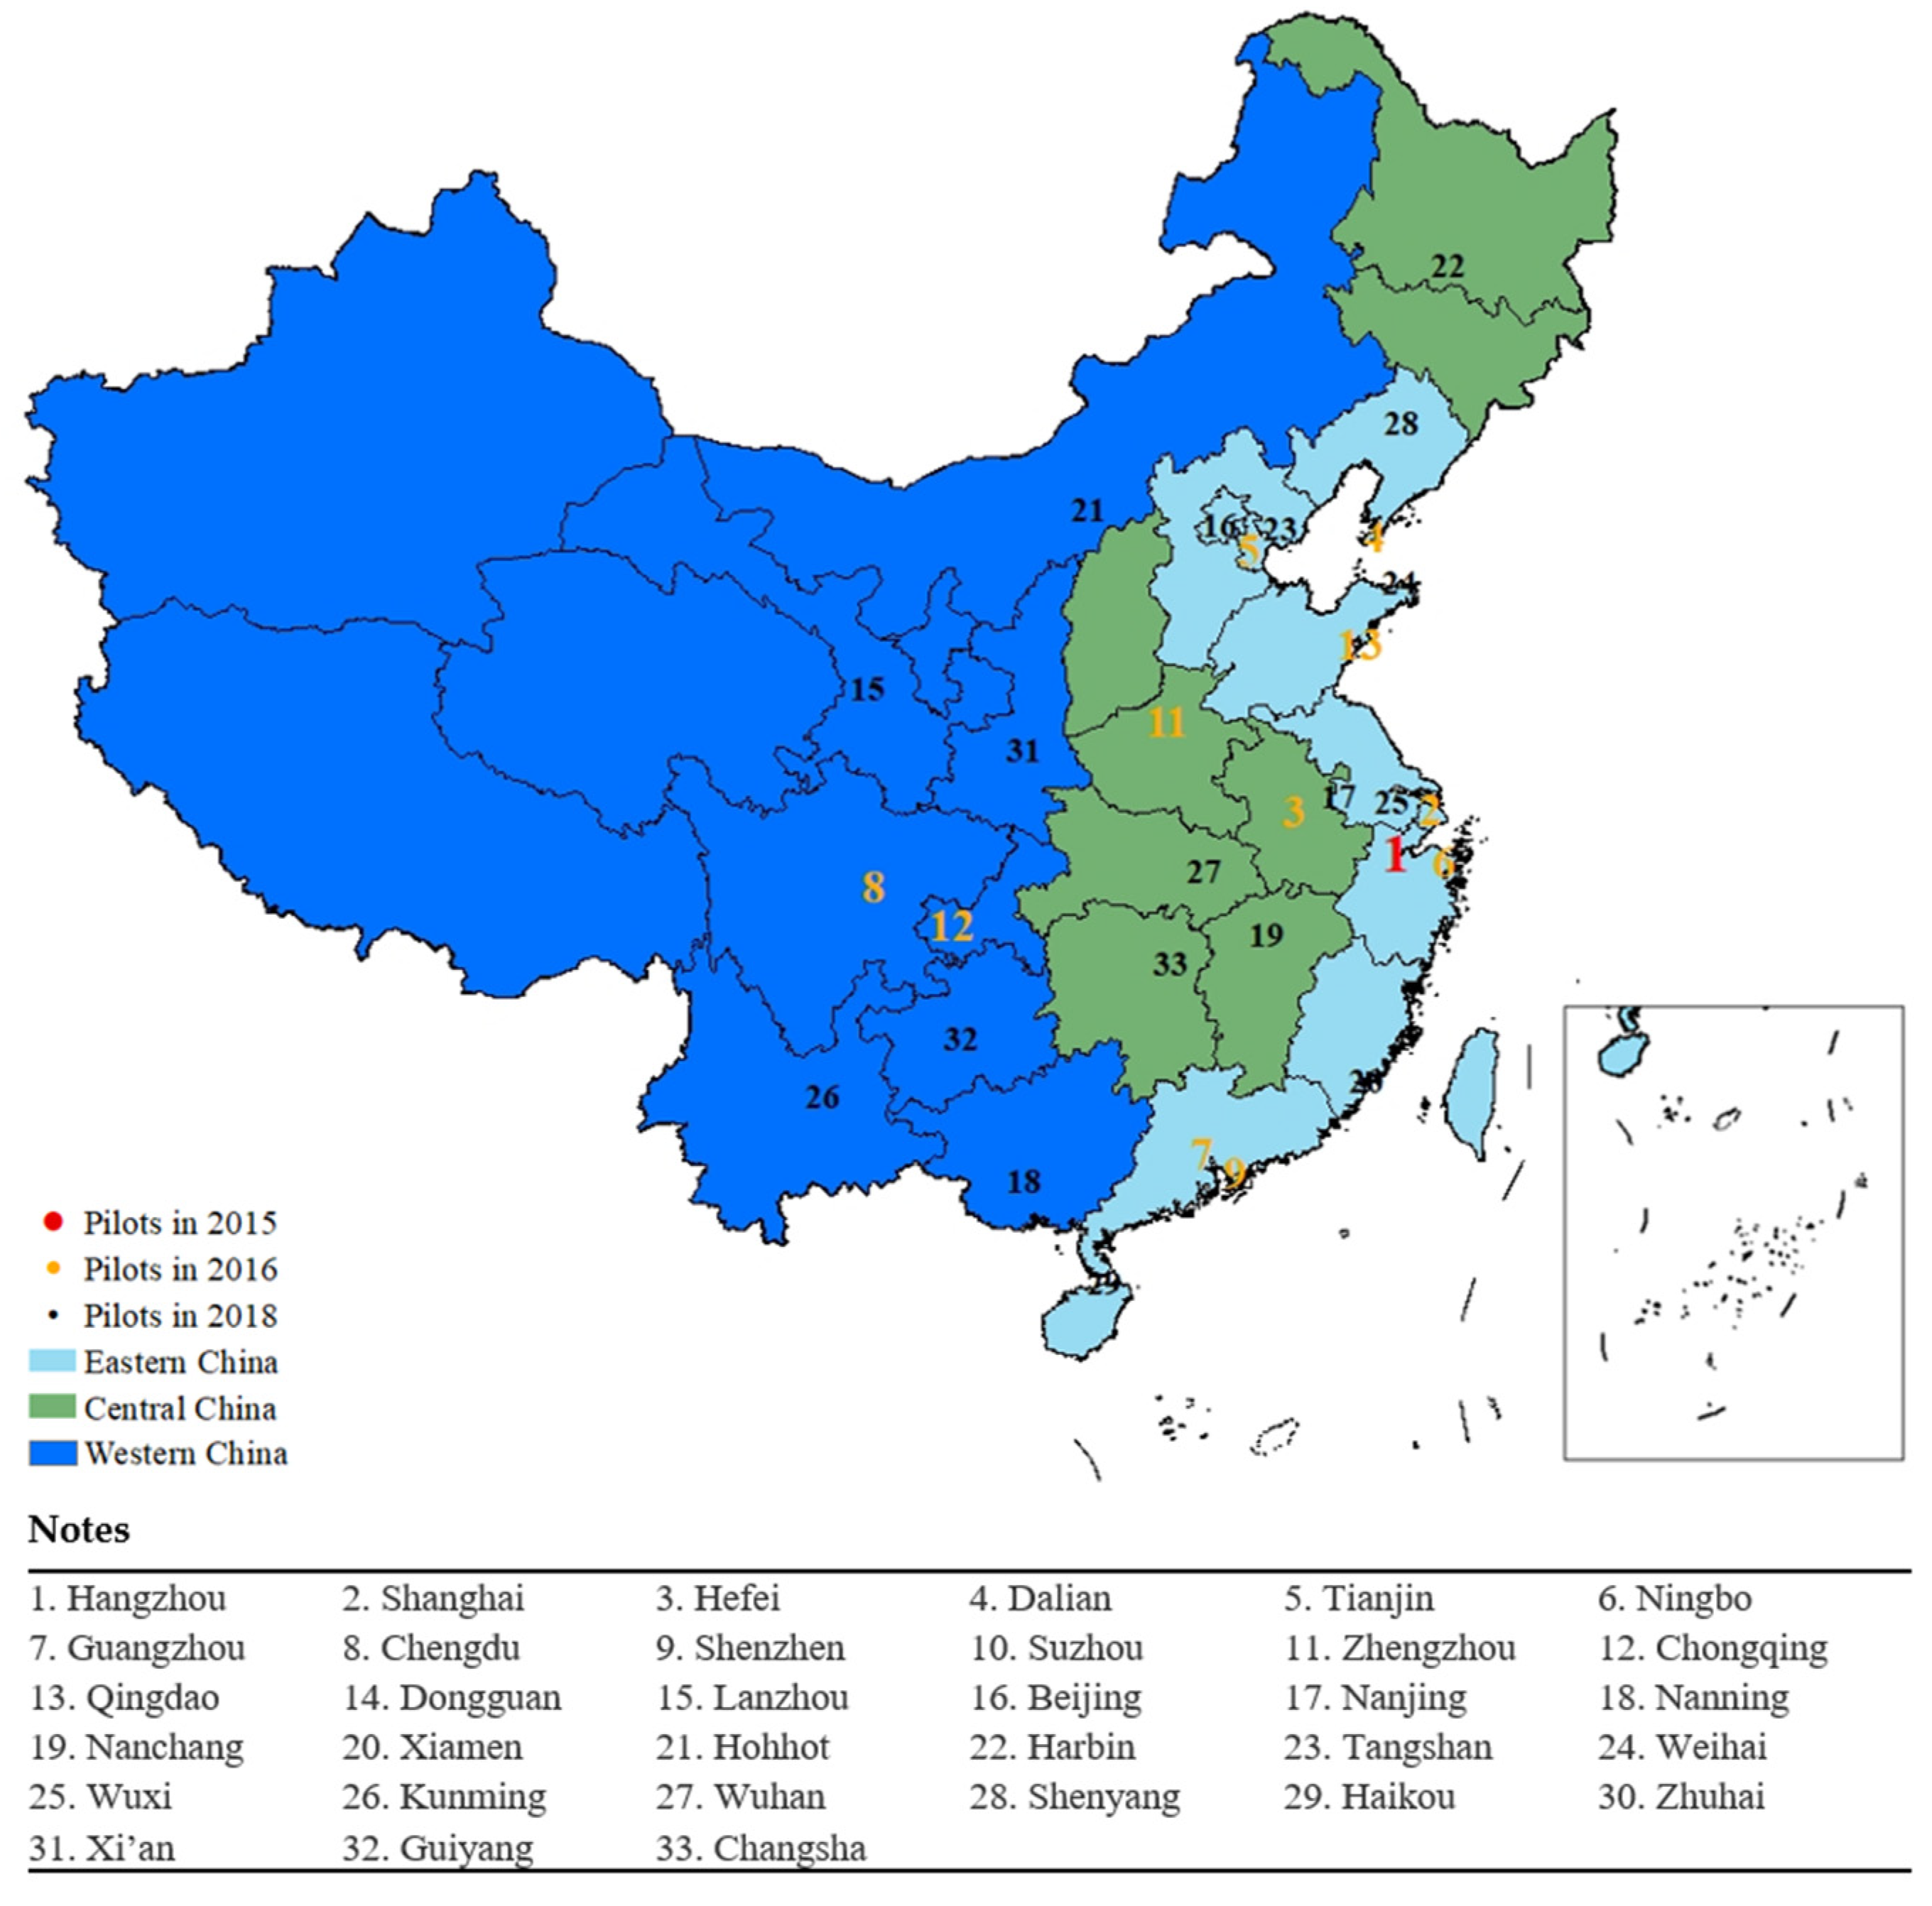
Our paper selects 33 CBEC comprehensive pilot zones launched in 2015, 2016, and 2018 as the analysis object. The details of the cities, including the time and location of the pilots, are shown in Figure 2. In our study, cities are divided into eastern, central, and western regions according to the division of the National Development and Reform Commission of China, rather than geographical concepts.
There are 19 pilot zones in the eastern region, 6 pilot zones in the central region, and 8 pilot zones in the western region. The first two batches of pilot cities are mainly concentrated in the eastern region. The number of CBEC pilot zones in the eastern region is significantly higher than that in the central and western regions because the basic conditions for CBEC development in the central and western regions are relatively weak (for example, there are fewer e-commerce enterprises and fewer e-commerce talent resources). As a result of this layout, the development gap between the CBEC pilot zones in different regions will become clearer, showing that “the CBEC development in the eastern region will become stronger and stronger, while CBEC in the central and western regions will become weaker and weaker”. To reverse this situation, the third batch of CBEC comprehensive pilot zones began to lean toward central and western cities.
In addition, after excluding the city samples with serious data loss, our paper uses the panel data of 117 cities from 2011 to 2019, including 33 cities in the treatment group and 84 cities in the control group. All data in our paper were obtained from the China Urban Statistical Yearbook. The selection and explanation of each variable are shown in Table 1.

3.2.3. Explained Variables

We choose real per capita GDP ( GDPP ) to represent economic growth. Real per capita GDP is equal to the real GDP of the year divided by the total population at the end of the year. Specifically
GDPP it = Real   GDP it Total   population it  
In Equation (4), the real GDP is calculated by using the nominal GDP and the deflator.

3.2.4. Core Explanatory Variables

Our paper examines whether CBEC comprehensive pilot zone policies play an important role in economic growth. D it is the core explanatory variable of whether a city is a CBEC pilot city and when it becomes a CBEC pilot city. If city i is a pilot city in year t, then D it = 1 ; otherwise, D it = 0 .

3.2.5. Control Variables

We also controlled other factors that may affect economic growth, such as social fixed asset investment (investment), social consumption level (consumption), human capital level (humancap), per capita road area (roadper), foreign direct investment level (fdi), and unemployment rate (unemployment). Specifically, investment is equal to total social fixed asset investment divided by GDP; consumption is equal to total retail sales of consumer goods divided by GDP; humancap is equal to taking the logarithm of the number of university students; roadper is equal to urban road area divided by the total population at the end of the year; fdi is equal to total foreign direct investment divided by GDP; and unemployment is equal to the proportion of unemployment in the total labor force.

3.2.6. Mediating Variables

The mediating variables we chose are: the level of urban digitalization (digitalscore), the degree of trade openness (trade), and the agglomeration level of the information service industry (agglomeration). The details are as follows.
First, we use the entropy weight method to aggregate several variables that can characterize the city’s digitalization level into one variable, digitalscore. Specifically, several of the variables that reflect the level of urban digitalization are: the number of internet users per 100 people; the number of mobile phone users per 100 people; the proportion of computer services and software practitioners; per capita telecommunications business volume; per capita postal business volume; and digital inclusive finance index.
Second, the degree of trade openness (trade) is equal to the logarithm of the city’s import and export trade volume.
Third, regarding the measurement of the agglomeration level of the information service industry (agglomeration), following O’Donoghue and Gleave [28] and Freedman [29], we use the location entropy method to measure agglomeration. Specifically, the calculation formula of the agglomeration level of r industry in city i during the period of t is
agglomeration irt = ( e irt / i e irt ) / ( i e irt / i r e irt )
where agglomerationirt is the agglomeration degree of r industry in city i during period t; and e irt refers to the number of employees of r industry in city i during period t. The larger the agglomerationirt, the more the r industry in the city is clustered. In our paper, r refers to the information service industry.

4. Empirical Analyses

4.1. Benchmark Regression Results

Table 2 presents the main results for the DID specification. Column (1) only includes the pilot implementation of CBEC comprehensive pilot zones as an explanatory variable. Column (1) shows that the estimated coefficient of D it is 0.568, which is significantly positive at the 1% level, indicating that, compared with other cities that are not CBEC comprehensive pilot zones, the establishment of CBEC comprehensive pilot zones will enable the per capita real GDP of the cities where the comprehensive pilot zones are located to increase by 56.8%. In column (2), we added city-level control variables. Column (2) shows that the estimated coefficient of D it is 0.363, which is significantly positive at the 1% level. Column (3) adds more year-level control variables, and our regressor of interest, D it , is statistically significant and positive at the 1% level.
Column (4) adds more control variables. Column (4) suggests that the coefficient of D it is 0.104, which is significantly positive at the 1% level, indicating that CBEC comprehensive pilot zones can effectively stimulate local economic growth by 10.4%.
In column (4), the estimated coefficient of investment is significantly positive, which means that for every 1% increase in social fixed asset investment, the local per capita GDP will increase by 6.7%. The estimated coefficient of consumption is significantly positive, indicating that for every 1% increase in social consumption, the local per capita GDP will increase by 5.4%. The impact of other control variables on per capita GDP is not significant and has no statistical significance, but if these variables are discarded, it may result in missing variables.
Therefore, Table 2 implies that CBEC comprehensive pilot zone implementation can significantly promote the growth of local per capita GDP and improve the welfare of residents.

4.2. Parallel Trend Test and Dynamic Effect Analysis

The premise of using the DID method is to meet the parallel trend assumption. In other words, when it is not impacted by the pilot policy, the per capita GDP level of the treatment group and the control group has the same change trend. Due to the different times the pilot cities are impacted by the policy, we cannot simply set the virtual variable of time as the critical point of policy occurrence in a certain year; we need to set the virtual variable of the relative time value of policy implementation in the CBEC comprehensive pilot zone for each city time point. At the same time, because the CBEC pilot is affected by factors such as the intensity of policy implementation, the basis of policy implementation, and the adjustment of production factors, the policy effect of the CBEC pilot may have a buffer period, resulting in a certain delay in the implementation effect of the policy. Based on these two considerations, we follow Beck et al. [30] and use the event study method to build the following dynamic model:
GDPP it = α + k - 4 4 β k D it k + δ X it + λ i + λ t + ε it
where i and t represent city and year, respectively; GDPP it denotes the actual per capita GDP; and D it k indicates that the event of the establishment of CBEC pilot zones is a dummy variable. The assignment rules of D it k are as follows.
D it k is the relative time dummy variable. Provided that the year when city i became a CBEC pilot city is s (s = 2015, 2016, 2018), then we set k = t–s. When k is negative, if t is smaller than the year when the CBEC pilot policy is implemented, then we set D it k = 1 ; otherwise, we set D it k = 0 . When k is no smaller than 0, if t is larger than the year when the CBEC pilot policy is implemented, then we set D it k = 1 ; otherwise, we set D it k = 0 . In Equation (6), the year before the pilot establishment of CBEC is taken as the benchmark year.
The results are shown in Figure 3. Before the policy, the relative time dummy variable coefficients are not significant, and the values are small, which shows that, before the policy, there is no significant difference between the treatment group and the control group in the per capita GDP level. In other words, the CBEC pilot zone policy conforms to the parallel trend hypothesis. In terms of the dynamic effects of the policy, considering that, as of 2019, the first batch of pilot cities have had the policy in place for nearly five years, but the first batch is only Hangzhou, our paper mainly analyzes the dynamic effects in the four periods. The results show that two years after the implementation of the pilot policy, the impact coefficient of the CBEC pilot zone policy is significantly positive and rising, indicating that the CBEC pilot zone policy can produce the policy effect of stimulating the per capita GDP; however, it has a certain lag.

4.3. Robustness Test

4.3.1. Changing City Samples

Considering the limited number of urban samples for the benchmark regression in this paper, only the first-, second-, third-tier, and new first-tier cities in China are selected. Therefore, we added more data to the original base, increasing the number of urban samples to 266. Table 3 shows a comparison between the estimated results and the benchmark regression of Table 2. The D it result is still significant, but the estimated coefficient is increased. This shows that after considering more small cities as the control group, the economic effect of CBEC pilot zones will be clearer.

4.3.2. Changing the Fourth and Fifth Batch Groups of Pilot Cities

In the benchmark regression, as the sample time does not include 2020, the fourth and fifth batches of pilot cities are included in the regression as control groups. Considering that the samples of the fourth and fifth batches of pilot cities may affect the estimated results, we use two methods to check the robustness of the benchmark regression results. (1) We extend the time of the sample to 2020 and introduce the fourth and fifth batches of pilot cities into the sample as treatment groups. The estimated results are shown in columns (1)–(4) of Table 4. Compared with Table 2, the estimated coefficient of D it is significant at the level of 1%. (2) To ensure that the policy effect of the CBEC pilot will not be affected by the fourth and fifth batches during the sample period, we remove the samples of the fourth and fifth batches and re-estimate them. The estimated results are shown in columns (5)–(8) of Table 4. Compared with Table 2, in columns (5)–(8), the estimated coefficient of D it is significant at the level of 1%.

4.3.3. Placebo Test

Following La et al. [31], Abadie et al. [32], and Ma et al. [3], we divided the placebo test into two steps. First, 33 urban samples were randomly selected as the treatment group, while the rest of the cities were used as the control group. Second, we set the CBEC pilot city establishment time at random. Figure 4 shows the distribution of the estimates from 500 runs along with the baseline results. The distribution of the estimates from the random assignments is centered around zero, and the standard deviation of the estimates is not significant. The dotted line in Figure 4 represents the estimated coefficient of D it , which is significantly different from the estimated value of the coefficient obtained in the placebo test, thus confirming that the effect of CBEC pilot city establishment on improving GDP does not come from unobservable factors.

4.4. Heterogeneity Analysis

4.4.1. Differences between Cities in Coastal and Inland Areas

As shown in column (1) of Table 5, the estimated coefficient of D it in coastal areas is 0.135, which is significant at the level of 1%. As shown in column (2) of Table 5, the estimated coefficient of D it in inland areas is 0.056, which is significant at the level of 10%. This empirical result shows that a CBEC pilot zone will promote the economic growth of coastal areas more evidently than that of inland areas. One possible reason for this is that, compared with inland areas, coastal areas have the advantages of resource endowments, such as commodity logistics network systems, CBEC talents, and regional advantages, which provide more assistance for the development of CBEC. Therefore, it will be easier for the construction of CBEC pilot zones to achieve good results.

4.4.2. Differences between Eastern, Central, and Western China

CBEC pilot cities are widely distributed in various regions of eastern, central, and western China, providing conditions for us to analyze the regional heterogeneity of the policy effects. Columns (3) to (5) of Table 5 show the economic impact of CBEC pilot policies on eastern, central, and western cities. The estimated coefficient of D it in the eastern region is significantly positive, while the estimated coefficient of D it in the central and western regions fails to pass the significance test. This shows that the establishment of CBEC pilot cities has not achieved positive results in the central and western regions, where the construction of CBEC development infrastructure software and hardware is relatively weak, and CBEC talents are scarce. As a result of this impact, the “siphon effect” of the eastern region is becoming increasingly significant. Finally, the development of CBEC pilot cities in the eastern, central, and western regions shows the “Matthew effect”, in which the eastern region is an example of “the strong get stronger” and the central and western regions display “the weak get weaker” effect. To break this situation, to narrow the development gap between the east and the west, and to achieve leapfrog development for China’s CBEC, they need to work together.

4.4.3. Differences between Different Batches

Columns (6) to (8) of Table 5 show the economic effects of different batches of CBEC pilot zones. According to the estimation coefficient of D it , the impact of the first three batches of CBEC pilot zone policies on economic growth is significantly positive, which shows that each batch of CBEC pilot zone policy has achieved good economic results. Our further analysis found that the estimated coefficient of the first batch of CBEC pilot policies is higher than that of the third batch of CBEC pilot policies, while the estimated coefficient of the third batch of CBEC pilot policies is higher than that of the second batch of CBEC pilot policies. This shows that there is a certain relationship between the approval time of a CBEC pilot zone and its economic performance, but it is not an absolutely positive relationship. One possible reason for this is that the operation effect of a CBEC pilot zone is closely related to the talent, regional advantages, and other resource endowments of a city’s CBEC development.

4.5. Influencing Mechanism Analysis

Column (1) of Table 6 shows that the estimated coefficient of D it is 0.041, which is significant at the level of 1%. As shown in column (4), the estimated coefficients of D it and digitalscore for economic growth are positive at the significance level of 1%. This empirical result means that D it can improve economic growth by enabling the improvement of urban digital construction. This is because digital construction is an important part of the establishment of CBEC pilot zones, and digital technology helps promote economic growth [33,34]. Therefore, urban digital construction is a mediating mechanism for the construction of CBEC pilot zones to promote economic growth.
Column (2) of Table 6 reveals that the estimated coefficient of D it is 0.047, which is significant at the level of 10%. As shown in column (5), the estimated coefficients of D it and trade for economic growth are positive at the significance level of 1%. This means that D it can improve economic growth by enabling a degree of trade openness in cities. This is because CBEC is a new model of international trade rooted in internet information technology [3]. Therefore, one of the most important ways for CBEC pilot zone construction to stimulate urban economic growth is to enable a degree of trade openness.
Column (3) of Table 6 shows that the estimated coefficient of D it is 0.338, which is significant at the level of 1%. As shown in column (6), the estimated coefficients of D it and agglomeration for economic growth are significantly positive. This shows that the construction of a CBEC pilot zone can promote an improvement in local GDP by gathering information service industries. One possible reason for this is that one of the most important tasks in building a CBEC pilot zone is to build a complete CBEC industrial chain and ecological chain, and to form an industrial agglomeration of online integrated services and offline industrial parks.
To sum up, the above results show that the construction of a CBEC pilot zone affects economic growth mainly through three channels: urban digitalization, trade openness, and the agglomeration of the information service industry. In other words, the construction of a CBEC pilot zone promotes economic growth by improving the level of urban digitalization, the degree of trade openness, and the agglomeration level of the information service industry.

5. Discussion

In this paper, through a theoretical framework and empirical analysis, we conclude that the construction of a CBEC pilot zone can promote economic growth. Through further analysis, we find that, on the one hand, the policy effect of a pilot zone is heterogeneous in different regions and different batches. On the other hand, CBEC can promote economic growth through three channels: urban digital construction, trade openness, and industrial agglomeration of the information service industry. Compared with the existing literature, our analyses of the policy effect of the establishment of pilot zones are more comprehensive.
From the results of the theoretical mechanism analysis, our paper finds that the “no ticket tax exemption” policy implemented by various pilot zones in terms of tax supervision helps facilitate the import and export activities of CBEC enterprises. This is consistent with the research findings of Martens [9] and Einav et al. [10], who found that breaking down barriers, such as those of consumption tax and value added tax, is conducive to the development of cross-border online trade. In addition, the simplification of the existing customs clearance process in each pilot zone is also conducive to the development of CBEC, which is consistent with the conclusion of Kim et al. [11].
When comparing our empirical results with the results of the existing literature [16,17], it must be pointed out that we arrived at a new conclusion regarding how the establishment of a CBEC pilot zone affects economic growth. We found that the construction of a comprehensive pilot zone enables economic growth through the three channels of urban digital construction, trade openness, and industrial agglomeration of the information service industry. We also deconstructed the policy effects of comprehensive pilot zones from the perspective of regional heterogeneity and different batches and described in detail the policy dividends generated by the establishment of comprehensive pilot zones. In the past, analysis of how the establishment of comprehensive pilot zones affected economic growth remained at the theoretical level, and the facts are still unknown. From an empirical point of view, our paper answers the key questions of how the establishment of comprehensive pilot zones will benefit economic development and which economic sectors will prosper.
More broadly, our causal framework quantitatively analyzes the economic effects of the construction of CBEC pilot zones. However, the social and environmental effects of the construction of CBEC pilot zones are still unclear; for example, the impact of the construction of a pilot zone on the employment demands of enterprises and on urban carbon emissions, which is a direction for further research.

6. Conclusions and Suggestions

6.1. Conclusions

Our paper regards the implementation of the CBEC comprehensive pilot zone policy as a “quasi-natural experiment”. First, we theoretically analyzed the impact mechanism of the CBEC pilot zone policy on economic growth. Second, based on the data of Chinese cities from 2011 to 2019, we employed the DID model to evaluate the impact and internal mechanism of the establishment of CBEC pilot zones on economic growth. Third, we considered the heterogeneity of the impact of the CBEC pilot zone policy on economic growth in different locations and batches. The empirical results show the following:
(1)
The construction of CBEC pilot zones has significantly promoted China’s economic growth. To verify the effectiveness and robustness of the benchmark regression results, we used a parallel trend hypothesis test, a placebo test, and other methods.
(2)
The impact of the construction of CBEC pilot zones on economic growth is significantly heterogeneous: first, compared with inland areas, the construction of CBEC pilot zones will play a clearer role in promoting economic growth in coastal areas; second, compared with the central and western regions, the construction of CBEC pilot zones will play a more evident role in promoting economic growth in the eastern region; and third, the economic effects of the construction of the first three batches of CBEC pilot zones are relatively apparent.
(3)
The construction of CBEC pilot zones promotes economic growth through three channels: urban digital construction, trade openness, and the agglomeration of the information service industry.

6.2. Suggestions

Based on the above conclusions, we further propose the following policy recommendations:
(1)
The construction of China’s CBEC comprehensive pilot zones also requires a large amount of government policy support to promote the institutional innovation and model innovation of CBEC pilot zones. China’s CBEC pilot zones have only been operating for a short time, and they still lack sufficient coping capacity in terms of operational stability and sustainability. Therefore, the Chinese government needs to design top-level policy support for the development of CBEC and provide support from the earliest aspects of CBEC development, with regard to things such as production land, commodity quality inspection, tax rate reduction, and fiscal and financial support. This will help CBEC pilot zones in the cultivation of large CBEC platform subjects, talent recruitment, system innovation, and model innovation.
(2)
CBEC comprehensive pilot zones also need to continue to carry out bold reform and exploration. First, CBEC pilot zones should rely on modern information technology, blockchain termination, big data, and other digital technology to transform the service, logistics, and payment links in CBEC transactions and promote the innovation and development of CBEC business process re-engineering and supervision modes. Second, CBEC comprehensive pilot zones should continue to facilitate the integration of CBEC customs clearance, information sharing, and regulatory innovation to realize the liberalization and convenience of CBEC trade and to ultimately encourage CBEC to become a new growth point and a new competitive advantage for China’s international trade development. Finally, CBEC pilot zones need to strive to build a complete CBEC industrial chain and ecological chain and to form a CBEC online and offline business industry cluster.
(3)
CBEC comprehensive pilot zones in different regions and batches need to identify their positioning and weaknesses to narrow the gap between different CBEC pilot areas. For example, Shenzhen has shortcomings in CBEC services. It is necessary to pay attention to the payment, logistics, and customs clearance systems of CBEC development, to optimize the service system, and to speed up the construction of CBEC industrial parks in Futian, Yantian, and other blocks. Shanghai and Hangzhou need to focus on how to further innovate the development and reform of CBEC based on the existing development advantages. Other CBEC pilot zones should pay heed to their resource endowment advantages; make full use of the CBEC pilot zone policy dividends in combination with regional characteristics; accelerate the construction of software and hardware, such as infrastructure, talent training, and policy supporting services for the development of CBEC; and accelerate the construction and development of CBEC pilot zones.
(4)
The CBEC pilot zone is a good experimental field for institutional innovation. The Chinese government should actively refine the rules and standards to conform to the world digital trade development trend in the process of experimental exploration. On the one hand, this will continuously create convenient conditions for CBEC enterprises, reduce trade costs, improve trade efficiency, and accelerate the transformation and upgrading of China’s CBEC. On the other hand, it will also help export the “Chinese-style template” of the CBEC development model to the world, along with the digital trade rules and standards, thus promoting global economic governance.
This paper still has some limitations. Due to data restrictions, we were not able to empirically study the economic effects of the comprehensive pilot zones established over the last two years. Furthermore, we were not able to study the economic effect of the construction of CBEC pilot zones from the micro perspective of enterprises.

Author Contributions

Conceptualization, M.Z. and Z.W.; Data curation, M.Z.; Formal analysis, M.Z. and Z.W.; Investigation, M.Z.; Methodology, M.Z.; Software, M.Z.; Writing—original draft, M.Z.; Writing—review and editing, Z.W. and X.G. All authors have read and agreed to the published version of the manuscript.

Funding

This research was funded by the Research Project of the National Natural Science Foundation of China (grant number 71774129) and the Shaanxi Education Science Planning Project (grant number SGH21Y0007).

Institutional Review Board Statement

Not applicable.

Informed Consent Statement

Not applicable.

Data Availability Statement

The data in our paper are all from the China Urban Statistical Yearbook (https://data.cnki.net/yearbook/Single/N2022040095, accessed on 10 March 2022).

Conflicts of Interest

The authors declare no conflict of interest.

References

  1. Goldmanis, M.; Hortacsu, A.; Syverson, C.; Emre, O. E-Commerce and the Market Structure of Retail Industries. Econ. J. 2010, 120, 651–682. [Google Scholar] [CrossRef]
  2. Lendle, A.; Vezina, P.-L. Internet Technology and the Extensive Margin of Trade: Evidence from EBay in Emerging Economies. Rev. Dev. Econ. 2015, 19, 375–386. [Google Scholar] [CrossRef]
  3. Ma, S.; Guo, X.; Zhang, H. New Driving Force for China’s Import Growth: Assessing the Role of Cross-Border e-Commerce. World Econ. 2021, 44, 3674–3706. [Google Scholar] [CrossRef]
  4. Stoerk, T.; Dudek, D.J.; Yang, J. China’s National Carbon Emissions Trading Scheme: Lessons from the Pilot Emission Trading Schemes, Academic Literature, and Known Policy Details. Clim. Policy 2019, 19, 472–486. [Google Scholar] [CrossRef]
  5. Chan, K.S.; Xu, X.; Gao, Y. The China Growth Miracle: The Role of the Formal and the Informal Institutions. World Econ. 2015, 38, 63–90. [Google Scholar] [CrossRef]
  6. North, D.C. Institutions, Institutional Change, and Economic Performance; Cambridge University Press: Cambridge, UK, 1990. [Google Scholar] [CrossRef]
  7. Valarezo, Á.; Pérez-Amaral, T.; Garín-Muñoz, T.; Herguera García, I.; López, R. Drivers and Barriers to Cross-Border e-Commerce: Evidence from Spanish Individual Behavior. Telecommun. Policy 2018, 42, 464–473. [Google Scholar] [CrossRef]
  8. Ho, S.-C.; Kauffman, R.J.; Liang, T.-P. A Growth Theory Perspective on B2C E-Commerce Growth in Europe: An Exploratory Study. Electron. Commer. Res. Appl. 2007, 6, 237–259. [Google Scholar] [CrossRef]
  9. Martens, B. What Does Economic Research Tell Us about Cross-Border E-Commerce in the EU Digital Single Market? Digital Economy Working Paper; Institute for Prospective Technological Studies: Seville, Spain, 2013. [Google Scholar] [CrossRef]
  10. Einav, L.; Knoepfle, D.; Levin, J.; Sundaresan, N. Sales Taxes and Internet Commerce. Am. Econ. Rev. 2014, 104, 1–26. [Google Scholar] [CrossRef] [Green Version]
  11. Kim, T.Y.; Dekker, R.; Heij, C. Cross-Border Electronic Commerce: Distance Effects and Express Delivery in European Union Markets. Int. J. Electron. Commer. 2017, 21, 184–218. [Google Scholar] [CrossRef]
  12. Wang, Y.; Wang, Y.; Lee, S.H. The Effect of Cross-Border E-Commerce on China’s International Trade: An Empirical Study Based on Transaction Cost Analysis. Sustainability 2017, 9, 2028. [Google Scholar] [CrossRef]
  13. Falk, M.; Hagsten, E. E-Commerce Trends and Impacts across Europe. Int. J. Prod. Econ. 2015, 170, 357–369. [Google Scholar] [CrossRef]
  14. Lu, B.; Wang, H. Research on the Competitive Strategy of Cross-Border E-Commerce Comprehensive Pilot Area Based on the Spatial Competition. Sci. Program. 2016, 2016, 6216052. [Google Scholar] [CrossRef]
  15. Jin, F.; Yan-Ling, C.; Xiao-Jun, J.; Liang, Z. An Observation on China Comprehensive Pilot Areas for Cross-Border E-Commerce in Henan Province. Procedia Manuf. 2019, 30, 77–82. [Google Scholar] [CrossRef]
  16. Chen, N. Analysis of the Correlation between Cross-Border E-Commerce and Economic Growth Based on Hierarchical Multilevel Gray Evaluation Model. J. Math. 2022, 2022, 8455404. [Google Scholar] [CrossRef]
  17. Wang, H.-D.; Zheng, C.-F.; Xiao, X. An AMOS Model for Examining the Factors Influencing the Development of China Cross-Border E-Commerce Comprehensive Pilot Areas. Discret. Dyn. Nat. Soc. 2022, 2022, e1889589. [Google Scholar] [CrossRef]
  18. Han, Y. Impact of Environmental Regulation Policy on Environmental Regulation Level: A Quasi-Natural Experiment Based on Carbon Emission Trading Pilot. Environ. Sci. Pollut. Res. 2020, 27, 23602–23615. [Google Scholar] [CrossRef] [PubMed]
  19. Han, F.; Xie, R.; Lu, Y.; Fang, J.; Liu, Y. The Effects of Urban Agglomeration Economies on Carbon Emissions: Evidence from Chinese Cities. J. Clean. Prod. 2018, 172, 1096–1110. [Google Scholar] [CrossRef]
  20. Billmeier, A.; Nannicini, T. Assessing Economic Liberalization Episodes: A Synthetic Control Approach. Rev. Econ. Stat. 2013, 95, 983–1001. [Google Scholar] [CrossRef]
  21. Zang, J.; Wan, L.; Li, Z.; Wang, C.; Wang, S. Does Emission Trading Scheme Have Spillover Effect on Industrial Structure Upgrading? Evidence from the EU Based on a PSM-DID Approach. Environ. Sci. Pollut. Res. 2020, 27, 12345–12357. [Google Scholar] [CrossRef]
  22. Laitsou, E.; Kargas, A.; Varoutas, D. The Impact of ICT on Economic Growth of Greece and EU-28 under Economic Crisis. In Proceedings of the 2017 Internet of Things Business Models, Users, and Networks, Copenhagen, Denmark, 23–24 November 2017; IEEE: Copenhagen, Denmark, 2017; pp. 1–6. [Google Scholar]
  23. Edquist, H.; Henrekson, M. Swedish Lessons: How Important Are ICT and R&D to Economic Growth? Struct. Chang. Econ. Dyn. 2017, 42, 1–12. [Google Scholar] [CrossRef]
  24. Liu, Q.; Qiu, L.D. Intermediate Input Imports and Innovations: Evidence from Chinese Firms’ Patent Filings. J. Int. Econ. 2016, 103, 166–183. [Google Scholar] [CrossRef]
  25. Pierce, J.R.; Schott, P.K. The Surprisingly Swift Decline of US Manufacturing Employment. Am. Econ. Rev. 2016, 106, 1632–1662. [Google Scholar] [CrossRef]
  26. Bertrand, M.; Duflo, E.; Mullainathan, S. How Much Should We Trust Differences-in-Differences Estimates? Q. J. Econ. 2004, 119, 249–275. [Google Scholar] [CrossRef]
  27. Baron, R.M.; Kenny, D.A. The Moderator–Mediator Variable Distinction in Social Psychological Research: Conceptual, Strategic, and Statistical Considerations. J. Personal. Soc. Psychol. 1986, 51, 1173. [Google Scholar] [CrossRef]
  28. O’Donoghue, D.; Gleave, B. A Note on Methods for Measuring Industnial Agglomeration. Reg. Stud. 2004, 38, 419–427. [Google Scholar] [CrossRef]
  29. Freedman, M.L. Job Hopping, Earnings Dynamics, and Industrial Agglomeration in the Software Publishing Industry. J. Urban Econ. 2008, 64, 590–600. [Google Scholar] [CrossRef]
  30. Beck, T.; Levine, R.; Levkov, A. Big Bad Banks? The Winners and Losers from Bank Deregulation in the United States. J. Financ. 2010, 65, 1637–1667. [Google Scholar] [CrossRef]
  31. La Ferrara, E.; Chong, A.; Duryea, S. Soap Operas and Fertility: Evidence from Brazil. Am. Econ. J. Appl. Econ. 2012, 4, 1–31. [Google Scholar] [CrossRef] [Green Version]
  32. Abadie, A.; Diamond, A.; Hainmueller, J. Synthetic Control Methods for Comparative Case Studies: Estimating the Effect of California’s Tobacco Control Program. J. Am. Stat. Assoc. 2010, 105, 493–505. [Google Scholar] [CrossRef]
  33. Liu, Y.; Luan, L.; Wu, W.; Zhang, Z.; Hsu, Y. Can Digital Financial Inclusion Promote China’s Economic Growth? Int. Rev. Financ. Anal. 2021, 78, 101889. [Google Scholar] [CrossRef]
  34. Solomon, E.M.; van Klyton, A. The Impact of Digital Technology Usage on Economic Growth in Africa. Util. Policy 2020, 67, 101104. [Google Scholar] [CrossRef] [PubMed]
Figure 1. The construction of CBEC comprehensive pilot zones and their effect on regional economic growth.
Sustainability 14 11032 g001
Figure 2. Details of pilot cities in 2015, 2016, and 2018.
Sustainability 14 11032 g002
Figure 3. Parallel trend test. Note: The upper and lower dotted lines of the hollow points represent the 95% confidence interval.
Sustainability 14 11032 g003
Figure 4. Placebo test.
Sustainability 14 11032 g004
Table 1. Definitions of variables.
VariablesDefinitionObservationMeanStandard DeviationMinimum ValueMaximum Value
GDPP Real per capita GDP10530.680.3550.11622.183
D it CBEC pilot zones10530.080.25701
investmentSocial fixed asset investment10530.750.2710.00361.798
consumptionSocial consumption level10533.252.5350.374418.499
humancapHuman capital level10534.661.0762.2416.798
roadperPer capita road area10530.020.0180.0000.105
fdiForeign direct investment level10537.098.2170.49473.044
unemploymentUnemployment rate10530.550.2930.0611.919
digitalscoreThe level of urban digitalization10530.020.07000.552
tradeTrade openness10530.772.604011.411
agglomerationAgglomeration level of the information service industry10530.110.42204.039
Table 2. Baseline results.
(1)(2)(3)(4)
D it 0.568 ***0.363 ***0.125 ***0.104 ***
(0.09)(0.03)(0.03)(0.03)
investment 0.067 *
(0.04)
consumption 0.054 ***
(0.01)
humancap −0.028
(0.04)
roadper −0.026
(0.54)
fdi 0.002
(0.00)
unemployment −0.042
(0.04)
Constant0.635 ***0.651 ***0.669 ***0.584 ***
(0.03)(0.00)(0.00)(0.20)
City fixed effectnoyesyesyes
Year fixed effectnonoyesyes
N1053105310531053
R20.1690.8630.9700.975
Note: Robust standard errors clustered at city in parentheses. *** Significant at the 1% level. * Significant at the 10% level.
Table 3. Regression results of changing city samples.
(1)(2)(3)(4)
D it 0.689 ***0.363 ***0.177 ***0.124 ***
(0.09)(0.03)(0.03)(0.03)
investment 0.045 ***
(0.01)
consumption 0.069 ***
(0.01)
humancap 0.016
(0.03)
roadper 0.207
(0.13)
fdi 0.008 **
(0.00)
unemployment −0.020
(0.02)
Constant0.521 ***0.532 ***0.539 ***0.260 **
(0.02)(0.00)(0.00)(0.13)
City fixed effectnoyesyesyes
Year fixed effectnonoyesyes
N2394239423942394
R20.1210.8930.9680.976
Note: Robust standard errors clustered at city in parentheses. *** Significant at the 1% level. ** Significant at the 5% level.
Table 4. Regression results of changing the fourth and fifth batch groups of pilot cities.
(1)(2)(3)(4)(5)(6)(7)(8)
D it 0.509 ***0.350 ***0.116 ***0.100 ***0.530 ***0.360 ***0.131 ***0.114 ***
(0.06)(0.02)(0.02)(0.03)(0.08)(0.03)(0.03)(0.03)
investment 0.057 0.098 *
(0.04) (0.05)
consumption 0.038 *** 0.045 ***
(0.01) (0.01)
humancap −0.028 −0.059
(0.04) (0.05)
roadper −0.213 −0.255
(0.60) (0.75)
fdi 0.003 0.001
(0.00) (0.01)
unemployment −0.051 −0.049
(0.04) (0.05)
Constant0.638 ***0.658 ***0.688 ***0.666 ***0.666 ***0.687 ***0.716 ***0.786 ***
(0.03)(0.00)(0.00)(0.20)(0.04)(0.00)(0.00)(0.24)
City fixed effectnoyesyesyesnoyesyesyes
Year fixed effectnonoyesyesnonoyesyes
N1170117011701170648648648630
R20.1920.8700.9660.9700.1730.9020.9710.974
Note: Robust standard errors clustered at city in parentheses. *** Significant at the 1% level. * Significant at the 10% level.
Table 5. Regression results of heterogeneity analysis.
(1)(2)(3)(4)(5)(6)(7)(8)
Cities in Coastal AreasCities in Inland AreasEastMiddleWestThe First BatchThe Second BatchThe Third Batch
D it 0.135 ***0.056 *0.126 ***0.0590.0130.163 ***0.113 ***0.131 ***
(0.04)(0.03)(0.04)(0.03)(0.03)(0.04)(0.04)(0.04)
investment0.0390.086 *0.0370.0140.153*0.178 **0.176 **0.102 *
(0.07)(0.04)(0.05)(0.05)(0.08)(0.08)(0.07)(0.06)
consumption0.033 **0.078 ***0.044 ***0.114 ***0.033*0.065 ***0.073 ***0.048 ***
(0.02)(0.01)(0.01)(0.02)(0.02)(0.02)(0.02)(0.01)
humancap−0.025−0.012−0.0050.062−0.2100.008−0.015−0.061
(0.06)(0.04)(0.04)(0.07)(0.12)(0.03)(0.04)(0.04)
roadper1.570−0.8440.8071.894 **−2.060−2.910 **−1.487−0.975
(0.95)(0.72)(0.60)(0.70)(1.43)(1.29)(1.02)(0.90)
fdi0.0010.006 *0.0020.0070.007 *0.016 *−0.0160.007 ***
(0.00)(0.00)(0.00)(0.01)(0.00)(0.01)(0.01)(0.00)
unemployment−0.083−0.018−0.131 **0.0110.0720.0660.043−0.038
(0.07)(0.04)(0.05)(0.04)(0.08)(0.07)(0.06)(0.06)
Constant0.696 **0.395 *0.607 ***−0.1251.432 **0.2040.456 **0.698 ***
(0.27)(0.22)(0.20)(0.31)(0.62)(0.14)(0.19)(0.24)
City fixed effectyesyesyesyesyesyesyesyes
Year fixed effectyesyesyesyesyesyesyesyes
N351702639261153342441513
R20.9750.9770.9750.9850.9830.9800.9780.974
Note: Robust standard errors clustered at city in parentheses. *** Significant at the 1% level. ** Significant at the 5% level. * Significant at the 10% level.
Table 6. Regression results of influence mechanism.
(1)(2)(3)(4)(5)(6)
DigitalscoreTradeAgglomerationGDPPGDPPGDPP
D it 0.041 ***0.047 *0.338 ***0.090 ***0.095 ***0.095 ***
(0.01)(0.03)(0.07)(0.03)(0.03)(0.03)
digitalscore 0.355 **
(0.15)
trade 0.207 **
(0.10)
agglomeration 0.029 **
(0.01)
Other variablesyesyesyesyesyesyes
City fixed effectyesyesyesyesyesyes
Year fixed effectyesyesyesyesyesyes
N105310531053105310531053
R20.8360.8810.8390.9760.9760.976
Note: Robust standard errors clustered at city in parentheses. *** Significant at the 1% level. ** Significant at the 5% level. * Significant at the 10% level.
Publisher’s Note: MDPI stays neutral with regard to jurisdictional claims in published maps and institutional affiliations.

