
Sustainability and Industry 4.0: Definition of a Set of Key Performance Indicators for Manufacturing Companies

Abstract
:1. Introduction
2. Materials and Methods
2.1. Research Questions
- How can digitization help to have data in real time and constantly updated?
- How can one measure a generic set of sustainability KPIs in industrial contexts?
- How can one refer to the different areas of sustainability in the economic, social, and environmental fields?
2.2. Methodology
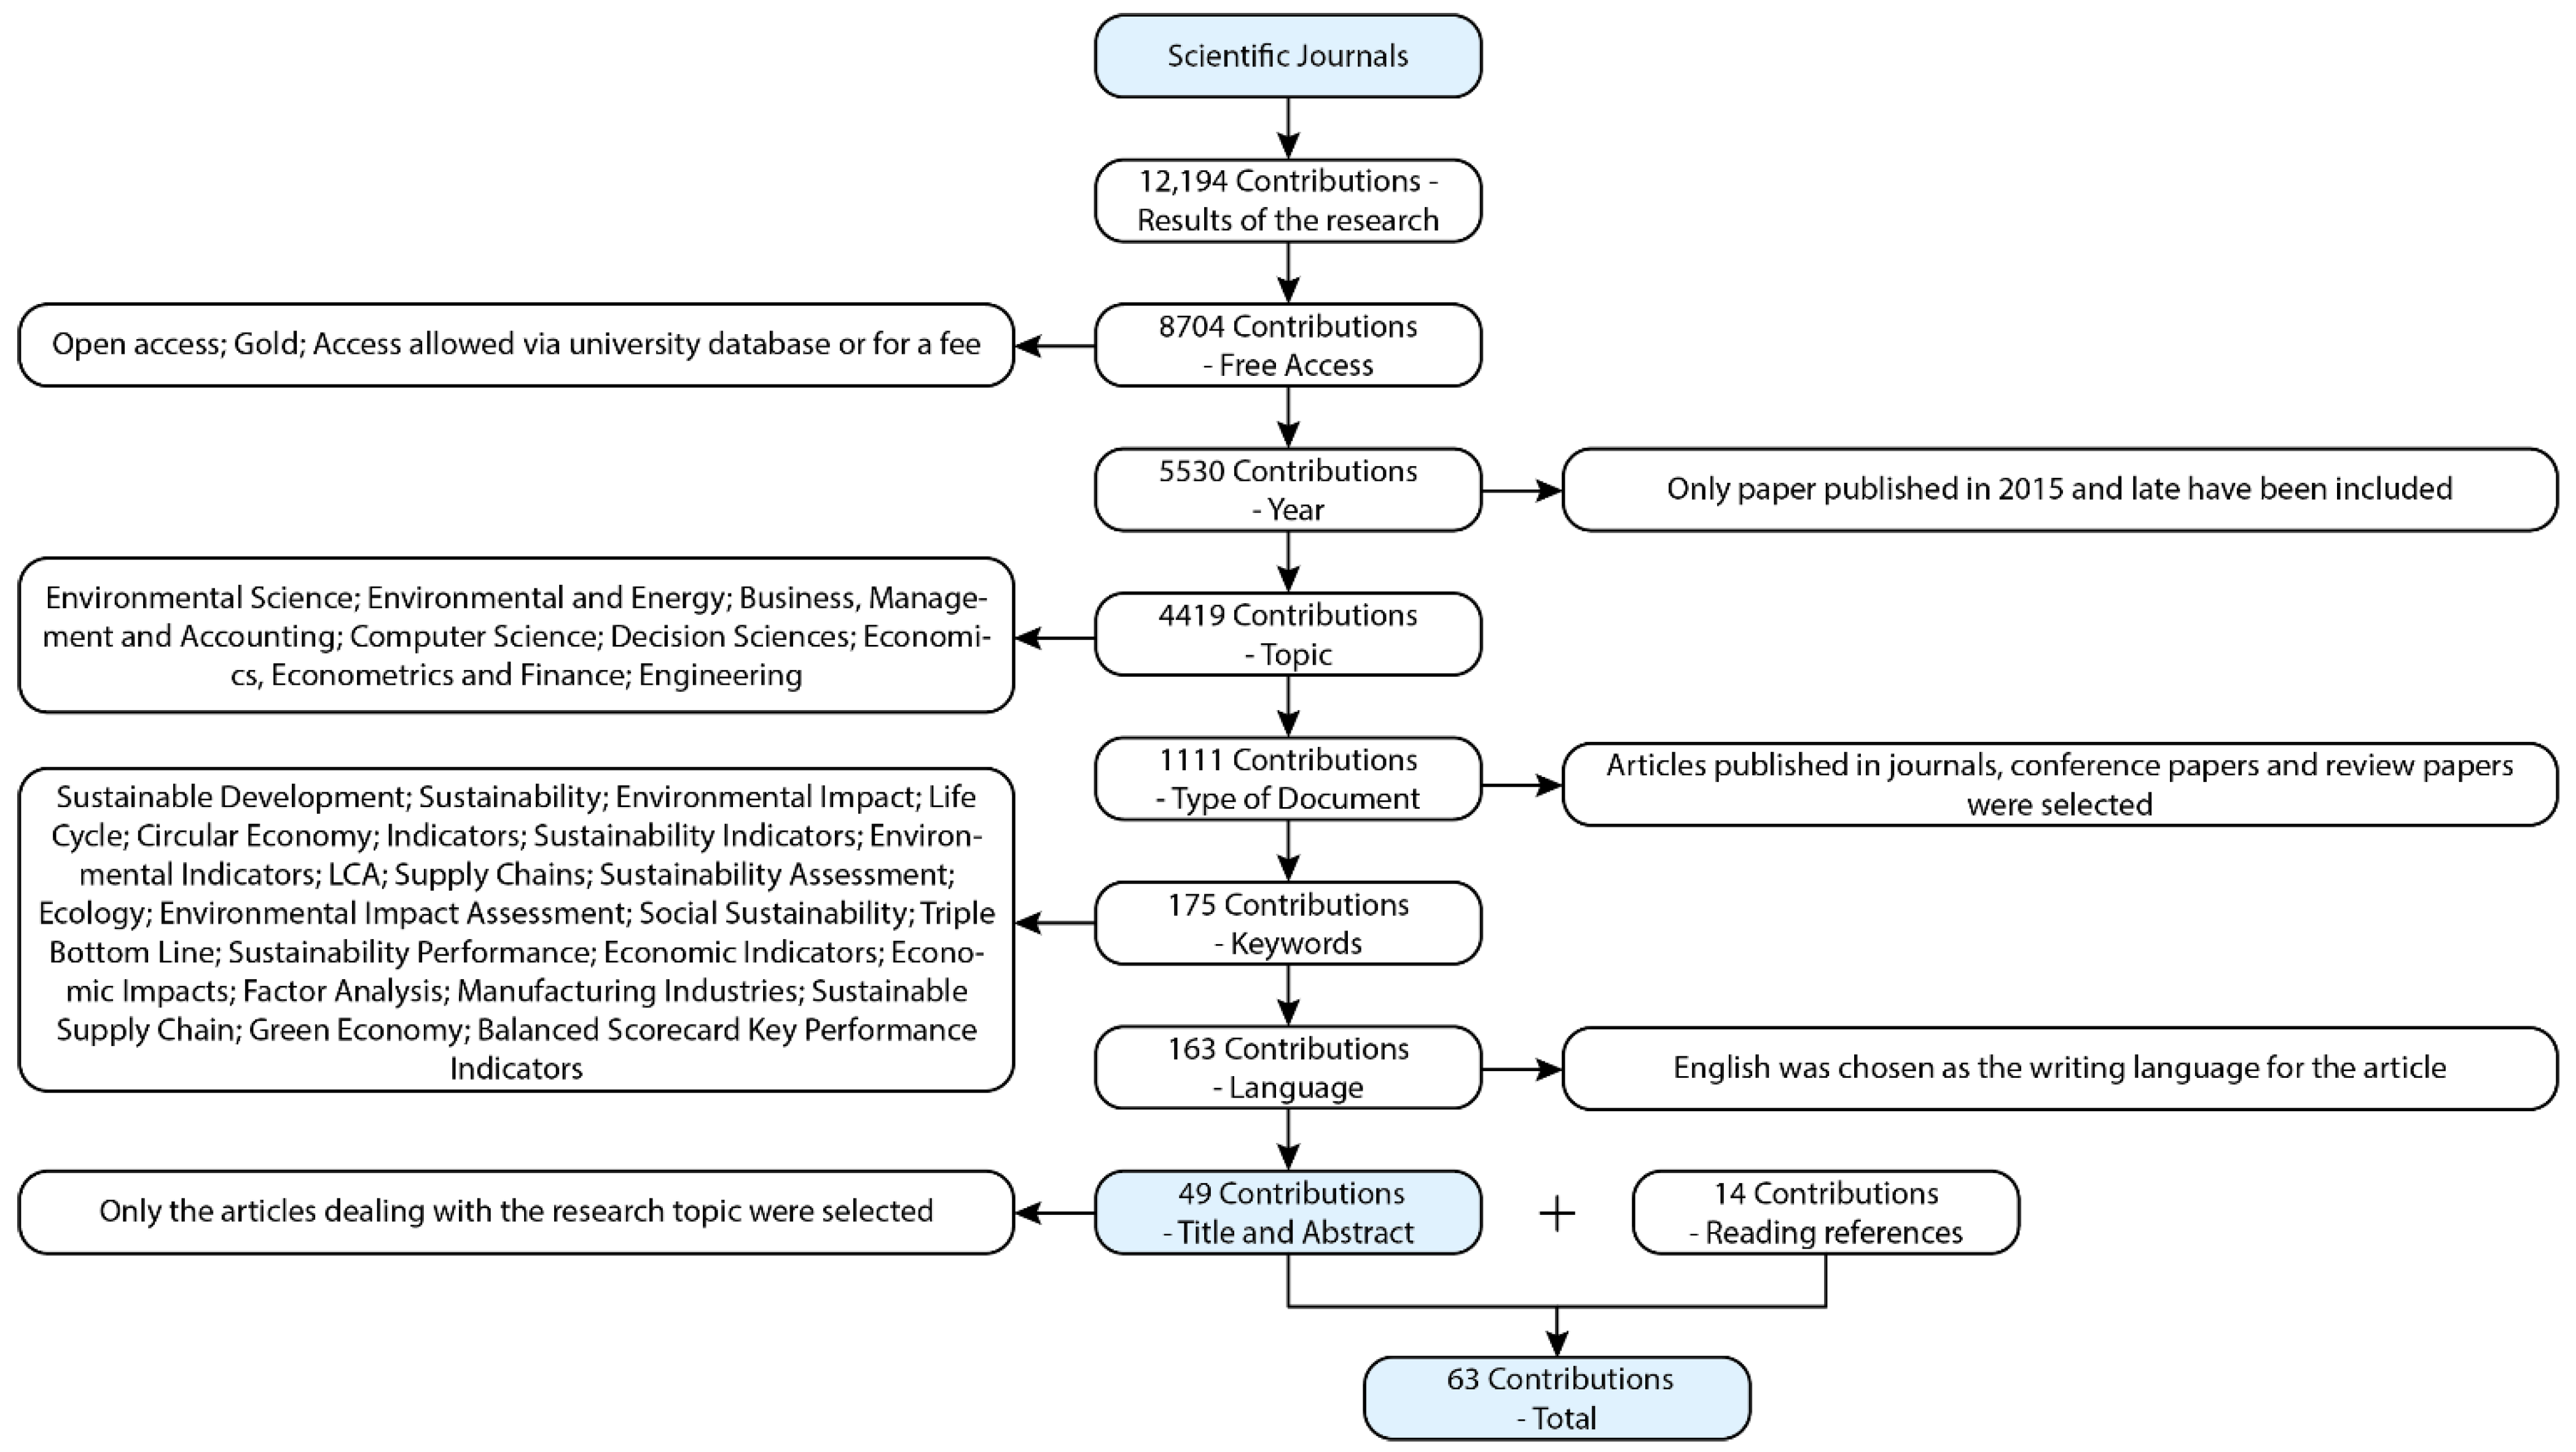
- Free access: we started with 12,194 articles, which were then reduced to 8704 after having selected those with free access (“open access”, “gold”, “access allowed via university database or for a fee”);
- Year: we reduced the articles to 5530 after the analysis of the year of publication—only papers published in 2015 and later were included. We selected articles starting from 2015 as it has been shown in previous articles that this year the peak of publications in this area was highlighted [11]. Nonetheless, additional articles (found in the bibliography of other articles) deemed relevant for the analysis were considered;
- Topic: 4419 articles were discarded after selecting the main topic of the articles analyzed (“Environmental Science”, “Environmental and “Energy”, “Business, Management and Accounting”, “Computer Science”, “Decision Sciences”, “Economics, Econometrics and Finance”, “Engineering”);
- Type of document: of the 1111 remaining articles, articles published in journals, conference papers and review papers were selected;
- Keywords: to further narrow the search, keywords that are most relevant to the topic were selected, resulting in 175 articles (“Sustainable Development”, “Sustainability”, “Environmental Impact”, “Life Cycle”, “Circular Economy”, “Indicators”, “Sustainability Indicators”, “Environmental Indicators”, “LCA”, “Supply Chains”, “Sustainability Assessment”, “Ecology”, “Environmental Impact Assessment”, “Social Sustainability”, “Triple Bottom Line”, “Sustainability Performance”, “Economic Indicators”, “Economic Impacts”, “Factor Analysis”, “Manufacturing Industries”, “Sustainable Supply Chain”, “Green Economy”, “Balanced Scorecard Key Performance Indicators”);
- Language: English was chosen as the writing language for the article, resulting in 163 articles;
- Title and abstract: of the 163 articles, the title and abstract were read, and only the articles dealing with the research topic were selected. The final selection of the articles read was 49.
- Reading references: of the 49 selected articles, the respective bibliographies were reviewed and further 14 articles deemed important for the research were selected (although they were published before 2015), due to their high relevance to the research topic.
2.3. Analysis of the Literature
3. Results
3.1. Selection of Sustainability KPIs
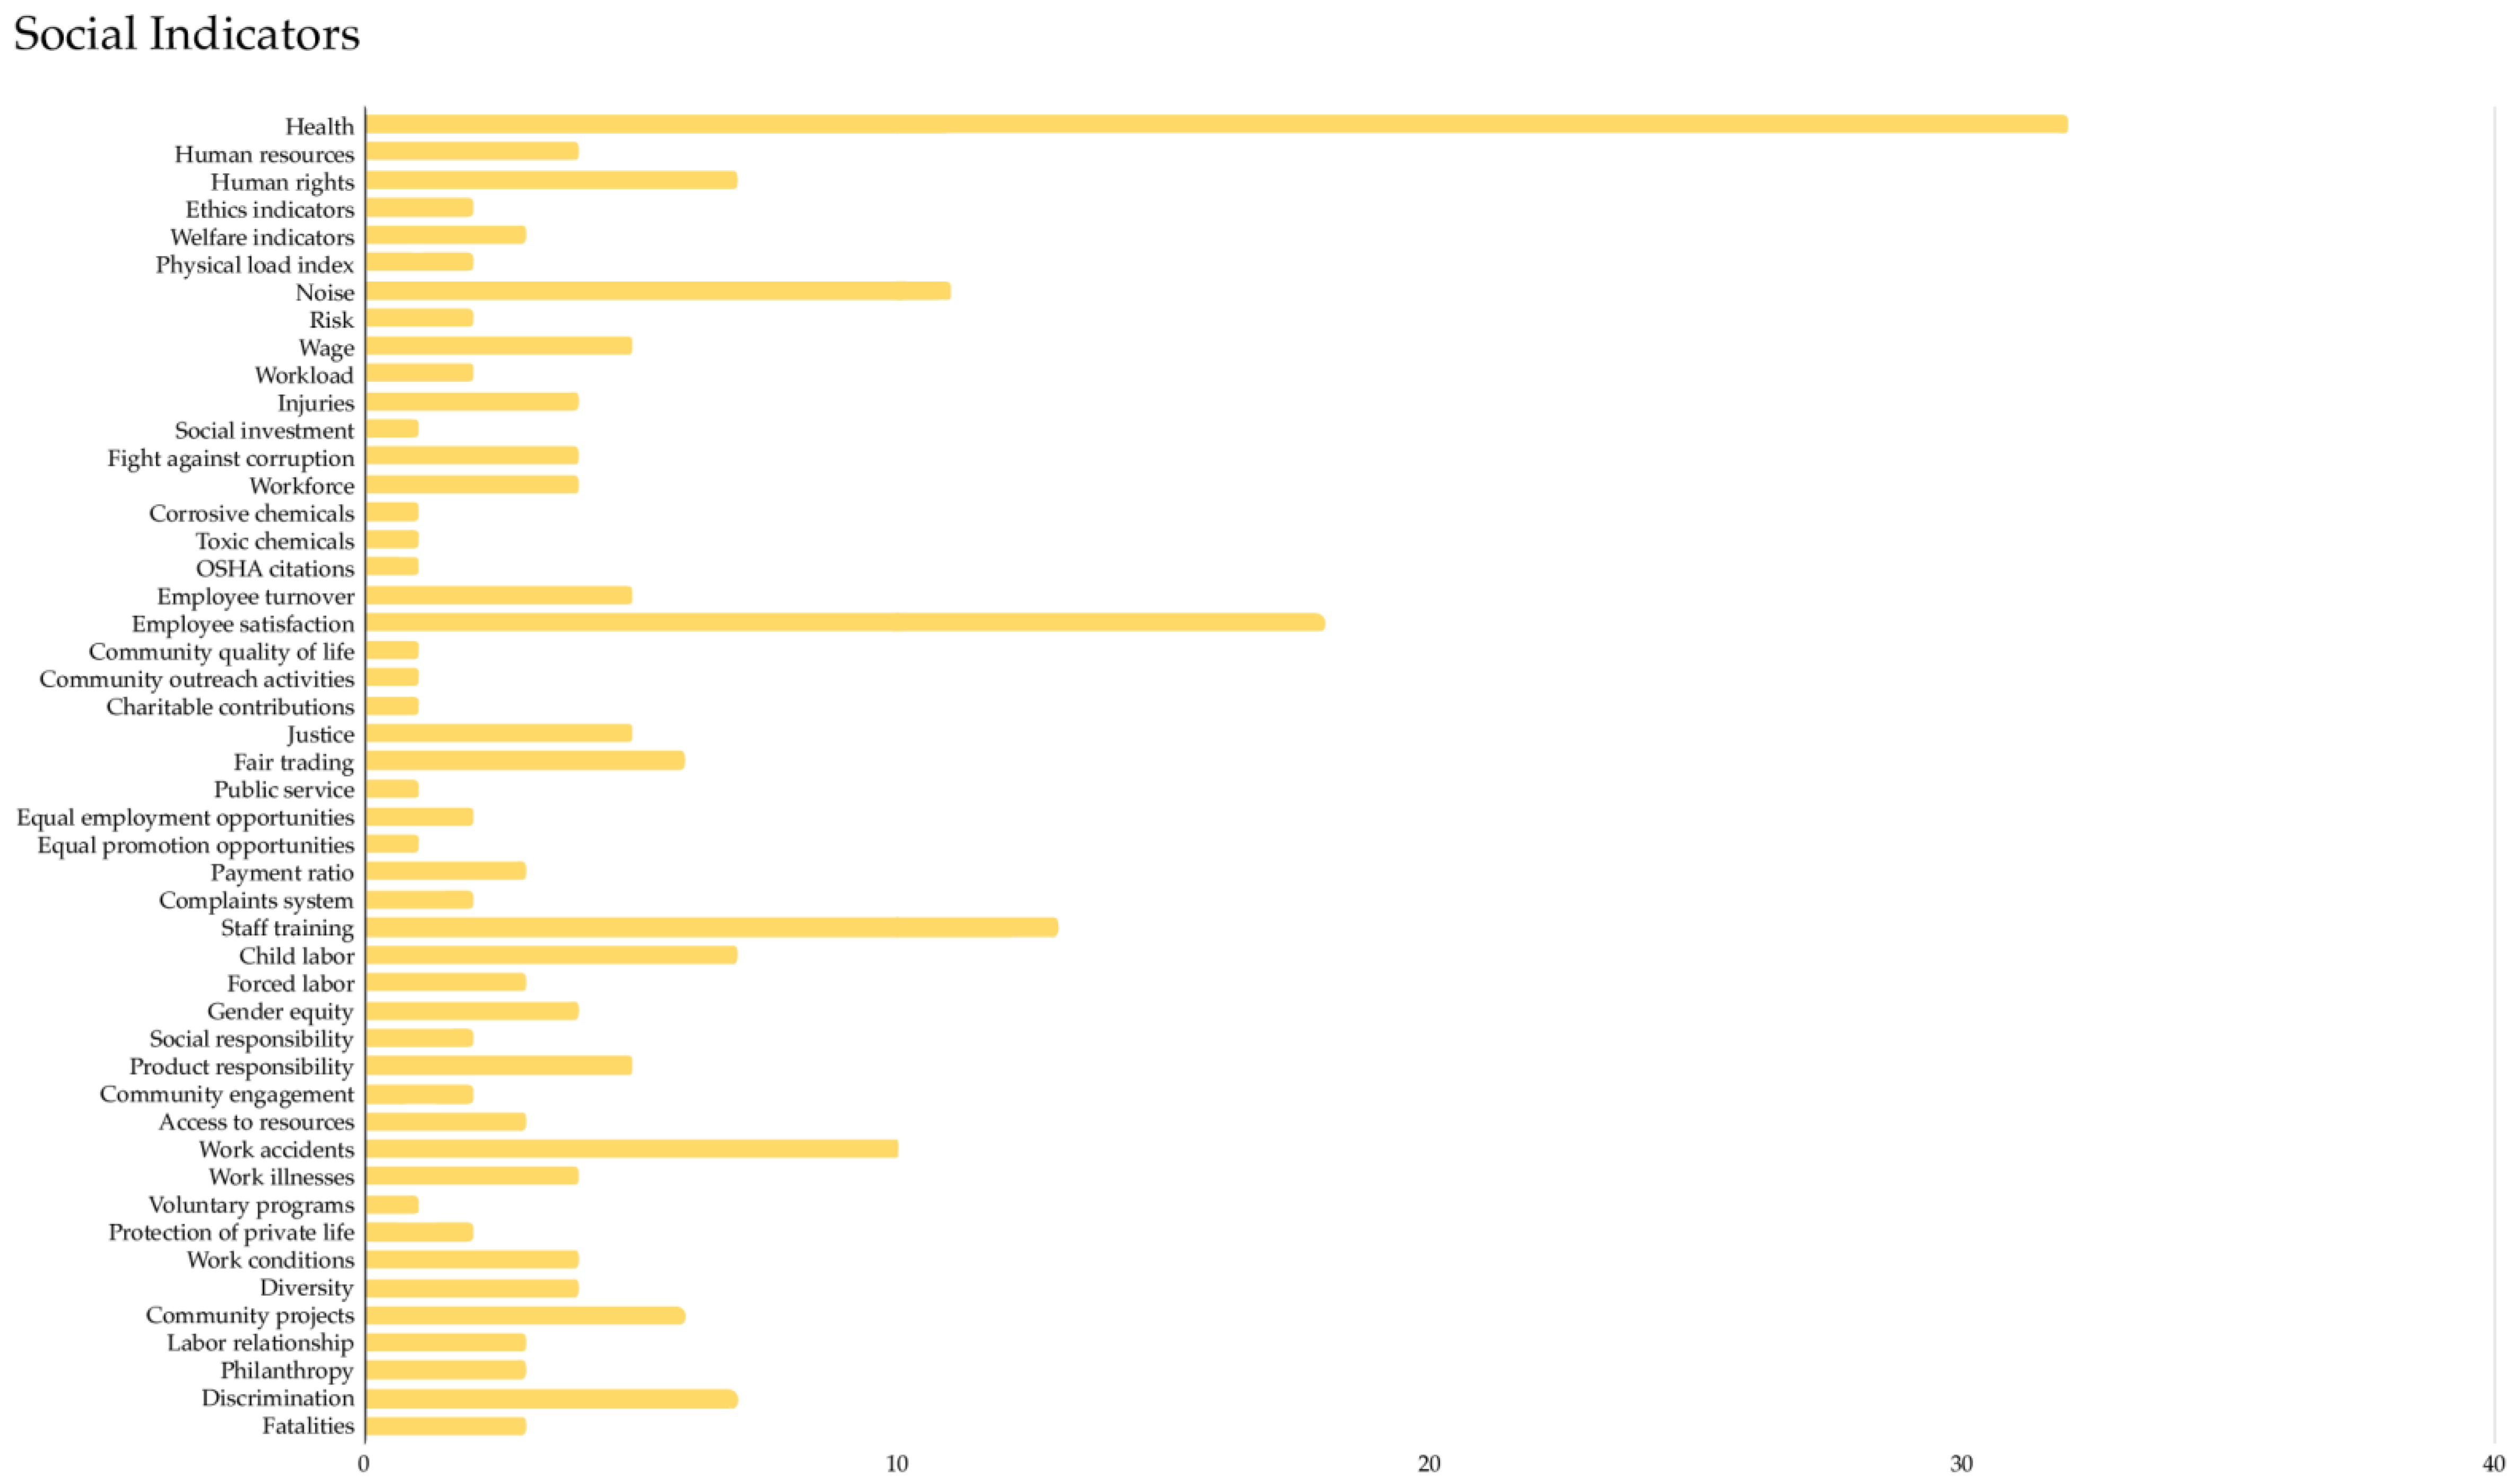
3.1.1. Social KPIs
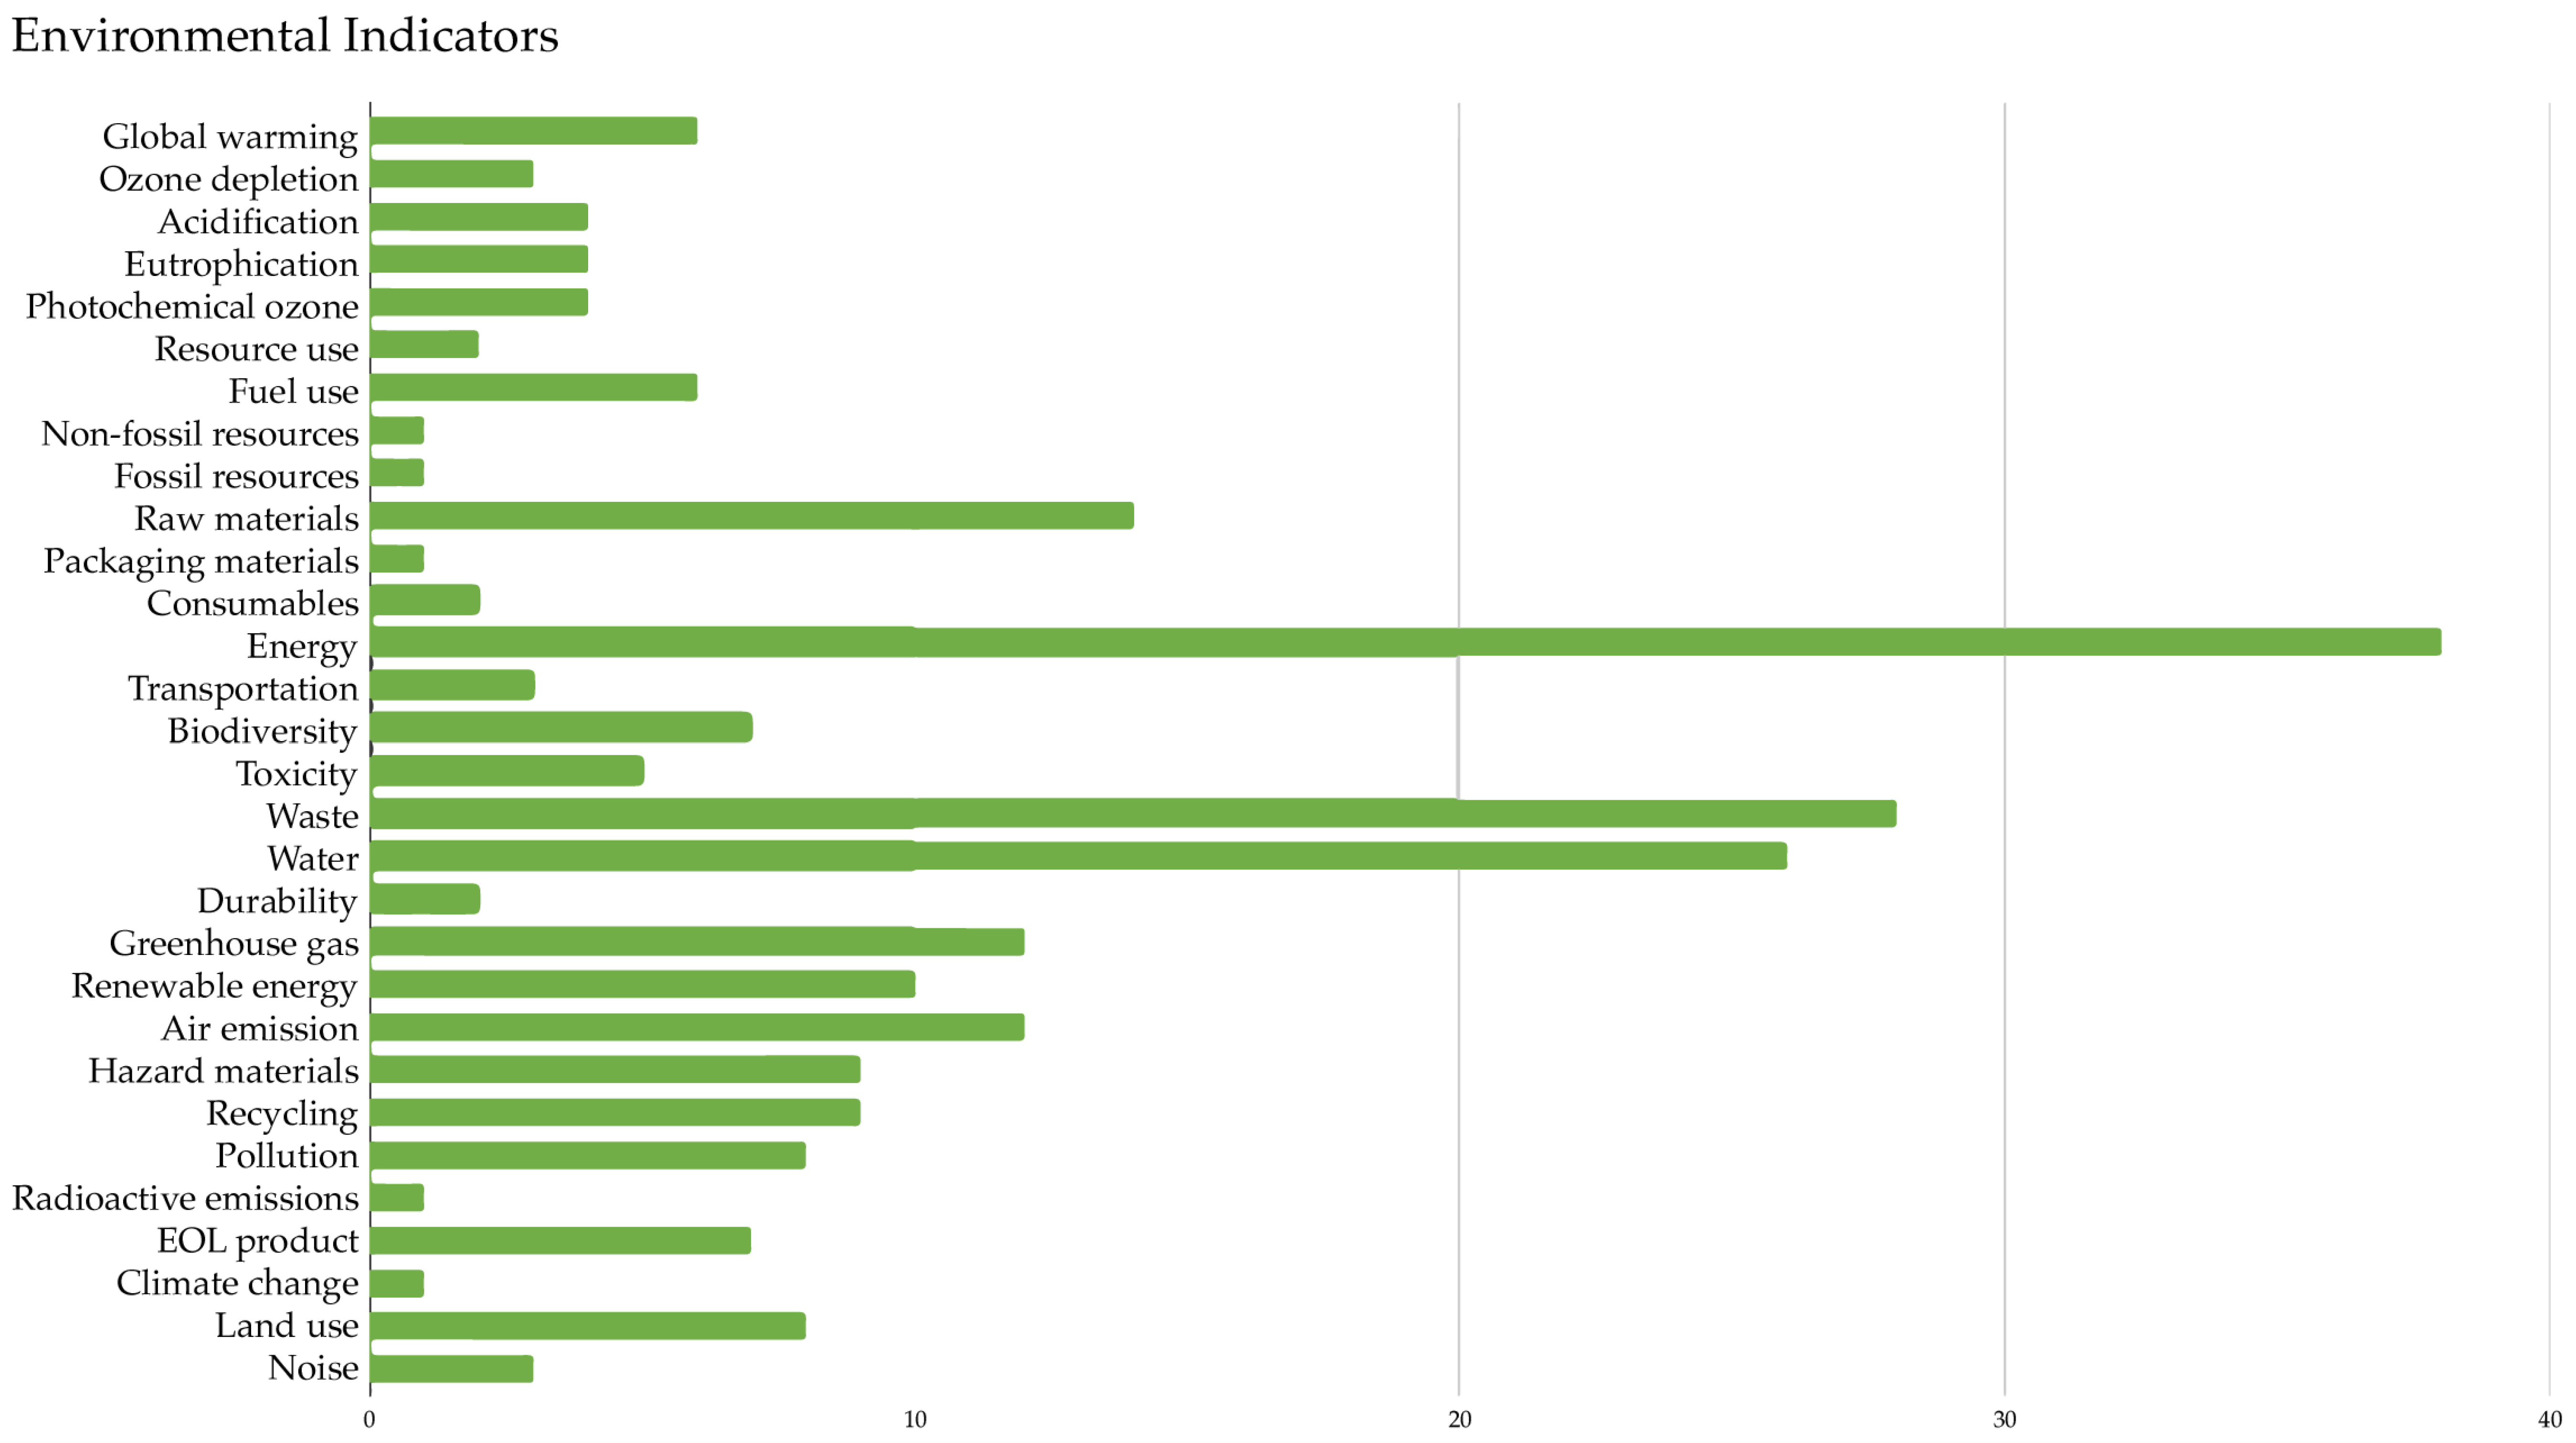
3.1.2. Environmental KPIs
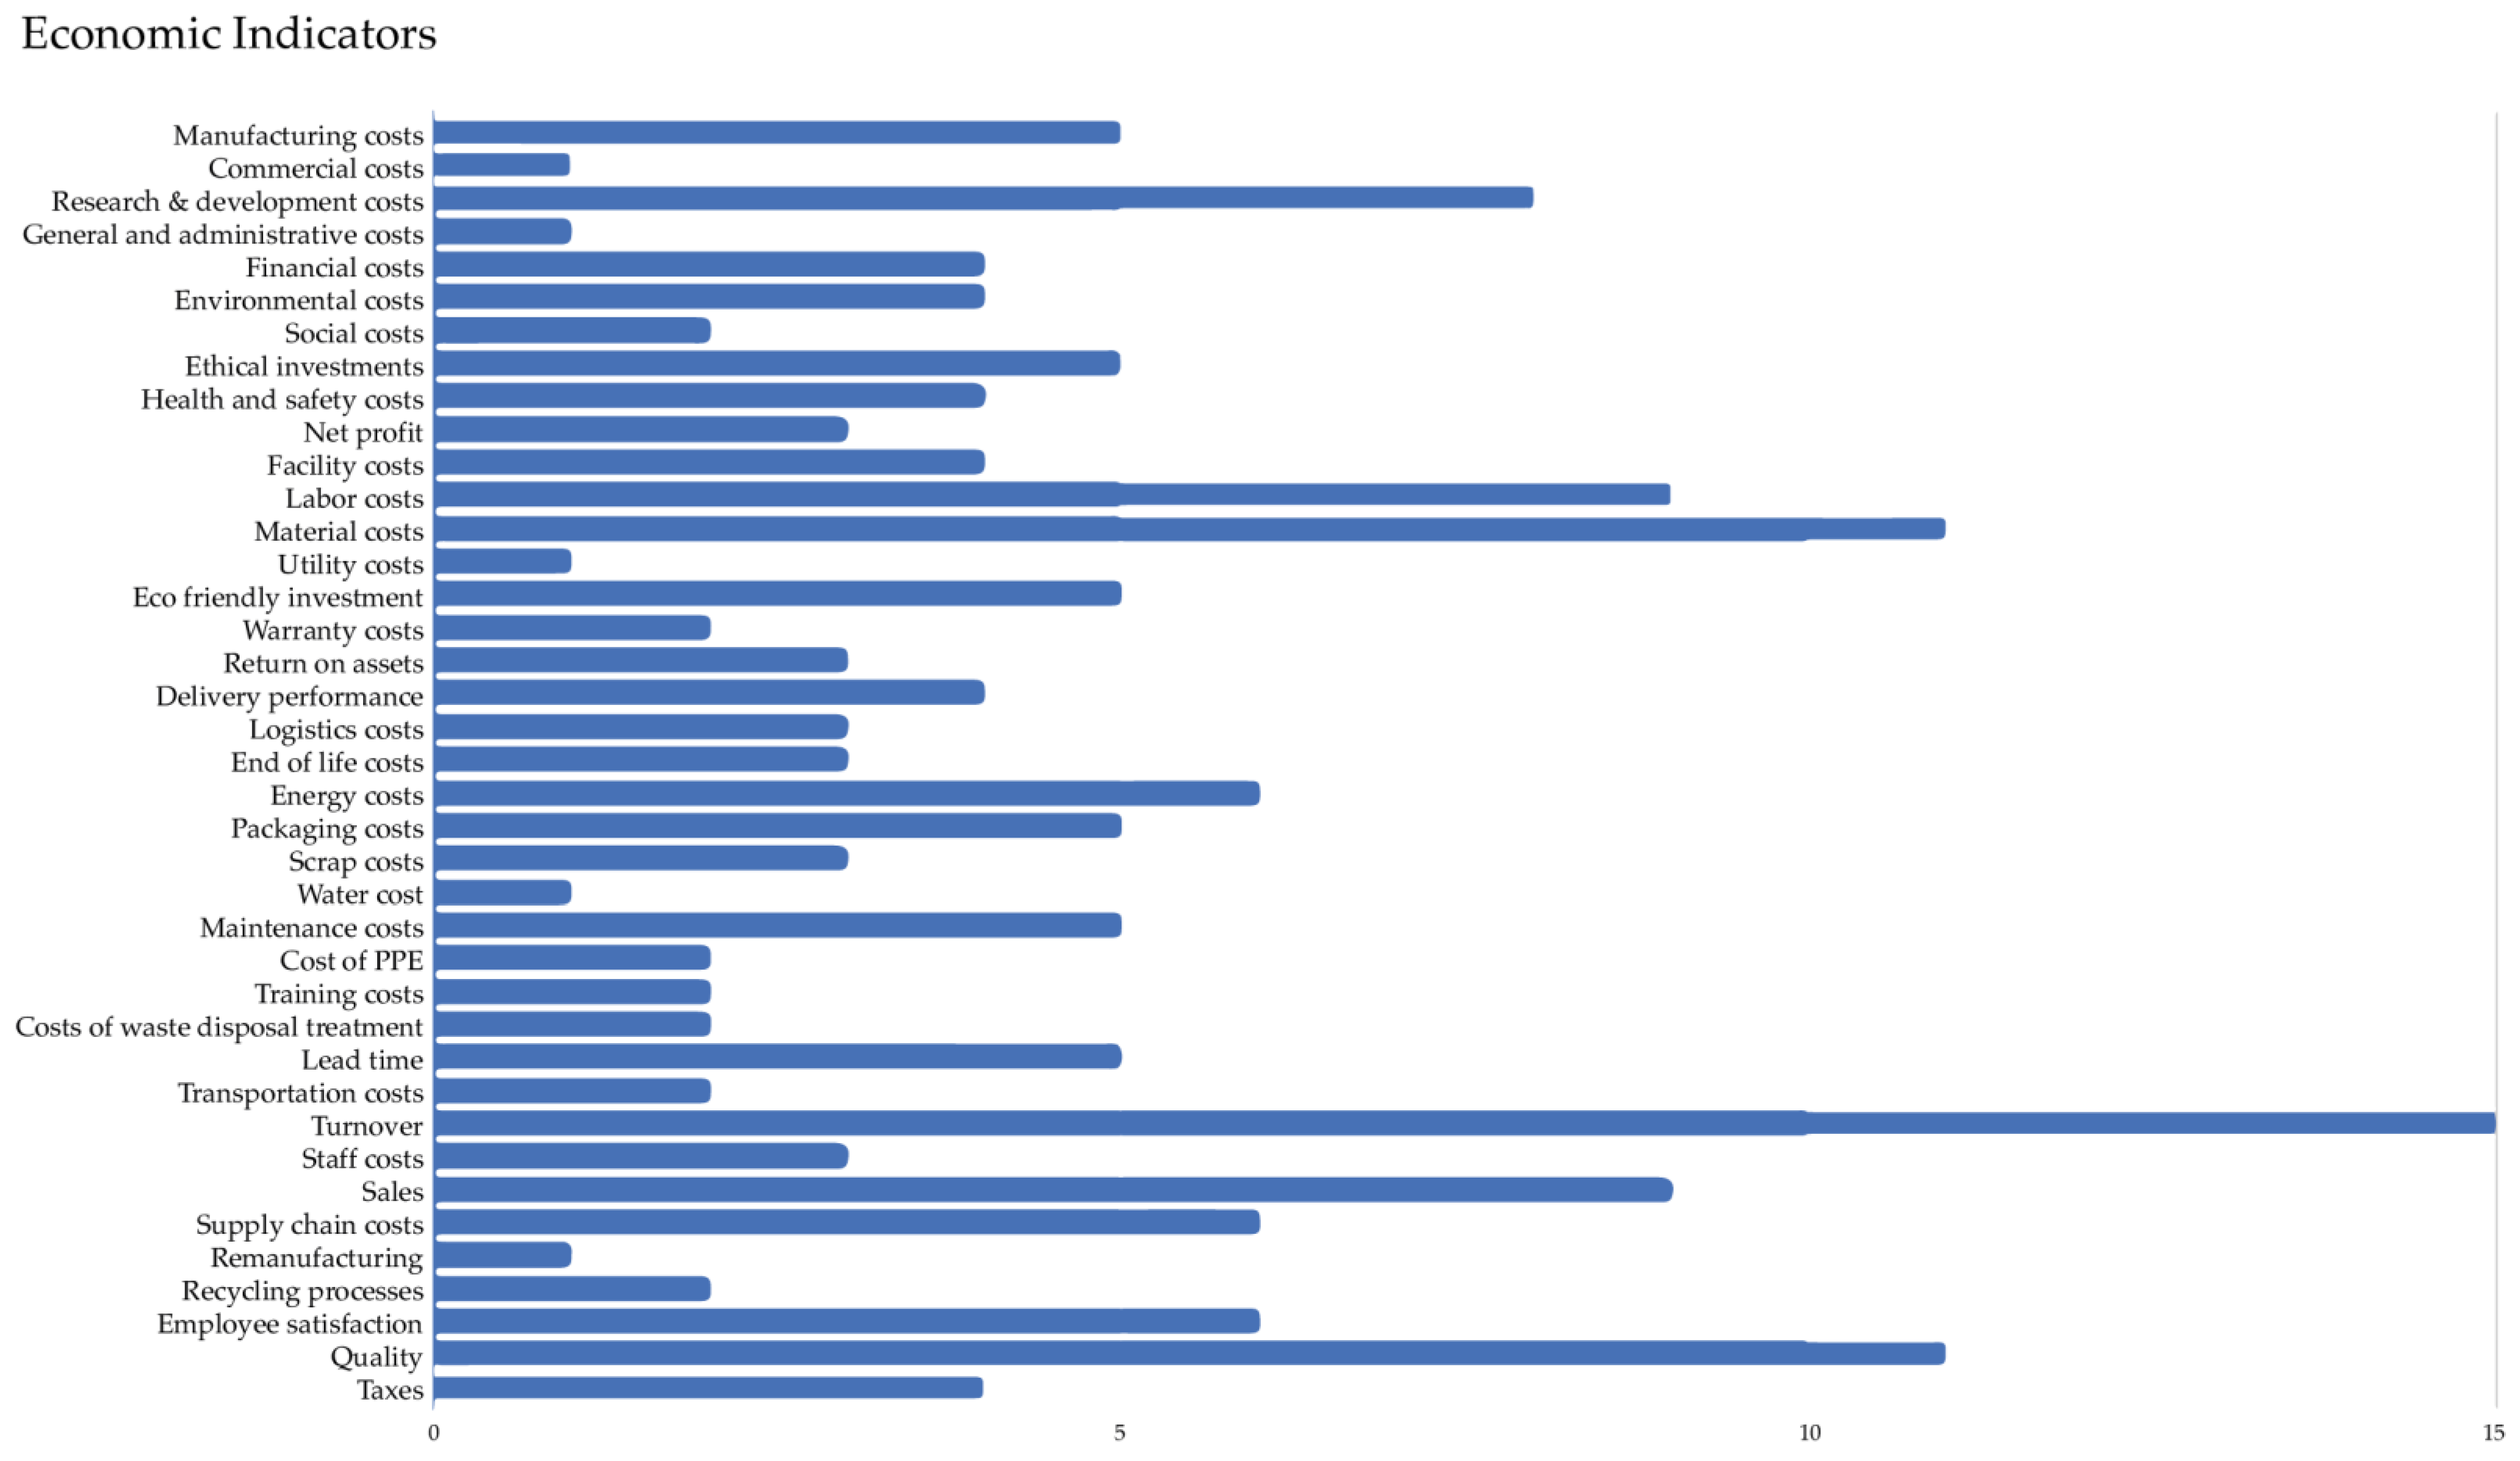
3.1.3. Economic KPIs
3.1.4. Set of KPIs Selected
4. Discussion
- How can digitization help to have data in real time and constantly updated?
- How can one measure a generic set of sustainability KPIs in industrial contexts?
- How can one refer to the different areas of sustainability in the economic, social, and environmental fields?
5. Conclusions
Author Contributions
Funding
Institutional Review Board Statement
Informed Consent Statement
Data Availability Statement
Conflicts of Interest
Appendix A

| Social KPIs | No. Papers | Reference Papers |
|---|---|---|
| Health | 18 | [34] |
| [53] | ||
| [32] | ||
| [66] | ||
| [59] | ||
| [65] | ||
| [5] | ||
| [22] | ||
| [13] | ||
| [62] | ||
| [35] | ||
| [12] | ||
| [2] | ||
| [23] | ||
| [55] | ||
| [14] | ||
| [28] | ||
| [22] | ||
| Human resources | 4 | [34] |
| [48] | ||
| [35] | ||
| [23] | ||
| Human rights | 6 | [53] |
| [32] | ||
| [28] | ||
| [64] | ||
| [62] | ||
| [23] | ||
| Ethics indicators | 2 | [16] |
| [28] | ||
| Physical load index | 1 | [40] |
| Noise | 7 | [40] |
| [59] | ||
| [19] | ||
| [5] | ||
| [13] | ||
| [43] | ||
| [14] | ||
| Risk | 2 | [40] |
| [13] | ||
| Wage | 5 | [40] |
| [32] | ||
| [19] | ||
| [65] | ||
| [28] | ||
| Workload | 2 | [40] |
| [48] | ||
| Injuries | 3 | [40] |
| [32] | ||
| [19] | ||
| Social investment | 1 | [40] |
| Fight against corruption | 4 | [40] |
| [32] | ||
| [62] | ||
| [23] | ||
| Workforce | 1 | [40] |
| Corrosive chemicals | 1 | [40] |
| Toxic chemicals | 1 | [40] |
| OSHA citations | 1 | [40] |
| Employee turnover | 5 | [40] |
| [28] | ||
| [2] | ||
| [43] | ||
| [28] | ||
| Employee satisfaction | 12 | [16] |
| [40] | ||
| [53] | ||
| [48] | ||
| [66] | ||
| [19] | ||
| [28] | ||
| [22] | ||
| [12] | ||
| [55] | ||
| [43] | ||
| [28] | ||
| Community quality of life | 1 | [40] |
| Community outreach activities | 1 | [40] |
| Charitable | 1 | [40] |
| Contributions | ||
| Justice | 4 | [53] |
| [48] | ||
| [32] | ||
| [22] | ||
| Fair trading | 6 | [16] |
| [40] | ||
| [53] | ||
| [32] | ||
| [62] | ||
| [23] | ||
| Public service | 1 | [53] |
| Equal employment opportunities | 1 | [48] |
| [30] | ||
| Equal promotion opportunities | 1 | [48] |
| Payment ratio | 2 | [48] |
| [43] | ||
| Complaints system | 1 | [48] |
| Staff training | 10 | [40] |
| [65] | ||
| [28] | ||
| [18] | ||
| [12] | ||
| [2] | ||
| [30] | ||
| [63] | ||
| [14] | ||
| [28] | ||
| Child labor | 5 | [16] |
| [32] | ||
| [65] | ||
| [62] | ||
| [23] | ||
| Forced labor | 3 | [32] |
| [65] | ||
| [23] | ||
| Gender equity | 4 | [32] |
| [19] | ||
| [30] | ||
| [14] | ||
| Social responsibility | 2 | [32] |
| [23] | ||
| Product responsibility | 4 | [53] |
| [22] | ||
| [64] | ||
| [21] | ||
| Community engagement | 2 | [32] |
| [13] | ||
| Access to resources | 3 | [32] |
| [62] | ||
| [23] | ||
| Work accidents | 9 | [40] |
| [48] | ||
| [19] | ||
| [28] | ||
| [18] | ||
| [30] | ||
| [55] | ||
| [63] | ||
| [14] | ||
| Work illnesses | 4 | [40] |
| [18] | ||
| [12] | ||
| [43] | ||
| Voluntary programs | 1 | [13] |
| Protection of private life | 2 | [62] |
| [23] | ||
| Work conditions | 2 | [62] |
| [55] | ||
| Diversity | 2 | [40] |
| [12] | ||
| Community projects | 6 | [16] |
| [66] | ||
| [19] | ||
| [30] | ||
| [63] | ||
| [43] | ||
| Labor relationship | 3 | [28] |
| [13] | ||
| [12] | ||
| Philanthropy | 3 | [34] |
| [65] | ||
| [28] | ||
| Discrimination | 6 | [48] |
| [19] | ||
| [65] | ||
| [28] | ||
| [62] | ||
| [23] | ||
| Fatalities | 3 | [32] |
| [19] | ||
| [28] |
| Environmental KPIs | No. Paper | Reference Paper |
|---|---|---|
| Global warming | 6 | [34] |
| [16] | ||
| [32] | ||
| [65] | ||
| [13] | ||
| [35] | ||
| Ozone depletion | 3 | [34] |
| [16] | ||
| [22] | ||
| Acidification | 4 | [34] |
| [16] | ||
| [65] | ||
| [43] | ||
| Eutrophication | 4 | [34] |
| [16] | ||
| [65] | ||
| [43] | ||
| Photochemical ozone | 4 | [34] |
| [16] | ||
| [65] | ||
| [43] | ||
| Resource use | 1 | [16] |
| Fuel use | 3 | [28] |
| [61] | ||
| [14] | ||
| Non-fossil resources | 1 | [34] |
| Fossil resources | 1 | [34] |
| Raw materials | 11 | [34] |
| [40] | ||
| [59] | ||
| [19] | ||
| [28] | ||
| [22] | ||
| [35] | ||
| [2] | ||
| [61] | ||
| [43] | ||
| [14] | ||
| Packaging materials | 1 | [59] |
| Consumables | 1 | [34] |
| Energy | 16 | [16] |
| [40] | ||
| [53] | ||
| [32] | ||
| [59] | ||
| [19] | ||
| [22] | ||
| [13] | ||
| [64] | ||
| [18] | ||
| [12] | ||
| [2] | ||
| [61] | ||
| [63] | ||
| [43] | ||
| [14] | ||
| Transportation | 2 | [40] |
| [48] | ||
| Biodiversity | 3 | [34] |
| [62] | ||
| [22] | ||
| Toxicity | 4 | [16] |
| [32] | ||
| [66] | ||
| [65] | ||
| Waste | 13 | [16] |
| [40] | ||
| [53] | ||
| [48] | ||
| [66] | ||
| [59] | ||
| [13] | ||
| [64] | ||
| [30] | ||
| [63] | ||
| [43] | ||
| [28] | ||
| [22] | ||
| Water | 19 | [40] |
| [53] | ||
| [59] | ||
| [19] | ||
| [65] | ||
| [5] | ||
| [28] | ||
| [22] | ||
| [64] | ||
| [62] | ||
| [18] | ||
| [35] | ||
| [12] | ||
| [21] | ||
| [2] | ||
| [23] | ||
| [55] | ||
| [63] | ||
| [43] | ||
| Durability | 2 | [16] |
| [43] | ||
| Greenhouse gas | 8 | [40] |
| [53] | ||
| [59] | ||
| [28] | ||
| [22] | ||
| [64] | ||
| [12] | ||
| [43] | ||
| Renewable energy | 7 | [59] |
| [62] | ||
| [12] | ||
| [21] | ||
| [23] | ||
| [63] | ||
| [43] | ||
| Air emission | 10 | [53] |
| [66] | ||
| [19] | ||
| [65] | ||
| [5] | ||
| [22] | ||
| [13] | ||
| [55] | ||
| [61] | ||
| [14] | ||
| Hazard materials | 6 | [53] |
| [66] | ||
| [59] | ||
| [22] | ||
| [43] | ||
| [28] | ||
| Recycling | 8 | [59] |
| [13] | ||
| [62] | ||
| [12] | ||
| [21] | ||
| [30] | ||
| [23] | ||
| [28] | ||
| Pollution | 6 | [53] |
| [22] | ||
| [62] | ||
| [21] | ||
| [23] | ||
| [43] | ||
| Radioactive emissions | 1 | [59] |
| EOL product | 1 | [59] |
| Climate change | 1 | [65] |
| Land use | [53] | |
| [22] | ||
| [62] | ||
| [35] | ||
| [14] | ||
| [28] | ||
| Noise | 3 | [59] |
| [43] | ||
| [14] |
| Economic KPIs | No. Paper | Reference Paper |
|---|---|---|
| Manufacturing costs | 5 | [34] |
| [40] | ||
| [53] | ||
| [48] | ||
| [62] | ||
| Commercial costs | 1 | [34] |
| Research and development costs | 8 | [34] |
| [59] | ||
| [19] | ||
| [28] | ||
| [62] | ||
| [18] | ||
| [2] | ||
| [28] | ||
| General and administrative costs | 1 | [34] |
| Financial costs | 4 | [34] |
| [16] | ||
| [32] | ||
| [23] | ||
| Environmental costs | 4 | [34] |
| [65] | ||
| [28] | ||
| [13] | ||
| Social costs | 2 | [34] |
| [21] | ||
| Ethical investments | 4 | [16] |
| [21] | ||
| [63] | ||
| [43] | ||
| Health and safety costs | 3 | [19] |
| [21] | ||
| [43] | ||
| Net profit | 3 | [40] |
| [65] | ||
| [18] | ||
| Facility costs | 4 | [40] |
| [32] | ||
| [19] | ||
| [65] | ||
| Labor costs | 7 | [40] |
| [48] | ||
| [59] | ||
| [19] | ||
| [65] | ||
| [61] | ||
| [14] | ||
| Material costs | 8 | [40] |
| [53] | ||
| [32] | ||
| [66] | ||
| [59] | ||
| [65] | ||
| [62] | ||
| [14] | ||
| Utility costs | 1 | [40] |
| Eco friendly investment | 4 | [19] |
| [65] | ||
| [13] | ||
| [2] | ||
| Warranty costs | 1 | [59] |
| Return on assets | 2 | [40] |
| [28] | ||
| Delivery performance | 3 | [40] |
| [48] | ||
| [14] | ||
| Logistics costs | 3 | [53] |
| [59] | ||
| [30] | ||
| End of life costs | 2 | [53] |
| [13] | ||
| Energy costs | 6 | [53] |
| [66] | ||
| [59] | ||
| [65] | ||
| [62] | ||
| [35] | ||
| Packaging costs | 4 | [53] |
| [59] | ||
| [19] | ||
| [43] | ||
| Scrap costs | 3 | [53] |
| [66] | ||
| [19] | ||
| Water costs | 1 | [53] |
| Maintenance costs | 5 | [53] |
| [48] | ||
| [19] | ||
| [65] | ||
| [62] | ||
| Cost of PPE | 2 | [53] |
| [19] | ||
| Training costs | 2 | [53] |
| [59] | ||
| Costs of waste disposal treatment | 2 | [53] |
| [66] | ||
| Lead time | 4 | [53] |
| [48] | ||
| [19] | ||
| [61] | ||
| Transportation costs | 1 | [59] |
| Turnover | 3 | [19] |
| [28] | ||
| [18] | ||
| Staff costs | 1 | [28] |
| Sales | 8 | [32] |
| [66] | ||
| [59] | ||
| [19] | ||
| [28] | ||
| [13] | ||
| [30] | ||
| [63] | ||
| Supply chain costs | 4 | [48] |
| [64] | ||
| [62] | ||
| [63] | ||
| Remanufacturing | 1 | [62] |
| Recycling processes | 2 | [62] |
| [12] | ||
| Employee satisfaction | 3 | [13] |
| [55] | ||
| [43] | ||
| Quality | 4 | [59] |
| [19] | ||
| [5] | ||
| [55] | ||
| Taxes | 4 | [32] |
| [19] | ||
| [30] | ||
| [63] |
References
- UN. Secretary-General; World Commission on Environment and Development. Report of the World Commission on Environment and Development. August 1987. Available online: https://digitallibrary.un.org/record/139811 (accessed on 26 July 2022).
- Wicher, P.; Zapletal, F.; Lenort, R. Sustainability performance assessment of industrial corporation using Fuzzy Analytic Network Process. J. Clean. Prod. 2019, 241, 118132. [Google Scholar] [CrossRef]
- Elkington, J. Partnerships fromcannibals with forks: The triple bottom line of 21st-century business. Environ. Qual. Manag. 1998, 8, 37–51. [Google Scholar] [CrossRef]
- Braccini, A.M.; Margherita, E.G. Exploring Organizational Sustainability of Industry 4.0 under the Triple Bottom Line: The Case of a Manufacturing Company. Sustainability 2019, 11, 36. [Google Scholar] [CrossRef]
- Qorri, A.; Mujkić, Z.; Kraslawski, A. A conceptual framework for measuring sustainability performance of supply chains. J. Clean. Prod. 2018, 189, 570–584. [Google Scholar] [CrossRef]
- Fitz-Gibbon, C.T. Performance Indicators; Multilingual Matters: Clevedon, UK, 1990; Volume 2. [Google Scholar]
- Sundström, A.; Ahmadi, Z.; Mickelsson, K. Implementing Social Sustainability for Innovative Industrial Work Environments. Sustainability 2019, 11, 3402. [Google Scholar] [CrossRef]
- Khaled, R.; Ali, H.; Mohamed, E.K.A. The Sustainable Development Goals and corporate sustainability performance: Mapping, extent and determinants. J. Clean. Prod. 2021, 311, 127599. [Google Scholar] [CrossRef]
- European Commission. 2016. Available online: https://ec.europa.eu/growth/smes_it (accessed on 6 July 2022).
- García-Muiña, F.; Medina-Salgado, M.S.; González-Sánchez, R.; Huertas-Valdivia, I.; Ferrari, A.M.; Settembre-Blundo, D. Industry 4.0-based dynamic Social Organizational Life Cycle Assessment to target the social circular economy in manufacturing. J. Clean. Prod. 2021, 327, 129439. [Google Scholar] [CrossRef]
- García-Granero, E.M.; Piedra-Muñoz, L.; Galdeano-Gómez, E. Eco-innovation measurement: A review of firm performance indicators. J. Clean. Prod. 2018, 191, 304–317. [Google Scholar] [CrossRef]
- Abubakr, M.; Abbas, A.T.; Tomaz, I.; Soliman, M.S.; Luqman, M.; Hegab, H. Sustainable and Smart Manufacturing: An Integrated Approach. Sustainability 2020, 12, 2280. [Google Scholar] [CrossRef]
- Ahi, P.; Searcy, C. An analysis of metrics used to measure performance in green and sustainable supply chains. J. Clean. Prod. 2015, 86, 360–377. [Google Scholar] [CrossRef]
- Amrina, E.; Vilsi, A.L. Interpretive structural model of key performance indicators for sustainable manufacturing evaluation in cement industry. In Proceedings of the 2014 IEEE International Conference on Industrial Engineering and Engineering Management, Selangor, Malaysia, 9–12 December 2014; pp. 1111–1115. [Google Scholar] [CrossRef]
- Appolloni, A.; Jabbour, C.J.C.; D’Adamo, I.; Gastaldi, M.; Settembre-Blundo, D. Green recovery in the mature manufacturing industry: The role of the green-circular premium and sustainability certification in innovative efforts. Ecol. Econ. 2022, 193, 107311. [Google Scholar] [CrossRef]
- Azapagic, A.; Perdan, S. Indicators of Sustainable Development for Industry. Process Saf. Environ. Prot. 2000, 78, 243–261. [Google Scholar] [CrossRef]
- Bai, C.; Sarkis, J. Determining and applying sustainable supplier key performance indicators. Supply Chain Manag. Int. J. 2014, 19, 275–291. [Google Scholar] [CrossRef]
- Butnariu, A.; Avasilcai, S. The Assessment of The Companies’ Sustainable Development Performance. Procedia Econ. Financ. 2015, 23, 1233–1238. [Google Scholar] [CrossRef]
- Cagno, E.; Neri, A.; Howard, M.; Brenna, G.; Trianni, A. Industrial sustainability performance measurement systems: A novel framework. J. Clean. Prod. 2019, 230, 1354–1375. [Google Scholar] [CrossRef]
- Cayzer, S.; Griffiths, P.; Beghetto, V. Design of indicators for measuring product performance in the circular economy. Int. J. Sustain. Eng. 2017, 10, 289–298. [Google Scholar] [CrossRef]
- Cazeri, G.T.; Anholon, R.; Ordoñez, R.E.C.; Novaski, O. Performance Measurement of Green Supply Chain Management: A Literature Review and Gaps for Further Research. Braz. J. Oper. Prod. Manag. 2017, 14, 60–72. [Google Scholar] [CrossRef]
- Chaim, O.; Muschard, B.; Cazarini, E.; Rozenfeld, H. Insertion of sustainability performance indicators in an industry 4.0 virtual learning environment. Procedia Manuf. 2018, 21, 446–453. [Google Scholar] [CrossRef]
- Chardine-Baumann, E.; Botta-Genoulaz, V. A framework for sustainable performance assessment of supply chain management practices. Comput. Ind. Eng. 2014, 76, 138–147. [Google Scholar] [CrossRef]
- Chavan, M.A.S.; Road, P.-S. Prioritization of green supply chain indicators with analytic hierarchy process (AHP) model. Int. J. Mech. Eng. Technol. 2018, 9, 1444–1460. [Google Scholar]
- Ching, N.T.; Ghobakhloo, M.; Iranmanesh, M.; Maroufkhani, P.; Asadi, S. Industry 4.0 applications for sustainable manufacturing: A systematic literature review and a roadmap to sustainable development. J. Clean. Prod. 2022, 334, 130133. [Google Scholar] [CrossRef]
- Cuthbertson, R.; Cetinkaya, B.; Ewer, G.; Klaas-Wissing, T.; Piotrowicz, W.; Tyssen, C. Sustainable Supply Chain Management; Springe: Berlin/Heidelberg, Germany, 2011. [Google Scholar] [CrossRef]
- de Oliveira, A.C.; Sokulski, C.C.; Batista, A.A.d.; de Francisco, A.C. Competencies for sustainability: A proposed method for the analysis of their interrelationships. Sustain. Prod. Consum. 2018, 14, 82–94. [Google Scholar] [CrossRef]
- Dočekalová, M.P.; Kocmanová, A. Composite indicator for measuring corporate sustainability. Ecol. Indic. 2016, 61, 612–623. [Google Scholar] [CrossRef]
- Dorn, C.; Bethrend, R.; Giannopoulos, D.; Napolano, L.; James, V.; Herrmann, A.; Uhlig, V.; Krause, H.; Founti, M.; Trimis, D. A Systematic LCA-enhanced KPI Evaluation towards Sustainable Manufacturing in Industrial Decision-making Processes. A Case Study in Glass and Ceramic Frits Production. Procedia CIRP 2016, 48, 158–163. [Google Scholar] [CrossRef]
- Erol, I.; Sencer, S.; Sari, R. A new fuzzy multi-criteria framework for measuring sustainability performance of a supply chain. Ecol. Econ. 2011, 70, 1088–1100. [Google Scholar] [CrossRef]
- Favara, P.; Raymond, D.; Ambrusch, M.; Libera, A.; Wolf, G.; Simon, J.A.; Maco, B.; Collins, E.R.; Harclerode, M.A.; McNally, A.D.; et al. Ten years later: The progress and future of integrating sustainable principles, practices, and metrics into remediation projects. Remediat. J. 2019, 29, 5–30. [Google Scholar] [CrossRef]
- Ferrari, A.M.; Volpi, L.; Pini, M.; Siligardi, C.; García-Muiña, F.E.; Settembre-Blundo, D. Building a Sustainability Benchmarking Framework of Ceramic Tiles Based on Life Cycle Sustainability Assessment (LCSA). Resources 2019, 8, 11. [Google Scholar] [CrossRef]
- Ferrari, A.M.; Volpi, L.; Settembre-Blundo, D.; García-Muiña, F.E. Dynamic life cycle assessment (LCA) integrating life cycle inventory (LCI) and Enterprise resource planning (ERP) in an industry 4.0 environment. J. Clean. Prod. 2021, 286, 125314. [Google Scholar] [CrossRef]
- Garcia-Muiña, F.; González-Sánchez, R.; Ferrari, A.; Settembre-Blundo, D. The Paradigms of Industry 4.0 and Circular Economy as Enabling Drivers for the Competitiveness of Businesses and Territories: The Case of an Italian Ceramic Tiles Manufacturing Company. Soc. Sci. 2018, 7, 255. [Google Scholar] [CrossRef] [Green Version]
- Garcia-Muiña, E.; González-Sánchez, R.; Ferrari, A.M.; Volpi, L.; Pini, M.; Settembre-Blundo, D. Identifying the Equilibrium Point between Sustainability Goals and Circular Economy Practices in an Industry 4.0 Manufacturing Context Using Eco-Design. Soc. Sci. 2019, 8, 241. [Google Scholar] [CrossRef]
- Govindan, K.; Aditi, J.; Dhingra, D.; Kaul, A.; Jha, P. Structural model for analysis of key performance indicators for sustainable manufacturer–supplier collaboration: A grey-decision-making trial and evaluation laboratory-based approach. Bus. Strategy Environ. 2021, 30, 1702–1722. [Google Scholar] [CrossRef]
- Hagen, J.; Büth, L.; Haupt, J.; Cerdas, F.; Herrmann, C. Live LCA in learning factories: Real time assessment of product life cycles environmental impacts. Procedia Manuf. 2020, 45, 128–133. [Google Scholar] [CrossRef]
- Hervani, A.A.; Helms, M.M.; Sarkis, J. Performance measurement for green supply chain management. Benchmarking Int. J. 2005, 12, 330–353. [Google Scholar] [CrossRef]
- Huang, A. A Framework and Metrics for Sustainable Manufacturing Performance Evaluation at the Production Line, Plant and Enterprise Levels. Ph.D. Thesis, University of Kentucky Libraries, Lexington, KY, USA, 2017. [Google Scholar] [CrossRef]
- Huang, A.; Badurdeen, F. Metrics-based approach to evaluate sustainable manufacturing performance at the production line and plant levels. J. Clean. Prod. 2018, 192, 462–476. [Google Scholar] [CrossRef]
- Hutchins, M.J.; Sutherland, J.W. An exploration of measures of social sustainability and their application to supply chain decisions. J. Clean. Prod. 2008, 16, 1688–1698. [Google Scholar] [CrossRef]
- Khalid, A.M.; Sharma, S.; Dubey, A.K. Developing an indicator set for measuring sustainable development in India: Ahmad Mohd Khalid, Seema Sharma and Amlendu Kumar Dubey/Natural Resources Forum. Nat. Resour. Forum 2018, 42, 185–200. [Google Scholar] [CrossRef]
- Krajnc, D.; Glavic, P. Indicators of sustainable production. Clean Technol. Environ. Policy 2003, 5, 279–288. [Google Scholar] [CrossRef]
- Lenort, R.; Staš, D.; Wicher, P.; Holman, D.; Ignatowicz, K. Comparative Study of Sustainable Key Performance Indicators in Metallurgical Industry. Rocz. Ochr. Śr. 2017, 19, 36–51. [Google Scholar]
- Lopes, F.P.; Santos, A.d.L.; Filho, M.L.S. Indicators to assess social sustainability aspects—Research in industries of the electrical and electronic sector in Brazil. In Proceedings of the 2015 IEEE Conference on Control Applications (CCA), Sydney, Australia, 21–23 September 2015; pp. 583–588. [Google Scholar] [CrossRef]
- Melkonyan, A.; Gottschalk, D.; Vasanth Kamath, V.P. Sustainability assessments and their implementation possibilities within the business models of companies. Sustain. Prod. Consum. 2017, 12, 1–15. [Google Scholar] [CrossRef]
- Nagarajan, H.P.N.; Raman, A.S.; Haapala, K.R. A Sustainability Assessment Framework for Dynamic Cloud-based Distributed Manufacturing. Procedia CIRP 2018, 69, 136–141. [Google Scholar] [CrossRef]
- Narimissa, O.; Kangarani-Farahani, A.; Molla-Alizadeh-Zavardehi, S. Evaluation of sustainable supply chain management performance: Indicators. Sustain. Dev. 2020, 28, 118–131. [Google Scholar] [CrossRef]
- Neri, A.; Cagno, E.; Lepri, M.; Trianni, A. A triple bottom line balanced set of key performance indicators to measure the sustainability performance of industrial supply chains. Sustain. Prod. Consum. 2021, 26, 648–691. [Google Scholar] [CrossRef]
- Papetti, A.; Pandolfi, M.; Peruzzini, M.; Germani, M. A framework to promote social sustainability in industry 4.0. Int. J. Agil. Syst. Manag. 2020, 13, 233–257. [Google Scholar] [CrossRef]
- Dočekalová, M.P.; Kocmanová, A.; Šimberová, I.; Koleňák, J. Modelling of Social Key Performance Indicators of Corporate Sustainability Performance. Acta Univ. Agric. Silvic. Mendel. Brun. 2018, 66, 303–312. [Google Scholar] [CrossRef]
- Peruzzini, M.; Gregori, F.; Luzi, A.; Mengarelli, M.; Germani, M. A social life cycle assessment methodology for smart manufacturing: The case of study of a kitchen sink. J. Ind. Inf. Integr. 2017, 7, 24–32. [Google Scholar] [CrossRef]
- Peruzzini, M.; Pellicciari, M. Application of Early Sustainability Assessment to Support the Design of Industrial Systems. Ind. Eng. Manag. Syst. 2018, 17, 209–225. [Google Scholar] [CrossRef]
- Peruzzini, M.; Pellicciari, M. User experience evaluation model for sustainable manufacturing. Int. J. Comput. Integr. Manuf. 2018, 31, 494–512. [Google Scholar] [CrossRef]
- Piotrowicz, W.; Cuthbertson, R. Performance measurement and metrics in supply chains: An exploratory study. Int. J. Product. Perform. Manag. 2015, 64, 1068–1091. [Google Scholar] [CrossRef]
- Popovic, T.; Barbosa-Póvoa, A.; Kraslawski, A.; Carvalho, A. Quantitative indicators for social sustainability assessment of supply chains. J. Clean. Prod. 2018, 180, 748–768. [Google Scholar] [CrossRef]
- Rahdari, A.H.; Rostamy, A.A.A. Designing a general set of sustainability indicators at the corporate level. J. Clean. Prod. 2015, 108, 757–771. [Google Scholar] [CrossRef]
- Resat, H.G.; Unsal, B. A novel multi-objective optimization approach for sustainable supply chain: A case study in packaging industry. Sustain. Prod. Consum. 2019, 20, 29–39. [Google Scholar] [CrossRef]
- Shuaib, M.; Seevers, D.; Zhang, X.; Badurdeen, F.; Rouch, K.E.; Jawahir, I.S. Product Sustainability Index ( ProdSI ): A Metrics-based Framework to Evaluate the Total Life Cycle Sustainability of Manufactured Products. J. Ind. Ecol. 2014, 18, 491–507. [Google Scholar] [CrossRef]
- Strezov, V.; Evans, A.; Evans, T.J. Assessment of the Economic, Social and Environmental Dimensions of the Indicators for Sustainable Development: Economic, social and environmental dimensions of sustainability. Sustain. Dev. 2017, 25, 242–253. [Google Scholar] [CrossRef]
- Tajbakhsh, A.; Hassini, E. Performance measurement of sustainable supply chains: A review and research questions. Int. J. Product. Perform. Manag. 2015, 64, 744–783. [Google Scholar] [CrossRef]
- Trianni, A.; Cagno, E.; Neri, A.; Howard, M. Measuring industrial sustainability performance: Empirical evidence from Italian and German manufacturing small and medium enterprises. J. Clean. Prod. 2019, 229, 1355–1376. [Google Scholar] [CrossRef]
- Uysal, F. An Integrated Model for Sustainable Performance Measurement in Supply Chain. Procedia Soc. Behav. Sci. 2012, 62, 689–694. [Google Scholar] [CrossRef]
- Varsei, M.; Soosay, C.; Fahimnia, B.; Sarkis, J. Framing sustainability performance of supply chains with multidimensional indicators. Supply Chain Manag. Int. J. 2014, 19, 242–257. [Google Scholar] [CrossRef]
- Visentin, C.; Trentin, A.W.d.; Braun, A.B.; Thomé, A. Life cycle sustainability assessment: A systematic literature review through the application perspective, indicators, and methodologies. J. Clean. Prod. 2020, 270, 122509. [Google Scholar] [CrossRef]
- Çankaya, S.Y.; Sezen, B. Effects of green supply chain management practices on sustainability performance. J. Manuf. Technol. Manag. 2019, 30, 98–121. [Google Scholar] [CrossRef]
- Zhang, W.; Yang, C.; Cheng, Y.; Chen, H.; Wang, W. Research on the Mechanism of the Sustainable Development Model of Enterprises Based on Big Data Analysis Model. Mob. Inf. Syst. 2021, 2021, 4469255. [Google Scholar] [CrossRef]
- Zharfpeykan, R.; Akroyd, C. Factors influencing the integration of sustainability indicators into a company’s performance management system. J. Clean. Prod. 2022, 331, 129988. [Google Scholar] [CrossRef]


| Paper | Year | Eco. | Env. | Soc. | Metrics | Journal |
|---|---|---|---|---|---|---|
| [12] | 2020 | X | X | X | - | Sustainability |
| [13] | 2014 | X | X | X | X | Journal of Cleaner Production |
| [14] | 2014 | X | X | X | - | IEEE International Conference on Industrial Engineering and Engineering Management (IEEM) |
| [15] | 2022 | X | X | X | - | Ecological Economics |
| [16] | 2000 | X | X | X | X | Process Safety and Environmental Protection |
| [17] | 2014 | X | X | X | - | - |
| [18] | 2014 | X | X | X | - | - |
| [19] | 2019 | X | X | X | X | Journal of Cleaner Production |
| [20] | 2017 | X | X | X | - | International Journal of Sustainable Engineering |
| [21] | 2017 | X | X | X | - | Brazilian Journal of Operations & Production Management 14 |
| [22] | 2018 | X | X | X | - | Procedia Manufacturing |
| [23] | 2014 | X | X | X | X | Computers & Industrial Engineering |
| [24] | 2018 | X | X | X | - | - |
| [25] | 2022 | X | X | X | - | Journal of Cleaner Production |
| [26] | 2011 | X | X | X | - | - |
| [27] | 2018 | X | X | X | - | Sustainable Production and Consumption |
| [28] | 2016 | X | X | X | X | Ecological Indicators |
| [29] | 2016 | X | X | X | - | Procedia CIRP |
| [30] | 2011 | X | X | X | X | Ecological Economics |
| [31] | 2019 | - | - | X | - | Remediation Journal |
| [32] | 2019 | X | X | X | - | Resources |
| [33] | 2020 | X | X | X | - | Journal of Cleaner Production |
| [11] | 2018 | X | X | X | - | Journal of Cleaner Production |
| [34] | 2018 | X | X | X | - | Social Sciences |
| [10] | 2021 | - | - | X | - | Journal of Cleaner Production |
| [35] | 2019 | X | X | X | - | Social Sciences |
| [36] | 2020 | X | X | X | - | Bus Strat Env |
| [37] | 2020 | - | X | - | - | Procedia Manufacturing |
| [38] | 2005 | X | X | X | X | - |
| [39] | 2017 | X | X | X | - | - |
| [40] | 2018 | X | X | X | X | Journal of Cleaner Production |
| [41] | 2008 | X | X | X | - | Journal of Cleaner Production |
| [8] | 2021 | X | X | X | - | Journal of Cleaner Production |
| [42] | 2018 | X | X | X | - | Nat Resour Forum |
| [43] | 2003 | X | X | X | X | Clean Technologies and Environmental Policy |
| [44] | 2017 | X | X | X | - | Annual Set The Environment Protection |
| [45] | 2015 | - | - | X | - | IEEE Conference on Control Applications (CCA) |
| [46] | 2017 | X | X | X | - | Sustainable Production and Consumption |
| [47] | 2016 | X | X | - | - | MDPI-Sustainability |
| [48] | 2019 | X | X | X | - | Sustainable Development |
| [49] | 2020 | X | X | X | - | Sustainable Production and Consumption |
| [50] | 2020 | X | X | X | - | J. Agile Systems and Management |
| [51] | 2018 | - | - | X | X | - |
| [52] | 2017 | X | X | X | - | Journal of Industrial Information Integration |
| [53] | 2018 | X | X | X | X | Industrial Engineering & Management Systems |
| [54] | 2018 | X | X | X | - | International Journal of Computer Integrated Manufacturing |
| [55] | 2015 | X | X | X | - | International Journal of Productivity and Performance Management |
| [56] | 2018 | - | - | X | X | Journal of Cleaner Production |
| [5] | 2018 | X | X | X | X | Journal of Cleaner Production |
| [57] | 2015 | X | X | X | - | Journal of Cleaner Production |
| [58] | 2019 | X | X | X | X | Sustainable Production and Consumption |
| [59] | 2014 | X | X | X | X | Journal of Industrial Ecology |
| [60] | 2016 | X | X | X | - | Sustainable Development |
| [7] | 2019 | X | X | X | - | Sustainability |
| [61] | 2015 | X | X | X | - | International Journal of Productivity and Performance Management |
| [62] | 2019 | X | X | X | X | Journal of Cleaner Production |
| [63] | 2012 | X | X | X | - | Procedia-Social and Behavioral Sciences |
| [64] | 2014 | X | X | X | - | - |
| [65] | 2020 | X | X | X | - | Journal of Cleaner Production |
| [2] | 2019 | X | X | X | X | Journal of Cleaner Production |
| [66] | 2019 | X | X | X | - | JMTM |
| [67] | 2021 | X | X | X | X | Mobile Information Systems |
| [68] | 2022 | X | X | X | X | Journal of Cleaner Production |
| Paper | Economic KPIs | Environmental KPIs | Social KPIs |
|---|---|---|---|
| [34] | Manufacturing costs, Commercial costs, Research and development costs, General and administrative costs, Financing costs, Environmental costs, Social costs | Global warming, Ozone depletion, Acidification, Eutrophication, Photochemical ozone, Non-fossil resources, Fossil resources, Raw materials, Consumables, Electrical energy, Thermal energy, Biodiversity, Resource use | Human health, Human resources, Philanthropy |
| [16] | Resource use, Global warming, Ozone depletion, Acidification, Eutrophication, Photochemical ozone, Toxicity, Waste, Material intensity, Energy intensity, Material recyclability, Durability, Service intensity, Voluntary actions, Environmental management systems, Environmental improvements above the compliance levels, Assessment of suppliers | Value added, Contribution to GDP, Expenditure on environmental protection, Environmental liabilities, Ethical investments, Employment contribution, Staff turnover, Expenditure on health and safety, Investment in staff development | Preservation of cultural values, Stakeholder inclusion, Community projects, International standards of conduct, Business dealings, Child labor, Fair trading, Collaboration with corrupt regimes, Intergenerational equity, Income distribution, Employee satisfaction, Satisfaction of social needs, Staff turnover |
| [40] | Cycle time, Changeover time, Uptime, Inventory, Facility costs, Labor costs, Material costs, Utility costs, Net profits, Revenue growth, Return on assets, Profit to revenue ratio, Cost reduction, Adhere to production plan, Improving delivery performance, Energy costs, Direct labor costs, Raw materials costs, Packaging costs, Scrap costs, Consumables costs, Processing tools-related costs, Water costs, Maintenance costs, Cost of PPE, jigs/fixtures, equipment, Other non-operational energy costs, Indirect labor costs, Training costs, Costs of waste disposal treatment, Lead time, Productivity, Utilization of manual labor | Raw materials, Water, Energy, Transportation, Life cycle assessment, Greenhouse gas, Flaring gas, Fresh water used, Oil spills, Waste, Raw materials, Packaging material, Energy, Transportation, Idle energy losses, Renewable energy, Water, Waste, Residue generation intensity, Greenhouse gas, Hazardous gas emission, Material recovered, Consumables recovered, Used packaging material recovered, Used raw material/scrapped parts recovered usage, Hazard materials, Renewable material usage | Physical load index, Noise, Risk, Wage, Workload, Injuries, Injury frequency rate, Social investment, Local procurement and supplier development, Fight against corruption, Workforce diversity and inclusion, Workforce engagement, Workforce training and development, High temperature surfaces, High-speed components and splashes, High-voltage electricity, Physical load index, Work accidents, Work illnesses, Percentage of workers with work-related disease, Noise, Corrosive chemicals, Toxic chemicals, OSHA citations, Employee turnover, Employee satisfaction, Fair trading, Staff training, Diversity, Community quality of life, Community outreach activities, Charitable contributions, Injuries |
| [53] | Manufacturing costs, Commercial costs, Research and development costs, General and administrative costs, Financing costs, Environmental costs, Social costs | Waste, Air emission, Energy, Greenhouse gas, Hazard materials, Ozone, Water, Materials, Energy, Land useBiodiversity, Natural management and conservation | Health and safety, Professional development, Employee satisfaction, Health and safety of the product at use phase, Employee satisfaction, Product responsibility, Fair trading, Equity, Human rights, Public service policy, Justice |
| [32] | Income from sales, Value added, Gross operating profit, Cash flow, Expenses for goods and services, Change in raw mat., consume, goods stock, Use of third parties assets, Cost of human resources, Other operating expenses, Amortization and depreciation, Provisions for risks and others, Financial income and charges, Extraordinary earnings and charges, Taxes, The result of third parties, Total production costs | Energy, Global warming, Toxicity, Air pollution, Ozone, Resources use | Community engagement, Access to resources, Social responsibility, Fair trading, Hours of work, Child labor, Forced labor, Excessive, Working Time, Injuries, Fatalities, Toxics and Hazards, Wage, Justice, Migrant Labor, Collective, Bargaining, etc., Indigenous, Rights, Gender equity, High Conflict, Legal System, Fight against corruption, Drinking Water, Improved Sanitation, Hospital beds, Inadequate social benefits, Labor Rights and Decent Work, Health and Safety, Human rights, Community Infrastructure |
| [66] | Decrease in cost of materials purchased, Decrease in cost of energy consumption, Decrease in fee for waste discharge, Improvement in earnings per share, Improvement in return on investment, Sales growth, Profits growth | Improvement of an enterprise’s environmental situation, Waste, Air emission, Hazard materials, Decrease of frequency of environmental accidents, Toxicity | Employee satisfaction, Improvement in its image in the eyes of its customers, Community projects, Improvement in relations with community stakeholders, Improved awareness and protection of the claims and rights of people in community served, Improvement in employee training and education, Improvement in occupational health and safety of employees, Welfare indicators |
| [59] | Capital cost: Equipment cost, Facility cost, R&D cost, Initial training cost, Labor cost, Material cost, Packaging cost, Energy cost, Transportation cost, Warehouse cost, Recovery cost, Product ownership cost, Average disassembly cost, Environmental regulations violation, Other costs related to legal issues, Sales price, Profit, Defective/ returned products loss, Warranty cost | Raw materials, Recycling, Hazard materials, Packaging materials, Recycled packaging material ratio, Material utilization, Regulations and certification: Regulation compliance, Certification, Renewable energy, Coal, Petroleum, Nuclear, Natural gas, Energy regulation compliance, Energy certification, Energy, WaterRatio of recycled water used, Other natural resources used, Natural resource regulation compliance, Natural resource certification, Greenhouse gases, Hazard gaseous emissions, Mass of solid waste landfilled, Reused/recycled hazardous waste, Disposed hazardous solid waste, To hydrosphere, Reused/recycled liquid waste, Disposed hazardous liquid waste, Heat, Noise, Light, Radioactive emissions, Waste management regulations/certification: Waste management regulation compliance, Waste management certification, EOL product, Ease of product disposability, Product disassemblability, Ratio of EOL product recovered, Product reusability, Ratio of EOL product reused, Product remanufacturability, Product redesign, Ratio of product remanufacturedEOL product recycling: Product recyclability, Ratio of product/material recycled, EOL regulation compliance, EOL certification | Reparability, Maintainability, Failure rate, Lifespan, Return rate for product defects, Product recall rate, Major product specifications, Product customizability, Product functional effectiveness, Ease of operation, Ease of EOL product disposal for the user, Ease of EOL product recovery, Product EOL societal impact, Injury rate, Product safety specifications, Health, Product EOL regulation compliance, Product EOL certification, Noise |
| [19] | Investments: R&D investment, Pollution prevention and control investment, Environment investment, Energy efficiency investment, Safety investment, Community investment, Ethics/philanthropy investment, Operating cost, Overhead cost, Packaging cost, Production cost, Set up cost, Inventory cost, Labor cost, Unit cost, Maintenance cost, Taxes, EHS fines, Sales, Market share, Revenues, Profit, Turnover, Throughput, New products, Lead time, Scrap, Quality, Mix flexibility, Volume, Flexibility, DFx, Green product, IT levelSuppliers: Number of suppliers, Local suppliers, Certified suppliers | Water, Total water use, Fresh water use, Recycled water use, Quality of water, Raw materials, Total material use, Recycled material use, Hazardous material use, Toxic material use, Energy, Total energy use for production, Renewable energy use for production, Fuel use for production, Gas use for production, Coal use for production, Total energy use not for production, Renewable energy use not for production, Fuel use, Gas use not for production, Coal use not for production, Air emissions, CO2, Other GHG, NOx, SO2, OD, S Metal emissions, Other emissions, Toxic emissions, Waste, Hazardous solid waste, Non- hazardous solid waste, Hazardous liquid waste, Non-hazardous liquid waste, COD, BOD, Waste water, Chemical waste, Waste disposed, Waste recycled, Energy recovery, Material recovery, Environmental management, Environmental accidents, Environmental fines, Environmental certification, Cost of compliance | Community complaints, Community projects, Local employment, Involvement of local community, Employee satisfaction, Personalized products, Services offered, Number of employees, Wage, Employee satisfaction, Involvement of employees, Gender equity, Discrimination, Safety training, Environmental training, Staff turnover, Work accidents, Injuries, Fatalities, Near misses, PPE, Absenteeism, Noise, Dust, Toxic substances, OHS Administration Citations, Safety expenditure |
| [65] | Electricity cost, Operating and maintenance costs, Cost of capital, Raw Material Cost, Production Cost, Net present value (NPV), Labor cost, Life cycle Cost (LCC), External environmental cost, Profitability, Gross domestic product (GDP) | Eutrophication, Acidification, Global warming, Photochemical ozone, Ozone, Soil occupation and land use, Air emissions, Water, Toxicity, Climate change, Terrestrial ecotoxicity, Human health, Protection and quality of the ecosystem, Abiotic depletion | Employee, Community Health, Occupational, Health and safety, Contribution to economic and technological, Discrimination, Wage, Child labor, Staff training, Working hours, Forced labor, Supplier relations, Community Involvement, Company commitments to environment, Welfare indicators, Philanthropy |
| [5] | Quality, Efficiency, Cost, Timeliness | Air emissions, Water, Land, Energy | Noise, Health, Empl. Satisfa, Custo. Satisfa |
| [28] | Total costs, Staff costs, Operating expenses, Investments, Return on investment, Profit, Sales, Return on sales, Economic value added, Added value, Turnover, Cash Flow, Market share, Return on equity, Return on assets, Return on invested capital, Liquidity, Turnover of assets, Turnover of inventory, Turnover of receivables, Turnover of liabilities, Debt ratio, Reliability of suppliers, Monetary value of sanctions, Expenditure on research and development | Energy consumption, Consumption of energy from renewable source, Consumption of materials and raw materials, Consumption of recycled materials and raw materials, Fuel use, Water, The amount of occupied land, Waste production, Production of hazardous waste, Amount of recyclable waste, Amount of discharged waste water, Greenhouse gas, Emissions of SO2, NOx and particulate matter (PM), Compliance with legal requirements: Number of violations of statutory rules and regulations relating to the environment, Monetary value of fines for violations of laws related to the environment, Environmental investments, Environmental costs | Number of complaints received from the community, Equal opportunities, Discrimination, Wage, Human rights, Staff turnover, Staff trainingEmployee turnover, Percentage of employees covered by collective agreement, Labor relationshipEthics indicators, The overall accident rate, Accident rate, Fatalities, Occupational diseases, The rate of absence, Work accidents, Health and safety of customers, Percentage of products and services for which the impact on the health and safety of customers is evaluated during their life cycle, Employee satisfaction |
| [22] | Emission, Effluent, Waste, Air emission, Waste Energy Emission, Pollution, Hazard materials, Greenhouse gas, Ozone, Other Pollutants, Water, Raw materials, Energy, Land use, Biodiversity, Habitat Management, Conservation | Health and Safety, Development, Employee satisfaction, Health and Safety, Employee satisfaction, Customer Rights, Product responsibility, Justice, Development | |
| [13] | Environmental costs, Buying environmentally friendly materials, Employee satisfaction, Customer returns, Risks and recoverability, Net life cycle cost, Long-term debt, including current portion, Returning customers ratio, Level of supplier preprocessing of raw materials, Cash flow, Cash flow provided by operating activities, Cooperation degree, Networks, Profit, Market share, Sales, Existing efficiency vs. cost of upgrading, Increased cost efficiency, Cost savings, Operational performance | Environmental social concerns, Cooperation with customers for green packaging, Risk of severe accidents, Environmental risks, Life cycle assessment (LCA), Energy, Environmental partnership with suppliers, Choosing suppliers according to environmental criteria, Annual mass-flow of different materials used, Collaborating with other companies and organizations for environmental initiatives, Improving opportunities for reducing waste through cooperation with other actors, Interaction and harmony co-exist with natural systems on production and consumption systems, Energy requirement per unit of net value added, Global warming, Energy efficiency, Recycling, Waste, Air emission | Voluntary programs, Number of individual volunteering, Risk, Health status and risks, Community engagement, Stakeholder empowerment, Labor relationship, After sales service, Publicly available missions and values statement, Value added and community benefits, Institutional efficiency, Noise, Health and safety performance measurement systems |
| [64] | Supply chain cost, Service level | Greenhouse gas, Water, Energy, Waste, Hazard materials, Toxicity | Labor practices and decent work, Human rights, Society, Product responsibility |
| [62] | Supply chain management, IT, Energy price, Emerging markets, Business models, Process technology, Government regulations, Growth of population, Growth of economics, Consumption of resources, Needs, Market opportunity, Product development cost, Product development time, Development capability, Regionalized products, Personalized products, Enterprise size, Enterprise functionality, Material handling equipment, Material handling storage, Identification system, Plant location, Functional layout, Product layout, Cellular layout, Complexity analysis, Lean production, Agile manufacturing, Remanufacturing, Recycling processes, Product costs, Response, Enterprise productivity, HR appraisal, Resources status, Product quality, Strategic planning, Organizing work, Organization structure, Leadership role, Staffing, Managing culture | Environmental budget, Environmental certification, Environmental concerns and compliance, Workers implications, Use of resources, Renewable energy, Recycling, Recycled water, Recyclable wastes, Pollution, Air pollution, Water pollution, Land pollution, Dangerous inputs, Dangerous outputs, Dangerous wastes, Eco-system services, Biodiversity, Land use, Development of rural areas | Employment, Work conditions, Social dialogue, Society security, HR development, Human rights, Child labor, Freedom of association, Discrimination, Societal commitment, Involvement in local community, Education, Healthcare, Job creation, Societal investment, Culture and technological development, Marketing and information, Protection of private life, Access to resources, Fight against corruption, Fair trading, Understanding foreign culture |
| [18] | Turnover, Operational profit, Investments, Net profit, Research and development expenses | Natural gas consumption, Energy, Water, Carbon dioxide emissions, Nitrogen oxide emissions, Sulphur oxide emissions, Water, Water suspensions, Hydrogen sulfide, Biological oxygen demand, Chemical oxygen demand, Water temperature, Chromium, lead, copper, nickel in water, Phosphorus, Abluents, Salvaged waste, Waste | Work accidents, Work illnesses, Staff training, Non-profit programs, Staff turnover |
| [35] | Environmental LCC, Conventional LCC, Electrical energy, Thermal energy, Consumables | Raw materials, Fired waste milled, Respiratory inorganics, Land use, Aquatic eutrophication, Global warming, Dimensional quality, Water, Ecosystem services, Access to water, Biodiversity | Societal LCC, Human resources, Human health |
| [12] | % of income for recycling programs, Investment in technology rate, % of production sites with an environmental certificate | Greenhouse gas, Carbon footprint rate, % of waste generated per thousand products units, Recycling, Energy, Water, Renewable energy, Sustainable water use rate | Employee satisfaction, Staff training, Health and safety rate, Diversity, Equality rate, Total expenses for social initiatives, Work illnesses, Labor relationship |
| [21] | Employment, Work conditions, Respect of social dialog, Health and security, Development of human resources, Human rights, Child labor, Forced labor, Freedom of association, Discrimination, Involvement in local communities, Education, Culture and technological development, Job creation, Healthcare, Social investment, Customer issues, Marketing and information, Healthcare and security, Protection of private life, Access to essential services, Business practices, Fight against corruption, Fair trading, Promotion of corporate social responsibility in the sphere of influence | Environmental budget, Environmental certification, Environmental compliance, Worker implications, Use of resources, Renewable energy, Recycling, Inputs from recycling, Recyclable outputs, Recyclable wastesPollution: Air pollution, Water pollution, Land pollution, Other pollution, Dangerous inputs, Dangerous outputs, Dangerous wastes, Natural environment, Eco-systemic services, Biodiversity, Land use, Development of urban and rural areas | Customer service, Supplier service, Reliability of stocks, Reliability of estimates, Design responsiveness, Purchase responsiveness, Source responsiveness, Production responsiveness, Delivery responsiveness, Sales responsiveness, Return responsiveness, Supply chain responsiveness, Product responsibility, Flexibility of suppliers, Supply flexibility, Production flexibility, Delivery flexibility, Financial performance, Design cost, Purchase cost, Source cost, Production cost, Delivery cost, Return cost, Supply chain cost, Product/ service quality, Quality performance of suppliers, Production quality |
| [2] | Economic performance, Investments in new processes and R&D, Economic value distributed, Direct economic value generated, Environmental investments | Raw materials, Energy, Water, Greenhouse gas | Employee turnover, Occupational health and safety, Lost time injury frequency rate, Staff training |
| [30] | Innovations created through supplier partnerships, The number of stores, Total space, Total sales/kTRY, The number of people employed, Total tax paid/kTRY, The number of shareholders, Establishing new employment opportunities, Promoting new investments, Competitiveness of reverse and forward logistics system | Annual water consumption, Annual energy consumption, Waste, Fraction of suppliers certified in ISO 14001, Number of ISO standards developed, Fraction of facilities using HFC-powered units, Fraction of facilities using renewable energy, Recycling, Effectiveness of reverse logistics system, Effectiveness of the 3PL company that the company works with, Effectiveness of supplier training in environmental issues, Effectiveness of supplier monitoring | Staff training, Number of applied innovative ideas generated by employees per employee per year, Staff turnover, Annual number of recordable incidents with respect to harassment and violence per employee, Work accidents, Average annual areic number of recordable employee complaints per employee, Average annual areic number of customer complaints, Gender equity, Equal employment opportunities, Community projects, Effectiveness of discipline management, Effectiveness of compensation management, Effectiveness of personnel recruitment and selection, Organization’s openness to stakeholder involvement in decision making, Institutional efficiency, Effectiveness of performance management system |
| [23] | Customer service, suppliers’ service, reliability of stocks, reliability of forecastsResponsiveness: Design responsiveness, purchase responsiveness, source responsiveness, production responsiveness, delivery responsiveness, sell responsiveness, return responsiveness, supply chain responsiveness, Suppliers flexibility, supply flexibility, production flexibility, delivery flexibility, Financial performance, Design cost, purchase cost, source cost, production cost, delivery cost, return cost, supply chain cost, Product/service quality, quality performance of suppliers, production quality | Environmental management, Environmental budget, environmental certification, Environmental compliance, workers implications, Renewable energy, recycled water, Recycling, Inputs stemming from the recycling, Recyclable outputs, Recyclable wastes, Pollution, Air pollution, Water pollution, Land pollution, other pollution, Dangerous inputs, dangerous outputs, dangerous wastes, Eco-systemic services, respect of biodiversity, land use, development of urban and rural areas | Employment, Work conditions, Respect of social dialog, Health, Security, Human resources, Human rights, Child labor, Forced labor, Freedom of association, Discrimination, Involvement in local community, Education, Culture and technological development, Job creation, Societal investment, Marketing and information, Health, Security, Protection of private life, Access to resources, Fight against corruption, Fair trading, Social responsibility |
| [55] | On-time delivery, Employee satisfaction, Order fill rate, Product/service availability, Distribution costs, Total costs, Transport costs, Loading capacity utilization, Stock-outs, Product lateness, Lead time, Forecast accuracy | Air emission, Level of CO2 emission, Level of CO2 emission from transport processes, Level of CO2 emission from infrastructure, Natural resources utilization, Energy, Water, Energy consumption/revenue, Waste, Recycling, Level of waste, Level of products recycled, Level of products reused | Health and safety, Work accidents, Work conditions, Number of accidents, Noise, Noise volume, Time of noise emission, Noise emission in urban areas, Employees skills, Employee satisfaction, Percent of labor cost spent on training |
| [61] | Cost, Capacity utilization, Cost variance from expected costs Inventory levels, Labor efficiency, Supplier cost-saving initiatives, Time, Amount of goods delivered on-time, Efficiency of purchase order cycle time, Efficiency of the production lines Information timeliness, Percentage of late deliveries, Purchase order cycle time, Supplier lead time against industry norm, Supplier’s booking-in procedures, Buyer-supplier partnership level, Delivery reliability, Distribution of decision competences between supplier and customer, Extent of mutual assistance leading in problem-solving efforts, Extent of mutual planning cooperation leading to improved quality, Information accuracy, Information availability, Level of supplier’s defect-free deliveries, Mutual trust, Percentage of wrong supplier delivery, Quality and frequency of exchange of logistics information between, Quality of perspective taking in supply networks, Satisfaction with knowledge transfer, Satisfaction with supplier relationship, Supplier and customer, Supplier assistance in solving technical problems, Supplier rejection rate, Materials variety, Product and service variety, Product development time, Product volume variability capabilities, Response to product changes, Supplier ability to respond to quality problems, Involvement in new product design, Introduction of new processes, Satisfaction with knowledge transfer satisfaction, Technological capability levels | Dependence on imports, Dependence on imports of solid fuel, Dependence on natural gas imports, Dependence on oil imports, Differentiation of energy fuel, Differentiation of fuel of electrical energy production, Energy, Differentiation of primary fuel, Process modifications, Publicly available missions and values statements, Raw materials, Source reduction activities, Strategic oil supplies, Fuel use, Adjustment of energy pricelist, Dividing of public enterprise, Efficiency of electrical energy production, Efficiency of energy conversion, Energy intensity, Energy law for the reforming and privatization of energy enterprises, Habitat improvements and damages due to enterprise operations, Independent energy regulator, Level of competition, Major awards received, Per capita electrical energy consumption, Per capita energy consumption, Per capita fuel consumption, Per capita fuel consumption, Private participation, Quantity of non- product output returned to process or market by recycling or reuse, Total electrical energy consumption, Total energy consumption, Total fuel consumption, Total water consumption, Transformation of energy sector, Application of Kyoto protocol, Emitted CO2 per capita, Emitted CO2 per electricity and steam production, Emitted CO2 per GDP, Emitted CO2 per gross domestic energy consumption, Environmental liabilities under applicable laws and regulations, Formal, written commitments requiring an evaluation of life cycle impacts, Indicators of intensity of emitted CO2, Non-production releases, On-site and off-site energy recovery, On-site and off-site recycling, On-site or off-site treatment, Percentage of renewable energy sources in the electrical energy production, Percentage of renewable energy sources in the primary energy production, Procedures to assist product and service designers to create products or services with reduced adverse life cycle impact, Programs or procedures to prevent or minimize potentially adverse impacts of products and services, Air emission | Existence of equal opportunity policies or programs, Percentage of senior executives who are women, Percentage of staff who are members of visible minorities, Percentage of staff with disabilities, Diversity, Percentage of employees represented by independent trade union organizations or other bona fide employee representatives, Percentage of employees covered by collective bargaining agreements, Number of grievances from unionized employeesHealth and Safety, Evidence of substantial compliance with international labor organization guidelines for occupational health management systems, Number of workplace deaths per year, Existence of well-being programs to encourage employees to adopt healthy lifestyles, Percentage of employees surveyed who agree that their workplace is safe and comfortable, Child labor, Number of children working, Whether contractors are screened for use of child labor, Child labor, Percentage of pre-tax earnings donated to the community, Involvement and/or contributions to projects with value to the greater community, Existence of a policy encouraging use of local contractors and suppliers |
| [63] | Innovations created through supplier partnerships, Total sales, The number of shareholders, Promoting new investmentsCustomer complaints, Equal employment opportunities, Total tax paid, Competitiveness of the forward and reverse supply chain sub- criteria are used to evaluate the sustainable economic performance | Waste, Number of ISO standards developed, Renewable energy, Effectiveness of reverse logistics system, Effectiveness of supplier training in environmental issues, Fraction of suppliers certified in ISO 14001, Fraction of facilities using HFC powered units, Recycled materials, Effectiveness of the 3PL company, The number of stores, Energy, Water, Sub-criteria used to evaluate the sustainable resource performance | Staff training, Applied innovative ideas generated by employees, Staff turnover, Recordable incidents with respect to harassment and violence/employee, Work accidents, Recordable employee, Customer complaints, Community projects, Effectiveness of discipline management, Effectiveness of compensation management, Effectiveness of Personnel, Recruitment and Selection, Organization’s openness to stakeholder involvement in decision-making, Institutional efficiency, Effectiveness of performance management system subcriteria used to evaluate the sustainable social performance |
| [43] | Packaging costs, Investments in sustainable development, Investments in environmental protection, Investments in ethical activity, Complaints of customers, Fraction of suppliers, Cost of employee, Costs of health protection of employee | Energy, Renewable energy, Energy for recycling, Raw materials, Renewable raw materials, Hazard materialsWater, Durability, Waste, Liquid and Solid waste, Pollution, Greenhouse gas, Acidification, Photochemical ozone, Eutrophication, Noise, Air emission | Employee number, Employee turnover, Payment ratio, Employee satisfaction, Work illnesses, Community projects, Community population growth, Noise |
| [14] | Inventory cost, Labor cost, Material cost, Product delivery, Raw material substitution | Air emission, Energy, Fuel use, Land use, Material consumption, Raw materials, Noise, Nonproduct output, Water | Work accidents, Employee involvement, Gender equity, Occupational health and safety, Staff training, Noise |
| [22] | Emission, Solid waste, Waste, Air emission, Waste energy emission, Hazard materials, Greenhouse gas, Ozone depletion, Pollutants, Water, Material, Raw materials, Energy, Land use, Biodiversity, Habitat management, Conservation | Health and safety, Development, Employee satisfaction, Employee satisfaction, Customer rights, Product responsibility, Justice |
| Social KPIs | Environmental KPIs | Economic KPIs |
|---|---|---|
| Health | Global warming | Manufacturing costs |
| Human resources | Ozone depletion | Commercial costs |
| Human rights | Acidification | Research and development costs |
| Ethics indicators | Eutrophication | General and administrative costs |
| Welfare indicators | Photochemical ozone | Financial costs |
| Physical load index | Resource use | Environmental costs |
| Noise | Fuel use | Social costs |
| Risk | Non-fossil resources | Ethical investments |
| Wage | Fossil resources | Health and safety costs |
| Workload | Raw materials | Net profit |
| Injuries | Packaging materials | Facility costs |
| Social investment | Consumables | Labor costs |
| Fight against corruption | Energy | Material costs |
| Workforce | Transportation | Utility costs |
| Corrosive chemicals | Biodiversity | Eco friendly investment |
| Toxic chemicals | Toxicity | Warranty costs |
| OSHA citations | Waste | Return on assets |
| Employee turnover | Water | Delivery performance |
| Employee satisfaction | Durability | Logistics costs |
| Community quality of life | Greenhouse gas | End of life costs |
| Community outreach activities | Renewable energy | Energy costs |
| Charitable contributions | Air emission | Packaging costs |
| Justice | Hazard materials | Scrap costs |
| Fair trading | Recycling | Water cost |
| Public service | Pollution | Maintenance costs |
| Equal employment opportunities | Radioactive emissions | Cost of PPE |
| Equal promotion opportunities | EOL product | Training costs |
| Payment ratio | Climate change | Costs of waste disposal treatment |
| Complaints system | Land use | Lead time |
| Staff training | Noise | Transportation costs |
| Child labor | Turnover | |
| Forced labor | Staff costs | |
| Gender equity | Sales | |
| Social responsibility | Supply chain costs | |
| Product responsibility | Remanufacturing | |
| Community engagement | Recycling processes | |
| Access to resources | Employee satisfaction | |
| Work accidents | Quality | |
| Work illnesses | Taxes | |
| Voluntary programs | ||
| Protection of private life | ||
| Work conditions | ||
| Diversity | ||
| Community projects | ||
| Labor relationship | ||
| Philanthropy | ||
| Discrimination | ||
| Fatalities |
Publisher’s Note: MDPI stays neutral with regard to jurisdictional claims in published maps and institutional affiliations. |
© 2022 by the authors. Licensee MDPI, Basel, Switzerland. This article is an open access article distributed under the terms and conditions of the Creative Commons Attribution (CC BY) license (https://creativecommons.org/licenses/by/4.0/).
Share and Cite
Contini, G.; Peruzzini, M. Sustainability and Industry 4.0: Definition of a Set of Key Performance Indicators for Manufacturing Companies. Sustainability 2022, 14, 11004. https://doi.org/10.3390/su141711004
Contini G, Peruzzini M. Sustainability and Industry 4.0: Definition of a Set of Key Performance Indicators for Manufacturing Companies. Sustainability. 2022; 14(17):11004. https://doi.org/10.3390/su141711004
Chicago/Turabian StyleContini, Giuditta, and Margherita Peruzzini. 2022. "Sustainability and Industry 4.0: Definition of a Set of Key Performance Indicators for Manufacturing Companies" Sustainability 14, no. 17: 11004. https://doi.org/10.3390/su141711004