
Predictors of University Attrition: Looking for an Equitable and Sustainable Higher Education

 , ,
, ,  , and
, and 
Abstract
:1. Introduction
2. Literature Review
2.1. Causes of Dropout
2.2. Key Variables
2.3. Objective and Research Custions
- Students who have a lower previous academic performance have a greater probability of dropping out [112];
3. Materials and Methods
3.1. Participants
3.2. Instruments
3.2.1. Prior Academic Performance
3.2.2. Goal Approach
3.2.3. Motivational and Self-Regulated Socio-Cognitive Skills
3.2.4. Emotional Intelligence
3.2.5. Causal Attributions
3.2.6. Dropout
3.3. Procedure
3.4. Data Analysis
4. Results
4.1. Comparison of the Profile of Students Who Passed the Leveling Course (Mandatory in First Semester to Access University Studies) and Students Who Dropped Out
4.2. Neural Network Analysis
5. Discussion
6. Conclusions
Author Contributions
Funding
Institutional Review Board Statement
Informed Consent Statement
Data Availability Statement
Conflicts of Interest
References
- Aina, C.; Baici, E.; Casalone, G.; Pastore, F. The determinants of university dropout: A review of the socio-economic literature. Socio-Econ. Plan. Sci. 2022, 79, 101102. [Google Scholar] [CrossRef]
- Bird, K.; Chabe-Ferret, B.; Simons, A. Linking human capabilities with livelihood strategies to speed poverty reduction: Evidence from Rwanda. World Dev. 2022, 151, 105728. [Google Scholar] [CrossRef]
- Demeter, E.; Dorodchi, M.; Al-Hossami, E.; Benedict, A.; Walker, L.S.; Smail, J. Predicting first-time-in-college students’ degree completion outcomes. High. Educ. 2022, 84, 589–609. [Google Scholar] [CrossRef]
- Eather, N.; Mavilidi, M.F.; Sharp, H.; Parkes, R. Programmes targeting student retention/success and satisfaction/experience in higher education: A systematic review. J. High. Educ. Policy Manag. 2022, 44, 223–239. [Google Scholar] [CrossRef]
- Maluenda-Albornoz, J.; Infante-Villagran, V.; Galve-Gonzalez, C.; Flores-Oyarzo, G.; Berrios-Riquelme, J. Early and Dynamic Socio-Academic Variables Related to Dropout Intention: A Predictive Model Made during the Pandemic. Sustainability 2022, 14, 831. [Google Scholar] [CrossRef]
- Vooren, M.; Haelermans, C.; Groot, W.; van den Brink, H.M. Comparing success of female students to their male counterparts in the STEM fields: An empirical analysis from enrollment until graduation using longitudinal register data. Int. J. Stem. Educ. 2022, 9, 1. [Google Scholar] [CrossRef]
- Wild, S. Trajectories of subject-interests development and influence factors in higher education. Curr. Psychol. 2022, 1–17. [Google Scholar] [CrossRef]
- Vossensteyn, J.J.; Kottmann, A.; Jongbloed, B.W.; Kaiser, F.; Cremonini, L.; Stensaker, B.; Hovdhaugen, E.; Wollscheid, S. Dropout and Completion in Higher Education in Europe: Main Report; European Union: Brussels, Belgium, 2015. [Google Scholar]
- Quinn, J. Drop-Out and Completion in Higher Education in Europe among Students from Under-Represented Groups; An independent report authored for the European Commission; European Commission: Brussels, Belgium, 2013. [Google Scholar]
- Maass, K.; Sorge, S.; Romero-Ariza, M.; Hesse, A.; Straser, O. Promoting Active Citizenship in Mathematics and Science Teaching. Int. J. Sci. Math. Educ. 2021, 20, 727–746. [Google Scholar] [CrossRef]
- ACT. STEM Education in the US: Where We are and What We Can Do. 2017. Available online: https://www.usinnovation.org/reports/stem-education-us-where-we-are-and-what-we-can-do (accessed on 3 April 2022).
- Pérez, F.; Aldás, J. Indicadores Sintéticos de las Universidades Españolas. Fundacion BBVA E Ivie Tlaxcala Barrio De Tlaxcala Mex. 2020. Available online: https://www.fbbva.es/wp-content/uploads/2020/06/Informe-U-Ranking-FBBVA-Ivie-2020.pdf (accessed on 3 April 2022).
- Corral, C.G.-C. El Programa Europeo de Investigación Horizonte 2020 y el valor añadido de la excelencia. Nueva Rev. De Política Cult. Y Arte 2020, 141, 157–168. [Google Scholar]
- EN. Horizon 2020. Work Programme 2014–2015. 13. Europe in a Changing World-Inclusive, Innovative, and Reflective Societies (Adopted Version); European Commission: Brussels, Belgium, 2014.
- Mundial, B. Momento decisivo: La educación superior en América Latina y el Caribe. Direcciones en Desarrollo, Washington. 2017. Available online: https://vtechworks.lib.vt.edu/handle/10919/83253 (accessed on 3 April 2022).
- Sáez, F.; López, Y.; Cobo, R.; Mella, J. Revisión sistemática sobre intención de abandono en educacion superior. In Proceedings of the Congresos CLABES, Bogotá, Colombia, 13 November 2019. [Google Scholar]
- Bernardo, A.; Esteban, M.; Fernández, E.; Cervero, A.; Tuero, E.; Solano, P. Comparison of personal, social and academic variables related to university drop-out and persistence. Front. Psychol. 2016, 7, 1610. [Google Scholar] [CrossRef]
- Museus, S.D. The culturally engaging campus environments (CECE) model: A new theory of success among racially diverse college student populations. In Higher Education: Handbook of Theory and Research; Springer: Berlin/Heidelberg, Germany, 2014; pp. 189–227. [Google Scholar]
- Tuero Herrero, E.; Cervero Fernández-Castañón, A.; Esteban García, M.; Bernardo Gutiérrez, A.B. ¿ Por qué abandonan los alumnos universitarios? Variables de influencia en el planteamiento y consolidación del abandono. Educacion XXI 2018. Available online: https://revistas.uned.es/index.php/educacionXX1/article/view/20066 (accessed on 3 April 2022).
- Proyecto, A.-G. Estudio Sobre Políticas Nacionales Sobre el Abandono en la Educación Superior en los Países que Participan en el Proyecto ALFA-GUIA. 2014. Available online: https://www.researchgate.net/publication/266475186 (accessed on 3 April 2022).
- Tinto, V.; Cullen, J. Dropout in Higher Education: A Review and Theoretical Syn-thesis of Recent Research; Office of Planning, Budgeting, and Evaluation of the U.S. Office of Education: New York, NY, USA, 1973.
- Tinto, V. Student retention: What next. In Proceedings of the National Conference on Student Recruitment, Marketing, and Retention, Washington, DC, USA, 27–30 July 2005. [Google Scholar]
- Bourdieu, P. Capital Cultural, Escuela Y Espacio Social; Siglo XXI Editores: México City, México, 1997. [Google Scholar]
- Bourdieu, P. Cultural Theory: An Anthology; Szeman, I., Kaposy, T., Eds.; John Wiley & Sons: Hoboken, NJ, USA, 2011. [Google Scholar]
- Shulman, M.; Sassenberg, K.; Nagengast, B.; Trautwein, U. Aidiyet Hissi Ölçeğinin Türkçe Uyarlaması: Geçerlik ve Güvenirlik Çalışmaları. HAYEF J. Educ. 2019, 16, 1–18. [Google Scholar]
- Easterbrook, M.; Vignoles, V.L. What does it mean to belong? Interpersonal bonds and intragroup similarities as predictors of felt belonging in different types of groups. Eur. J. Soc. Psychol. 2013, 43, 455–462. [Google Scholar] [CrossRef]
- Donoso, S.; Donoso, G.; Frites, C. La experiencia chilena de retención de estudiantes en la universidad. Rev. Cienc. Y Cult. 2013, 17, 141–171. [Google Scholar]
- Aina, C. Parental background and college drop-out. Evidence from Italy. In Proceedings of the EPUNet-2005 Conference, Colchester, UK, 30 June–2 July 2005. [Google Scholar]
- Montes, I.; Almonacid, P.M.; Gomez Cardona, S.; Zuluaga, F.; Tamayo, E. Análisis De La Deserción Estudiantil En Los Programa De Pregrado De La Universidad EAFIT (Drop Out Analysis in Undergraduate Students in Universidad EAFIT). Center for Research in Economics and Finance (CIEF), Working Papers. 2010. Available online: https://papers.ssrn.com/sol3/papers.cfm?abstract_id=2427487 (accessed on 3 April 2022).
- Solano, E. Causas E Indicadores De La Deserción En El Programa De Economía: Aplicando Modelos De Duración Y Selección Adversa. Universidad del Atlántico: Santa Marta, Colombia, 2006. [Google Scholar]
- Martín Baró, A. Panorama de la educación 2014: Indicadores de la OCDE. 2014. Available online: https://www.oecd-ilibrary.org/education/panorama-de-la-educacion-2014-indicadores-de-la-ocde_eag-2014-es (accessed on 3 April 2022).
- Mellado, F.R.M.; Orellana, M.B.C.; Gabrie, A.J.B. Retención y Abandono Estudiantil en la Educación Superior Universitaria en América Latina y el Caribe: Una Revisión Sistemática. Educ. Policy Anal. Arch. 2018, 26, 61. [Google Scholar] [CrossRef]
- Alban, M.; Mauricio, D. Neural Networks to Predict Dropout at the Universities. Int. J. Mach. Learn. Comput. 2019, 9, 149–153. [Google Scholar] [CrossRef]
- Bordelois, M.I.; Zevallos, I.V.; Arística, L.L. Repeat and dropout in Medicine students at Manabí Technical University, Ecuador. EduMeCentro 2019, 11, 20–36. [Google Scholar]
- Cuji Chacha, B.R.; Gavilanes López, W.L.; Vicente Guerrero, V.X.; Villacis Villacis, W.G. Student Dropout Model Based on Logistic Regression. In Applied Technologies; Botto-Tobar, M., Vizuete, M.Z., Torres-Carrión, P., León, S.M., Vásquez, G.P., Durakovic, B., Eds.; Springer: Berlin/Heidelberg, Germany, 2020; pp. 321–333. [Google Scholar] [CrossRef]
- Medina, J.; Pinzón, K.; Salazar-Méndez, Y.; Medina, J.; Pinzón, K.; Salazar-Méndez, Y. Determinantes del Rendimiento Académico de los Estudiantes de una Universidad Pública Ecuatoriana. Rev. Politécnica 2021, 47, 53–62. [Google Scholar] [CrossRef]
- Mena, M.; Godoy, W.; Tisalema, S. Analysis of causes of early dropout of students higher education. Minerva 2021, 2, 79–89. [Google Scholar] [CrossRef]
- Núñez-Naranjo, A.F.; Ayala-Chauvin, M.; Riba-Sanmartí, G. Prediction of University Dropout Using Machine Learning. In Information Technology and Systems; Rocha, Á., Ferrás, C., López-López, P.C., Guarda, T., Eds.; Springer International Publishing: Berlin/Heidelberg, Germany, 2021; pp. 396–406. [Google Scholar] [CrossRef]
- Sandoval, I.; Sánchez, T.; Velasteguí, V.; Naranjo, D. Factores Asociados Al Abandono En Estudiantes De Grupos Vulnerables. Caso Escuela Politécnica Nacional. In Proceedings of the Congresos CLABES, Ciudad de Panamá, Panamá, 27 November 2018; Available online: https://revistas.utp.ac.pa/index.php/clabes/article/view/1907 (accessed on 3 April 2022).
- Sandoval-Palis, I.; Naranjo, D.; Gilar-Corbi, R.; Pozo-Rico, T. Neural Network Model for Predicting Student Failure in the Academic Leveling Course of Escuela Politécnica Nacional. Front. Psychol. 2020, 11, 551531. [Google Scholar] [CrossRef]
- Canales, A.; De los Ríos, D. Retención de estudiantes vulnerables en la educación universitaria. Calid. Educ. 2009, 30, 50–83. [Google Scholar] [CrossRef]
- Aina, C.; Mussida, C.; Lombardi, G. Are Business and Economics Alike? Ital. Econ. J. 2022, 1–29. [Google Scholar] [CrossRef]
- Sorina, D.; Roman, I.; Vac, C. Emotional intelligence of students-Instrument of adaptation and control of the university dropout. J. Educ. Sci. Psychol. 2019, 9, 43–50. [Google Scholar]
- Parker, J.D.A.; Taylor, R.N.; Keefer, K.V.; Summerfeldt, L.J. Emotional Intelligence and Post-Secondary Education: What Have We Learned and What Have We Missed? In Emotional Intelligence in Education; Springer: Berlin/Heidelberg, Germany, 2018; pp. 427–452. [Google Scholar] [CrossRef]
- Kurilovas, E. Application of Artificial Neural Networks to Support Personalised Learning. In Proceedings of the 9th International Conference on Education and New Learning Technologies, Barcelona, Spain, 3–5 July 2017; pp. 141–148. [Google Scholar]
- Mega, C.; Ronconi, L.; De Beni, R. What Makes a Good Student? How Emotions, Self-Regulated Learning, and Motivation Contribute to Academic Achievement. J. Educ. Psychol. 2014, 106, 121–131. [Google Scholar] [CrossRef]
- Oriol, X.; Amutio, A.; Mendoza, M.; Da Costa, S.; Miranda, R. Emotional Creativity as Predictor of Intrinsic Motivation and Academic Engagement in University Students: The Mediating Role of Positive Emotions. Front. Psychol. 2016, 7, 1243. [Google Scholar] [CrossRef]
- Boekaerts, M.; Pekrun, R. Emotions and Emotion Regulation in Academic Settings. In Handbook of Educational Psychology; Routledge: London, UK, 2016; pp. 76–90. [Google Scholar]
- Webster, E.A.; Hadwin, A.F. Emotions and emotion regulation in undergraduate studying: Examining students’ reports from a self-regulated learning perspective. Educ. Psychol. 2015, 35, 794–818. [Google Scholar] [CrossRef]
- Vogl, E.; Pekrun, R. Emotions that matter to achievement Student Feelings about Assessment. In Handbook of Human and Social Conditions in Assessment; Routledge: London, UK, 2016; pp. 111–128. [Google Scholar]
- Ramirez-Arellano, A.; Bory-Reyes, J.; Manuel Hernandez-Simon, L. Emotions, Motivation, Cognitive-Metacognitive Strategies, and Behavior as Predictors of Learning Performance in Blended Learning. J. Educ. Comput. Res. 2019, 57, 491–512. [Google Scholar] [CrossRef]
- Ahmed, W.; van der Werf, G.; Kuyper, H.; Minnaert, A. Emotions, Self-Regulated Learning, and Achievement in Mathematics: A Growth Curve Analysis. J. Educ. Psychol. 2013, 105, 150–161. [Google Scholar] [CrossRef]
- Jacob, B.; Hofmann, F.; Stephan, M.; Fuchs, K.; Markus, S.; Glaeser-Zikuda, M. Students’ achievement emotions in university courses-does the teaching approach matter? Stud. High. Educ. 2019, 44, 1768–1780. [Google Scholar] [CrossRef]
- Lueftenegger, M.; Kiug, J.; Harrer, K.; Langer, M.; Spiel, C.; Schober, B. Students’ Achievement Goals, Learning-Related Emotions and Academic Achievement. Front. Psychol. 2016, 7, 603. [Google Scholar] [CrossRef]
- Tulis, M.; Fulmer, S.M. Students’ motivational and emotional experiences and their relationship to persistence during academic challenge in mathematics and reading. Learn. Individ. Differ. 2013, 27, 35–46. [Google Scholar] [CrossRef]
- Ciolacu, M.I.; Svasta, P. Education 4.0: AI Empowers Smart Blended Learning Process with Biofeedback. In Proceedings of the 2021 IEEE Global Engineering Education Conference (EDUCON), Vienna, Austria, 21–23 April 2021. [Google Scholar] [CrossRef]
- Niessen, D.; Danner, D.; Spengler, M.; Lechner, C.M. Big Five Personality Traits Predict Successful Transitions from School to Vocational Education and Training: A Large-Scale Study. Front. Psychol 2020, 11, 1827. [Google Scholar] [CrossRef]
- Zapata-Lamana, R.; Sanhueza-Campos, C.; Stuardo-Alvarez, M.; Ibarra-Mora, J.; Mardones-Contreras, M.; Reyes-Molina, D.; Vasquez-Gomez, J.; Lasserre-Laso, N.; Poblete-Valderrama, F.; Petermann-Rocha, F.; et al. Anxiety, Low Self-Esteem and a Low Happiness Index Are Associated with Poor School Performance in Chilean Adolescents: A Cross-Sectional Analysis. Int. J. Environ. Res. Public Health 2021, 18, 11685. [Google Scholar] [CrossRef]
- Gilar-Corbi, R.; Pozo-Rico, T.; Luis Castejon-Costa, J. Improving emotional intelligence in higher education students: Testing program effectiveness in tree countries. Educ. XX1 2019, 22, 161–187. [Google Scholar]
- Gilar-Corbi, R.; Pozo-Rico, T.; Pertegal-Felices, M.L.; Sanchez, B. Emotional intelligence training intervention among trainee teachers: A quasi-experimental study. Psicol. Reflexão E Crítica 2019, 31, 1–13. [Google Scholar] [CrossRef]
- Gilar-Corbi, R.; Pozo-Rico, T.; Sánchez, B.; Castejón, J.L. Can emotional competence be taught in higher education? A randomized experimental study of an emotional intelligence training program using a multimethodological approach. Front. Psychol. 2018, 9, 1039. [Google Scholar] [CrossRef]
- Pozo Rico, T.; Sánchez Sánchez, B.; Castejón Costa, J.L.; Gilar Corbi, R. Training Course on Emotional Intelligence: The Experience of Emotional Intelligence in a Secondary Education Project. 2018. Available online: https://digibug.ugr.es/handle/10481/60788 (accessed on 3 April 2022).
- Cabello, R.; Navarro, B.; Latorre, J.M.; Fernández-Berrocal, P. Ability of university-level education to prevent age-related decline in emotional intelligence. Front. Aging Neurosci. 2014, 6, 37. [Google Scholar] [CrossRef]
- Palomera, R.; Fernández-Berrocal, P.; Brackett, M.A. Emotional intelligence as a basic competency in pre-service teacher training: Some evidence. Electron. J. Res. Educ. Psychol. 2008, 6, 437–454. [Google Scholar]
- Kanetaki, Z.; Stergiou, C.; Bekas, G.; Troussas, C.; Sgouropoulou, C. Analysis of Engineering Student Data in Online Higher Education During the COVID-19 Pandemic. Int. J. Eng. Pedagog. 2021, 11, 27–49. [Google Scholar] [CrossRef]
- Tayebi, A.; Gomez, J.; Delgado, C. Analysis on the Lack of Motivation and Dropout in Engineering Students in Spain. IEEE Access 2021, 9, 66253–66265. [Google Scholar] [CrossRef]
- Figueroa-Canas, J.; Sancho-Vinuesa, T. Changing the recent past to reduce ongoing dropout: An early learning analytics intervention for an online statistics course. Open Learn. 2021, 1–18. [Google Scholar] [CrossRef]
- Cocorada, E.; Curtu, A.L.; Nastasa, L.E.; Vorovencii, I. Dropout Intention, Motivation, and Socio-Demographics of Forestry Students in Romania. Forests 2021, 12, 618. [Google Scholar] [CrossRef]
- Bargmann, C.; Thiele, L.; Kauffeld, S. Motivation matters: Predicting students’ career decidedness and intention to drop out after the first year in higher education. High. Educ. 2021, 83, 845–861. [Google Scholar] [CrossRef]
- Jeno, L.M.; Nylehn, J.; Hole, T.N.; Raaheim, A.; Velle, G.; Vandvik, V. Motivational Determinants of Students’ Academic Functioning: The Role of Autonomy-support, Autonomous Motivation, and Perceived Competence. Scand. J. Educ. Res. 2021, 1–18. [Google Scholar] [CrossRef]
- Machado, L.; Steren, B. Motivational processes of Pedagogy course students and their relationships for the stay at the university. Intercambios 2021, 8, 85–92. [Google Scholar] [CrossRef]
- Gatson, D.; Enslin, C. Resiliency and Goals: A Phenomenological Exploration of African American Male Attrition in High School. Qual. Rep. 2021, 26, 3067–3090. [Google Scholar] [CrossRef]
- Pavelea, A.M.; Moldovan, O. Why some Fail and others Succeed: Explaining the Academic Performance of PA Undergraduate Students. NISPAcee J. Public Adm. Policy 2020, 13, 109–132. [Google Scholar] [CrossRef]
- Jiang, Y.; Song, J.; Lee, M.; Bong, M. Self-efficacy and achievement goals as motivational links between perceived contexts and achievement. Educ. Psychol. 2014, 34, 92–117. [Google Scholar] [CrossRef]
- Yan, V.X.; Wang, L. What Predicts Quality of Learners’ Study Efforts? Implicit Beliefs and Interest Are Related to Mastery Goals but Not to Use of Effective Study Strategies. Front. Educ. 2021, 6, 104. [Google Scholar] [CrossRef]
- Romero Ariza, M.; Perez Ferra, M. Motivating to learn in the University: A fundamental strategy against the academic failure. Contributions of the research and the specialized literature. Rev. Iberoam. Educ. 2009, 50, 1–13. [Google Scholar] [CrossRef]
- Linnenbrink-Garcia, L.; Patall, E.A. Motivation; Routledge: London, UK, 2016; pp. 91–103. [Google Scholar]
- Ainley, M.; Ainley, J. Motivation and Learning: Measures and Methods; Cambridge University Press: Cambridge, UK, 2019; pp. 665–688. [Google Scholar]
- Sins, P.H.M.; van Joolingen, W.R.; Savelsbergh, E.R.; van Hout-Wolters, B. Motivation and performance within a collaborative computer-based modeling task: Relations between students’ achievement goal orientation, self-efficacy, cognitive processing, and achievement. Contemp. Educ. Psychol. 2008, 33, 58–77. [Google Scholar] [CrossRef]
- Bae, C.L.; DeBusk-Lane, M. Motivation belief profiles in science: Links to classroom goal structures and achievement. Learn. Individ. Differ. 2018, 67, 91–104. [Google Scholar] [CrossRef]
- Daumiller, M.; Stupnisky, R.; Janke, S. Motivation of higher education faculty: Theoretical approaches, empirical evidence, and future directions. Int. J. Educ. Res. 2020, 99, 101502. [Google Scholar] [CrossRef]
- Foong, C.C.; Ghouse, N.L.B.; Lye, A.J.; Pallath, V.; Hong, W.H.; Vadivelu, J. Differences between high- and low-achieving pre-clinical medical students: A qualitative instrumental case study from a theory of action perspective. Ann. Med. 2022, 54, 195–210. [Google Scholar] [CrossRef] [PubMed]
- Singh, H.P.; Alhulail, H.N. Predicting Student-Teachers Dropout Risk and Early Identification: A Four-Step Logistic Regression Approach. IEEE Access 2022, 10, 6470–6482. [Google Scholar] [CrossRef]
- Lim, H.S.; Shin, S.Y. Effect of Learning Goal Orientation on Performance: Role of Task Variety as a Moderator. J. Bus. Psychol. 2021, 36, 871–881. [Google Scholar] [CrossRef]
- Bernacki, M.L.; Byrnes, J.P.; Cromley, J.G. The effects of achievement goals and self-regulated learning behaviors on reading comprehension in technology-enhanced learning environments. Contemp. Educ. Psychol. 2012, 37, 148–161. [Google Scholar] [CrossRef]
- Kamarova, S.; Chatzisarantis, N.L.D.; Hagger, M.S.; Lintunen, T.; Hassandra, M.; Papaioannou, A. Effects of achievement goals on perceptions of competence in conditions of unfavourable social comparisons: The mastery goal advantage effect. Br. J. Educ. Psychol. 2017, 87, 630–646. [Google Scholar] [CrossRef]
- Lee, M.; Bong, M.; Kim, S.-I. Effects of achievement goals on self-control. Contemp. Educ. Psychol. 2021, 67, 102000. [Google Scholar] [CrossRef]
- Kahraman, N. Effects of Achievement Goals on Students’ Motivational beliefs and Coping Strategies: A Multiple Goals Perspective. Electron. J. Res. Educ. Psychol. 2018, 16, 35–57. [Google Scholar] [CrossRef]
- Wolters, C.A.; Fan, W.; Daugherty, S.G. Examining Achievement Goals and Causal Attributions Together as Predictors of Academic Functioning. J. Exp. Educ. 2013, 81, 295–321. [Google Scholar] [CrossRef]
- Katz-Navon, T.; Unger-Aviram, E.; Block, C. Examining the Cross-Level Influence of Dispositional and Team Goal Orientations on Employee Self-Regulation and Performance in a Complex Task Environment. J. Appl. Behav. Sci. 2016, 52, 396–421. [Google Scholar] [CrossRef]
- Chonsalasin, D.; Khampirat, B. The Impact of Achievement Goal Orientation, Learning Strategies, and Digital Skill on Engineering Skill Self-Efficacy in Thailand. IEEE Access 2022, 10, 11858–11870. [Google Scholar] [CrossRef]
- King, R.B.; McInerney, D.M.; Nasser, R. Different goals for different folks: A cross-cultural study of achievement goals across nine cultures. Soc. Psychol. Educ. 2017, 20, 619–642. [Google Scholar] [CrossRef]
- Mouratidis, A.; Michou, A.; Demircioglu, A.N.; Sayil, M. Different goals, different pathways to success: Performance-approach goals as direct and mastery-approach goals as indirect predictors of grades in mathematics. Learn. Individ. Differ. 2018, 61, 127–135. [Google Scholar] [CrossRef]
- King, R.B.; McInerney, D.M. Do goals lead to outcomes or can it be the other way around?: Causal ordering of mastery goals, metacognitive strategies, and achievement. Br. J. Educ. Psychol. 2016, 86, 296–312. [Google Scholar] [CrossRef]
- Barros, A.; Simão, A.M.V. Attributions to academic achievements in the transition to higher education. Curr. Psychol. 2018, 37, 216–224. [Google Scholar] [CrossRef]
- Heikkilä, A.; Lonka, K. Studying in higher education: Students’ approaches to learning, self-regulation, and cognitive strategies. Stud. High. Educ. 2006, 31, 99–117. [Google Scholar] [CrossRef]
- McMillan, W. Identity and attribution as lenses to understand the relationship between transition to university and initial academic performance. Afr. J. Health Prof. Educ. 2015, 7, 32–38. [Google Scholar] [CrossRef]
- McClure, J.; Meyer, L.H.; Garisch, J.; Fischer, R.; Weir, K.F.; Walkey, F.H. Students’ attributions for their best and worst marks: Do they relate to achievement? Contemp. Educ. Psychol. 2011, 36, 71–81. [Google Scholar] [CrossRef]
- Schunk, D. Social Cognitive Theory; Harris, K.R., Graham, S.E., Urdan, T.E., McCormick, C.B., Sinatra, G.M., Sweller, J.E., Eds.; American Psychological Association: Washington, DC, USA, 2012. [Google Scholar]
- Zimmerman, B.J. From Cognitive Modeling to Self-Regulation: A Social Cognitive Career Path. Educ. Psychol. 2013, 48, 135–147. [Google Scholar] [CrossRef]
- Nelson, K.G.; Shell, D.F.; Husman, J.; Fishman, E.J.; Soh, L.-K. Motivational and Self-Regulated Learning Profiles of Students Taking a Foundational Engineering Course. J. Eng. Educ. 2015, 104, 74–100. [Google Scholar] [CrossRef]
- Hudig, J.; Scheepers, A.W.A.; Schippers, M.C.; Smeets, G. Motivational Mindsets and Reasons for Studying: Development and Validation of a Classification Tool. Front. Psychol. 2020, 11, 535801. [Google Scholar] [CrossRef]
- Pintrich, P.R. A motivational science perspective on the role of student motivation in learning and teaching contexts. J. Educ. Psychol. 2003, 95, 667–686. [Google Scholar] [CrossRef] [Green Version]
- Respondek, L.; Seufert, T.; Stupnisky, R.; Nett, U.E. Perceived Academic Control and Academic Emotions Predict Undergraduate University Student Success: Examining Effects on Dropout Intention and Achievement. Front. Psychol. 2017, 8, 243. [Google Scholar] [CrossRef]
- Cho, Y.; Weinstein, C.E.; Wicker, F. Perceived competence and autonomy as moderators of the effects of achievement goal orientations. Educ. Psychol. 2011, 31, 393–411. [Google Scholar] [CrossRef]
- Law, W.; Elliot, A.J.; Murayama, K. Perceived Competence Moderates the Relation Between Performance-Approach and Performance-Avoidance Goals. J. Educ. Psychol. 2012, 104, 806–819. [Google Scholar] [CrossRef]
- Senko, C.; Dawson, B. Performance-Approach Goal Effects Depend on How They Are Defined: Meta-Analytic Evidence from Multiple Educational Outcomes. J. Educ. Psychol. 2017, 109, 574–598. [Google Scholar] [CrossRef]
- Wang, L.; Yan, F. Emotion regulation strategy mediates the relationship between goal orientation and job search behavior among university seniors. J. Vocat. Behav. 2018, 108, 1–12. [Google Scholar] [CrossRef]
- Steinmayr, R.; Bipp, T.; Spinath, B. Goal orientations predict academic performance beyond intelligence and personality. Learn. Individ. Differ. 2011, 21, 196–200. [Google Scholar] [CrossRef]
- Moumne, S.; Hall, N.; Boke, B.N.; Bastien, L.; Heath, N.L. Implicit Theories of Emotion, Goals for Emotion Regulation, and Cognitive Responses to Negative Life Events. Psychol. Rep. 2021, 124, 1588–1620. [Google Scholar] [CrossRef]
- Liu, W.C. Implicit Theories of Intelligence and Achievement Goals: A Look at Students’ Intrinsic Motivation and Achievement in Mathematics. Front. Psychol. 2021, 12, 593715. [Google Scholar] [CrossRef] [PubMed]
- Montmarquette, C.; Mahseredjian, S.; Houle, R. The determinants of university dropouts: A bivariate probability model with sample selection. Econ. Educ. Rev. 2001, 20, 475–484. [Google Scholar] [CrossRef]
- Kotsou, I.; Mikolajczak, M.; Heeren, A.; Grégoire, J.; Leys, C. Improving emotional intelligence: A systematic review of existing work and future challenges. Emot. Rev. 2019, 11, 151–165. [Google Scholar] [CrossRef]
- Kastberg, E.; Buchko, A.; Buchko, K. Developing Emotional Intelligence: The Role of Higher Education. J. Organ. Psychol. 2020, 20, 64–72. [Google Scholar]
- Nelis, D.; Kotsou, I.; Quoidbach, J.; Hansenne, M.; Weytens, F.; Dupuis, P.; Mikolajczak, M. Increasing emotional competence improves psychological and physical well-being, social relationships, and employability. Emotion 2011, 11, 354. [Google Scholar] [CrossRef]
- Harackiewicz, J.M.; Barron, K.E.; Tauer, J.M.; Elliot, A.J. Predicting success in college: A longitudinal study of achievement goals and ability measures as predictors of interest and performance from freshman year through graduation. J. Educ. Psychol. 2002, 94, 562. [Google Scholar] [CrossRef]
- Harackiewicz, J.M.; Barron, K.E.; Tauer, J.M.; Carter, S.M.; Elliot, A.J. Short-term and long-term consequences of achievement goals: Predicting interest and performance over time. J. Educ. Psychol. 2000, 92, 316. [Google Scholar] [CrossRef]
- Gangolu, K.R. Academic Motivation and Adjustment as Predictors of Academic Achievement among Adolescents. J. Psychosoc. Res. 2019, 14, 393–402. [Google Scholar] [CrossRef]
- González, A.; Donolo, D.; Rinaudo, C.; Paoloni, V. Relaciones entre motivación, emoción y rendimiento académico en universitarios. Estud. Psicol. 2011, 32, 257–270. [Google Scholar]
- Sandoval, I.; Gilar-Corbi, R.; Veas, A.; Castejón, J.L. Promoting Equality in Higher Education: Development and Internal Validity of a Selection Test for Science University Degrees in Ecuador. Psychol. Test. Assess. Modeling 2021, 63, 191–204. [Google Scholar]
- Skaalvik, E.M. Self-enhancing and self-defeating ego orientation: Relations with task and avoidance orientation, achievement, self-perceptions, and anxiety. J. Educ. Psychol. 1997, 89, 71. [Google Scholar] [CrossRef]
- Valle, A.; Regueiro, B.; Rodríguez, S.; Piñeiro, I.; Freire, C.; Ferradás, M.; Suárez, N. Perfiles motivacionales como combinación de expectativas de autoeficacia y metas académicas en estudiantes universitarios. Eur. J. Educ. Psychol. 2015, 8, 1–8. [Google Scholar] [CrossRef]
- Pintrich, P.R.; De Groot, E.V. Motivational and self-regulated learning components of classroom academic performance. J. Educ. Psychol. 1990, 82, 33. [Google Scholar] [CrossRef]
- Salovey, P.; Mayer, J.D.; Goldman, S.L.; Turvey, C.; Palfai, T.P. Emotional Attention, Clarity, and Repair: Exploring Emotional Intelligence Using the Trait Meta-Mood Scale; American Psychological Association: Washington, DC, USA, 1995. [Google Scholar]
- Fernández-Berrocal, P.; Extremera, N.; Ramos, N. Validity and reliability of the Spanish modified version of the Trait Meta-Mood Scale. Psychol. Rep. 2004, 94, 751–755. [Google Scholar] [CrossRef]
- Barca Lozano, A.; Peralbo Uzquiano, M.; Brenlla Blanco, J.C. Atribuciones causales y enfoques de aprendizaje: La escala SIACEPA. Psicothema 2004, 16, 94–103. [Google Scholar]
- Himmel, E. Modelo de análisis de la deserción estudiantil en la educación superior. Calid. Educ. 2002, 17, 91–108. [Google Scholar] [CrossRef]
- Bouwmans, T.; Javed, S.; Sultana, M.; Jung, S.K. Deep neural network concepts for background subtraction: A systematic review and comparative evaluation. Neural Netw. 2019, 117, 8–66. [Google Scholar] [CrossRef] [Green Version]
- Baars, G.J.; Stijnen, T.; Splinter, T.A. A model to predict student failure in the first year of the undergraduate medical curriculum. Health Prof. Educ. 2017, 3, 5–14. [Google Scholar] [CrossRef]
- Marbouti, F.; Diefes-Dux, H.A.; Madhavan, K. Models for early prediction of at-risk students in a course using standards-based grading. Comput. Educ. 2016, 103, 1–15. [Google Scholar] [CrossRef]
- Mason, C.; Twomey, J.; Wright, D.; Whitman, L. Predicting engineering student attrition risk using a probabilistic neural network and comparing results with a backpropagation neural network and logistic regression. Res. High. Educ. 2018, 59, 382–400. [Google Scholar] [CrossRef]
- De Andrés, J. Comparativa de métodos de predicción de la quiebraredes neuronales artificiales vs. métodos estadísticos multivariantes. Partida Doble 2005, 168, 105–113. [Google Scholar]
- Sandoval-Palis, I.; Naranjo, D.; Vidal, J.; Gilar-Corbi, R. Early Dropout Prediction Model: A Case Study of University Leveling Course Students. Sustainability 2020, 12, 9314. [Google Scholar] [CrossRef]
- Pitarque, A.; Roy, J.F.; Ruíz, J.C. Redes neurales vs. modelos estadísticos: Simulaciones sobre tareas de predicción y clasificación. Psicológica 1998, 19, 387–400. [Google Scholar]
- Hair, J.F.; Anderson, R.E.; Tatham, R.L.; Black, W.C. Análisis Multivariante; Prentice Hall Madrid: Hoboken, NJ, USA, 1999; Volume 491. [Google Scholar]
- Helal, S.; Li, J.; Liu, L.; Ebrahimie, E.; Dawson, S.; Murray, D.J.; Long, Q. Predicting academic performance by considering student heterogeneity. Knowl. Based Syst. 2018, 161, 134–146. [Google Scholar] [CrossRef]
- Teoh, E.J.; Tan, K.C.; Xiang, C. Estimating the number of hidden neurons in a feedforward network using the singular value decomposition. IEEE Trans. Neural Netw. 2006, 17, 1623–1629. [Google Scholar] [CrossRef]
- Vandamme, J.-P.; Meskens, N.; Superby, J.-F. Predicting academic performance by data mining methods. Educ. Econ. 2007, 15, 405. [Google Scholar] [CrossRef]
- Juba, B.; Le, H.S. Precision-recall versus accuracy and the role of large data sets. In Proceedings of the AAAI Conference on Artificial Intelligence, Honolulu, HI, USA, 27 January–1 February 2019; AAAI Press: Palo Alto, CA, USA, 2019; Volume 33, pp. 4039–4048. [Google Scholar]
- Vergara Morales, J.R.; Boj del Val, E.; Barriga, O.A.; Díaz Larenas, C. Factores explicativos de la deserción de estudiantes de pedagogía. Rev. Complut. Educ. 2017, 28, 609–630. [Google Scholar] [CrossRef]
- Jover, J.N.; Pérez, H.R.O.; Díaz, T.P.; Diéguez, A.R. Educación Superior, Ciencia, Tecnología, Innovación y Saberes Ancestrales en Cifras. Políticas de educación superior, ciencia, tecnología e innovación y desarrollo territorial: Nuevas experiencias, nuevos enfoques. Rev. Iberoam. Cienc. Tecnol. Soc. 2020, 15, 187–208. [Google Scholar]
- Tamayo, T.M. El sistema educativo de Ecuador: Un sistema, dos mundos. Rev. Andin. Educ. 2019, 2, 8–17. [Google Scholar]
- Govender, C.M. Hopes, Challenges and Goals-Voices of First-Year At-Risk Higher Education Students in South Africa. S. Afr. Rev. Sociol. 2020, 51, 55–69. [Google Scholar] [CrossRef]
- Barreno, S.N.; Veas, A.; Navas, L.; Castejón, J.L. Psychometric properties of the spanish version of the goal orientation scales in ecuadorian undergraduate students. Front. Psychol. 2020, 11, 3346. [Google Scholar] [CrossRef]
- Rodarte-Luna, B.; Sherry, A. Sex differences in the relation between statistics anxiety and cognitive/learning strategies. Contemp. Educ. Psychol. 2008, 33, 327–344. [Google Scholar] [CrossRef]
- Niessen, A.S.M.; Neumann, M. Using personal statements in college admissions: An investigation of gender bias and the effects of increased structure. Int. J. Test. 2022, 22, 5–20. [Google Scholar] [CrossRef]
- Reibnegger, G.; Caluba, H.-C.; Ithaler, D.; Manhal, S.; Neges, H.M.; Smolle, J. Dropout rates in medical students at one school before and after the installation of admission tests in Austria. Acad. Med. 2011, 86, 1040–1048. [Google Scholar] [CrossRef] [PubMed]
- Poropat, A.E. A meta-analysis of the five-factor model of personality and academic performance. Psychol. Bull. 2009, 135, 322. [Google Scholar] [CrossRef] [PubMed]
- Gray, J.; Goldstein, H.; Thomas, S. Predicting the future: The role of past performance in determining trends in institutional effectiveness at A level. Br. Educ. Res. J. 2001, 27, 391–405. [Google Scholar] [CrossRef]
- Mitchell, T.R.; Hopper, H.; Daniels, D.; George-Falvy, J.; James, L.R. Predicting self-efficacy and performance during skill acquisition. J. Appl. Psychol. 1994, 79, 506. [Google Scholar] [CrossRef]
- Touron, J. La predicción del rendimiento académico: Procedimientos, resultados e implicaciones. Rev. Española Pedagog. 1985, 43, 473–495. [Google Scholar]
- De Oliveira, C.F.; Sobral, S.R.; Ferreira, M.J.; Moreira, F. How Does Learning Analytics Contribute to Prevent Students’ Dropout in Higher Education: A Systematic Literature Review. Big Data Cogn. Comput. 2021, 5, 64. [Google Scholar] [CrossRef]
- Mtshweni, B.V. Adjustment and socioeconomic status: How do these factors influence the intention to dropout of university? S. Afr. J. Psychol. 2021, 52, 262–274. [Google Scholar] [CrossRef]
- Pennington, C.R.; Bates, E.A.; Kaye, L.K.; Bolam, L.T. Transitioning in higher education: An exploration of psychological and contextual factors affecting student satisfaction. J. Furth. High. Educ. 2018, 42, 596–607. [Google Scholar] [CrossRef]
- Topham, P.; Moller, N. New students’ psychological well-being and its relation to first year academic performance in a UK university. Couns. Psychother. Res. 2011, 11, 196–203. [Google Scholar] [CrossRef] [Green Version]
- Turner, R.; Morrison, D.; Cotton, D.; Child, S.; Stevens, S.; Nash, P.; Kneale, P. Easing the transition of first year undergraduates through an immersive induction module. Teach. High. Educ. 2017, 22, 805–821. [Google Scholar] [CrossRef]
- Van Rooij, E.C.M.; Jansen, E.P.W.A.; van de Grift, W.J.C.M. Factors that contribute to secondary school students’ self-efficacy in being a successful university student. Res. Post-Compuls. Educ. 2017, 22, 535–555. [Google Scholar] [CrossRef]
- Van Rooij, E.C.M.; Jansen, E.P.W.A.; van de Grift, W.J.C.M. First-year university students’ academic success: The importance of academic adjustment. Eur. J. Psychol. Educ. 2018, 33, 749–767. [Google Scholar] [CrossRef]
- Fernández, A.; Arnaiz, P.; Mejía, R.; Barca, A. Atribuciones causales del alumnado universitario de República Dominicana con alto y bajo rendimiento academico||Causal attributions in low and high academic achievement university students in the Dominican Republic. Rev. Estud. Investig. Psicol. Educ. 2015, 2, 19–29. [Google Scholar] [CrossRef]
- Yu, R.; Lee, H.; Kizilcec, R.F. Should College Dropout Prediction Models Include Protected Attributes? In Proceedings of the Eighth ACM Conference on Learning@ Scale, Virtual Event, Germany, 22–25 June 2021; Association for Computing Machinery: New York, NY, USA, 2021; pp. 91–100. [Google Scholar]
- Del Bonifro, F.; Gabbrielli, M.; Lisanti, G.; Zingaro, S.P. Student Dropout Prediction. In Proceedings of the International Conference on Artificial Intelligence in Education, Chicago, IL, USA, 25–29 June 2020; Springer: Berlin/Heidelberg, Germany, 2020; pp. 129–140. [Google Scholar]
- Jang, L.Y.; Liu, W.C. 2 × 2 Achievement goals and achievement emotions: A cluster analysis of students’ motivation. Eur. J. Psychol. Educ. 2012, 27, 59–76. [Google Scholar] [CrossRef]
- Pekrun, R.; Linnenbrink-Garcia, L. Academic Emotions and Student Engagement. In Handbook of Research on Student Engagement; Springer: Boston, MA, USA, 2012; pp. 259–282. [Google Scholar]
- Putwain, D.; Sander, P.; Larkin, D. Academic self-efficacy in study-related skills and behaviours: Relations with learning-related emotions and academic success. Br. J. Educ. Psychol. 2013, 83, 633–650. [Google Scholar] [CrossRef]
- Diseth, A.; Samdal, O. Autonomy support and achievement goals as predictors of perceived school performance and life satisfaction in the transition between lower and upper secondary school. Soc. Psychol. Educ. 2014, 17, 269–291. [Google Scholar] [CrossRef]
- Hsieh, P.; Sullivan, J.R.; Guerra, N.S. A closer look at college students: Self-efficacy and goal orientation. J. Adv. Acad. 2007, 18, 454–476. [Google Scholar] [CrossRef]
- Salmela-Aro, K.; Tolvanen, A.; Nurmi, J.-E. Achievement strategies during university studies predict early career burnout and engagement. J. Vocat. Behav. 2009, 75, 162–172. [Google Scholar] [CrossRef]
- Granados López, H.; Gallego López, F.A. Motivación, aprendizaje autorregulado y estrategias de aprendizaje en estudiantes de tres universidades de Caldas y Risaralda. Latinoam. Estud. Educ. 2016, 12, 71–90. [Google Scholar]
- Schickel, M.; Ringeisen, T. What predicts students’ presentation performance? Self-efficacy, boredom and competence changes during presentation training. Curr. Psychol. 2020, 41, 5803–5816. [Google Scholar] [CrossRef]
- Senko, C. When do mastery and performance goals facilitate academic achievement? Contemp. Educ. Psychol. 2019, 59, 101795. [Google Scholar] [CrossRef]
- Kim, J.-B.; Moon, K.-S.; Park, S. When is a performance-approach goal unhelpful? Performance goal structure, task difficulty as moderators. Asia Pac. Educ. Rev. 2021, 22, 261–272. [Google Scholar] [CrossRef]
- Dompnier, B.; Darnon, C.; Butera, F. When performance-approach goals predict academic achievement and when they do not: A social value approach. Br. J. Soc. Psychol. 2013, 52, 587–596. [Google Scholar] [CrossRef]
- Ariani, D.W.; Susilo, Y.S. Why Do It Later? Goal Orientation, Self-efficacy, Test Anxiety, on Procrastination. J. Educ. Cult. Psychol. Stud. 2018, 17, 45–73. [Google Scholar] [CrossRef]
- Hernandez, P.R.; Schultz, P.W.; Estrada, M.; Woodcock, A.; Chance, R.C. Sustaining Optimal Motivation: A Longitudinal Analysis of Interventions to Broaden Participation of Underrepresented Students in STEM. J. Educ. Psychol. 2013, 105, 89–107. [Google Scholar] [CrossRef]
- Yu, J.; McLellan, R. Same mindset, different goals and motivational frameworks: Profiles of mindset-based meaning systems. Contemp. Educ. Psychol. 2020, 62, 101901. [Google Scholar] [CrossRef]
- Roos, A.-L.; Goetz, T.; Krannich, M.; Jarrell, A.; Donker, M.; Mainhard, T. Test anxiety components: An intra-individual approach testing their control antecedents and effects on performance. Anxiety Stress Coping 2021, 34, 279–298. [Google Scholar] [CrossRef]
- Scrimin, S.; Mason, L.; Moscardino, U. School-related stress and cognitive performance: A mood-induction study. Contemp. Educ. Psychol. 2014, 39, 359–368. [Google Scholar] [CrossRef]
- Crouzevialle, M.; Butera, F. The Role of Test Anticipation in the Link between Performance-Approach Goals and Academic Achievement A Field Experiment with Science, Technology, Engineering, and Mathematics (STEM) Classes. Swiss J. Psychol. 2016, 75, 123–132. [Google Scholar] [CrossRef]
- Sini, B.; Muzzulini, B.; Schmidt, S.; Tinti, C. School motivation: A comparison between Kenya and Italy. J. Educ. Res. 2018, 111, 746–755. [Google Scholar] [CrossRef]
- Berger, N.; Archer, J. School socio-economic status and student socio-academic achievement goals in upper secondary contexts. Soc. Psychol. Educ. 2016, 19, 175–194. [Google Scholar] [CrossRef]
- Phan, H.P.; Ngu, B.H. Schooling experience and academic performance of Taiwanese students: The importance of psychosocial effects, positive emotions, levels of best practice, and personal well-being. Soc. Psychol. Educ. 2020, 23, 1073–1101. [Google Scholar] [CrossRef]
- Micin, S.; Farías, N.; Carreño, B.; Urzúa, S. Beca nivelación académica: La experiencia de una política pública aplicada en una universidad chilena. Calid. En La Educ. 2015, 42, 189–208. [Google Scholar] [CrossRef]
- Andrews, J.; Clark, R.; Thomas, L. Compendium of Effective Practice in Higher Education Retention and Success; Aston University: Birmingham, UK, 2012. [Google Scholar]
- Radloff, A. Student Engagement at New Zealand Institutes of Technology and Polytechnics. Australasian Survey of Student Engagement. Ako Aotearoa. 2010. Available online: https://www.acer.org/files/AUSSE_ITP_Report_2010.pdf (accessed on 3 April 2022).
- Moncada Mora, L.F. La integración académica de los estudiantes universitarios como factor determinante del abandono de corto plazo. Un análisis en el Sistema de Educación Superior a Distancia del Ecuador. RIED. Rev. Iberoam. Educ. A Distancia 2014, 17, 173–196. [Google Scholar] [CrossRef]
- Kulik, C.-L.C.; Kulik, J.A.; Shwalb, B.J. College programs for high-risk and disadvantaged students: A meta-analysis of findings. Rev. Educ. Res. 1983, 53, 397–414. [Google Scholar] [CrossRef]
- Chaney, B.; Lewis, L.; Farris, E. Programs at Higher Education Institutions for Disadvantaged Precollege Students Statistical Analysis Report. December 1995. Postsecondary Education Quick Information System (PEQUIS). Statistical Analysis Report; US Government Printing Office, Superintendent of Documents, Mail Stop: Washington, DC, USA, 1995.
- Chaney, B.; Muraskin, L.D.; Cahalan, M.W.; Goodwin, D. Helping the progress of disadvantaged students in higher education: The federal student support services program. Educ. Eval. Policy Anal. 1998, 20, 197–215. [Google Scholar] [CrossRef]
- Haskins, R.; Rouse, C.E. Time for change: A new federal strategy to prepare disadvantaged students for college. Future Child. 2013, 2, 1–5. [Google Scholar]
- Robbins, S.B.; Oh, I.-S.; Le, H.; Button, C. Intervention effects on college performance and retention as mediated by motivational, emotional, and social control factors: Integrated meta-analytic path analyses. J. Appl. Psychol. 2009, 94, 1163. [Google Scholar] [CrossRef]
- Thomas, L. Building Student Engagement and Belonging in Higher Education at a Time of Change; Paul Hamlyn Foundation: London, UK, 2012; Volume 100. [Google Scholar]
- Stephens, N.M.; Hamedani, M.G.; Destin, M. Closing the social-class achievement gap: A difference-education intervention improves first-generation students’ academic performance and all students’ college transition. Psychol. Sci. 2014, 25, 943–953. [Google Scholar] [CrossRef]
- Walton, G.M.; Cohen, G.L. A brief social-belonging intervention improves academic and health outcomes of minority students. Science 2011, 331, 1447–1451. [Google Scholar] [CrossRef]
- Yeager, D.S.; Walton, G.M.; Brady, S.T.; Akcinar, E.N.; Paunesku, D.; Keane, L.; Kamentz, D.; Ritter, G.; Duckworth, A.L.; Urstein, R. Teaching a lay theory before college narrows achievement gaps at scale. Proc. Natl. Acad. Sci. USA 2016, 113, E3341–E3348. [Google Scholar] [CrossRef] [PubMed] [Green Version]
- Richardson, M.; Abraham, C.; Bond, R. Psychological correlates of university students’ academic performance: A systematic review and meta-analysis. Psychol. Bull. 2012, 138, 353. [Google Scholar] [CrossRef] [PubMed]
- Schneider, M.; Preckel, F. Variables associated with achievement in higher education: A systematic review of meta-analyses. Psychol. Bull. 2017, 143, 565. [Google Scholar] [CrossRef] [PubMed]
- Cabrera Pérez, L.; Bethencourt Benítez, J.T.; González Afonso, M.C.; Álvarez Pérez, P.R. Un Estudio Transversal Retrospectivo Sobre Prolongación y Abandono de Estudios Universitarios. Revista Electrónica de Investigación y Evaluación Educativa 2006. Available online: https://ojs.uv.es/index.php/RELIEVE/article/view/4241/3858 (accessed on 3 April 2022).


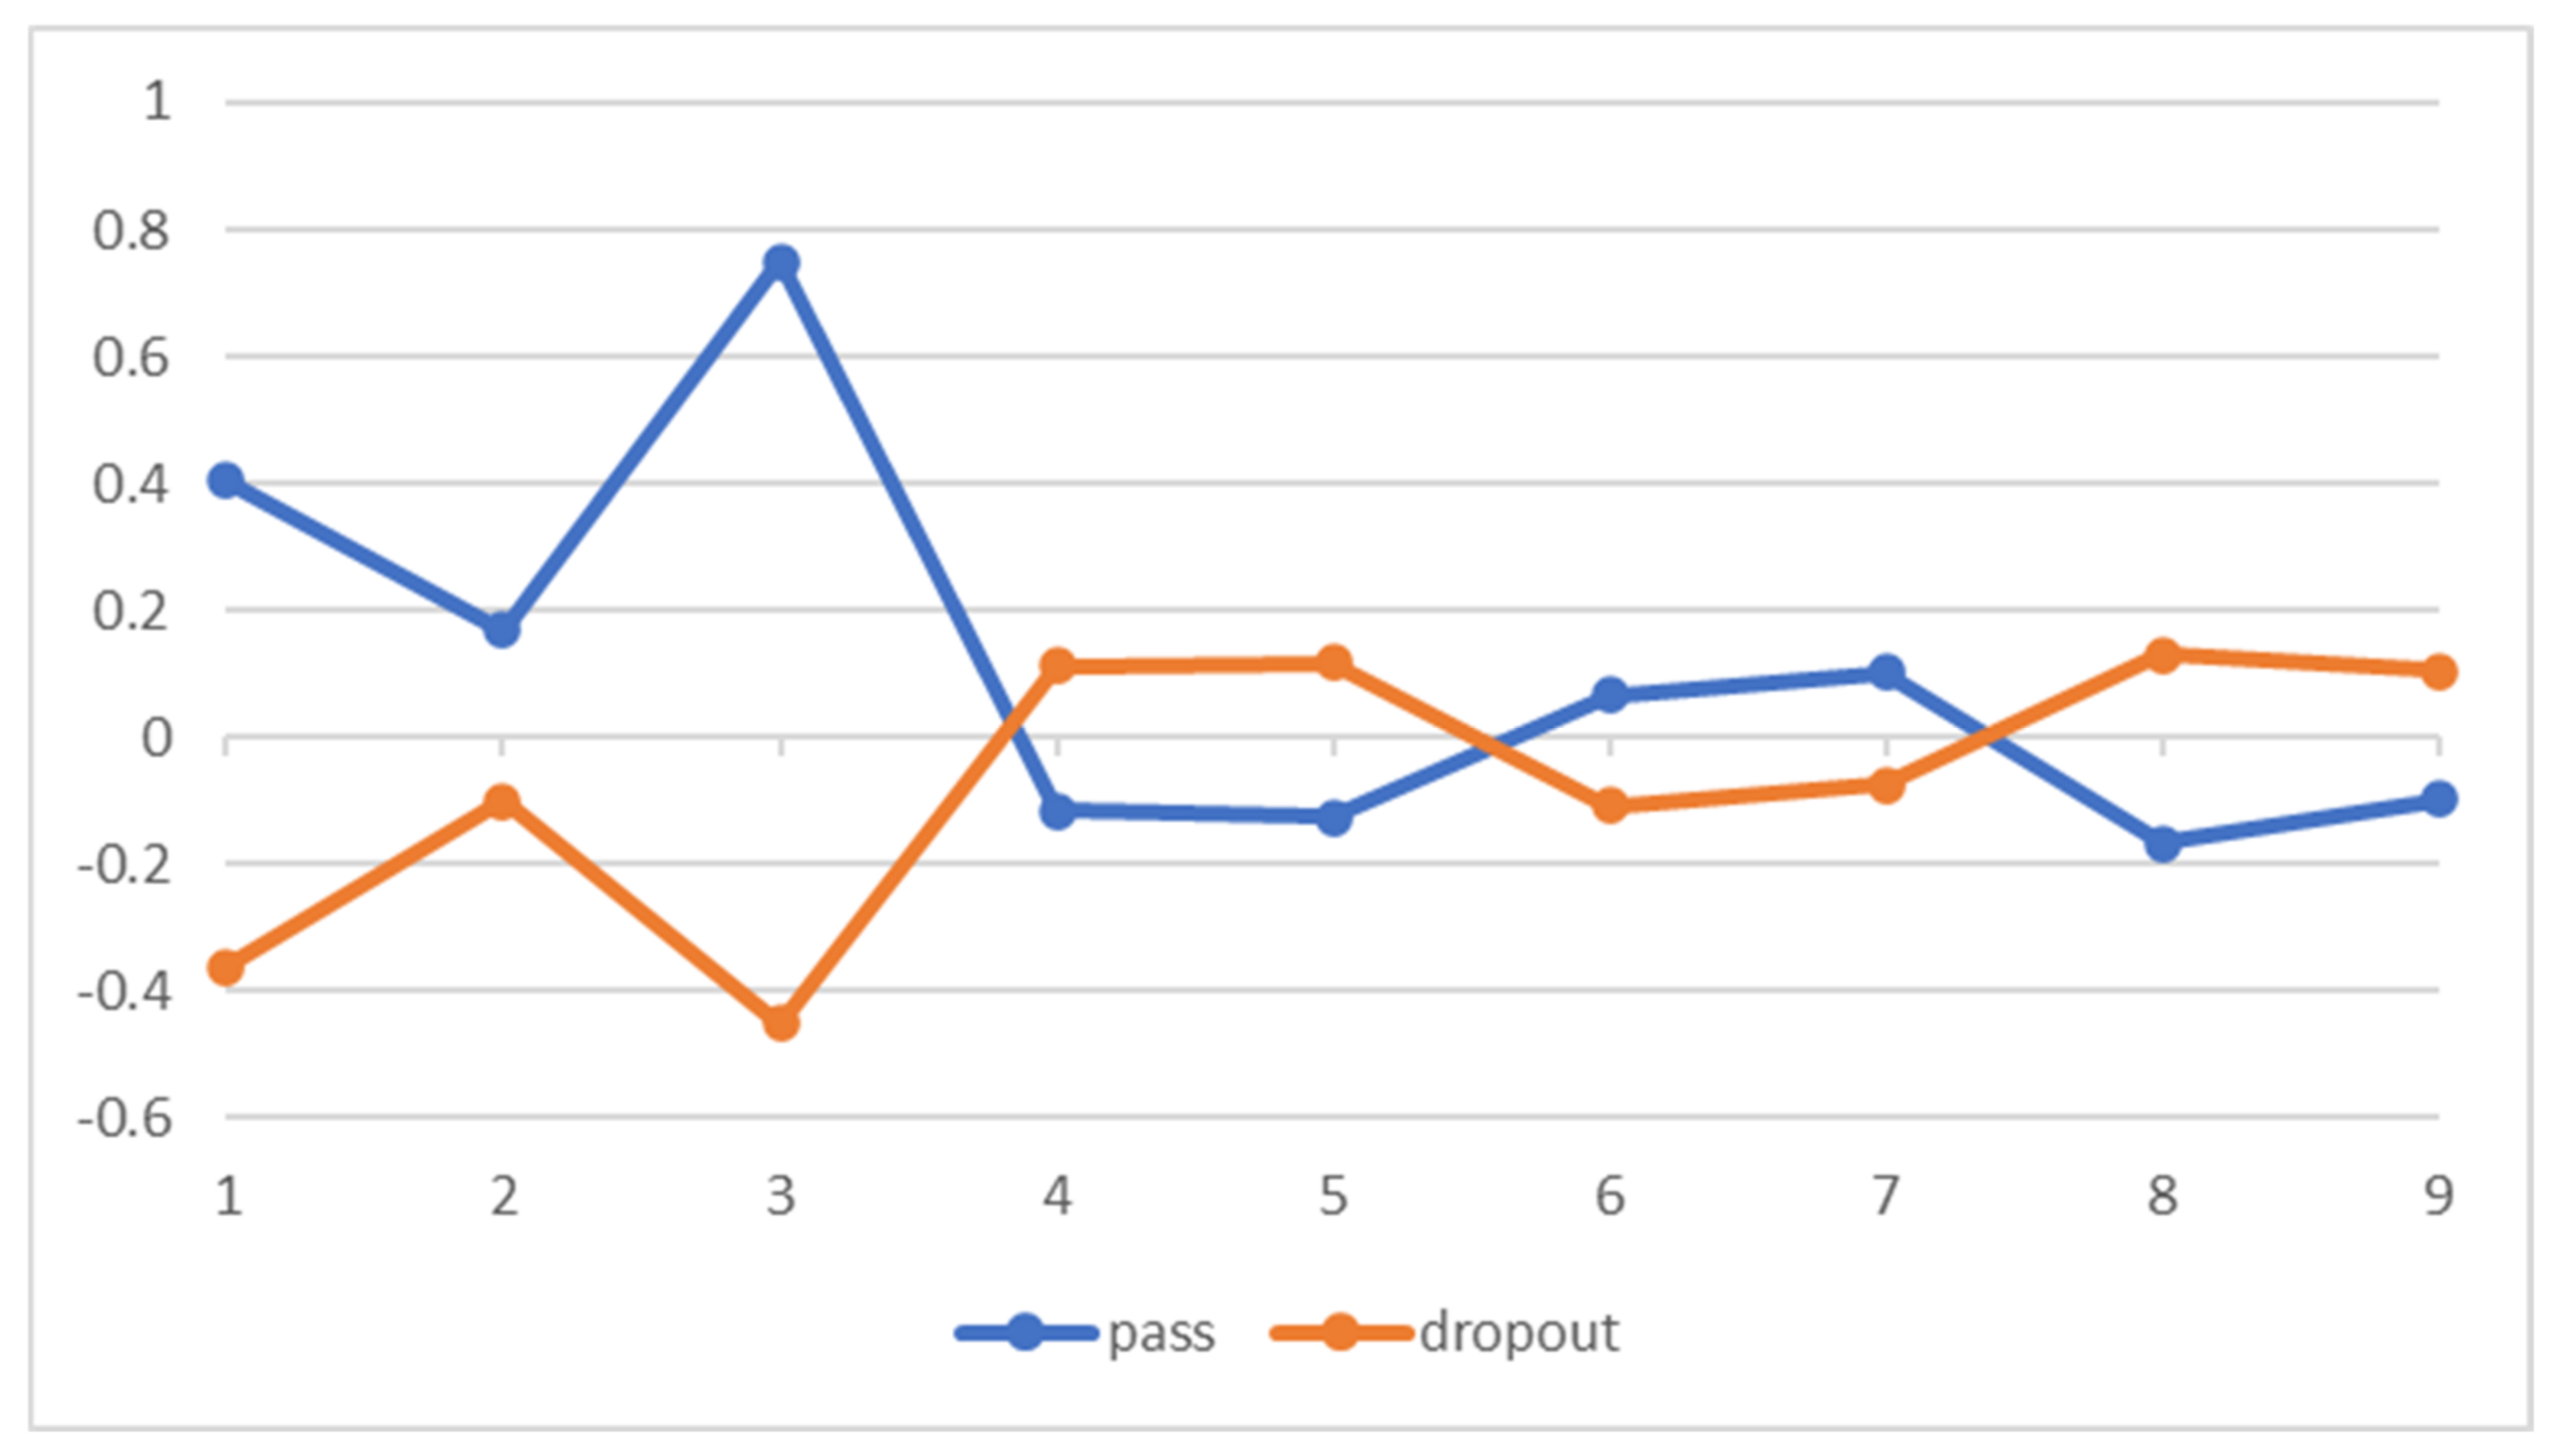
| Variable | Success (Non-Dropout) Mean (SD) | Dropouts Mean (SD) |
|---|---|---|
| Access grade | 0.405 (0.935) | −0.361 (0.990) |
| Language test | 0.168 (1.018) | −0.101 (0.988) |
| Mathematical test | 0.750 (0.964) | −0.452 (0.853) |
| Tmms_Emotional_Attention | −0.044 (0.974) | 0.062 (1.038) |
| Tmms_Emotional_Understanding | −0.082 (0.015) | 0.005 (0.969) |
| Tmms_Emotional_Regulation | −0.082 (1.011) | 0.034 (0.957) |
| Skaa_Learning_Goals | 0.073 (0.975) | −0.067 (1.062) |
| Skaa_Performance-Approach Goals | 0.003 (1.008) | 0.019 (0.955) |
| Skaa_Performance Avoidance Goals | −0.116 (1.005) | 0.111 (0.983) |
| Skaa_Avoidance_Academic_Work_Goals | −0.127 (0.968) | 0.118 (1.024) |
| Mslq_Intrinsic_Motivation | 0.067 (0.923) | −0.109 (1.050) |
| Mslq_Self-Efficacy | 0.101 (0.964) | −0.074 (1.027) |
| Mslq_Test_Anxiety | −0.168 (0.989) | 0.129 (1.004) |
| Mslq_Metacognitive_Strategies | 0.007 (1.008) | −0.005 (1.033) |
| Mslq_Self-Regulation | −0.011 (0.967) | 0.075 (0.941) |
| Eacm_Ease_High_Performance_Attribution | −0.099 (0.999) | 0.104 (0.971) |
| Eacm_Capacity_High_Performance_Attribution | −0.063 (1.040) | −0.019 (0.980) |
| Eacm_Teachers_Low_Performance_Attribution | 0.020 (1.011) | −0.028 (0.982) |
| Eacm_Low_Capacity_Low_Performance_Attribution | −0.054 (0.957) | 0.029 (1.040) |
| Eacm_Low_Effort_Low_Performance_Attribution | −0.038 (1.019) | −0.001 (1.011) |
| Eacm_Effort_High_Performance_Attribution | −0.060 (0.947) | 0.008 (0.997) |
| Font | Type III | Degrees of Freedom | F | Significance | η2 Partial | Observed Power |
|---|---|---|---|---|---|---|
| Within groups | 32.01 | 1.000 | 1.90 | 0.16 | 0.003 | 0.280 |
| Factor 1 × population segment | 26.68 | 1.000 | 1.58 | 0.20 | 0.003 | 0.242 |
| Factor 1 × gender | 66.32 | 1.000 | 3.93 | 0.04 | 0.006 | 0.508 |
| Factor 1 × marital status | 48.61 | 1.000 | 2.88 | 0.09 | 0.005 | 0.396 |
| Factor 1 × dropout | 373.08 | 1.000 | 22.14 | <0.001 | 0.035 | 0.997 |
| Intra error | 10,429.55 | 619.000 | ||||
| Between groups | 10.14 | 1 | 2.81 | 0.09 | 0.005 | 0.388 |
| Population segment | 1.87 | 1 | 0.52 | 0.47 | 0.001 | 0.111 |
| Gender | 0.001 | 1 | 0.00 | 0.98 | 0.000 | 0.050 |
| Marital status | 11.11 | 1 | 3.08 | 0.07 | 0.005 | 0.419 |
| Inter error | 2229.38 | 619 | ||||
| Variable | Parameter | B | Standard Error | t | Sig. | Confidence Interval 95% | η2 Partial | Observed Power | |
|---|---|---|---|---|---|---|---|---|---|
| Lower Limit | Upper Limit | ||||||||
| Access grade | Intersection | −0.288 | 0.445 | −0.648 | 0.518 | −1.162 | 0.586 | 0.001 | 0.099 |
| Population segment | 0.177 | 0.096 | 1.839 | 0.066 | −0.012 | 0.365 | 0.005 | 0.451 | |
| Gender | −0.008 | 0.087 | −0.094 | 0.925 | −0.179 | 0.163 | 0.000 | 0.051 | |
| Marital status | −0.275 | 0.394 | −0.699 | 0.485 | −1.049 | 0.498 | 0.001 | 0.107 | |
| Dropout = no | 0.778 | 0.077 | 10.051 | <0.001 | 0.626 | 0.930 | 0.140 | 10.000 | |
| Language test | Intersection | 0.765 | 0.464 | 1.649 | 0.100 | −0.146 | 1.676 | 0.004 | 0.377 |
| Population segment | −0.037 | 0.100 | −0.375 | 0.708 | −0.234 | 0.159 | 0.000 | 0.066 | |
| Gender | −0.102 | 0.091 | −1.127 | 0.260 | −0.281 | 0.076 | 0.002 | 0.203 | |
| Marital status | −0.636 | 0.411 | −1.550 | 0.122 | −1.443 | 0.170 | 0.004 | 0.340 | |
| Dropout = no | 0.264 | 0.081 | 3.269 | 0.001 | 0.105 | 0.422 | 0.017 | 0.904 | |
| Mathematical test | Intersection | −1.288 | 0.419 | −3.076 | 0.002 | −2.110 | −0.466 | 0.015 | 0.867 |
| Population segment | −0.184 | 0.090 | −2.037 | 0.042 | −0.361 | −0.007 | 0.007 | 0.529 | |
| Gender | 0.146 | 0.082 | 1.776 | 0.076 | −0.015 | 0.307 | 0.005 | 0.426 | |
| Marital status | 0.803 | 0.370 | 2.167 | 0.031 | 0.075 | 1.530 | 0.008 | 0.581 | |
| Dropout = no | 1.196 | 0.073 | 16.433 | <0.001 | 1.053 | 1.339 | 0.304 | 10.000 | |
| Tmms_Emotional_Attention | Intersection | 0.747 | 0.464 | 1.610 | 0.108 | −0.164 | 1.658 | 0.004 | 0.362 |
| Population segment | 0.146 | 0.100 | 1.458 | 0.145 | −0.051 | 0.343 | 0.003 | 0.308 | |
| Gender | 0.031 | 0.091 | 0.346 | 0.729 | −0.147 | 0.210 | 0.000 | 0.064 | |
| Marital status | −0.911 | 0.411 | −2.219 | 0.027 | −1.718 | −0.105 | 0.008 | 0.601 | |
| Dropout = no | −0.102 | 0.081 | −1.270 | 0.205 | −0.261 | 0.056 | 0.003 | 0.245 | |
| Tmms_Emotional_Understanding | Intersection | −0.980 | 0.458 | −2.140 | 0.033 | −1.879 | −0.080 | 0.007 | 0.570 |
| Population segment | −0.023 | 0.099 | −0.237 | 0.812 | −0.217 | 0.171 | 0.000 | 0.056 | |
| Gender | 0.179 | 0.090 | 1.993 | 0.047 | 0.003 | 0.355 | 0.006 | 0.512 | |
| Marital status | 0.698 | 0.405 | 1.721 | 0.086 | −0.098 | 1.493 | 0.005 | 0.405 | |
| Dropout = no | −0.086 | 0.080 | −1.078 | 0.282 | −0.242 | 0.071 | 0.002 | 0.190 | |
| Tmms_Emotional Regulation | Intersection | 0.985 | 0.453 | 2.173 | 0.030 | 0.095 | 1.875 | 0.008 | 0.583 |
| Population segment | 0.155 | 0.098 | 1.585 | 0.113 | −0.037 | 0.347 | 0.004 | 0.353 | |
| Gender | −0.023 | 0.089 | −0.256 | 0.798 | −0.197 | 0.152 | 0.000 | 0.058 | |
| Marital status | −1.092 | 0.401 | −2.723 | 0.007 | −1.880 | −0.304 | 0.012 | 0.776 | |
| Dropout = no | −0.113 | 0.079 | −1.437 | 0.151 | −0.268 | 0.042 | 0.003 | 0.300 | |
| Skaa_Learning_Goals | Intersection | −0.190 | 0.469 | −0.404 | 0.686 | −1.112 | 0.732 | 0.000 | 0.069 |
| Population segment | −0.089 | 0.101 | −0.880 | 0.379 | −0.288 | 0.110 | 0.001 | 0.142 | |
| Gender | −0.214 | 0.092 | −2.331 | 0.020 | −0.395 | −0.034 | 0.009 | 0.644 | |
| Marital status | 0.598 | 0.415 | 1.440 | 0.150 | −0.218 | 1.414 | 0.003 | 0.301 | |
| Dropout = no | 0.139 | 0.082 | 1.708 | 0.088 | −0.021 | 0.300 | 0.005 | 0.400 | |
| Skaa_Performance-Approach Goals | Intersection | −0.606 | 0.453 | −1.338 | 0.181 | −1.496 | 0.283 | 0.003 | 0.267 |
| Population segment | 0.126 | 0.098 | 1.289 | 0.198 | −0.066 | 0.318 | 0.003 | 0.251 | |
| Gender | 0.209 | 0.089 | 2.350 | 0.019 | 0.034 | 0.383 | 0.009 | 0.650 | |
| Marital status | 0.108 | 0.401 | 0.269 | 0.788 | −0.679 | 0.895 | 0.000 | 0.058 | |
| Dropout = no | −0.007 | 0.079 | −0.094 | 0.925 | −0.162 | 0.147 | 0.000 | 0.051 | |
| Skaa_Performance Avoidance Goals | Intersection | 1.035 | 0.458 | 2.261 | 0.024 | 0.136 | 1.935 | 0.008 | 0.617 |
| Population segment | 0.141 | 0.099 | 1.432 | 0.153 | −0.053 | 0.335 | 0.003 | 0.298 | |
| Gender | −0.174 | 0.090 | −1.940 | 0.053 | −0.350 | 0.002 | 0.006 | 0.491 | |
| Marital status | −0.790 | 0.405 | −1.949 | 0.052 | −1.585 | 0.006 | 0.006 | 0.494 | |
| Dropout = no | −0.223 | 0.080 | −2.805 | 0.005 | −0.379 | −0.067 | 0.013 | 0.800 | |
| Skaa_Avoidance_Academic_Work_Goals | Intersection | 0.547 | 0.460 | 1.188 | 0.235 | −0.357 | 1.450 | 0.002 | 0.220 |
| Population segment | 0.036 | 0.099 | 0.365 | 0.715 | −0.159 | 0.231 | 0.000 | 0.065 | |
| Gender | 0.132 | 0.090 | 1.461 | 0.145 | −0.045 | 0.309 | 0.003 | 0.308 | |
| Marital status | −0.694 | 0.407 | −1.704 | 0.089 | −1.493 | 0.106 | 0.005 | 0.398 | |
| Dropout = no | −0.249 | 0.080 | −3.116 | 0.002 | −0.406 | −0.092 | 0.015 | 0.875 | |
| Mslq_Intrinsic_Motivation | Intersection | −0.365 | 0.458 | −0.797 | 0.426 | −1.263 | 0.534 | 0.001 | 0.125 |
| Population segment | −0.068 | 0.099 | −0.691 | 0.490 | −0.262 | 0.126 | 0.001 | 0.106 | |
| Gender | −0.051 | 0.090 | −0.567 | 0.571 | −0.227 | 0.125 | 0.001 | 0.087 | |
| Marital status | 0.424 | 0.405 | 1.046 | 0.296 | −0.372 | 1.219 | 0.002 | 0.181 | |
| Dropout = no | 0.176 | 0.080 | 2.207 | 0.028 | 0.019 | 0.332 | 0.008 | 0.596 | |
| Mslq_Self-Efficacy | Intersection | 0.455 | 0.460 | 0.990 | 0.323 | −0.448 | 1.358 | 0.002 | 0.167 |
| Population segment | −0.228 | 0.099 | −2.294 | 0.022 | −0.422 | −0.033 | 0.008 | 0.629 | |
| Gender | −0.005 | 0.090 | −0.050 | 0.960 | −0.181 | 0.172 | 0.000 | 0.050 | |
| Marital status | −0.237 | 0.407 | −0.583 | 0.560 | −1.036 | 0.562 | 0.001 | 0.090 | |
| Dropout = no | 0.158 | 0.080 | 1.982 | 0.048 | 0.001 | 0.315 | 0.006 | 0.508 | |
| Mslq_Test_Anxiety | Intersection | 1.128 | 0.457 | 2.468 | 0.014 | 0.230 | 2.026 | 0.010 | 0.693 |
| Population segment | 0.097 | 0.099 | 0.985 | 0.325 | −0.097 | 0.291 | 0.002 | 0.166 | |
| Gender | −0.285 | 0.090 | −3.177 | 0.002 | −0.461 | −0.109 | 0.016 | 0.887 | |
| Marital status | −0.620 | 0.405 | −1.531 | 0.126 | −1.414 | 0.175 | 0.004 | 0.333 | |
| Dropout = no | −0.295 | 0.079 | −3.713 | <0.001 | −0.451 | −0.139 | 0.022 | 0.960 | |
| Mslq_Metacognitive_Strategies | Intersection | −0.148 | 0.470 | −0.315 | 0.753 | −1.070 | 0.775 | 0.000 | 0.061 |
| Population segment | 0.100 | 0.101 | 0.983 | 0.326 | −0.099 | 0.299 | 0.002 | 0.166 | |
| Gender | −0.250 | 0.092 | −2.716 | 0.007 | −0.431 | −0.069 | 0.012 | 0.774 | |
| Marital status | 0.448 | 0.416 | 1.078 | 0.282 | −0.368 | 1.264 | 0.002 | 0.190 | |
| Dropout = no | 0.023 | 0.082 | 0.287 | 0.774 | −0.137 | 0.184 | 0.000 | 0.059 | |
| Mslq_Self-Regulation | Intersection | 0.446 | 0.441 | 1.011 | 0.312 | −0.420 | 1.311 | 0.002 | 0.172 |
| Population segment | 0.063 | 0.095 | 0.666 | 0.506 | −0.123 | 0.250 | 0.001 | 0.102 | |
| Gender | −0.190 | 0.086 | −2.206 | 0.028 | −0.360 | −0.021 | 0.008 | 0.596 | |
| Marital status | −0.118 | 0.390 | −0.301 | 0.763 | −0.883 | 0.648 | 0.000 | 0.060 | |
| Dropout = no | −0.083 | 0.077 | −1.077 | 0.282 | −0.233 | 0.068 | 0.002 | 0.189 | |
| Eacm_Ease_High_Performance_Attribution | Intersection | 0.672 | 0.451 | 1.491 | 0.137 | −0.213 | 1.557 | 0.004 | 0.319 |
| Population segment | 0.086 | 0.097 | 0.883 | 0.377 | −0.105 | 0.277 | 0.001 | 0.143 | |
| Gender | 0.266 | 0.088 | 3.009 | 0.003 | 0.092 | 0.439 | 0.014 | 0.852 | |
| Marital status | −1.123 | 0.399 | −2.816 | 0.005 | −1.906 | −0.340 | 0.013 | 0.803 | |
| Dropout = no | −0.206 | 0.078 | −2.628 | 0.009 | −0.360 | −0.052 | 0.011 | 0.747 | |
| Eacm_Capacity_High_Performance_Attribution | Intersection | 0.129 | 0.469 | 0.276 | 0.783 | −0.792 | 1.050 | 0.000 | 0.059 |
| Population segment | −0.042 | 0.101 | −0.416 | 0.677 | −0.241 | 0.157 | 0.000 | 0.070 | |
| Gender | 0.018 | 0.092 | 0.197 | 0.844 | −0.162 | 0.199 | 0.000 | 0.054 | |
| Marital status | −0.127 | 0.415 | −0.305 | 0.760 | −0.942 | 0.688 | 0.000 | 0.061 | |
| Dropout = no | −0.048 | 0.082 | −0.591 | 0.555 | −0.208 | 0.112 | 0.001 | 0.091 | |
| Eacm_Teachers_Low_Performance_Attribution | Intersection | 0.727 | 0.457 | 1.591 | 0.112 | −0.170 | 1.625 | 0.004 | 0.355 |
| Population segment | 0.146 | 0.099 | 1.485 | 0.138 | −0.047 | 0.340 | 0.004 | 0.317 | |
| Gender | 0.164 | 0.090 | 1.837 | 0.067 | −0.011 | 0.340 | 0.005 | 0.450 | |
| Marital status | −1.210 | 0.405 | −2.991 | 0.003 | −2.004 | −0.416 | 0.014 | 0.848 | |
| Dropout = no | 0.050 | 0.079 | 0.633 | 0.527 | −0.106 | 0.206 | 0.001 | 0.097 | |
| Eacm_Low_Capacity_Low_Performance_Attribution | Intersection | 0.736 | 0.461 | 1.597 | 0.111 | −0.169 | 1.641 | 0.004 | 0.358 |
| Population segment | −0.019 | 0.099 | −0.191 | 0.849 | −0.214 | 0.176 | 0.000 | 0.054 | |
| Gender | 0.115 | 0.090 | 1.271 | 0.204 | −0.063 | 0.292 | 0.003 | 0.246 | |
| Marital status | −0.873 | 0.408 | −2.141 | 0.033 | −1.674 | −0.072 | 0.007 | 0.571 | |
| Dropout = no | −0.091 | 0.080 | −1.137 | 0.256 | −0.248 | 0.066 | 0.002 | 0.206 | |
| Eacm_Low_Effort_Low_Performance_Attribution | Intersection | 0.534 | 0.468 | 1.140 | 0.255 | −0.386 | 1.453 | 0.002 | 0.207 |
| Population segment | −0.066 | 0.101 | −0.650 | 0.516 | −0.264 | 0.133 | 0.001 | 0.099 | |
| Gender | 0.170 | 0.092 | 1.854 | 0.064 | −0.010 | 0.350 | 0.006 | 0.457 | |
| Marital status | −0.741 | 0.414 | −1.789 | 0.074 | −1.555 | 0.072 | 0.005 | 0.431 | |
| Dropout = no | −0.046 | 0.081 | −0.569 | 0.570 | −0.206 | 0.113 | 0.001 | 0.088 | |
| Eacm_Effort_High_Performance_Attribution | Intersection | 0.003 | 0.449 | 0.007 | 0.994 | −0.879 | 0.886 | 0.000 | 0.050 |
| Population segment | 0.109 | 0.097 | 1.129 | 0.259 | −0.081 | 0.300 | 0.002 | 0.203 | |
| Gender | −0.141 | 0.088 | −1.607 | 0.109 | −0.314 | 0.031 | 0.004 | 0.361 | |
| Marital status | 0.114 | 0.398 | 0.287 | 0.775 | −0.667 | 0.895 | 0.000 | 0.059 | |
| Dropout = no | −0.060 | 0.078 | −0.773 | 0.440 | −0.214 | 0.093 | 0.001 | 0.121 | |
Publisher’s Note: MDPI stays neutral with regard to jurisdictional claims in published maps and institutional affiliations. |
© 2022 by the authors. Licensee MDPI, Basel, Switzerland. This article is an open access article distributed under the terms and conditions of the Creative Commons Attribution (CC BY) license (https://creativecommons.org/licenses/by/4.0/).
Share and Cite
Vidal, J.; Gilar-Corbi, R.; Pozo-Rico, T.; Castejón, J.-L.; Sánchez-Almeida, T. Predictors of University Attrition: Looking for an Equitable and Sustainable Higher Education. Sustainability 2022, 14, 10994. https://doi.org/10.3390/su141710994
Vidal J, Gilar-Corbi R, Pozo-Rico T, Castejón J-L, Sánchez-Almeida T. Predictors of University Attrition: Looking for an Equitable and Sustainable Higher Education. Sustainability. 2022; 14(17):10994. https://doi.org/10.3390/su141710994
Chicago/Turabian StyleVidal, Jack, Raquel Gilar-Corbi, Teresa Pozo-Rico, Juan-Luis Castejón, and Tarquino Sánchez-Almeida. 2022. "Predictors of University Attrition: Looking for an Equitable and Sustainable Higher Education" Sustainability 14, no. 17: 10994. https://doi.org/10.3390/su141710994