Article

Temporal and Spatial Variation of Vegetation in Net Primary Productivity of the Shendong Coal Mining Area, Inner Mongolia Autonomous Region

1
College of Geographical Science, Inner Mongolia Normal University, Hohhot 010022, China
2
Inner Mongolia Institute of Territorial Space Planning, Hohhot 010018, China
*
Authors to whom correspondence should be addressed.
Sustainability 2022, 14(17), 10883; https://doi.org/10.3390/su141710883
Submission received: 18 July 2022 / Revised: 25 August 2022 / Accepted: 27 August 2022 / Published: 31 August 2022

Abstract

:
Coal mining can cause significant local environmental damage while driving the regional economy of an area. The key index of net primary productivity (NPP) measures the amount of energy made available in an ecosystem and serves as a useful metric for understanding vegetation restoration in mining areas. This study used a CASA model to estimate the vegetation NPP of the Ordos area of the Shendong coal fields from 2000 to 2019. Model output, human factors, and regional meteorological data were subjected to trend analysis, significance testing, partial correlation analysis, and residual analysis. The NPP data generated by a CASA model inversion approximated measured data to a reasonable degree. The average annual NPP of the vegetation in the study area from 2000 to 2019 was 44.51 g C/m2 a. In general, NPP showed a fluctuating upward trend, with slower increases before 2011 and more rapid increases after 2011. The trend exhibited considerable spatial heterogeneity. Areas with increasing NPP accounted for 21.54% of the study area and occurred mainly in the Dongsheng District, the Kangbashi District, and areas bordering the Ejin Horo Banner. Analysis detected consistent spatial variation between NPP and each factor in the study area. NPP is positively correlated with precipitation and human activities and negatively correlated with air temperature. The change in vegetation cover depended on both human activity and meteorological conditions. In terms of the strength of influence on vegetation NPP, human activity exceeded climate, followed by temperature and precipitation. Although the NPP of vegetation in the region directly affected by coal mining shows a trend of improvement, it is still lower than that in the natural growing region. In the next step, the ecological restoration of vegetation should be further strengthened to achieve regional ecological balance.

1. Introduction

Modern civilization depends strongly on hydrocarbon-based energy sources [1], which have generally progressed from wood to whale oil, coal, oil, and gas. Coal has driven industrialization, electrification, and transportation to support the expansion of human survival and material culture [2]. Countries experiencing rapid economic development based on coal energy sources find their economic base and stability to be tied to coal production [3]. The Inner Mongolia Autonomous Region is a key area of China’s westward migrating coal mining strategy [4]. Its coal resources are widely but densely distributed in the Mengdong and Mengzhong mining areas [5]. Together, these represent a hundred million tons of the national large coal base. The Mengzhong mining area is located in Ordos City, Inner Mongolia and includes the Shendong coal fields. The area hosts thick, undeformed coal seams suitable for large-scale, mechanized subsurface mining. The area overlying the mines represents an ecologically fragile area subject to subsidence and collapse. In the case of subsidence and collapse, mining of subsurface coal seams removes support and thereby disrupts the overlying surface. Mine subsidence has harmed vegetation, soil, and other aspects of the local ecosystem. Negative environmental impacts detract from the economic benefits of large-scale mining [6]. Over time, the original ecological vegetation is gradually degraded and only distributed in sporadic areas. Relatively speaking, the proportion of artificial vegetation increases year by year [7]. Vegetation represents a major component of terrestrial ecosystems and a key factor for measuring their health [8]. Net vegetation primary productivity (vegetation NPP) tracks energy flows and overall ecosystem health. NPP also measures an area’s contribution to the global carbon cycle.
To date, the primary methods for estimating NPP have been field measurements or model simulations. Field measurements have traditionally used sample surveys and distributed observations of above-ground and soil biomass [9]. The expenses and technical requirements of this method preclude its use over wide areas and longer time intervals. Meanwhile, NPP model simulation methods generally use one of three approaches. The models themselves are referred to as climate-related statistical models (statistical methods), light energy utilization models (parametric models), and physiological and ecological process models (mechanistic models) [10]. Each model type carries with it advantages and drawbacks. Climate models produce results with relatively high uncertainty because they do not consider vegetation-related information [11]. Light energy utilization models include light energy transfer and conversion processes, but these remain somewhat uncertain [12]. Process models require many parameters that are either uncertain or difficult to obtain [13]. Mechanistic models are complex and may use inaccurate assumptions. While uncertainties also affect NPP modelling approaches, researchers adopt these due to their better coverage and greater scope relative to traditional field surveys. NPP modelling can effectively constrain the understanding of regional ecological health [14]. Due to its utilization of satellite remote sensing technology, the CASA model has been widely used in estimating NPP in terrestrial ecosystems and in global carbon cycle research. The CASA model uses vegetation photosynthetic processes and light energy utilization as a basis [15] for estimating dynamics and spatiotemporal variability in NPP at the regional and global scales [16].
For mining areas, NPP can be used as a unified scale standard to measure the changes to the ecological environment in mining areas. By accurately estimating the biomass in the mining area, the spatial pattern, changing trend characteristics, and response to climate change of vegetation NPP can be quantitatively analyzed, thereby reflecting the ecosystem health of the mining area. Monitoring variation in vegetation NPP can expand the understanding of the effectiveness of restoration and mitigation strategies. The results are of great significance for understanding the mechanisms of the effect of climate change on the vegetation change process in the terrestrial ecosystem in the mining area, the ecological restoration of the mining area, and effective governance [17].
Researchers have adopted a range of model approaches for studying vegetation or other ecological parameters in coal mining areas [18,19,20,21,22]. Additionally, the research mainly focuses on analyzing the relationship between the temporal and spatial variation characteristics of NPP and coverage in mining areas and their influencing factors. For example, Hao Chengyuan and other scholars used EOS/MODIS satellite remote sensing data to analyze the NPP of the ecosystem in the Lu’an mining area from 2001 to 2006, and conducted research and analysis from the perspective of time and space. Human activities such as farming are closely related, and the spatial heterogeneity is mostly related to natural factors such as annual precipitation. However, combined with domestic and foreign research, few studies have addressed NPP in the Shendong mining area, and very limited historical data are available. At the same time, the Shendong mining area (Ordos) mostly involves mechanized underground mining. Compared with other mining areas, studying the changes in the surface vegetation NPP can provide corresponding research references for other mining-concentrated mining areas.
This study used the CASA model to simulate the spatio-temporal dynamics of the vegetation NPP in the Shendong mining area of Inner Mongolia from 2000 to 2019. The study also analyzed climate factors to determine both the qualitative and quantitative aspects of environmental health in Shendong. The results can help inform mitigation and restoration strategies and promote the sustainable and scientific development of the land and its resources.

2. Materials and Methods

2.1. Study Area

The study area is located within the broad northward arc of the Huang He River, in a zone between the Ordos Plateau and the northern edge of the northern Shanxi Plateau. To the north lies a transition zone abutting the Maousu Desert, and to the south lies an eastern section of the northern edge of the Loess Plateau in northern Shanxi [23]. As a typical hill and gully terrain, most of the area consists of sand dunes and other arid climate landforms. The terrain gradually increases in elevation from southeast to northwest, with a series of higher-elevation drainage divides occurring roughly in the middle of the study area. The elevation ranges from 1200 to 1400 m. The climate is categorized as a middle temperate continental climate. The winter is long and cold, and the summer is hot and short. Temperatures in spring and autumn change sharply. The relatively low annual rainfall is typically discretely concentrated, and the annual rainy season varies greatly. Rain depends on seasonal winds from the south in the summer, from the east in late autumn, and from the northwest in early spring. The annual average precipitation in the area is 320~400 mm, and the inter-annual variation of precipitation is great. The precipitation in wet years is about 3 times that of dry years. The annual distribution is uneven, and the precipitation is small and concentrated, mainly in June to September, accounting for about 3/4 of the whole year, mostly in the form of heavy rain with strong bursts. The annual average temperature is 7.3 °C, the annual extreme maximum temperature is 38.8 °C, and the annual extreme minimum temperature is −28.1 °C. The surface of the study area is mostly hard-beamed land with low organic matter content. The soil texture is sandy soil or sandy loam, the soil mechanical composition is coarse, and the soil texture is loose. The vegetation in the area is arid/semi-arid grassland vegetation, sandy plants dominate, and the vegetation coverage is low.
As shown in Figure 1, the study area includes 87 subsurface coal mines, including the Liuta Coal Mine, Shangwan Coal Mine, and so on. Combined with the current situation of the study area, a direct impact area of well mining and a natural recovery area are set up in the study area. The geometric centers of the two areas have a difference of 29′1″ in longitude, 10′05″ in latitude, and a distance of 4.7 km between the geometric centers. They are both hill and gully landforms and have the same geological origin, with similar elevations and similar slopes.

2.2. Data Sources

2.2.1. Remote Sensing Data

This study used NDVI (MOD13Q1, 250 m, 16d) and NPP data [24] (MOD17A3, 1 Km, 1a) downloaded from U.S. National Aeronautics and Space Administration (NASA) websites. The MODIS Reprojection Tool was used to convert (Geo TIFF) and reproject (WGS84/Albers Equal Area Conic) the two datasets. Monthly NDVI datasets for the study period were integrated with annual NPP data using batch methods [25] to obtain MODIS NPP and NDVI time series covering the study area for the duration of the study period (2000–2019).

2.2.2. Measured NPP Data

Due to the challenges and limitations posed by measuring NPP in the field, biomass conversion NPP data are usually used instead of field NPP data for data model validation. This research measured biomass in 19 plots representing the topography of the study area from July to August 2021. Considering the diversity of vegetation types in the study area, 25 × 25 m was selected as the large plot. In these areas, three 1 × 1 m grassland plots were selected for biomass sampling, and the average value was later taken as grassland biomass.
Biomass was collected, weighed immediately, labeled, and transported back to the laboratory for analysis. In the lab, biomass dry weight data were obtained after samples were dried at 75 °C for 12 h. NPP was estimated from each sample square as the proportion of above-ground biomass relative to below-ground biomass, assuming an NPP conversion coefficient of 0.475 [14]. Trees within large plots included sand willow and poplar trees. We counted the number of trees in each plot and estimated the size of each tree individually from its diameter at 1.3 m above the ground. The biomass and corresponding NPP of the forested land were estimated according to the algorithm proposed by Fan Wenyi and others [15,26]. Finally, the coverage of grassland and trees was integrated into the total NPP area of each plot. The NPP per unit area was determined by combining the area of the large square.

2.2.3. Meteorological Data

Meteorological data were obtained from the China Meteorological Science Data Sharing Service Network (available online: http://cdc.cma.gov.cn (accessed on 17 July 2022)). The daily data of precipitation and temperature from 2000 to 2019 were collected from six standard meteorological stations in the study area and its surrounding areas. After calculating monthly precipitation and average temperature data by means of summing and averaging methods, we used ANUSPLIN to break the data into a grid to match the projection for the study area and the resolution of NPP data.

2.2.4. Other Data

Administrative division data came from the Inner Mongolia Autonomous Region Territorial Space Planning Institute. Vegetation cover data were obtained from the European Space Agency (available online: https://maps.elie.ucl.ac.be/CCI/viewer/ (accessed on 17 July 2022)) [27]. Distribution maps of subsurface mines came from the Inner Mongolia Geological Survey Planning Institute.

2.3. Methods

2.3.1. Optical Energy Utilization Model (CASA Model)

The Carnegie–Ames–Stanford Approach (CASA) is a light energy utilization model proposed by Potter in 1993. This model is a mechanistic model that estimates vegetation NPP based on the vegetation’s physiological processes. Meteorological data inputs include solar radiation, temperature, and precipitation. Remote sensing data inputs include the vegetation index and empirical data such as maximum light energy utilization. The model uses these to estimate the maximum primary productivity of vegetation. The present study utilized a modified CASA model [6]. The specific NPP formula was:
NPP ( x , t ) =   APAR ( x , t ) × ε ( x , t )
where APAR ( x , t ) represents the effective photosynthetic radiation absorbed in pixel x during month t. The term ε ( x , t ) represents the actual optical energy utilization rate of pixel x during month t.
The formula used to calculate photosynthetically active radiation was:
APAR ( x , t ) =   SOL ( x , t ) ×   FPAR ( x , t ) × 0.5
where SOL ( x , t ) represents the total solar radiation (MJ/m2) of pixel x during month t. The term FPAR ( x , t ) represents the vegetation’s absorption ratio of photosynthetically active radiation and the constant 0.5 indicates the proportion of effective solar radiation to total solar radiation.
The actual light energy utilization rate was calculated as:
ε ( x , t ) = f 1   ( x , t ) × f 2   ( x , t ) ×   W ( x , t ) × ε m a x
where   f 1   ( x , t ) and f 2   ( x , t ) represent the effect of high and low temperatures on the light energy conversion rate. The term W ( x , t ) indicates the influence of water conditions on the light energy conversion rate and ε m a x represents the maximum light energy utilization of vegetation in the ideal state. For ε m a x , the research results of Professor Zhu Wenquan are cited in this paper [28].

2.3.2. Theil–Sen Median Trend Analysis with the Mann–Kendall Non-Parametric Test

This study used statistical methods with good associative properties to determine trends in long-term data series. The Theil–Sen Median (sen) is a robust, nonparametric trend calculation method. Often used in trend analysis of long-term data series [29], the method is computationally efficient and insensitive to measurement errors and outlier data. The method does not require the data to obey a certain distribution, nor does it amplify errors. The formula for the trend estimation is:
slope = median ( N P P j N P P i j i ) , 2000 i < j 2019
where the size of the slope   term indicates the trend in vegetation with NPP > 0 for an upward trend and <0 for a downward trend.
The Mann–Kendall test is a non-parametric statistical test (M-K) originally proposed by Mann in 1945 and then further improved by Kendall and Sneyers. The M-K test does not require measurements to obey a normal distribution or linear trend. Missing values and outliers do not strongly affect results. The test is widely used in the trend analysis of long-term data series to evaluate the significance of vegetation NPP trends. The test statistic S is calculated as:
S =   j = 1 n 1 i = j + 1 n s g n ( N P P j N P P i )  
where the term sgn represents a symbolic function calculated as:
s g n ( N P P j N P P i ) = { 1     N P P j N P P i > 0 0       N P P j N P P i = 0 1   N P P j N P P i < 0
The test statistic Z was used for the trend test as follows:
Z = { s V a r ( s )       S > 0             0                         S = 0 s + 1 V a r ( s )       S < 0
The function Var was calculated as:
V a r ( s ) = n ( n 1 ) ( 2 n + 5 ) 18
where n is the number of data in the sequence.
For a given confidence interval (significance level) α, absolute values of Z equal to or exceeding 1.65, 1.96, and 2.58 give respective significance levels of 90%, 95%, and 99%. If |Z| ≥ Z1 − α/2, the assumption of an upward or downward trend cannot be rejected (the null hypothesis is not obtained). Positive values indicate an upward trend, and negative values indicate a downward trend. According to the t-test cutoff value, when |Z|> 1.65, the increasing or decreasing trend is weakly significant at the 0.1 level. When |Z|> 1.96, the increasing or decreasing trend is significant at the 0.05 level. When |Z|> 2.58, the increasing or decreasing trend is extremely significant at the 0.01 level.

2.3.3. Partial Correlation Analysis

Both multivariate and partial correlation coefficients were calculated. The multivariate correlation coefficient was calculated as follows:
r x y = i = 1 n [ ( x i x ¯ ) ( y i y ¯ ) ] i = 1 n [ ( x i x ¯ ) 2 i = 1 n [ ( y i y ¯ ) 2 ]
where r x y represents the correlation coefficients for the x and y time series. The x i   term represents NPP and y i   represents the average temperature or precipitation in year i over a total of n years. The term x ¯ represents annual average NPP, and y ¯   represents average annual temperature or precipitation.
Partial correlation coefficients between NPP and temperature and NPP and precipitation were calculated by using pixel-based spatial analysis and the following formula:
R j k l = R j k R j l R k l ( 1 R j l 2 ) + ( 1 R k l 2 )
where R j k l represents the partial correlation coefficient between variable j and variable k after variable l is fixed. The terms R j k ,   R j l ,     a n d   R k l are correlation coefficients for the variables j and k, j and l, and k and l, respectively.

2.3.4. Residual Analysis of Multiple Regression Results

The analysis also used a multiple regression residual analysis method proposed by Evans and Geerken [30,31]. Multiple linear regression models were used to fit the vegetation NPP according to the variation in meteorological factors. Differences between fitted and observed vegetation NPP were treated as an artificial factor to constrain the impact of climate change and human activity on changes in vegetation cover [32]. The calculation ran as follows:
ε = N P P r e a l N P P p r e
where ε is the residual error, ε > 0 indicates positive effects of human activity, ε < 0 indicates negative effects of human activity, and ε = 0 indicates negligible effects of human activity. The term N P P r e a l represents the observed vegetation NPP, while N P P p r e represents the predicted NPP.

2.3.5. Partial Least-Squares Regression Method (PLS)

Modeling by partial least-squares regression method [33] combines the advantages of principal component analysis and multivariate regression. This method used a variable projection importance discrimination index (VIP) value calculated [34] as:
V I P j = N i = 1 n k R 2 ( y k , t i ) w i j 2 / i = 1 n k R 2 ( y k , t i )              
where N represents the number of independent variables, and k is the single dependent variable. The term R 2 ( y k , t h ) represents the determination coefficient for both y k and t h , n is the number of components, t i is the ith component of the independent variable, y k is the kth component of the response variable, and w i j 2 represents the contribution of each independent variable pair, t h . The independent variable of VIP > 1 is generally interpreted as representing a significant explanation for the dependent variable. For 0.8 < VIP < 0.8, VIP is taken to carry no explanatory significance. Otherwise, the larger the VIP value, the greater its explanatory significance.

3. Results

3.1. Model Validation

Spatial comparison of observed data with the data generated by the CASA model provided a means of evaluating accuracy. Figure 2 shows the results of the correlation analysis of observed and simulated NPP, for which R2 = 0.55 (p < 0.01). The observed NPP data apparently agree with the modeled data.
Given the temporal mismatch between the model study period and the timing of observed data acquisition, we also used MODIS NPP finished product data to further validate the model data. For this procedure, 55 sample points within the study area were randomly selected for fitting analysis. As shown in Figure 3, the R2 estimated between the MODIS NPP product value and the modeled value was 0.66 (p < 0.01). This indicates a high degree of consistency and that CASA can generate reasonably accurate estimates of NPP. It can better reflect the spatial distribution and interannual variation of NPP in the Shendong mining area, and the simulation results have better accuracy than product data.

3.2. Spatiotemporal Distribution of NPP in the Shendong Mining Area

According to the monthly NPP data simulated by the CASA model, the total value of NPP over the time period was obtained, and then the average value of NPP in the study area was taken as the annual value of NPP over the time period. As shown in Figure 4, vegetation NPP generally fluctuated between 2000 and 2019, with slower increases in 2000–2011 and faster increases in 2011–2019. The annual average NPP over the entire study period was 44.51 g C/m2 a. The propensity rate was 1.06/a with a multiannual mean trough year in 2011 and a peak in 2018 (p < 0.01). These values differed by 37.04 g C/m2 a. Annual average NPP distributions appear to have generally increased in the study area (Figure 5). Regional NPP estimates were divided into five categories using a natural fracture method. The average annual NPP for the entire region was 40 to 60 g C/m2 a. This value represented 57.96% of the entire study area (the largest proportion). An additional 34.12% of the study area shared 20 to 40 categories, and 0.28% (minimum category) shared >80 categories.
Based on the NPP simulation results from 2000 to 2019, this paper used the R language to conduct Sen+MK trend analysis and combined it with slope value division to determine the NPP trend of the study area from 2000 to 2019. As shown in Figure 6, the multi-decadal trends in NPP show considerable spatial heterogeneity. The areas of Dongsheng, Kangbashi, and the Inkinhoro Banner, representing 21.54% of the study area, experienced increased vegetation NPP. Pixels representing 78.46% of the study area experienced decreasing NPP. The MK significance test (Figure 7) indicates that 1.69% of the study area experienced an extremely significant rise in NPP. Pixels representing 1.33% of the study area experienced a significant rise in NPP. Pixels representing 18.42% of the study area experienced only a weakly significant rise in NPP. Pixels representing 0.19% of the study area experienced no significant increase in NPP. Pixels representing 0.01% of the study area experienced a very significant decline in NPP, and 0.12% of the study area experienced a significant decline in NPP. The spatial distribution of the significance of trends was consistent with that of the vegetation NPP trend itself.
The directly affected area and the natural growth area in the past 20 years are listed one-to-one to determine the response law of the artificial vegetation and the natural growth area. Figure 8 shows the comparison and fitting curve of the annual NPP values between the direct affected area and the natural growth area. It can be seen that the overall net primary productivity of vegetation in both the directly affected area and the natural growth area shows a fluctuating upward trend, and the change is basically the same as that in the study area. Among them, the multi-year average value in the study period of the direct affected area is 48.26 g C/m−2 a−1, and its tendency rate is about 1.44/a. The multi-year average value in the study period of the natural growth area is 48.69 g C/m−2 a−1, its tendency rate is about 1.12/a, and both areas pass the p < 0.01 significance test. At the same time, it is not difficult to see that, compared with the two areas, the vegetation NPP in the area directly affected by coal mining was mostly smaller than that in the natural recovery area before 2009.
This may be related to the leap forward in development in this area from 1999 to 2009, which led to the decline of vegetation NPP in the area directly affected by coal mining.
After that, the vegetation NPP in the areas directly affected by coal mining has gradually become larger than the vegetation NPP in the natural recovery area. This may also coincide with the impact of the construction of ecological civilization proposed by China at the 17th and 18th CPC National Congress of the Communist Party of China.

3.3. Meteorological Factors

To determine the influence of vegetation NPP in the study area, SIMCA 14.1 was used, with annual NPP as the dependent variable and annual precipitation and annual average temperature as the independent variables. We estimated partial correlation coefficients between annual NPP and annual precipitation and average annual temperature from 2000 to 2019. As can be seen from Figure 9a,b, significant spatial differences appeared between NPP and each factor. The partial correlation coefficient for NPP and precipitation ranged from −0.60 to 0.92. The partial correlation coefficient for air temperature ranged from −0.72 to 0.77. Correlation of both factors showed both positive and negative covariance with vegetation NPP. In contrast, precipitation provided primarily positive correlation coefficients (a). Areas positively correlated with precipitation occur primarily in the west or in scattered areas in the middle and east of the study area. These account for 92.79% of the total area. Air temperature covaried negatively with NPP (b). Regions with negative correlation coefficients occurred primarily in western regions or were distributed throughout the central and eastern regions. These represented 78.08% of the total area.
Vegetation NPP correlated weakly with precipitation in the study area and showed significant spatial heterogeneity. The correlation coefficients between NPP and air temperature contrasted those estimated for precipitation and exhibited opposing spatial distributions. This indicates that the correlation between precipitation and temperature may jointly affect NPP.

3.4. Effects of Human Activity

Vegetation NPP can depend on both natural and human factors. Although climate change may influence NPP in the study area, correlation analysis can only describe the degree of covariance between NPP and various climate factors, but cannot quantify the strength of the influence. Along with climate factors, human activity may also strongly influence NPP. Residual error analysis was used to identify and quantify the influence of human activity on NPP in the study area. A multiple linear regression model based on temperature and precipitation data generated fitted NPP values for the study period. Residual estimates were obtained by calculating the difference between the predicted and observed values in the study area. Values were then analyzed as potential estimates of the influence of human activity on NPP in the study area.
Based on the results of correlation analysis, this paper selects precipitation and temperature factors in the current year, establishes a linear regression equation based on the pixel scale to predict NPP, and obtains NPP time series with only the climate effect, so as to obtain the residual value, which is the impact of human activities on NPP. Figure 10 shows the overall trend of the estimated influence of human activity on NPP from 2000 to 2019. The trend shows a slope of 0.53 per year with considerable variation around the trend. The impact of human activity on NPP since 2011 appears relatively high in the study area. This may relate to local environmental protection efforts. The human influence on NPP from 2015 to 2018 appears relatively weak. This may relate to meteorological factors in the study area and coupling effects.
Figure 11 shows the spatial distribution of the influence of human activity. Negative values indicate the influence of human activity on NPP. Only a very limited area experienced a negligible influence of human activity on NPP. The area where human activity appeared to have enhanced NPP accounted for 90.86% of the total study area. Intuitively, coal mining areas show greater human activity influence than other areas.

3.5. Double Impact Effects

Partial least squares analysis was used to address multivariate commonality problems arising from intercorrelated variables [35]. As shown in Figure 12a, the ability of variables to explain changes in NPP (VIP) is ranked as follows: human activity (1.64) >temperature (0.48) >precipitation (0.27). This indicates that human activity explains more variation than climate variation does, especially in recent years. Temperature appears to exert a stronger influence than precipitation on vegetation NPP. Figure 12b gives regression coefficients for the estimated regression equation of y = 0.024 x 1 19.44 x 2 + 8.06 x 3 + 181.97 . The terms x1, x2, and x3 indicate precipitation, air temperature, and human activity. As seen in Figure 12c, air temperature exerts a negative effect on NPP while other factors, including human activity, exert a strong positive effect, indicated by an increase in NPP. These relations suggest that recent interventions promoting NPP have succeeded.

4. Discussion

4.1. NPP Simulation Results

Although the CASA model appears to have provided adequate NPP estimates for the study area, uncertainties in observed NPP and the resolution of the data may pose difficulties. Further validation of the CASA NPP can help increase confidence in the estimated results. Estimates of NPP for this region were therefore compared with previous CASA-generated NPP results as reported by Zhu Wenquan [28]. The results described here also generally resemble those published by Mu Shaojie [36], who performed an inversion of CASA results from the Inner Mongolia Autonomous Region [37]. The results interpreted here are generally lower than those reported by Xie S.S. [38], who used a BLOME-BGC model. The differences among the inversion results may arise from several sources. Mismatched time intervals or spatial scale may generate different results. Differences in the models themselves, their parameters, or inversion settings may also cause variation. Different interpolation methods applied to the data and differing scopes of the study area can introduce uncertainties into meteorological data, which propagate into spatial results. This study compared NPP results among field observational sources, model sources, and from previous sources. The results are generally consistent. Previous research has shown that the CASA model performs NPP inversion, but the current spatial resolution and temporal duration of data remain limited. The study area is also only covered by a limited number of meteorological stations. Together, these factors limit the scope of the study to analyze only a few factors exerting potential influence on NPP.

4.2. NPP Distribution and Influence Factor Response

Studies have documented the considerable restoration of vegetation since 1980 throughout China, and especially in northern China. Although spatially heterogeneous, restoration appears to have occurred relatively rapidly [39]. The present study detected obvious spatial heterogeneity at regional and local scales. Spatial heterogeneity arises largely due to human activities. The research area covers urban and developed areas such as the Dongsheng District and Kangbashi. In recent years, urban development and expansion have included the installation of more green space and urban landscaping. Relative to surrounding areas, results may underestimate NPP values due to lower original vegetation coverage values. Impacts associated with urban expansion and mining, including destruction of vegetation, can gradually diminish vegetation NPP for surrounding areas. Many researchers studying NPP changes have found that they jointly depend on human activity and climate. Climate data presently record the rapid rise in temperatures [40]. This can increase the release of soil organic matter and exert catalytic effects on the growth of vegetation [41]. Human activities such as returning farmland to forest or other ecological restoration efforts can increase vegetation coverage and productivity [42]. All of these factors can increase NPP. By contrast, climate change and human activity can also limit vegetation growth or coverage. Rapid warming and drying in the northwest, for example, likely intensifies drought, which limits the growth of vegetation in the region. The intensification of human activities in woodland, grassland, and other types of vegetated areas can also reduce productivity through reduced biodiversity or other impacts on the ecosystem.
As for the areas directly affected by coal mining and the natural growth areas involved in this study, the literature shows that by the end of 2019, the Shendong mining area had invested a total of 269 million yuan in ecological environment construction [43]. The vegetation NPP in the affected area increases year by year and gradually surpasses the natural restoration area. However, as shown in this study, from the perspective of vegetation NPP over the years, and under the premise of continued coal mining in the future, the vegetation ecological restoration in the area directly affected by coal mining will still be affected. Further strengthening is required.
In the area considered by this study, regional annual precipitation, temperature, and human activity have all increased simultaneously over the past 20 years. The data plotted in Figure 4, Figure 10 and Figure 13 show that in 2014 and 2018, NPP remained high during the respective peaks of human activity and precipitation. These years experienced moderate average temperature values. This suggests that climate change and human activity can strongly influence regional NPP and its spatial distribution. Air temperature appears to covary negatively with NPP, while other factors covary positively with it. Human activity exerts the strongest positive influence, indicating that increases in NPP reflect effective recent human environmental interventions, including restoration.
Accelerated urbanization of the Dongsheng District, the Kangbashi District, and the Ejin Horo Banner undeniably reflects intensified human activity, but the effects of this activity on NPP have gradually weakened. The Shendong mining area occurs in an ecologically fragile area. Large-scale mining and human activity have included perennial vegetation restoration and irrigation with recovered water. The local environment has been negatively impacted, but mitigation efforts have reduced some of the damage. Economic development and environmental plans suggest coordinated development of “underground factory and ground gardens” as research objectives [44]. Future research should further quantify and evaluate how to optimize vegetation NPP according to factors that can improve the environmental quality of the area.

5. Conclusions

Through the analysis of the annual vegetation NPP and its influencing factors in the Shendong mining area from 2000 to 2019, the following conclusions can be drawn.
(1)
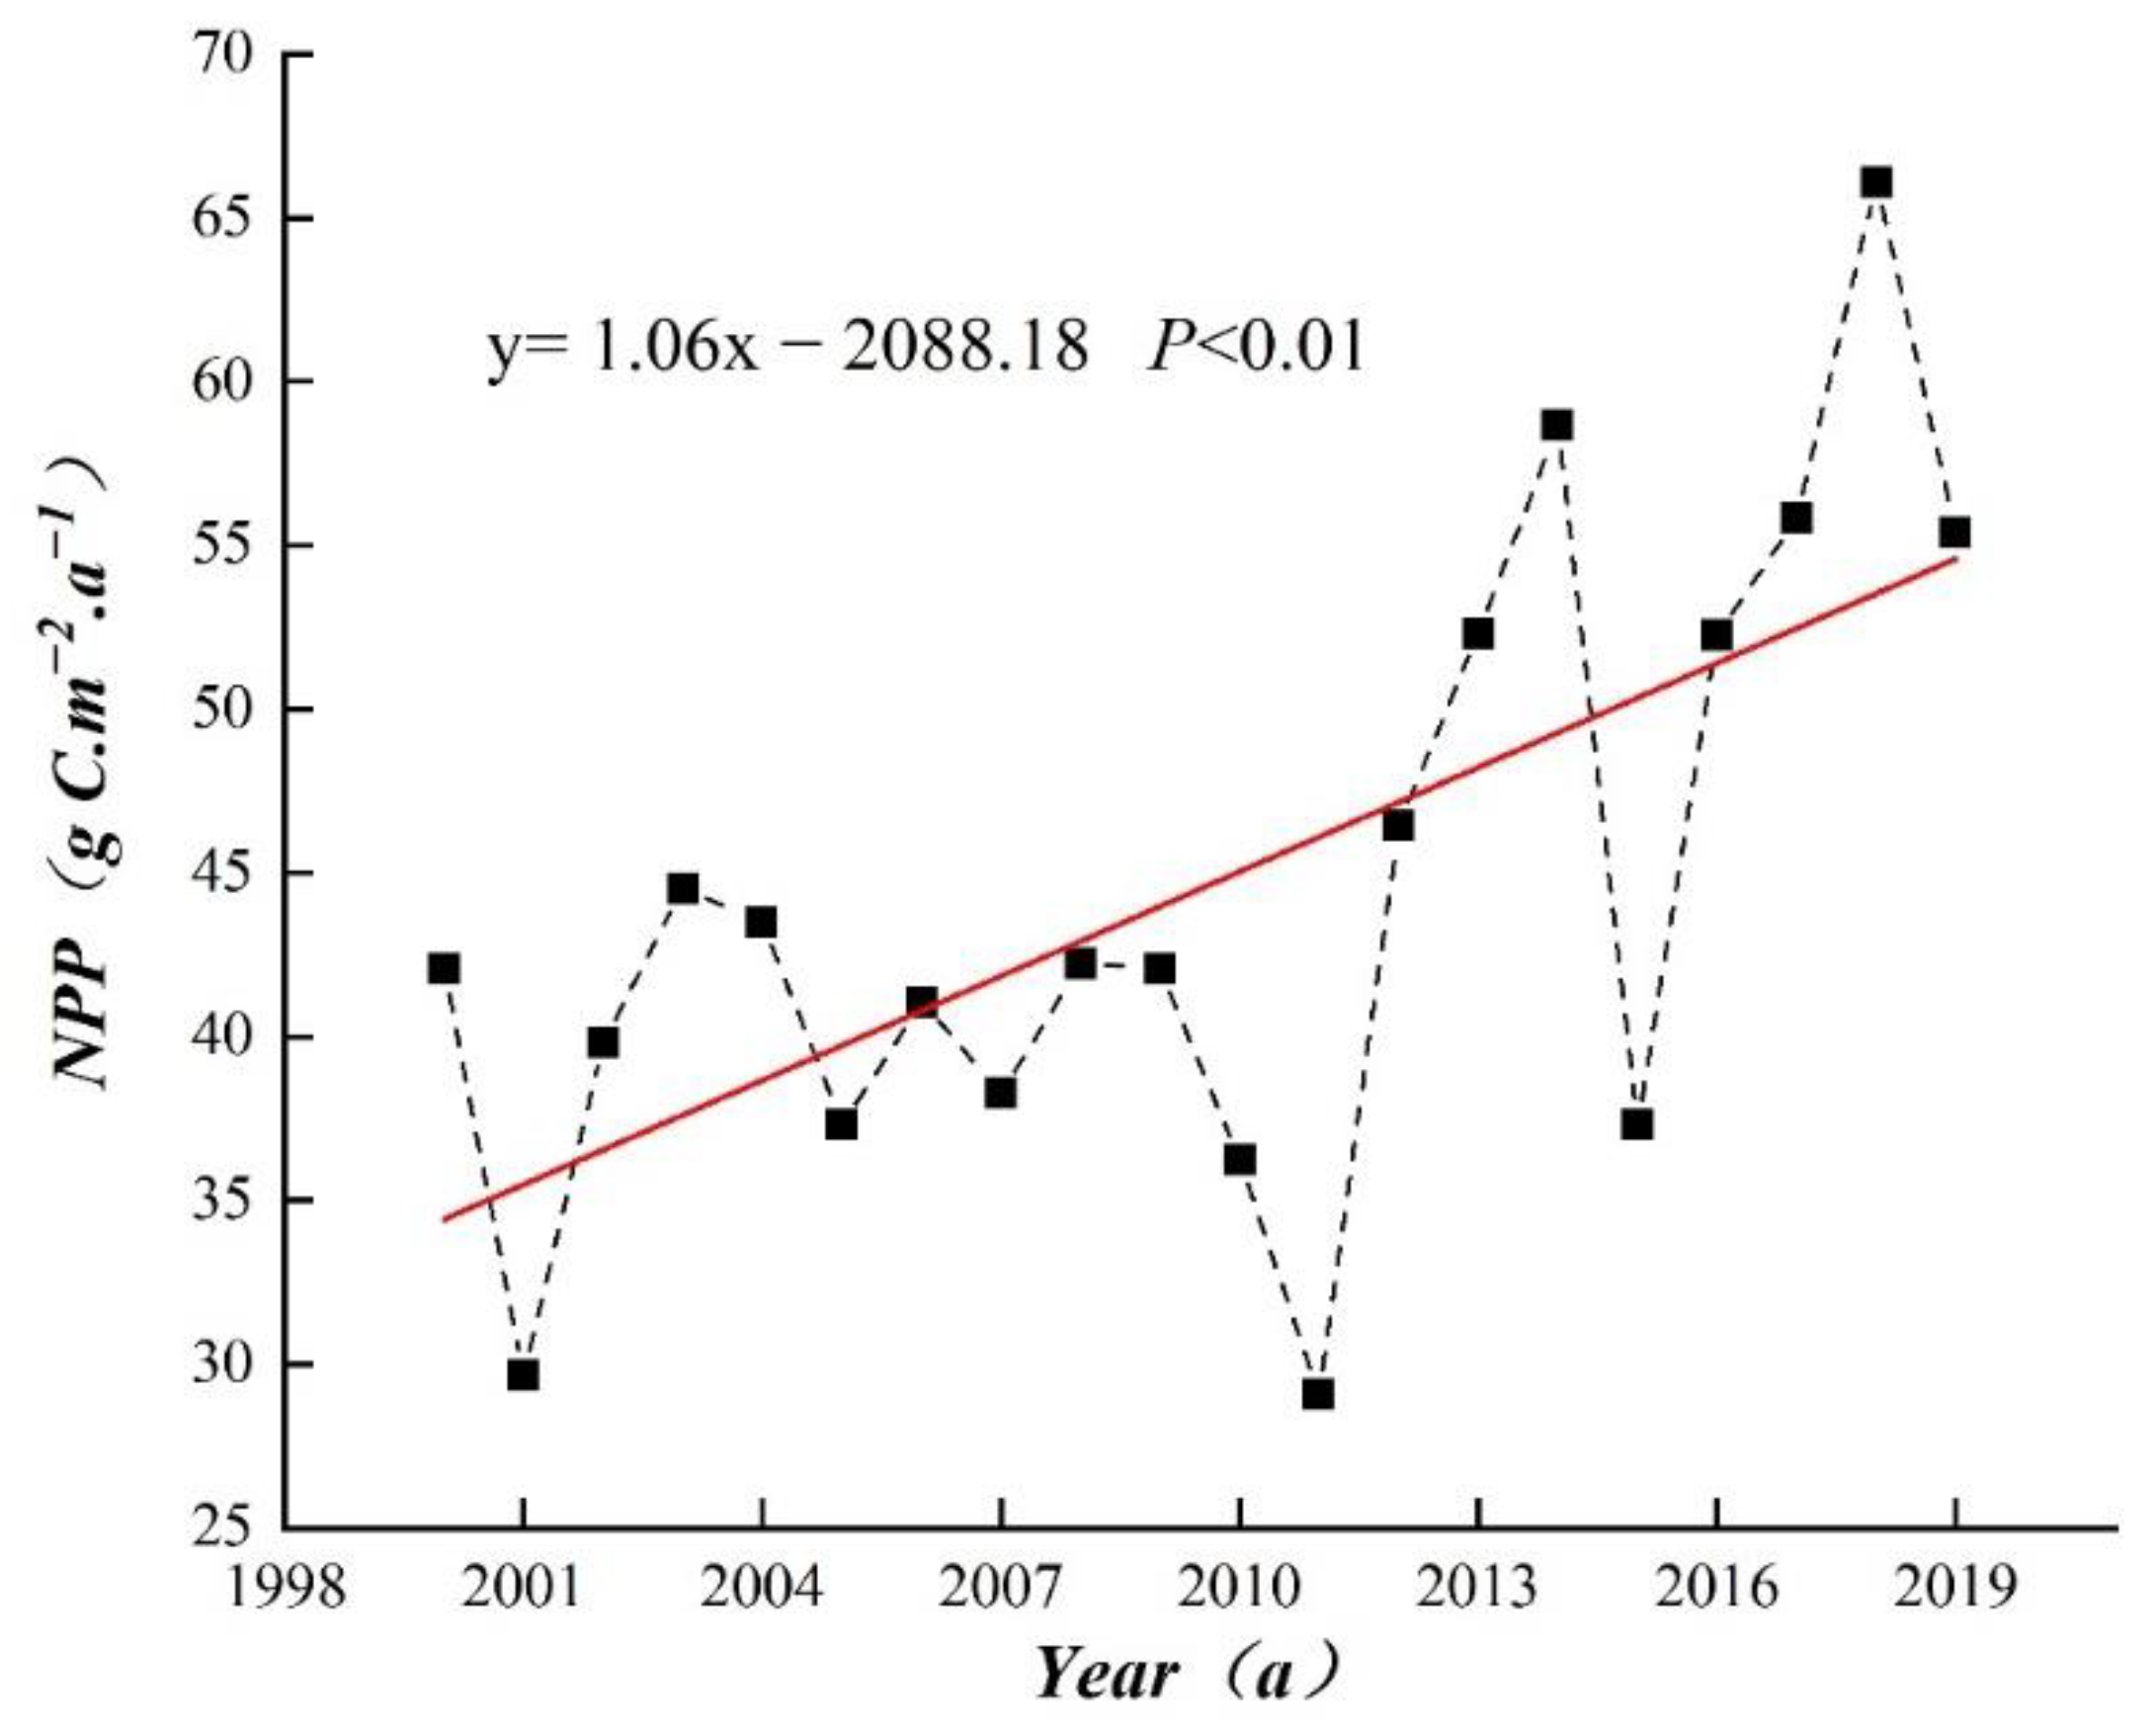
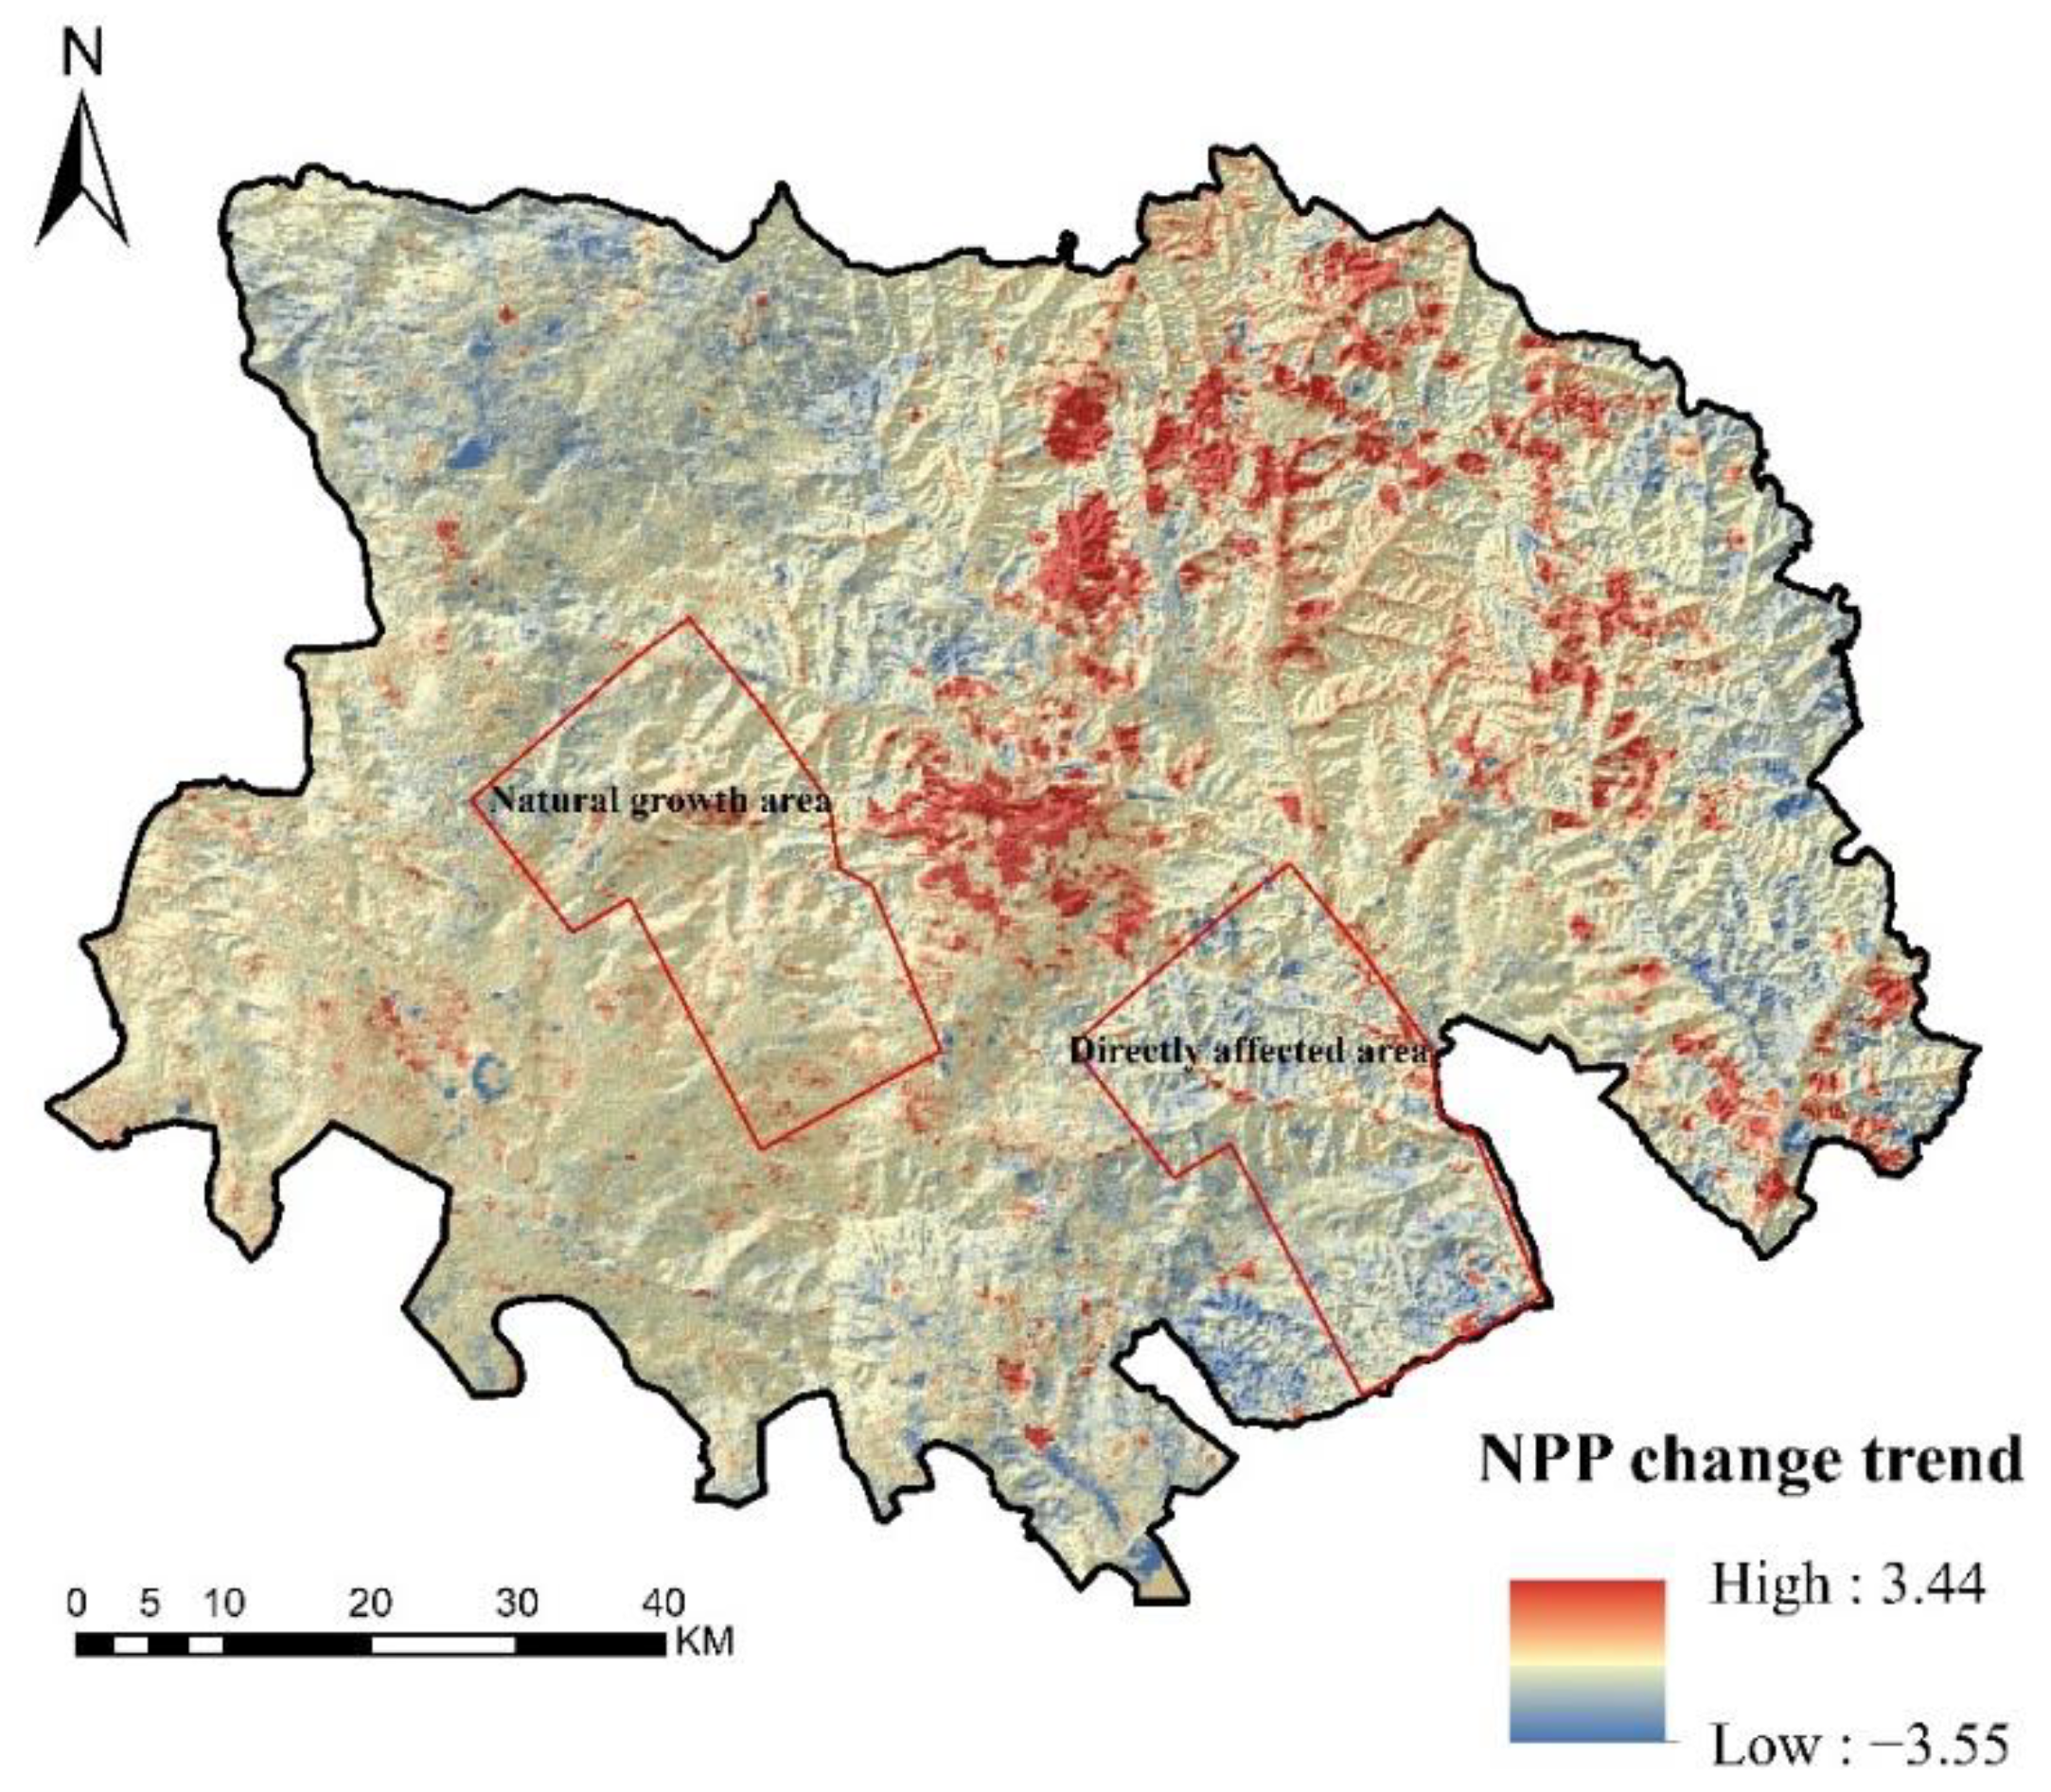
From 2000 to 2019, the overall condition of the net primary productivity of vegetation in the study area showed a fluctuating upward trend. The multi-year average was 44.51 g C/m−2 a−1, and the trend rate was 1.06/a. The multi-year average trough year appeared in 2011, while the peak year appeared in 2018. Spatially, there is an increasing distribution from north to south. The variation trend has a large spatial heterogeneity, with the area with an increasing trend of vegetation NPP accounting for 21.54%, mainly distributed in the Dongsheng District, the Kangbashi District and the bordering areas of the Yijinhuoluo Banner; other areas showed a decreasing trend, the area of which accounted for 78.46%.
(2)
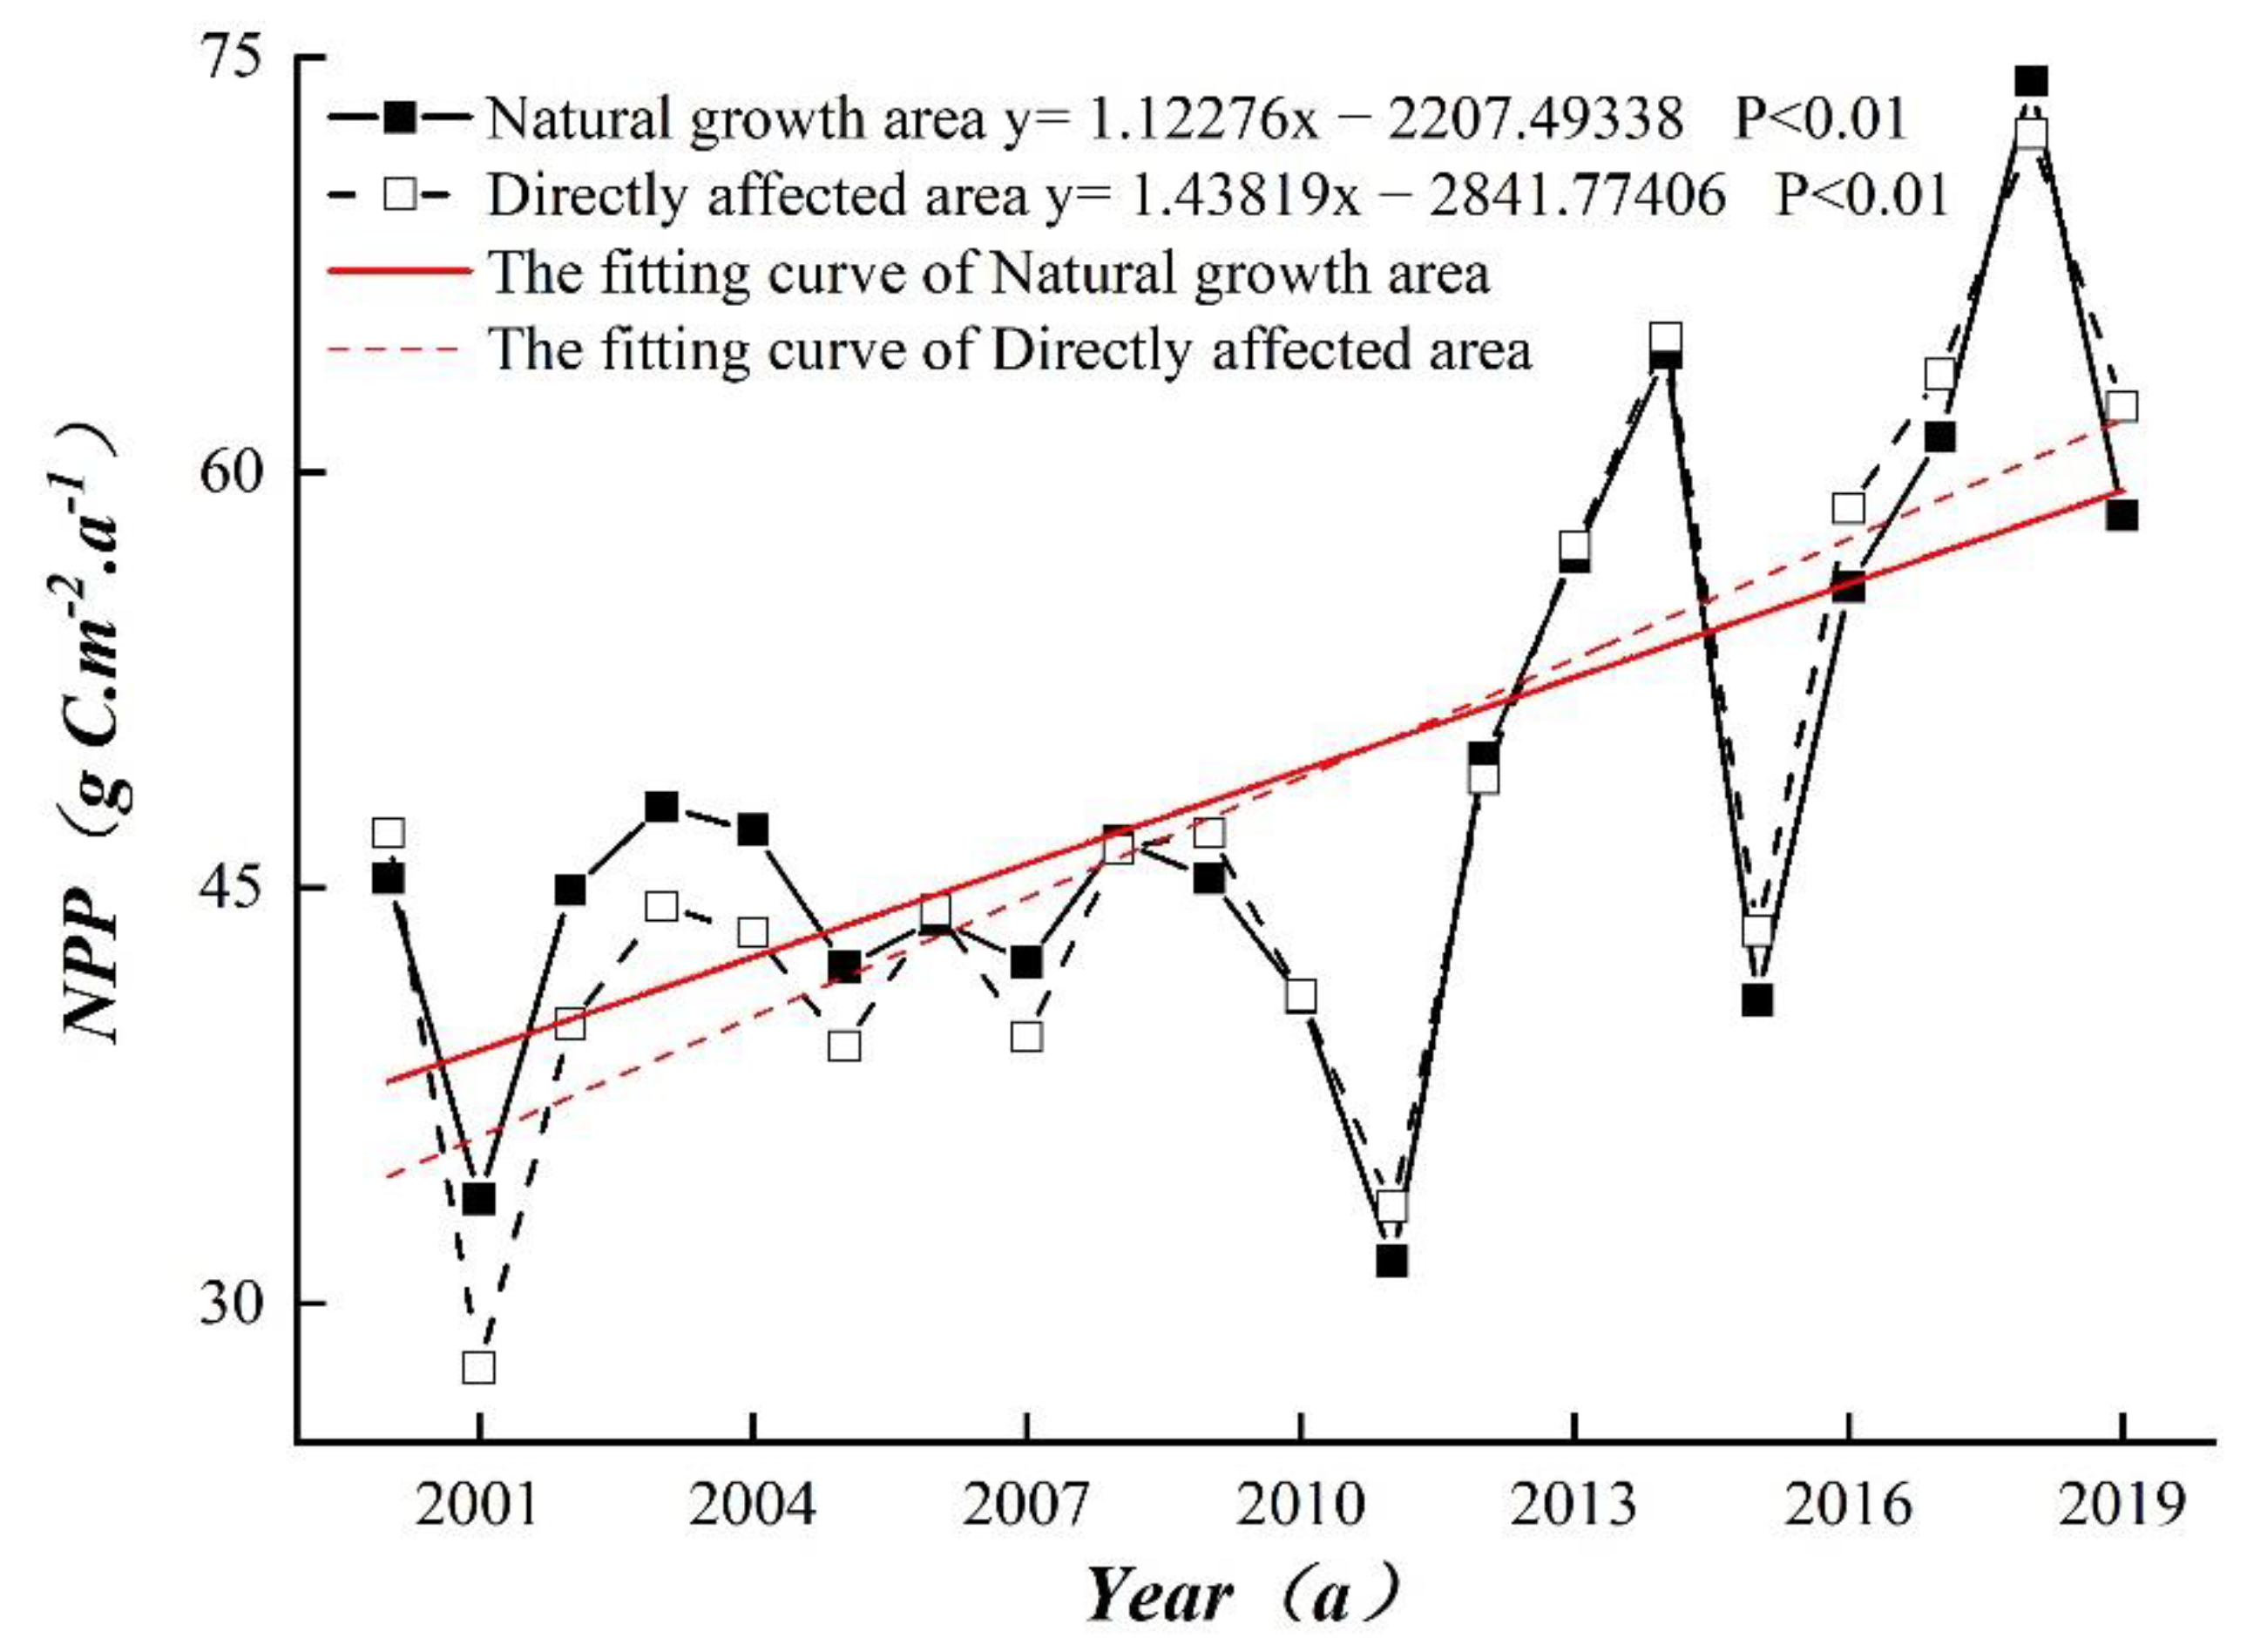
The change trend for vegetation NPP in the direct affected area and natural growth area over the years is basically consistent with the change in the overall vegetation NPP. Before 2009, the vegetation NPP in the area directly affected by coal mining was mostly smaller than that in the natural restoration area. After 2009, the vegetation NPP in the area directly affected by coal mining was mostly larger than that in the natural restoration area. This is related to the local mining situation and ecological restoration measures.
(3)
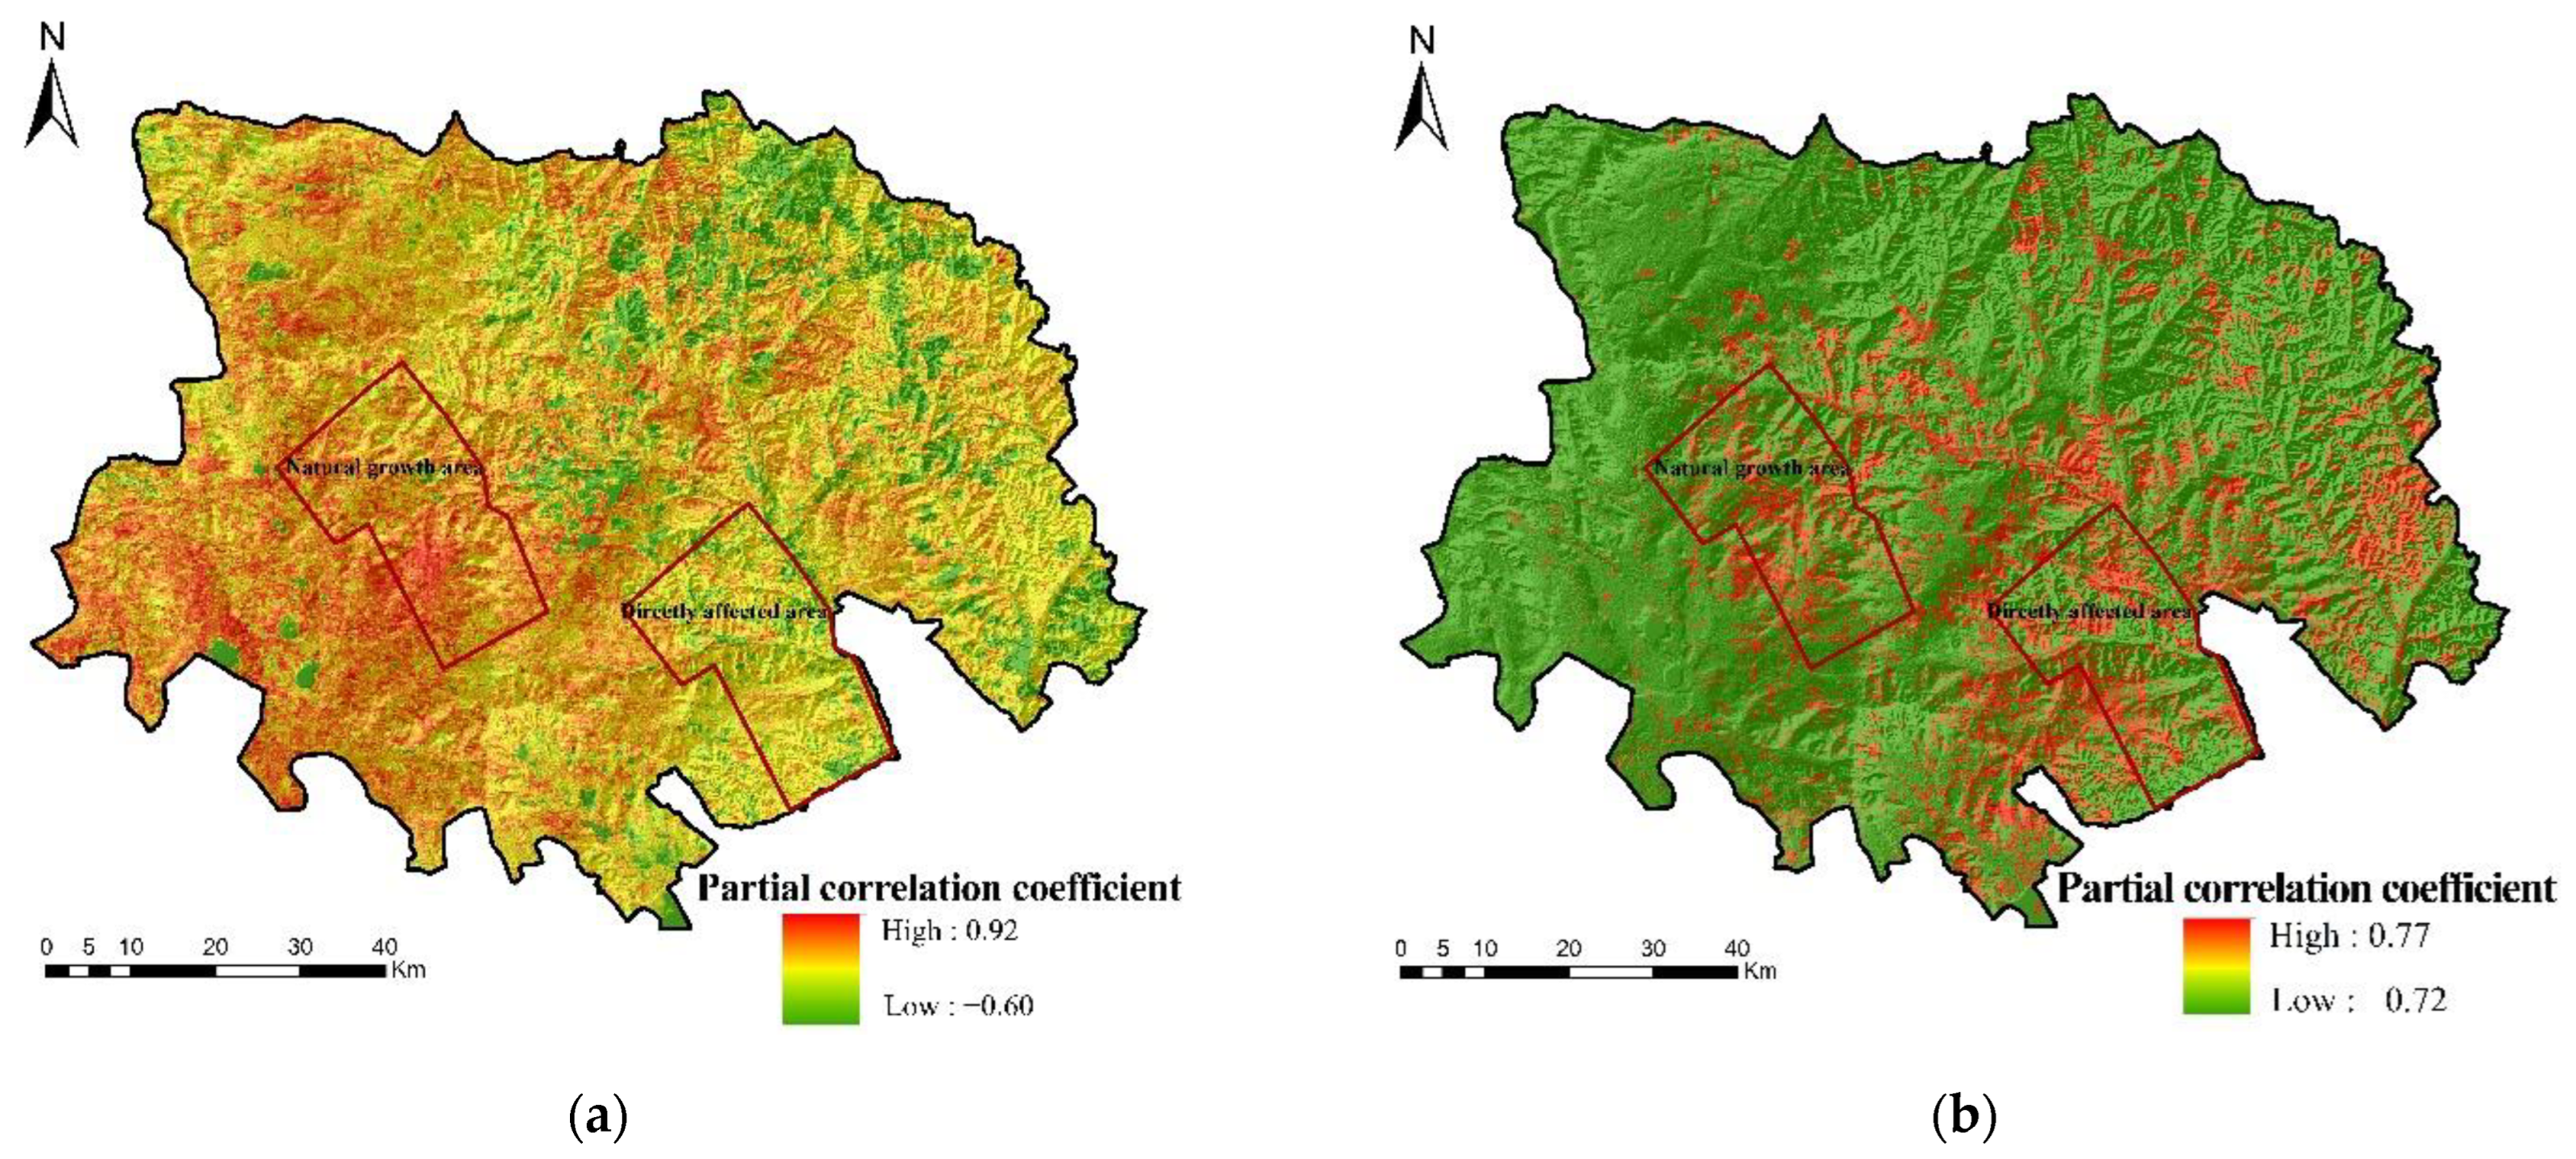
There are obvious spatial differences in the response relationship between NPP and each factor in the study area. The correlation between the two factors and vegetation NPP is both positive and negative as a whole. Among them, the precipitation is mainly positive, and the temperature is negative. The correlation between vegetation NPP and temperature in the study area was weaker than that of precipitation.
(4)
The overall influence of human activities on NPP in the study area showed an increasing trend, with a tendency rate of 0.53/a. There are differences in the performance of human activity intensity in different years during the study period. Since 2011, the impact of human activities on NPP in the study area has been relatively strong. The overall impact of human activities on the net primary productivity of vegetation in the study area showed a decreasing distribution trend toward the central and northeastern regions.
(5)
NPP changes in the study area are affected by both climate change and human activities. Human activities have a more significant contribution to the change in vegetation NPP than climate. The explanatory power of the influencing factors for the change in vegetation cover is ranked as follows: human activity > air temperature > precipitation.
In general, although the vegetation in the study area has been improved in the past 20 years, considering that the influence of regional climate conditions on vegetation growth is weak, it is necessary to strengthen the protection and restoration of the vegetation in the study area in order to ensure the stability of the ecological environment in the area in the future. It is suggested that the study area should improve its ecological construction in the future. Plants should be selected that can simultaneously tolerate stress from specific metals, drought, and low nutrient levels. At the same time, the mining environment management and supervision should be strengthened to ensure the stable improvement of vegetation ecological management in the Shendong mining area.

Author Contributions

Writing—original draft, J.K.; Writing—review & editing, D.Z., C.H., Y.Y., H.J. and B.L. All authors have read and agreed to the published version of the manuscript.

Funding

This research was funded by technology of site quality improvement in mining subsidence area (Inner Mongolia Autonomous Region key research and development project), grants number ZDZX2018058.

Institutional Review Board Statement

Not applicable.

Informed Consent Statement

Not applicable.

Data Availability Statement

Not applicable.

Conflicts of Interest

The authors declare no conflict of interest.

References

  1. Fang, Y.; Zhang, W.Y.; Cao, J.W.; Zhu, W.L. Analysis on the current situation and development trend of energy resources in china. Conserv. Util. Miner. Resour. 2018, 4, 34–42, 47. [Google Scholar] [CrossRef]
  2. Jiang, Z.M. Reflections on energy issues in china. J. Shanghai Jiaotong Univ. 2008, 3, 345–359. [Google Scholar] [CrossRef]
  3. Yao, G.Z. Effect of Coal Mining Subsidence on Ecological Environment and Recovery Technique. Doctoral Thesis, Beijing Forestry University, Beijing, China, 2012. [Google Scholar]
  4. Xiao, W.; Zhang, W.K. Spatio-temporal patterns of ecological capital under different mining intensities in an ecologically fragile mining area in Western China:A case study of Shenfu mining area. J. Nat. Resour. 2019, 35, 68–81. [Google Scholar] [CrossRef]
  5. Wang, F.; Song, Y.X.; Wang, W.G. The Empirical Study on Regional Economic Disparities and Evolution in Inner Mongolia. Econ. Geogr. 2012, 32, 1–7. [Google Scholar] [CrossRef]
  6. Li, C.Y.; Cui, X.M.; Guo, Z.Z.; Yuan, D.B.; Hu, Q.F. Distribution of mining fissures induced fully mechanized caving mining and analysis on their evolvement characteristics. Min. Saf. Environ. Prot. 2009, 36, 65–68+91. [Google Scholar] [CrossRef]
  7. Li, W.; Chen, L.Q.; Zhou, T.J.; Zhang, K.; Li, L. Research progress of soil quality in china mining subsidence area. Coal Sci. Technol. 2011, 39, 125–128. [Google Scholar]
  8. Ge, W.; Deng, L.; Wang, F.; Han, J. Quantifying the contributions of human activities and climate change to vegetation net primary productivity dynamics in China from 2001 to 2016. Sci. Total Environ. 2021, 773, 145648. [Google Scholar] [CrossRef]
  9. Fan, Y.J.; Hou, X.Y.; Shi, H.X.; Shi, S.L. Efffect of carbon cycling in grassland ecosystems on climate warming. Acta Prataculturae Sin. 2012, 3, 294–302. [Google Scholar] [CrossRef]
  10. Zhu, W.Q.; Chen, Y.H.; Xu, D.; Li, J. Advances in terrestrial net primary productivity estimation models. Chin. J. Ecol. 2005, 3, 296–300. [Google Scholar] [CrossRef]
  11. Zhou, G.S.; Zhang, X.S. Model of net primary productivity of natural vegetation. Chin. J. Plant Ecol. 1995, 19, 193–200. [Google Scholar]
  12. Field, C.B.; Randerson, J.T.; Malmström, C.M. Global net primary production: Combining ecology and remote sensing. Remote Sens. Environ. 1995, 51, 74–88. [Google Scholar] [CrossRef]
  13. Wang, Z.M.; Liang, Y.L. Progress in Vegetation Net Primary Productivity Model Research. J. Northwest For. Univ. 2002, 17, 22–25. [Google Scholar] [CrossRef]
  14. Li, C.H.; Zhu, T.B.; Zhou, M.; Yin, H.H.; Wang, Y.T.; Sun, H.; Cao, H.J.; Han, H.Y. Temporal and spatial change of net primary productivity of vegetation and its determinants in hexi corridor. Acta Ecol. Sin. 2021, 5, 1–13. [Google Scholar] [CrossRef]
  15. Fyllas, N.M.; Bentley, L.P.; Shenkin, A.; Asner, G.P.; Atkin, O.K.; Diaz, S. Solar radiation and functional traits explain the decline of forest primary productivity along a tropical elevation gradient. Ecol. Lett. 2017, 20, 730–740. [Google Scholar] [CrossRef] [PubMed]
  16. Potter, C.S.; Randerson, J.T.; Field, C.B.; Matson, P.A.; Vitousek, P.M.; Mooney, H.A. Terrestrial ecosystem production: A process model based on global satellite and surface data. Glob. Biogeochem. Cycles 1993, 7, 811–841. [Google Scholar] [CrossRef]
  17. Zhang, R.P.; Guo, J.; Zhang, Y.L. Spatial distribution pattern of NPP of Xinjiang grassland and its response to climatic changes. Acta Ecol. Sin. 2020, 40, 5318–5326. [Google Scholar] [CrossRef]
  18. Hao, C.Y.; Yang, Z.R. Net primary production and its spatial-temporal in Lu’an mining area based on MODIS data. J. China Coal Soc. 2011, 36, 1840–1844. [Google Scholar]
  19. Sun, Y.L.; Qian, S.; Yan, H.; Xu, L.L.; Wang, Y.; Cao, Y. Spatial-temporal dynamics of vegetation ecosystem in typical coal mining area of Yunnan province during 2000–2018: A Case Study in Lincang. Ecol. Environ. Sci. 2019, 28, 2381–2389. [Google Scholar]
  20. Kishore, K.S.; Ranjan, S.S.; Kumar, M.S. Assessment of the capability of remote sensing and GIS techniques for monitoring reclamation success in coal mine degraded lands. J. Environ. Manag. 2016, 182, 272–283. [Google Scholar] [CrossRef]
  21. Wang, X.; Ding, J.W.; Tan, K.; Li, H.D. Spatio-Temporal variation of net primary productivity of vegetation in mining areas of Yuxian and its affecting factors. J. Ecol. Rural Environ. 2016, 32, 187–194. [Google Scholar] [CrossRef]
  22. Kang, S.R.L.; Niu, J.M.; Zhang, Q.; Han, Y.J.; Dong, J.J.; Zhang, J. Impacts of mining on landscape pattern and primary productivity in the grassland of Inner Mongolia: A case study of Heidaigou open pit coal mining. Acta Ecol. Sin. 2014, 11, 2855–2867. [Google Scholar] [CrossRef]
  23. Shao, T.Y.; Bao, S.Q.; He, S. Spatial and temporal evolution characteristics of surface water in Shendong Mining Area based on TVDI. J. Northwest A F Univ. (Nat. Sci. Ed.) 2022, 1–12. [Google Scholar] [CrossRef]
  24. Zhao, M.S.; Heinsch, F.A.; Nemani, R.R.; Running, S.W. Improvements of the MODIS terrestrial gross and net primary production global data set. Remote Sens. Environ. 2005, 95, 164–176. [Google Scholar] [CrossRef]
  25. Han, B.H.; Zhou, B.R.; Yan, Y.Q. Analysis of Vegetation Coverage Change and Its Driving Factors over Tibetan Plateau From 2000 to 2008. Acta Agrestia Sin. 2019, 27, 1651–1658. [Google Scholar] [CrossRef]
  26. Fan, W.Y.; Zhang, H.Y. Comparison of three models of forest biomass estimation. Chin. J. Plant Ecol. 2011, 35, 402–410. [Google Scholar] [CrossRef]
  27. Guang, X.; Bao, Z.C. Generating a series of land covers by assimilating the existing land cover maps. ISPRS J. Photogramm. Remote Sens. 2019, 147, 206–214. [Google Scholar] [CrossRef]
  28. Zhu, W.Q.; Pan, Y.Z.; Zhang, J.S. Estimation Of net primary productivity of chinese terrestrial vegetation based on remote sensing. Chin. J. Plant Ecol. 2007, 03, 413–424. [Google Scholar] [CrossRef]
  29. Zhang, Z.Q.; Liu, H.; Zuo, Q.T.; Yu, J.T.; Li, Y. Spatiotemporal change of fractional vegetation cover in the Yellow River Basin during 2000–2019. Resour. Sci. 2021, 4, 849–858. [Google Scholar] [CrossRef]
  30. Mike, H.; Elaine, M.B.; Nigel, W.A.; Paula, A.H.; Timothy, C.J.; Thomas, E.D. Relative impacts of human-induced climate change and natural climate variability. Nat. Int. Wkly. J. Sci. 1999, 397, 688–691. [Google Scholar] [CrossRef]
  31. Hao, W.; Liu, G.H.; Li, Z.S.; Xin, Y.E.; Fu, B.J.; Lv, Y.H. Impacts of Drought and Human Activity on Vegetation Growth in the Grain for Green Program Region, China. Chin. Geogr. Sci. 2018, 28, 470–481. [Google Scholar] [CrossRef]
  32. Deng, C.H.; Bai, H.Y.; Gao, S.; Liu, R.J.; Ma, X.P.; Huang, X.Y. Spatial-temporal variation of the vegetation coverage in qinling mountains and its dual response to climate change and human activities. J. Nat. Resour. 2018, 03, 425–438. [Google Scholar] [CrossRef]
  33. Wang, H.W.; Zhang, Q. Identification of optimal subspace from PLS regression. J. Beijing Univ. Aeronaut. Astronaut. 2000, 26, 473–476. [Google Scholar] [CrossRef]
  34. Perez-Enciso, M.; Tenenhaus, M. Prediction of clinical outcome with microarray data: A partial least squares discriminant analysis (PLS-DA) approach. Hum. Genet. 2003, 112, 581–592. [Google Scholar] [CrossRef]
  35. Hou, M.T.; Hu, W.; Qiao, H.L.; Li, W.G.; Yan, X.D. Application of partial least squares (PLS) regression method in attribution of vegetation change in eastern china. J. Nat. Resour. 2015, 3, 409–422. [Google Scholar] [CrossRef]
  36. Mu, S.J.; Li, J.L.; Zhou, W.; Yang, H.F.; Zhang, C.B.; Ju, W.M. Spatial-temporal distribution of net primary productivity and its relationship with climate factors in Inner Mongolia from 2001 to 2010. Acta Ecol. Sin. 2013, 12, 3752–3764. [Google Scholar] [CrossRef]
  37. Zhu, W.Q.; Pan, Y.Z.; Long, Z.H.; Chen, Y.H.; Li, J.; Hu, H.B. Estimating net primary productivity of terrestrial vegetation based on GIS and RS: A case study in inner Mongolia, China. J. Remote Sens. 2005, 3, 300–307. [Google Scholar] [CrossRef]
  38. Xie, S.S.; Ma, C.; Tian, S.J.; Tian, J.G. NPP Changes and climate impact of Shendong coalfield from 2000 to 2010. J. Geomat. Sci. Technol. 2015, 1, 47–51. [Google Scholar] [CrossRef]
  39. Jin, K.; Wang, F.; Han, J.Q.; Shi, S.Y.; Ding, W.B. Contribution of climatic change and human activities to vegetation NDVI change over china during 1982-2015. Acta Geogr. Sin. 2020, 5, 961–974. [Google Scholar]
  40. Jin, K.; Wang, F.; Yu, Q.; Gou, J.; Liu, H. Varied degrees of urbanization effects on observed surface air temperature trends in China. Clim. Res. 2018, 76, 131–143. [Google Scholar] [CrossRef]
  41. Li, J.; Liu, H.B.; Li, C.Y.; Li, L. Changes of green-up day of vegetation growing season based on GIMMS 3g NDVI in northern china in recent 30 years. Sci. Geogr. Sin. 2017, 4, 620–629. [Google Scholar] [CrossRef]
  42. Xin, Z.; Xu, J.; Zheng, W. Spatiotemporal variations of vegetation cover on the chinese loess plateau (1981–2006): Impacts of climate changes and human activities. Sci. China Ser. D-Earth Sci. 2008, 51, 67–78. [Google Scholar] [CrossRef]
  43. Yang, X.K. Coal enterprises are green. Economic Daily, 11 December 2021; p. 6. [Google Scholar] [CrossRef]
  44. Wang, A. Construction and benefits of integrated measures system for environment conservation in Shengdong diggings. Sci. Soil Water Conserv. 2007, 5, 83–87. [Google Scholar] [CrossRef]
Figure 1. Overview of the study area.
Sustainability 14 10883 g001
Figure 2. Comparison between simulated and observed NPP.
Sustainability 14 10883 g002
Figure 3. Comparison between simulated and Modis NPP.
Sustainability 14 10883 g003
Figure 4. Interannual variation in NPP for study area from 2000–2019.
Sustainability 14 10883 g004
Figure 5. Spatial distribution of 20 year average NPP in study area.
Sustainability 14 10883 g005
Figure 6. Trends in NPP changes for the study area from 2000 to 2019.
Sustainability 14 10883 g006
Figure 7. Significant of interannual variation in NPP in the study area from 2000 to 2019.
Sustainability 14 10883 g007
Figure 8. Change trend comparison of the NPP between the directly affected area and the natural growth area.
Sustainability 14 10883 g008
Figure 9. Partial correlation coefficients for annual average temperature and annual precipitation with NPP from 2000 to 2019. (a). precipitation; (b). temperature.
Sustainability 14 10883 g009
Figure 10. Interannual variation in NPP residuals for the study area from 2000–2019.
Sustainability 14 10883 g010
Figure 11. Spatial distribution of human activities in the study area from 2000–2019.
Sustainability 14 10883 g011
Figure 12. PLS analysis of the influence of climate change and human activity on NPP in the study area. (a). the ability of impact factors to explain changes in NPP; (b). the regression coefficient of the impact factor; (c). correlation between temperature, precipitation and human activities.
Sustainability 14 10883 g012
Figure 13. Variation trends, linear trend, and 5-year moving average of precipitation and average temperature in the study area from 2000 to 2019.
Sustainability 14 10883 g013
Publisher’s Note: MDPI stays neutral with regard to jurisdictional claims in published maps and institutional affiliations.

