Article

The Spatial Network Structure of Tourism Efficiency and Its Influencing Factors in China: A Social Network Analysis

1
School of Management, Chongqing University of Technology, Chongqing 400054, China
2
Rural Revitalization and Regional High-Quality Development Research Center, Chongqing University of Technology, Chongqing 400054, China
*
Author to whom correspondence should be addressed.
Sustainability 2022, 14(16), 9921; https://doi.org/10.3390/su14169921
Submission received: 7 July 2022 / Revised: 31 July 2022 / Accepted: 8 August 2022 / Published: 11 August 2022

Abstract

:
Although tourism has gradually become a popular form of leisure and entertainment in China, the quality of China’s tourism development remains unclear. Through the panel data of 30 provinces in China, an SBM-DEA model and a social network analysis are used to explore the quality of tourism development, and a spatial econometric regression is used to identify the relevant factors affecting tourism efficiency. The study found that the level of tourism efficiency in Southwest China is high and stable. The northwest region has a low level of tourism efficiency, but a slow growth trend. The rest of the regions show fluctuating trends of tourism efficiencies. The spatial correlation network of provincial tourism efficiency is gradually complicated. Regarding influencing factors, the number of patents granted, traffic levels, financial development, and government macro-control all have positive effects on tourism efficiency. The study uncovered some useful management insights and implications for the travel industry.

1. Introduction

With economic development, tourism has gradually become important for people’s leisure and entertainment. The modern tourism industry has broken through the scope of traditional tourism, gradually penetrating into different sectors and industries. At present, the tourism industry has combined with regional development and played a significant role in promoting regional economic growth. In the national economy, tourism is an important industry with the ability to promote employment, popularize people’s livelihoods, and promote economic development and upgrades [1]. China now has the second largest tourism economy [2] and tourism accounted for 9% of China’s gross domestic product (GDP) in 2016 (World Travel and Tourism Council (WTTC), 2017). Increasing the share of tourism in China’s industrial structure can effectively promote healthy economic development. As a “smoke-free industry”, tourism has low resource consumption and high economic benefits, and can contribute to the construction of regional ecological civilization [3]. The development of tourism promotes infrastructure construction and environmental improvement, and brings about the improvement of the cultural literacy of urban residents. Tourism can meet the growing cultural needs of the people, and plays a critical role in promoting national culture and improving the quality of national civilization. The development of tourism is very important, and the quality of tourism development has gradually received the attention of many scholars. Tourism efficiency can be used to measure the quality of tourism development; the higher the tourism efficiency, the better the quality of tourism development. Nowadays, the economy is turning to the stage of high-quality development, and the role of tourism development in economic development is more prominent. How tourism efficiency is distributed among regions and how it is coordinated in a spatial perspective are of great practical significance for tourism development in different regions. The social network analysis method is used to explore the linkage of tourism efficiencies among Chinese provinces and to analyze the spatial association network of tourism efficiency evaluation and its characteristics. The study clarifies regional tourism development differences, so as to optimize tourism resources and products, improve the tourism industry’s structure, and promote tourism development.
The concept of “efficiency” was first introduced by British economist Farrell [4], and it has been widely used in a number of disciplines, including economics and management. In early studies of tourism, scholars mainly focused on the operational and management efficiency of hotels. Arbelo-Pérez, et al. [5] explored the impact of quality on hotel efficiency and found that quality has a negative impact on cost efficiency, a positive impact on profit efficiency, and that hotels should improve the value of their services to achieve sustainability. Maha, et al. [6] analyzed hotel efficiency in Romania from a customer perspective and found significant differences in inefficiencies between hotels in different regions and with different star ratings. The visibility of hotels on social platforms and travel planning websites was an important factor affecting hotel efficiency. Karakitsiou, et al. [7] used a data envelopment analysis model to analyze the tourism efficiencies and competitiveness of the hotel and restaurant industries in 13 regions of Greece and classified regional efficiency levels. Zhang, et al. [8] conducted an analysis and studied the impact of tourism specialization and market competition in the Chinese hospitality industry. They found that tourism development, represented by a high degree of tourism specialization, did not guarantee a hotel’s high efficiency but instead enhanced the negative impact of market competition regarding the efficiency of the hospitality industry.
The studies gradually extended from hotel efficiency to travel agency efficiency, tourism transportation efficiency, tourism poverty alleviation efficiency, and tourism eco-efficiency. Köksal and Aksu [9] used data envelopment analysis to assess the operational efficiency of 24 travel agencies in Turkey, divided them into two categories (independent operations and chain operations), and studied them separately. The results showed no difference in the operational efficiencies between travel agencies with different business models. Fuentes [10] analyzed the relative efficiency of 22 travel agencies with similar characteristics located in Alicante (Spain) and found that travel agencies located close to the city center were effective in increasing their efficiency levels despite higher initial costs. Li, et al. [11] conducted a study on forest tourism eco-efficiency in Liaoning Province, China, from 2008 to 2017. The eco-efficiency of forest tourism was measured for the period from 2008 to 2017, and the spatial and temporal evolution characteristics were explored.
Currently, tourism development efficiency has mostly focused on regional tourism efficiency, regional differences, and influencing factors. A DEA, as a classical method for evaluating efficiency, is convenient and the obtained results are accurate when dealing with multiple-input and multiple-output problems, so it is widely used in the measurement of tourism efficiency. Choo, et al. [12] used a DEA to measure the efficiency of small tourism farms in Korea and found that most of those farms are inefficient; this mainly stems from their management skills and technical efficiency. Yuan and Liu [13] summarized the evolutionary characteristics of regional tourism efficiency by measuring tourism livelihood efficiency in coastal areas using a DEA model and classified cities according to their tourism livelihood efficiency. Li, et al. [14] used a traditional DEA model to measure tourism efficiency and spatial characteristics of six coastal city clusters in eastern China and explored evolutionary and distributional characteristics of tourism efficiency.
For the study of tourism efficiency, numerous scholars have focused on the spatial distribution and influencing factors of tourism efficiency. Some studies calculated tourism efficiency within a study area and analyzed its spatial distribution characteristics [15]. Some studies analyzed the relationship between tourism efficiency and transportation accessibility, service industry concentration, and the ecological environment [16,17]. Choi, et al. [18] explored festival tourism efficiency and its influencing factors in Korea using parametric and non-parametric methods. They found that the main cause of tourism inefficiency is purely technical inefficiency. Wang et al. [19] used a DEA and an SNA to explore the characteristics of the spatial network structure of provincial tourism efficiency in China. They found that overall tourism efficiency in China has declined, as has the network density. Niavis and Tsiotas [20] used a DEA to assess the comparative performance of Mediterranean coastal destinations, innovatively considering both efficiency and effectiveness dimensions, and thus reducing the errors that may result from assessing destinations with a single performance dimension. Cvetkoska and Barišić [21] used a DEA to measure tourism efficiency in the Balkans at a macro level and found that the most efficient country in terms of tourism during the study period was Albania.
In addition, with the application of social network analysis methods, more and more scholars are applying social network analyses to tourism. Casanueva et al. [22] studied the application of social network analyses in tourism. Kang et al. [23] used social network analysis techniques to analyze the spatial structure of tourist attractions in Korea. Liu et al. [24] focused on the application of a social network analysis on tourist attractions. Chu et al. [25] studied the movement trajectories of multi-destination tourists using a social network analysis. Leung et al. [26] studied the social network analysis of the flow patterns of tourists from outside Beijing under the influence of the Olympic Games. Gan et al. [27] analyzed the characteristics related to the spatial network structure of the tourism economy. Tan et al. [28] used a social network analysis to elaborate the spatial association network and its characteristics for tourism competitiveness evaluation. As can be seen, there is an increasing number of network analyses in the tourism literature, mainly involving tourism destinations, based on behavioral patterns related to tourist flows. In this paper, based on previous studies, a social network analysis based on tourism efficiency evaluations is conducted to explore the characteristics of the spatial network structure.
The existing studies on tourism efficiency have mostly targeted efficiency measurement and evaluation, but research on the evolutionary spatial patterns of tourism efficiency is becoming increasingly abundant. However, when exploring the spatial pattern of tourism efficiency, most studies adopted geospatial analysis techniques and explored the spatial characteristics of tourism efficiency based on “attribute” data rather than “relationship” data. This paper starts from “relational” data (based on the DEA of tourism efficiency), explores the spatial association strength of tourism efficiency in Chinese provinces through SNA, and clarifies the positions of different provinces in the network structure. This paper uses a DEA to measure tourism efficiency and analyze the social network structure of 30 provinces in mainland China (excluding Tibet, Hong Kong, Macao, and Taiwan). Based on the measurement results, we further explore the spatial and temporal deduction patterns of tourism efficiency in 30 provinces and cities in mainland China from 2008 to 2018, and identify the factors affecting tourism efficiency.

2. Data and Methods

2.1. Indicator Selection and Data Sources

Tourism efficiency is a measure that reflects the strengths and weaknesses of tourism industry development. The key to measuring tourism efficiency lies in the measurement and selection of input–output system indicators. Since the level of tourism development varies from region to region and there are differences in development statuses, currently there is no unified regulation to constrain the selection of tourism efficiency measurement indicators. Therefore, in this paper, based on data availability in each province, we select input and output indicators that are scientifically sound and representative and can reflect the tourism status, resource utilization, and development level of each province to a great extent. Then, we embed the actual data into the DEA efficiency measurement model to calculate tourism efficiency. Land, labor, and capital are usually defined as the most basic inputs for economic production activities [29]. Due to the lack of data on land use used for tourism, the land element is less often included in relevant studies [14]. Therefore, in this paper, only capital and labor are considered as input indicators. Travel agencies, star hotels, and scenic spots are the key sectors of tourism economic development. These sectors can reflect the services and resources related to tourism economic development [20]. Therefore the number of travel agencies, star-rated hotels, and A-rated scenic spots are defined as capital inputs. The output of tourism industry is mainly reflected in tourist arrivals and tourist inputs [8]. The data for output indicators in this paper are all domestic and foreign sums. In summary, this paper defines input–output indicators according to Hu, Wang, Xie, and Zhang’s study [8,19,30,31]. As shown in Table 1.
In the spatial econometric regression model, several indicators are used to explore the factors that are influential to tourism efficiency, such as the number of patents granted (PAT), the level of urbanization (URB), the level of transportation (TRA), the scale of financial development (FIR), the government macro-control (GMR), the fixed asset investment (INV), and the energy consumption (ENE). Among them, the traffic level is used as a proxy of tourist turnover. The scale of financial development is expressed by the sum of year-end loan balances. In addition, the government macro-regulation is expressed by the ratio of total tourism revenue to regional GDP. The data are mainly obtained from the Local Statistical Yearbook and the China’s Statistical Yearbook from 2008–2018, and some missing data are estimated using the average growth rate of the adjacent three years.

2.2. SBM-DEA Model

DEA is a method widely used in studies related to multi-objective decision problems. Since Charnes et al. [32] proposed DEA in 1978, DEA models have been widely used and gradually improved. To solve the problem of the slackness of inputs and outputs, Tone proposed a non-radial, non-angle-based SBM model with slack variables. The model deals with slack variables by incorporating the slack variables of each input and output directly into the objective function. The DEA model is able to evaluate the relative effectiveness among multiple inputs. In fact, the concept of efficiency or relative effectiveness also refers to the ratio of output to input. Most traditional models of DEA represented by CCR and BCC models are based on radial and angular measures, which fail to fully consider the input–output slackness problem and lead to bias in efficiency measurements [33]. The SBM model belongs to non-radial and non-angular measures, which can avoid the bias caused by the difference of radial and angular choices and better reflect the essence of tourism efficiency evaluation. The equation is as follows [33,34,35,36,37]:
ρ = m i n ( 1 1 m k = 1 m s b k x b k o ) / ( 1 + 1 n r = 1 n s g r y g r o )
s . t . { x b o = X b λ + s b y g o = Y g λ s g s b 0 s g 0 λ l 0 l = 1 , 2 , K
where ρ is the efficiency value, and m and n are the numbers of input and output indicators, respectively. s b and s g are the slacks of input and output indicators, respectively. s b k and s g r are the slacks of the kth input indicator and the rth output indicator, respectively. x b o and y g o are the input and output values of the evaluated unit o, respectively. x b k o and y g r o are the kth input and rth output values of the evaluated unit o, respectively. λ = ( λ 1 , λ 2 , , λ k ) is the intensity vector.

2.3. Modified Gravity Model

The Chinese provincial tourism efficiency spatial association network is a collection of inter-provincial tourism efficiency relationships. Each province is a node in the network. If there is a relationship between two provinces, then a straight line is drawn between them, and finally a spatial correlation network diagram of tourism efficiency of each province in China is constructed. The gravity model can describe the correlations. Economists believe that the economic link between regions is similar to the law of gravity, so the modified gravitational model is widely used in the analysis of regional spatial interconnections. In this paper, we investigate the link of tourism efficiency between provinces and cities, and use the modified gravitational model to establish the correlation matrix of tourism efficiency among Chinese provinces and cities. The formula is as follows [38,39]:
F i j = K i j E i × E j D i j 2 , K i j = E i E i + E j , D i j 2 = ( d i j g i g j ) 2
where Fij is the link strength of tourism efficiency between province i and province j. Kij is the gravitational coefficient. Ei and Ej denote the tourism efficiency of province i and province j, respectively. Dij denotes the “economic distance” between province i and province j. dij is the spatial geographical distance between province i and province j. gi and gj are the GDPs of province i and province j, respectively. The correlation strength matrix is constructed with Fij, and the mean value of each row in the matrix is used as the threshold F* for binarization.
F i j = { 1 , F i j F * 0 , F i j < F *

2.4. Social Network Analysis (SNA)

SNA is a sociological approach that explores the structural and attribute characteristics of a social network through the analysis of relationships in the network. Based on the social network analysis method, this paper analyzes the spatial network structure of China’s provincial tourism efficiency from three aspects: overall network structure, individual network structure, and clustering feature structure.
The overall network characteristics are analyzed in four aspects: network density, network relatedness, network hierarchy, and network efficiency [19]. This paper mainly analyzes network density and network relatedness. Network density reflects the tightness of connections between provinces in the network. The greater the density, the more closely connected the spatial network of tourism efficiency between provinces. Network correlation degree reflects the robustness or vulnerability of the spatial network. The greater the degree of association, the more stable the spatial network of tourism efficiency.
Individual network characteristics are analyzed mainly in degree centrality, proximity centrality, and mediated centrality [28]. The center degree indicates the number of direct connections between a province and other provinces; the higher the degree, the stronger the connection between the province and other provinces. Proximity centrality is a measure that is not controlled by the influence of other provinces. The higher the proximity centrality, the easier it is for the province to be connected to other provinces. Intermediary centrality is a measure of the degree of control a province has over other provinces in the overall network. The higher the degree of intermediation centrality, the stronger the control of the province in the network, playing the role of acting as an intermediary.
The structural analysis of clustering features is mainly reflected in the core-edge analysis. The core-edge model reveals the location of provinces in the spatial network of tourism efficiency and clarifies the cities located in the core and edge areas of the spatial network of tourism efficiency and the intrinsic links between them [31,40].

2.5. Spatial Econometric Model

2.5.1. Model Building

In order to analyze what factors affect tourism efficiency, a spatial econometric model is constructed in this paper. The data used for this study are panel data from 30 provinces and cities in mainland China during 2008–2018, so a choice needs to be made between fixed effects and random effects in the regression model (in which fixed effects means that individual effects have a significant impact on the regression variables and random effects means that there is no association between two variables). Based on the individual effect research properties of this paper, the best choice of model is the fixed effect. Therefore, this work constructs a spatial panel data model as shown below [41,42]:
T P A E i , t = α t + ϕ t + β 1 P A T i , t + β 2 U R B i , t + β 3 T R A i , t + β 4 F I R i , t + β 5 G M R i , t + β 6 I N V i , t + β 7 E N E i , t + δ j W i j ( T P A E i , t ) + μ i , t μ i , t = λ j W i , j υ i , t + ε i , t μ i , t = λ j W i , j υ i , t + ε i , t
where PAT is the number of patents granted, URB is the level of urbanization, TRA is the level of transportation, FIR is financial development, GMR is government macro-control, INV is fixed asset investment, and ENE is energy consumption.

2.5.2. Variable Assumptions

Since there are many factors affecting tourism efficiency, this paper proposes the following hypotheses with reference to the existing literature:
Hypothesis 1.
The increase in the number of patents granted has a positive influence on tourism efficiency improvement. As carriers of advanced technology, patents can reflect the advanced degree of science and technology and the level of innovation ability to a certain extent. Science and technology can be viewed as the primary productive forces, and play an important role in economic and social development. Tourism, as a comprehensive social activity developed along with economic development, is the product and symbol of social progress. The progress of science and technology can promote the improvement in tourism facilities, the promotion of tourist attractions, the innovation of tourism methods, and the enhancement of the tourist experience.
Hypothesis 2.
The increase in the urbanization level plays a positive influence on tourism efficiency improvement. With rapid economic development and accelerated urbanization levels, people’s living standards are improved, and they have the economic conditions and increased time to participate in tourism and leisure activities. At the same time, the increase in the urbanization level makes the infrastructure facilities related to tourism better, and towns with regional cultural characteristics receive more attention, thus promoting the improvement of tourism.
Hypothesis 3.
The increase in the level of transportation positively affects the increase in tourism efficiency. Transportation conditions affect the quality of tourists in tourist destinations. Generally speaking, the more developed the transportation, the more tourists come from all over the world, the higher the number of tourists, and the better the tourism promotion. Poor traffic conditions are not conducive to the development of tourism resources and tourism promotion, and the number of tourists is naturally not high.
Hypothesis 4.
The scale expansion of the financial development has a positive impact on the improvement of tourism efficiency. Finance as the core of modern economic development and the development of the tourism industry must not be separated from the financial support. Financial support of the tourism industry is manifested in many ways, such as the government’s increased investment in tourism infrastructure construction, the banks’ financial support for the tourism industry, capital market support for the tourism industry, and the emergence of new tourism financial products.
Hypothesis 5.
The strengthening of government macro-regulation has a positive impact on tourism efficiency improvement. Government macro-regulation refers to the proportion of total tourism revenue to regional GDP, which can measure the structural proportion of tourism in the economy of each province. The total tourism revenue includes tourism basic revenue and non-basic revenue, and the level of total tourism revenue can reflect the overall social investment in the tourism industry to a certain extent.
Hypothesis 6.
The increase in fixed asset investment plays a positive impact on tourism efficiency improvement. Investment in fixed assets is the main means of reproducing fixed assets in society. Through a series of activities of building and acquiring fixed assets, it allows the economic structure and industrial distribution to be adjusted, promoting economic growth and improving people’s lives. In general, the more investment in fixed assets in tourism, the more beneficial to the development of tourism.
Hypothesis 7.
The increase in energy consumption has a positive effect on tourism efficiency improvement. Although tourism as a service industry does not have a huge demand for energy as in the manufacturing industry, energy consumption is essential in tourism. The characteristics of the tourism industry determine the diversity of energy consumption, and all aspects involved in tourism activities, such as food, accommodation, transportation, entertainment, and shopping, consume energy. Therefore, the increase in energy consumption means, to some extent, the expansion of the tourism industry.

3. SNA Results of Provincial Tourism Efficiency

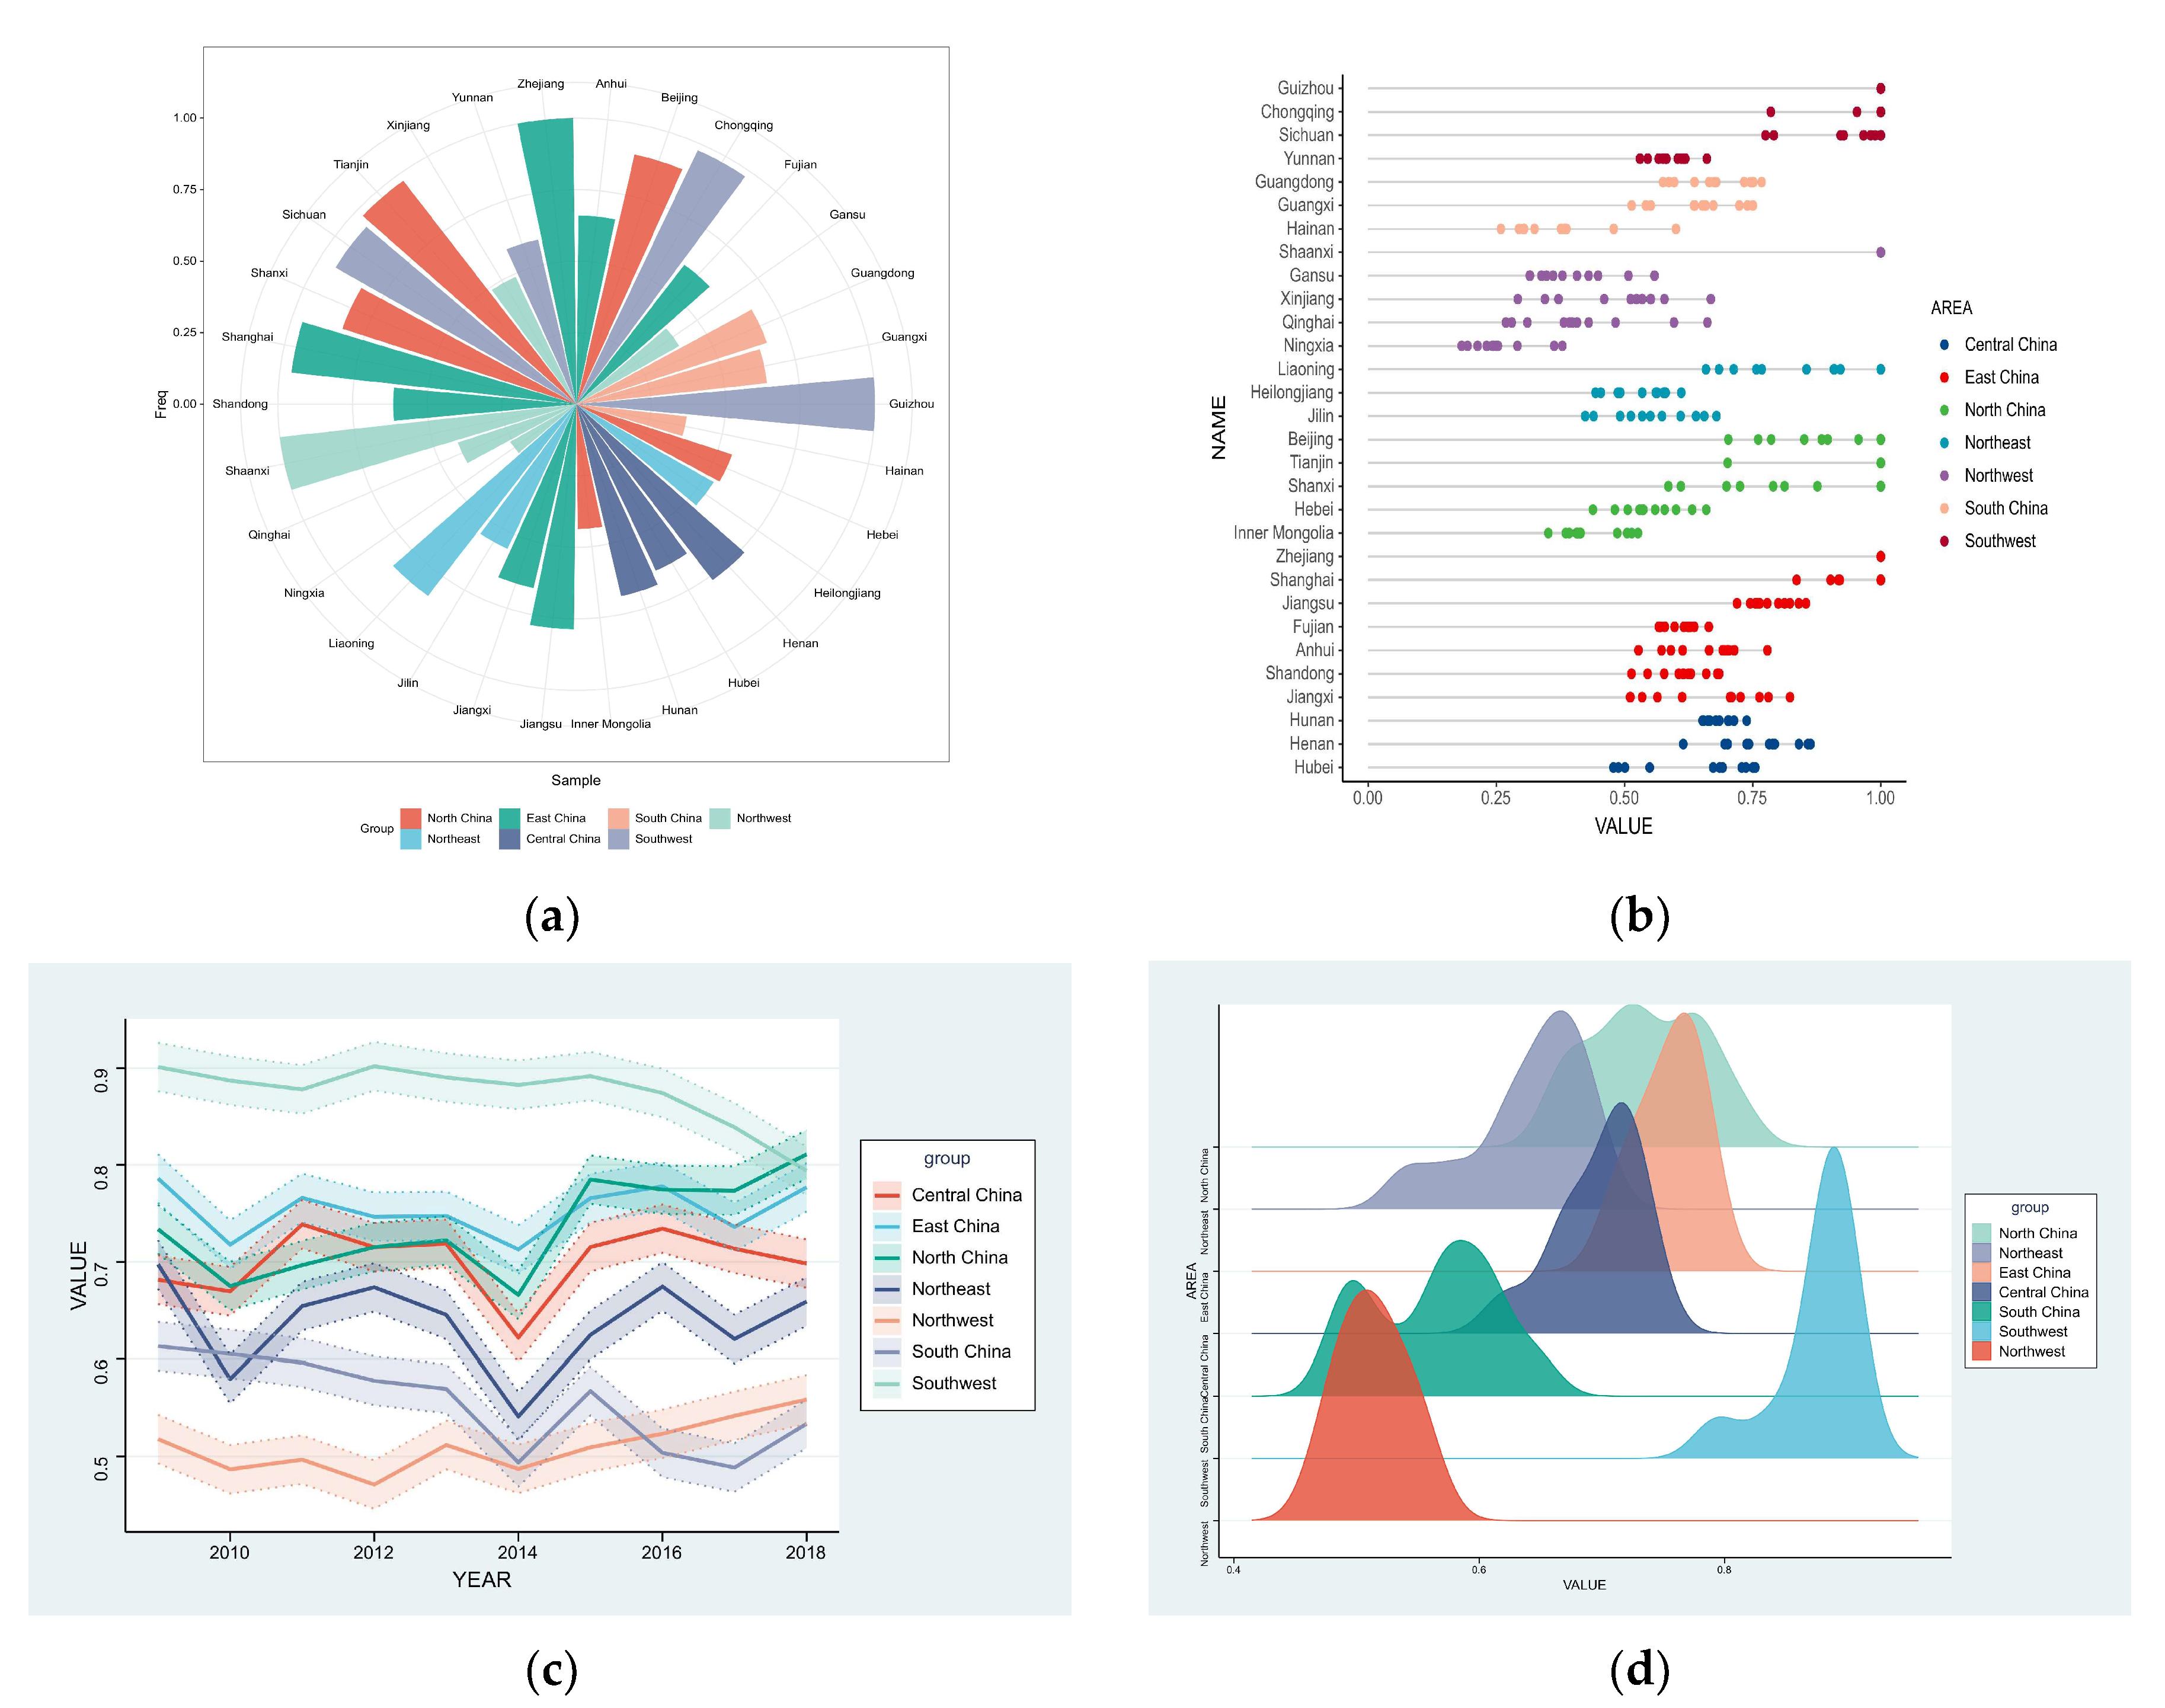
3.1. Provincial Tourism Efficiency Trends

The tourism efficiency of 30 provinces and cities in China from 2008 to 2018 were calculated using the SBM-DEA method. As shown in Table 2. From 2008 to 2018, the tourism efficiency of the country shows a fluctuating trend rather than a smooth upward trend. The tourism efficiency is approximately 0.71 in 2008, 0.68 in 2012, and 0.7 in 2015 (which is basically at a medium level). This indicates that, regarding the utilization of tourism resources, construction related to tourism has not yet reached high efficiency development, and there is still much room for improvement.
Due to the existence of regional differences, tourism efficiency varies unevenly and widely among provinces. For example, for Beijing, Tianjin, Shanxi, Liaoning, Shanghai, Zhejiang, Chongqing, Sichuan, Guizhou, and Shaanxi, their average tourism efficiency values are above 0.8 in all study years and are at a high level. Among them, Zhejiang, Guizhou, and Shaanxi have had the highest tourism efficiency for eleven consecutive years, all of which remain at 1. This indicates that these provinces have better tourism resource utilization, tourism development and construction, and tourism economic development, and have achieved maximum tourism efficiency. Hainan’s and Ningxia’s tourism efficiency average values are below 0.4 (i.e., in the low efficiency level). This indicates that these two provinces have not yet found a suitable way for local tourism development, have not fully utilized tourism resources, and do not have an input–output inequality relationship to be adjusted and improved. The remaining provinces have average values between 0.4 and 0.8 (which are in the middle level), which indicates that they have not yet mastered the best ratio of input and output, their tourism resources are not fully utilized, and there is therefore room for improvement.
The change in tourism efficiency in each province over the years shows that there are big differences in tourism development between provinces. For example, Zhejiang, Guizhou, and Shaanxi have maintained a high efficiency (of 1) for eleven years, indicating that these provinces have found suitable local tourism development and marketing management pathways, and are able to maintain the efficient use of tourism resources in the long term. In contrast, seven other provinces’ (including Beijing and Shanghai) average efficiency values over eleven years are high (0.8 or more), though their efficiency values are not steadily increasing or remaining the same (and there are certain fluctuations). For example, the efficiency value of Beijing was 1 in 2008, then became 0.956 in 2012, then dropped to 0.786 in 2016, and finally rose again to 0.896 in 2018. The relevant indicators selected may be related to the development and implementation of tourism-related policies in each province, thus leading to fluctuations in efficiency values. Gansu and Xinjiang have slow growth, although they are at a low level overall. This is due to their geographical locations, lack of tourism construction, and poor implementation of relevant tourism policy formulation. This also shows insufficient tourism development and underutilization of tourism resources in this province. The efficiency value of Ningxia has remained around 0.2 for a long time, which may be related to its geographical location, the lack of tourism infrastructure construction, and the backwardness of information technology. As a result, the tourism industry of Ningxia has not been developed for a long time. In Hebei, Guangdong, and Yunnan, the tourism efficiency of eleven years has basically fluctuated around the efficiency mean in each province, which indicates that the tourism development in these areas has not improved significantly and there is still much room for improvement in the future.

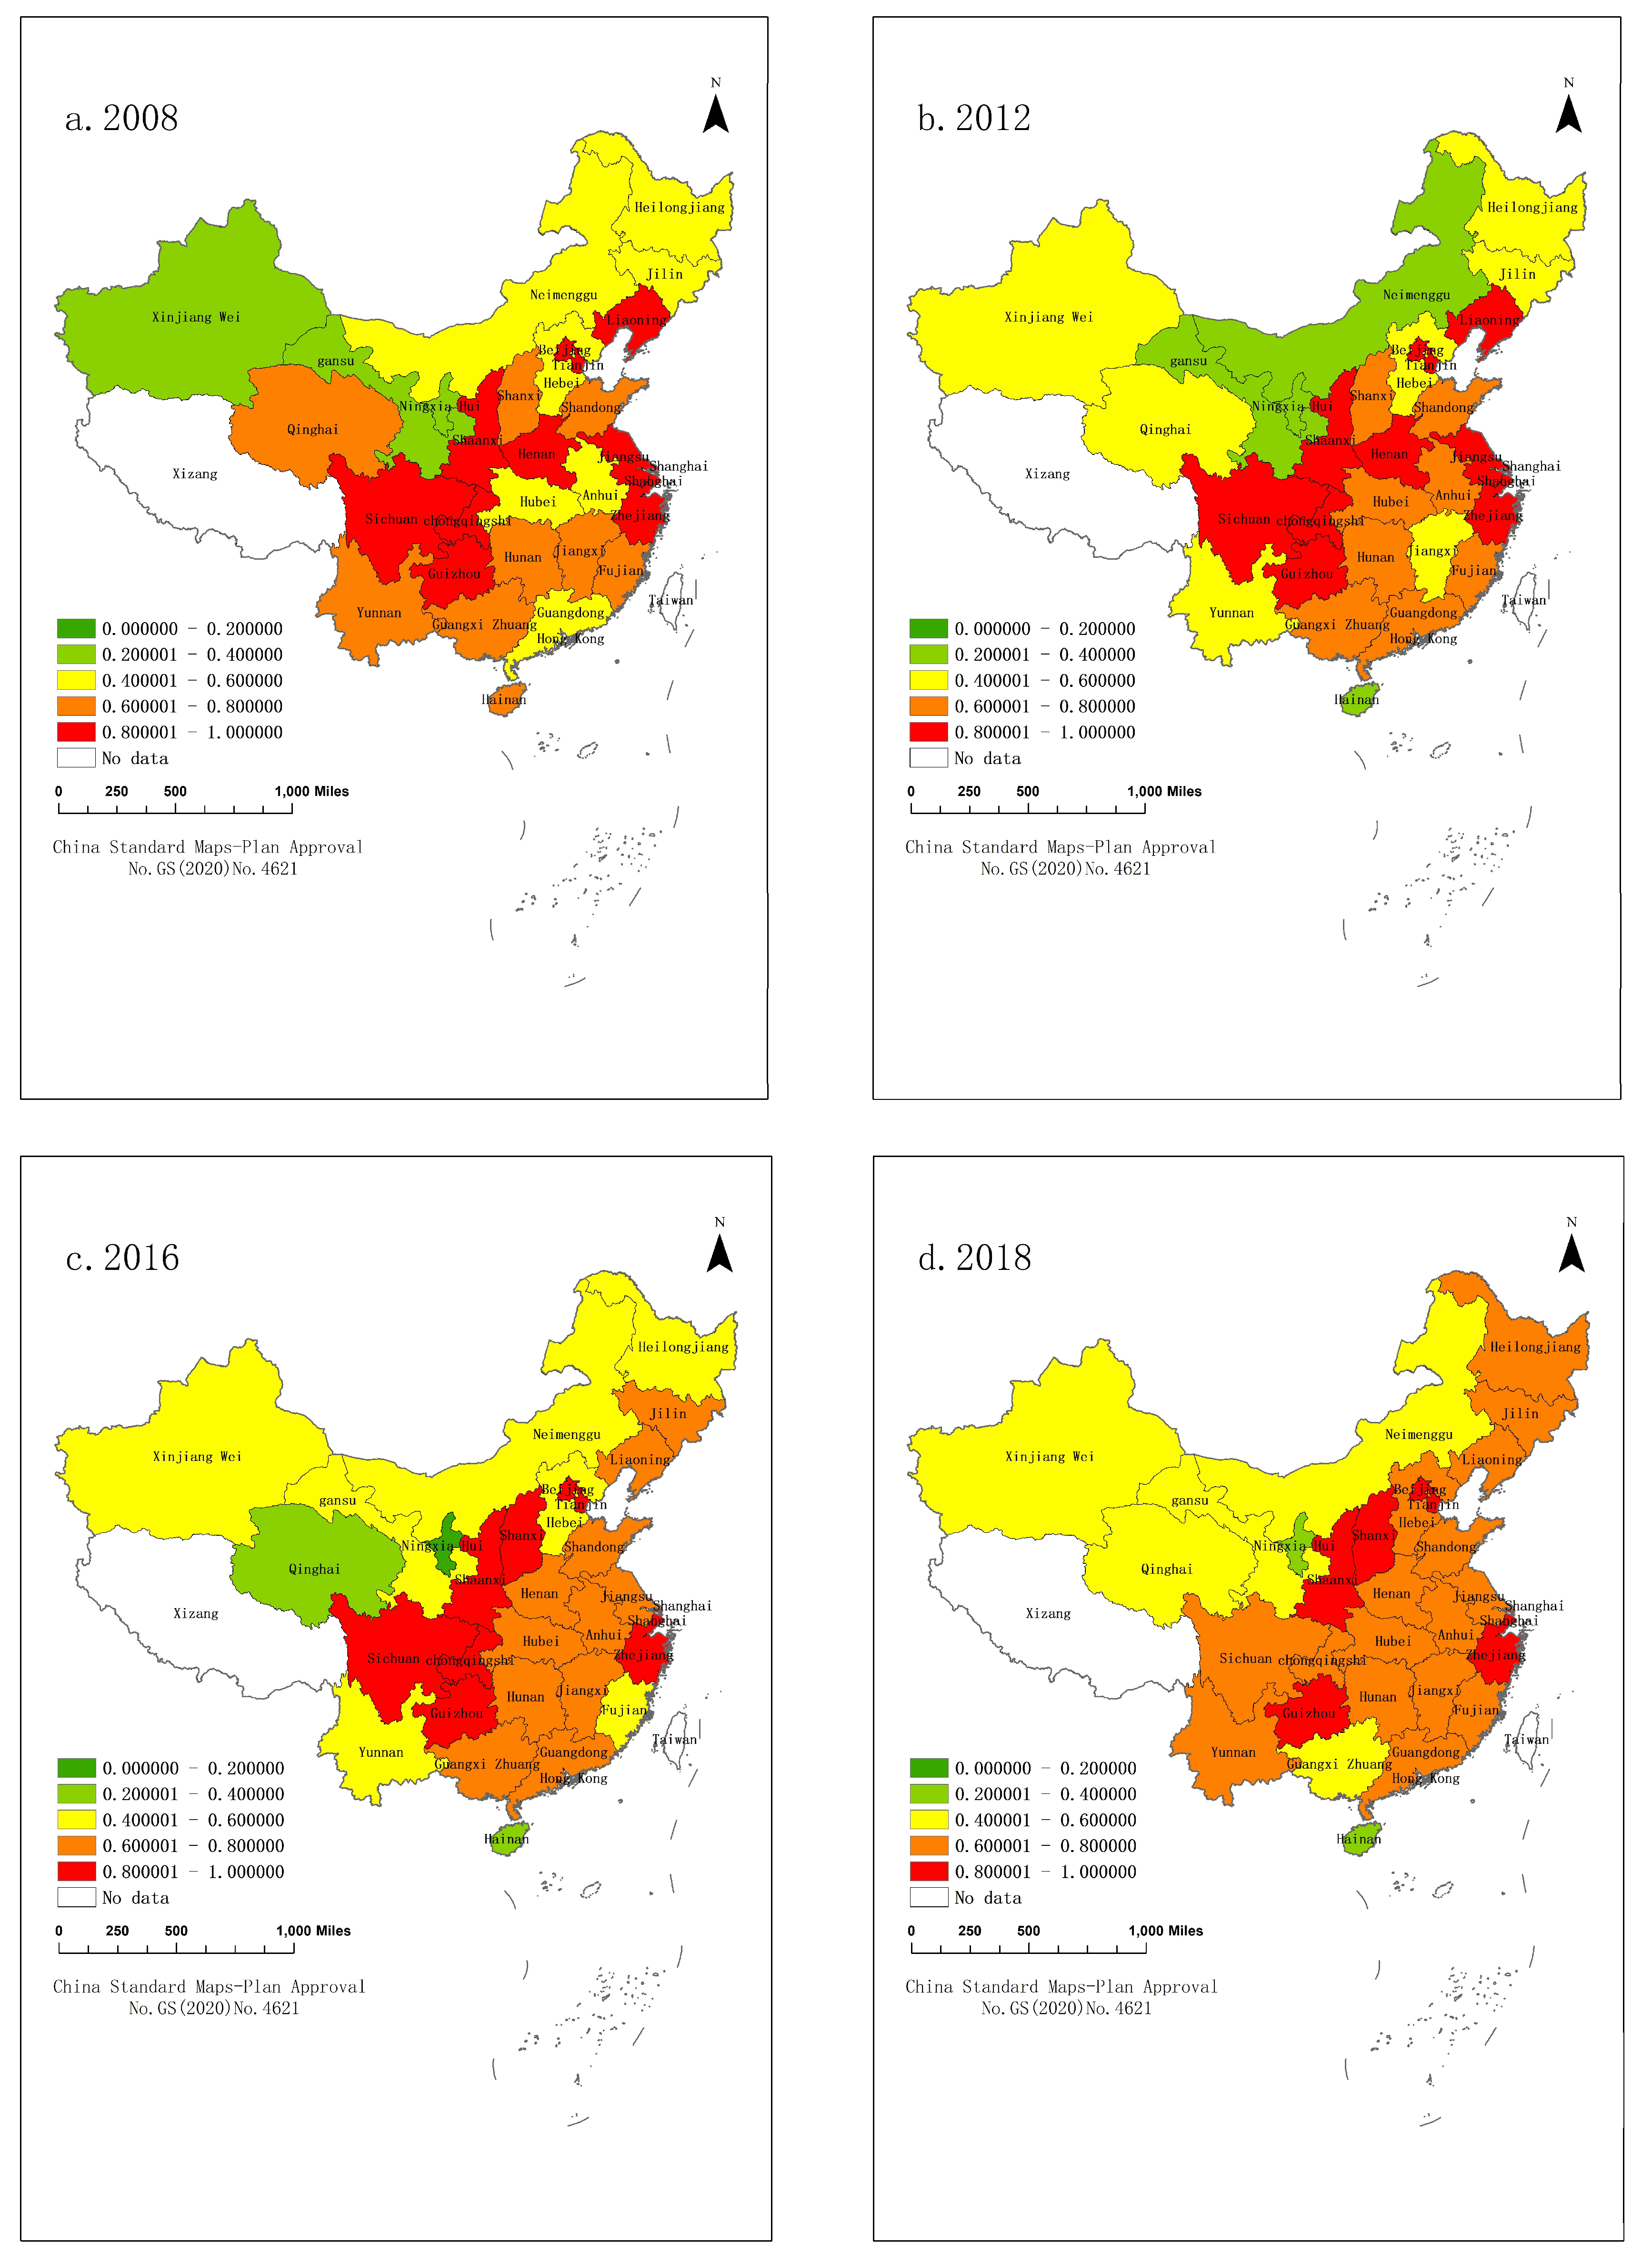
3.2. Spatiotemporal Tourism Efficiency in China

Provincial tourism efficiencies were visualized and presented in Figure 1. The map color from green to red indicates the tour efficiency value from low to high. Each color block is a range of 0.2 efficiency values.
From Figure 1, it is clear that the tourism efficiencies of central regions (such as Sichuan and Chongqing) and the eastern regions (such as Jiangsu and Zhejiang) were higher in 2008, and the tourism efficiency of western regions (such as Xinjiang and Gansu) was lower. Compared with 2008, the efficiencies of Xinjiang, Hubei, Anhui, and Guangdong increased in 2012, the efficiencies of Inner Mongolia, Qinghai, Jiangxi, Hainan, and Henan decreased, and the efficiencies of the central and eastern regions was higher. By 2016, the efficiencies of Hebei, Shanxi, Jilin, Inner Mongolia, Gansu, and Jiangxi had rebounded and those of Liaoning, Yunnan, Guangxi, Fujian, and Shandong had declined. By 2018, the efficiencies had increased in Beijing, Heilongjiang, Fujian, Shandong, and Yunnan and declined in Jiangsu, Jiangxi, Chongqing, and Sichuan. Tourism efficiency was improved in all provinces over the 11 year period, probably due to China’s active improvement in urban tourism facilities, municipal construction, and the natural environment to host the 2008 Olympic Games. The hosting of the Olympic Games also increased the number of visitors to China, raising foreign exchange earnings and bringing tourism benefits to the provinces. Although tourism efficiency changes in each province over the 11 years from 2008 to 2018, overall it appears that higher efficiency lies in the central–east and lower efficiency lies in the west. Therefore, tourism development, planning, and policy formulation and implementation in the west must be strengthened. The fluctuation of efficiency is influenced by a variety of factors, such as the development and promulgation of tourism industry standards, the implementation of relevant tourism policies, the level of economic development, and geographic location.
Based on the general principles of geographical zoning [43], the provinces of China are divided into seven administrative geographical divisions, whose tourism efficiency values are calculated (Figure 2). Figure 2a shows the average tourism efficiency of each province during the eleven years from 2008 to 2018. There are significant differences in the tourism efficiency averages among provinces: some provinces reach the optimal level, such as Zhejiang, and some have lower tourism efficiency values, such as Ningxia. In terms of zoning, the situation varies from one zone to another. In Northwest China, except for Shaanxi (which has a high level of tourism efficiency), the average tourism efficiency values of all provinces are below 0.5. The average tourism efficiency values of the provinces in Central China are more similar, at around 0.65. In Southwest China, except for Yunnan, all provinces have high tourism efficiency levels. The tourism efficiencies of provinces within North China, Northeast China, East China, and South China vary, with some provinces having higher efficiency levels and some having lower efficiency levels.
In terms of the magnitude of tourism efficiency values over the 11 year period, the efficiency values vary by province and region (Figure 2b). In the southwest region, Guizhou’s efficiency value has been stable at 1, and Chongqing’s efficiency value has fluctuated among only three values. Sichuan and Yunnan fluctuate among several values, and the efficiency value of Yunnan is significantly lower than that of other provinces in the southwest region. The efficiency values of three provinces in South China fluctuate within a wide range, and the efficiency values are relatively low among the seven regions. In the northwest region, except for Shaanxi, whose efficiency value has been stable at 1, the efficiency values of the remaining provinces fluctuate widely and are relatively low. In the northeast region, Liaoning has a high efficiency value, while Jilin and Heilongjiang have efficiency values around 0.5. In North China, Beijing, Tianjin, and Shanxi have efficiency values above 0.6, while Hebei and Inner Mongolia have relatively low efficiency values. In East China, Zhejiang and Shanghai have higher efficiency, while the rest of the provinces have higher efficiency. The three provinces in Central China have similar efficiency values, most of which are around 0.7.
Looking at the trend of efficiency changes in each region (Figure 2c,d), there are obvious differences between regions. Overall, the tourism efficiency level in the southwest region is the highest (basically concentrated at around 0.9). The tourism efficiency value in the southwest region is more stable over time, but the efficiency level has decreased after 2016. The overall tourism efficiency in Northwest China is low, and has the lowest level among the seven regions. The tourism efficiency in Northwest China was more volatile before 2014 and showed a slow upward trend after 2014. East China, North China, and Central China have closer and more fluctuating tourism efficiency values. South China and Northeast China have lower tourism efficiencies compared to other regions. The efficiency value for Northeast China has fluctuated more and had the lowest efficiency value in 2014. South China had a slowly decreasing trend until 2014, with its efficiency value fluctuating more after 2014.
In summary, the southwest region has a high and stable efficiency value, ranking first among the seven regions. The efficiency value of Northwest China ranks the last among the seven regions, but then shows a slow upward trend. Among the remaining five regions, East China, North China, and Central China have only lower efficiency values than Southwest China, and their efficiency values show large fluctuations. South China and Northeast China are slightly stronger than Northwest China. Within each region, tourism efficiencies between provinces present two characteristics. One is that the distribution of provincial efficiency values within the region varies widely. For example, Guizhou in Southwest China has a stable efficiency value of 1, while the lowest efficiency value in Yunnan is distributed around 0.58. The other is that the tourism efficiency values of provinces within the region are close to each other. For example, Hunan, Hubei, and Henan in Central China have efficiency values around 0.7.

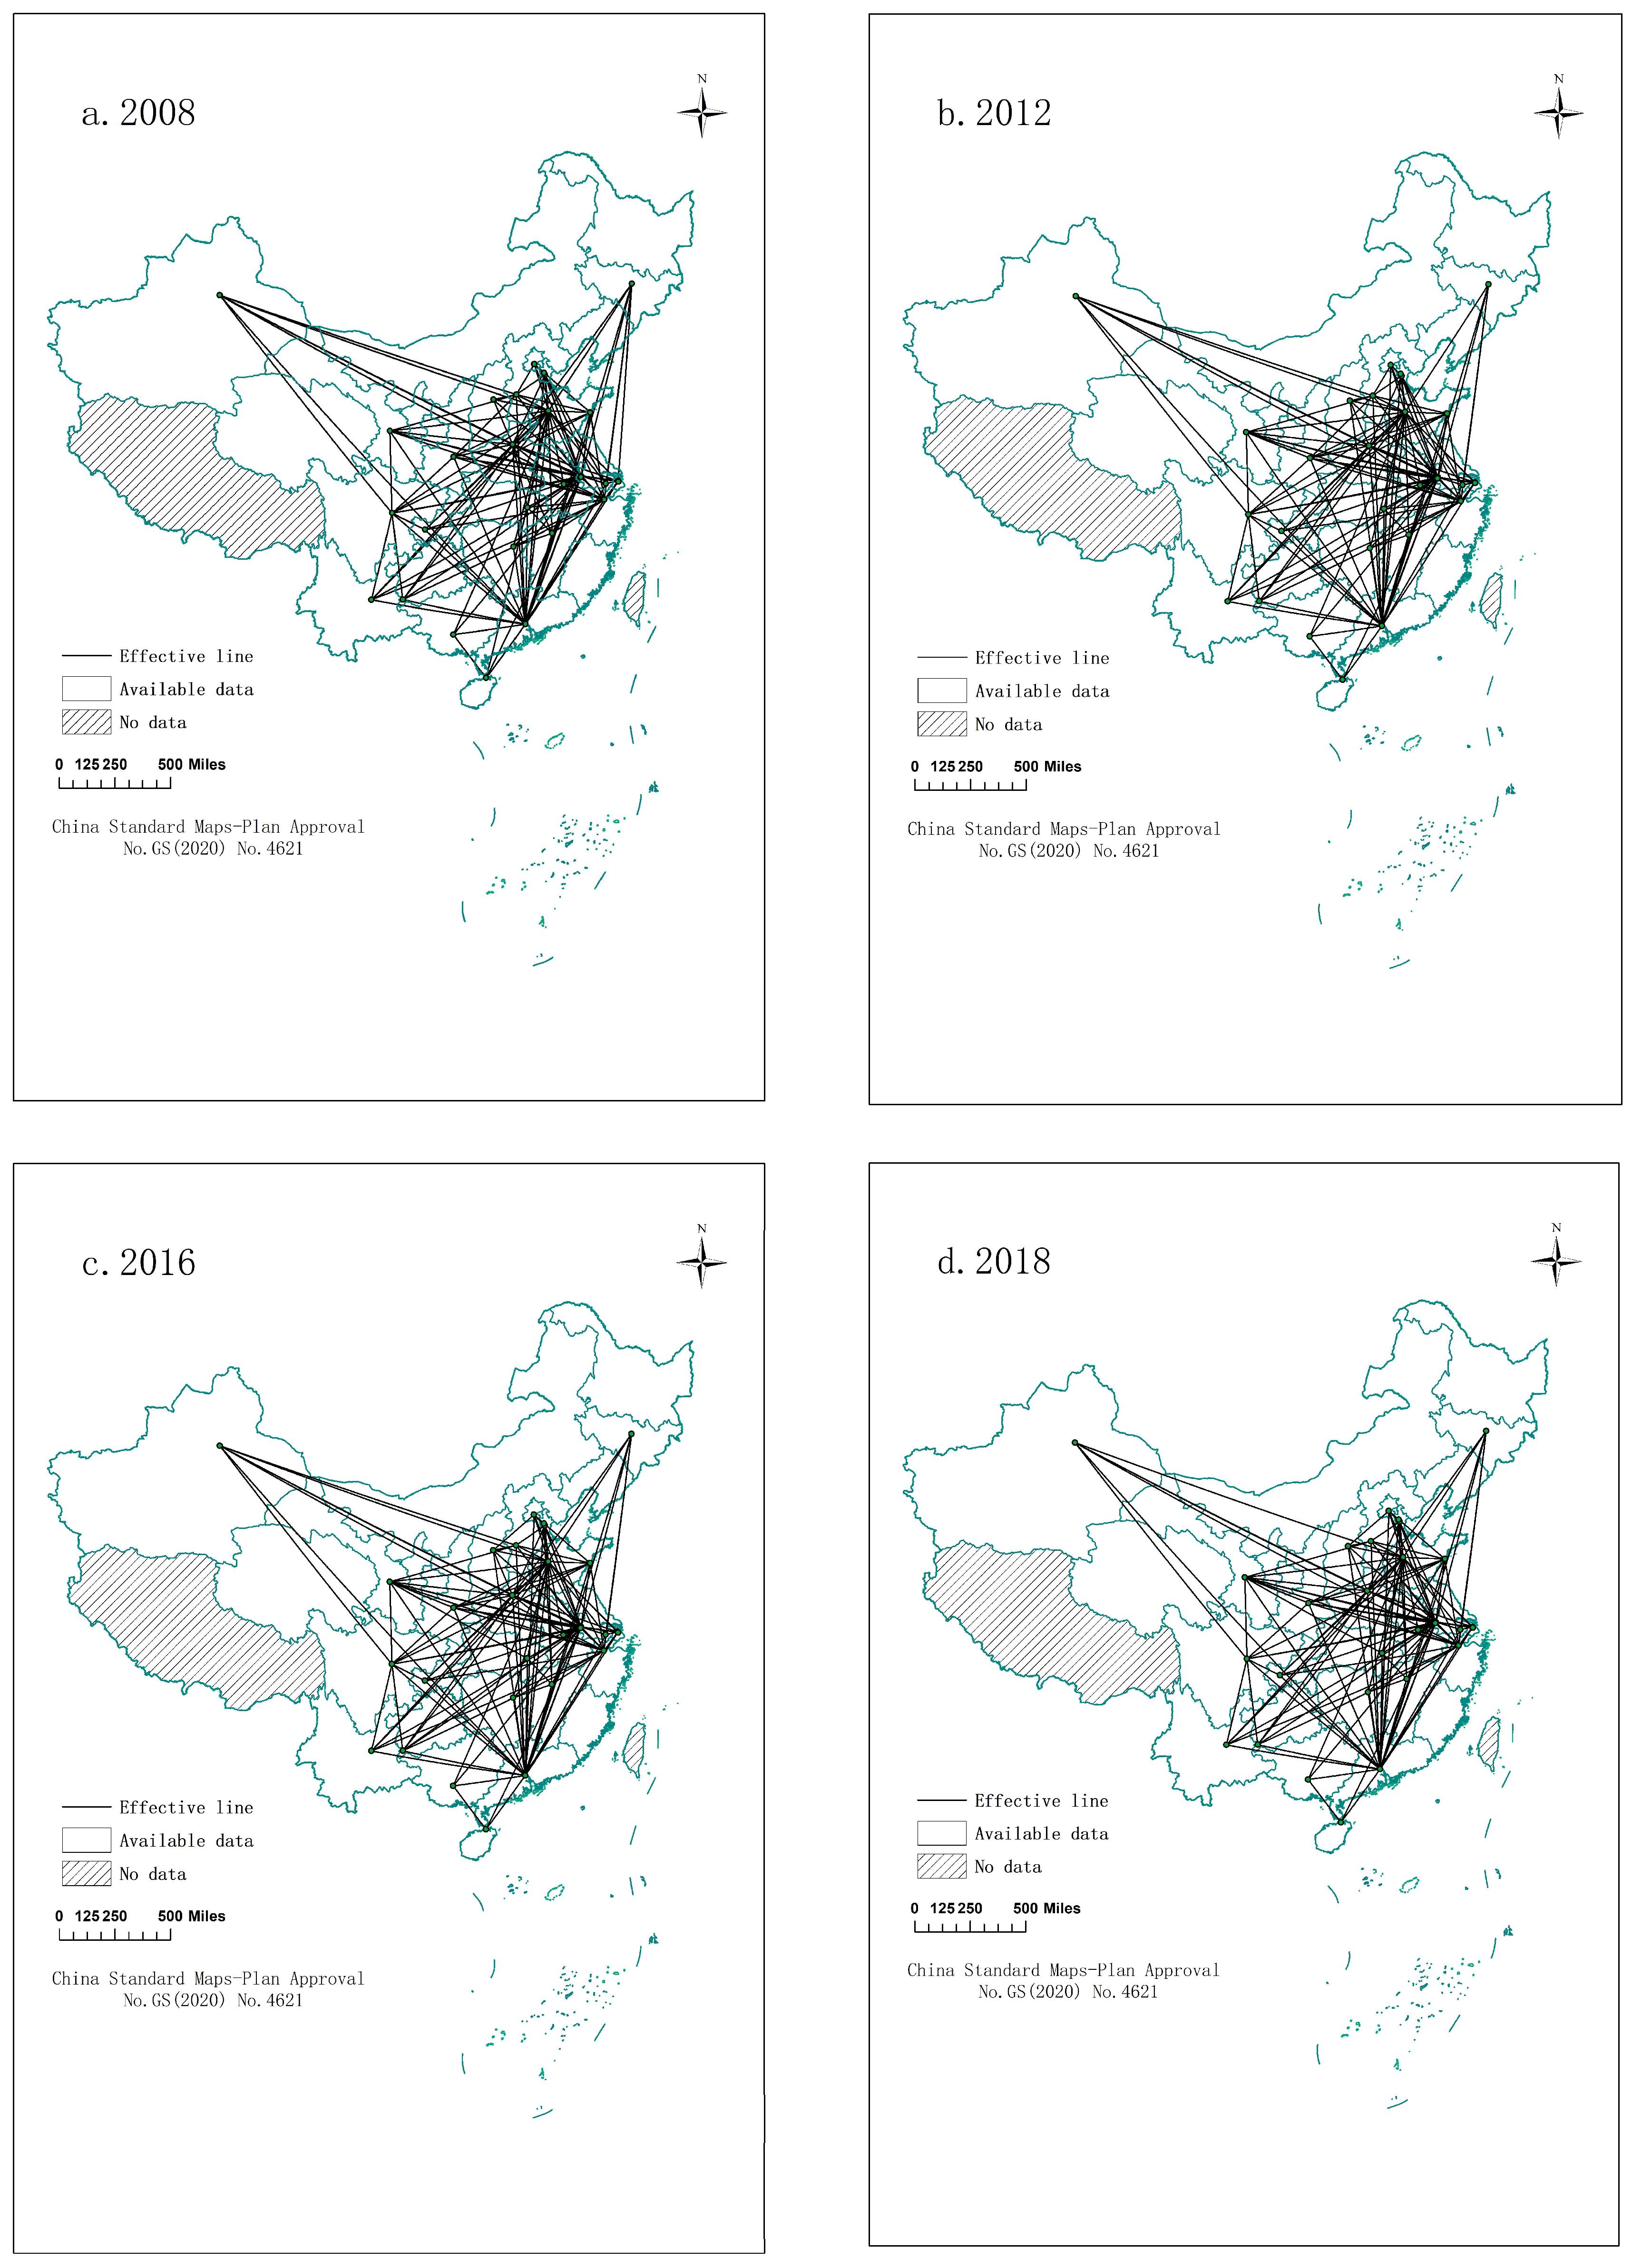
3.3. Spatial Correlation Network Analysis of Provincial Efficiency

In this paper, the bivariate directed matrix calculated based on the modified gravity model is processed using the SNA tool Ucinet [19], and then ArcGIS 10.2 software is used to map the spatial correlation network of provincial tourism efficiency. Here, four years (2008, 2012, 2016, and 2018) are selected as representatives for cross-sectional comparison (Figure 3). As shown in Figure 3, with the rapid development of the tourism industry, the spatial correlation network of tourism efficiency in China has gradually become more complex and the links between provinces and regions have been increasing. The eastern coastal region is always at the center of the spatial association network and is more connected to the central and western regions than the other four regions. While the central and western provinces are mostly in the peripheral areas, the association network is increasing and approaching the core areas.
Second, the relevant indicators of the spatially correlated network of provincial tourism efficiency in China from 2008 to 2018 were calculated using the Ucinet 6 software to analyze overall network characteristics and individual network characteristics.

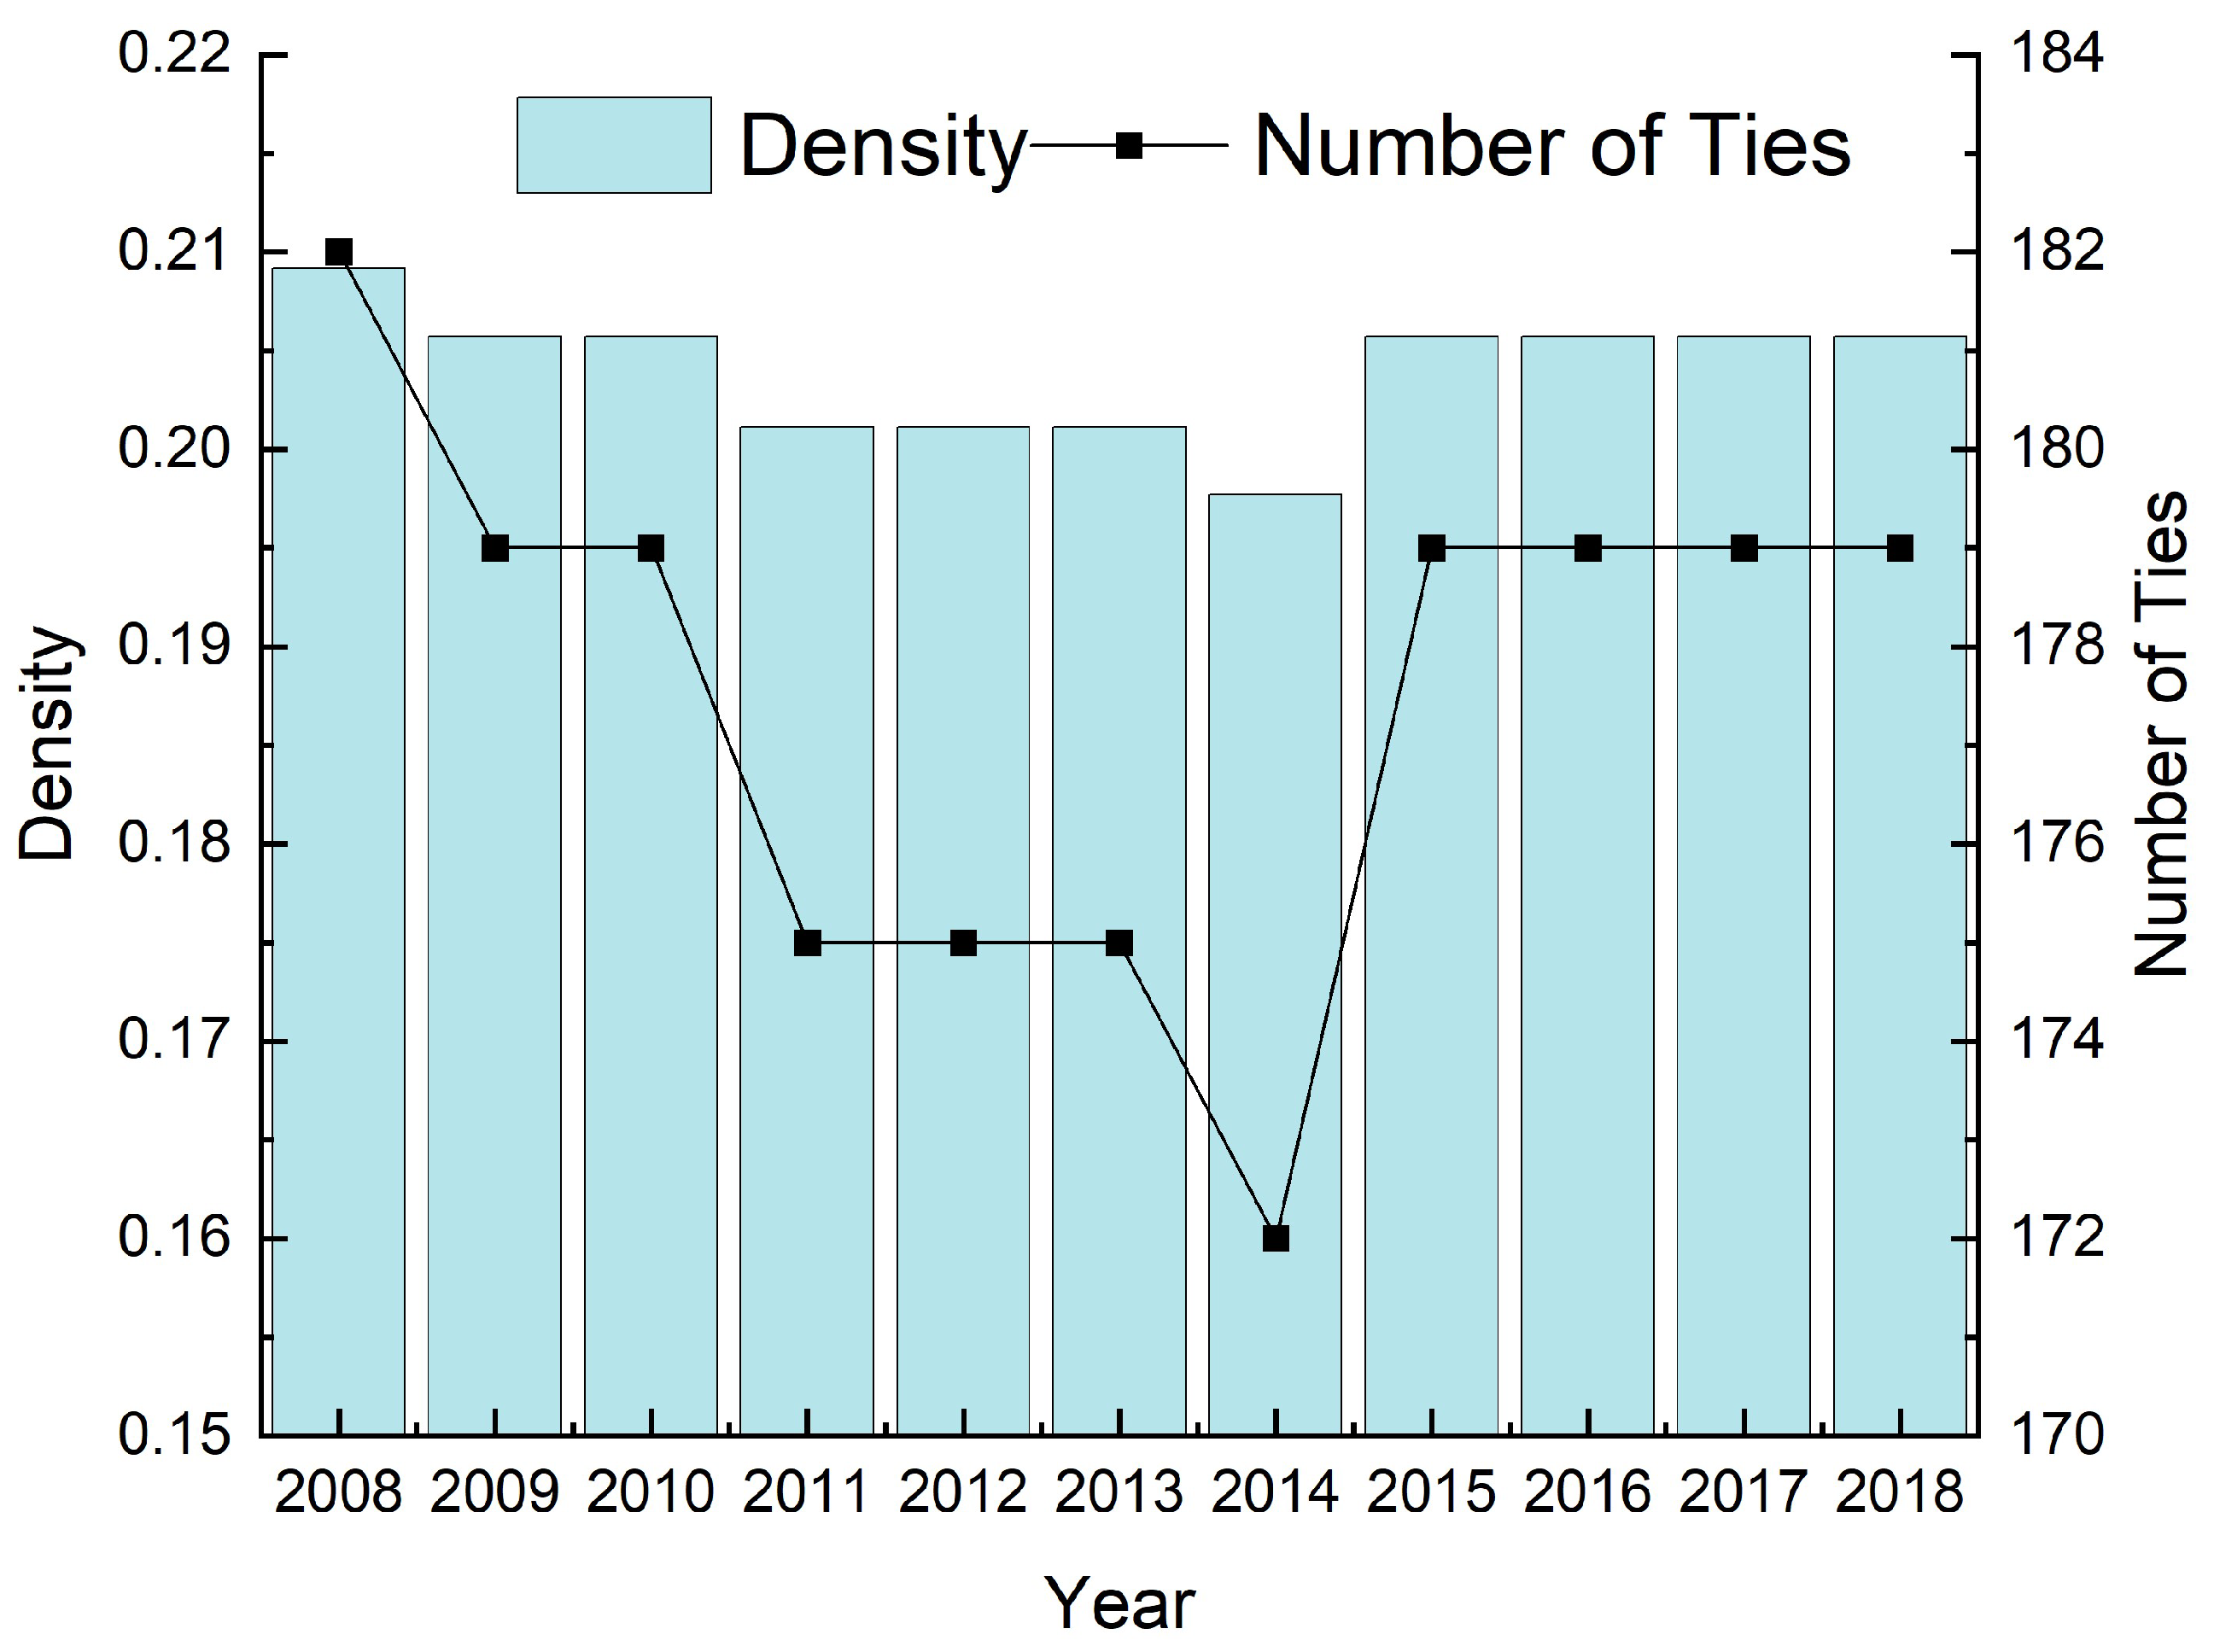
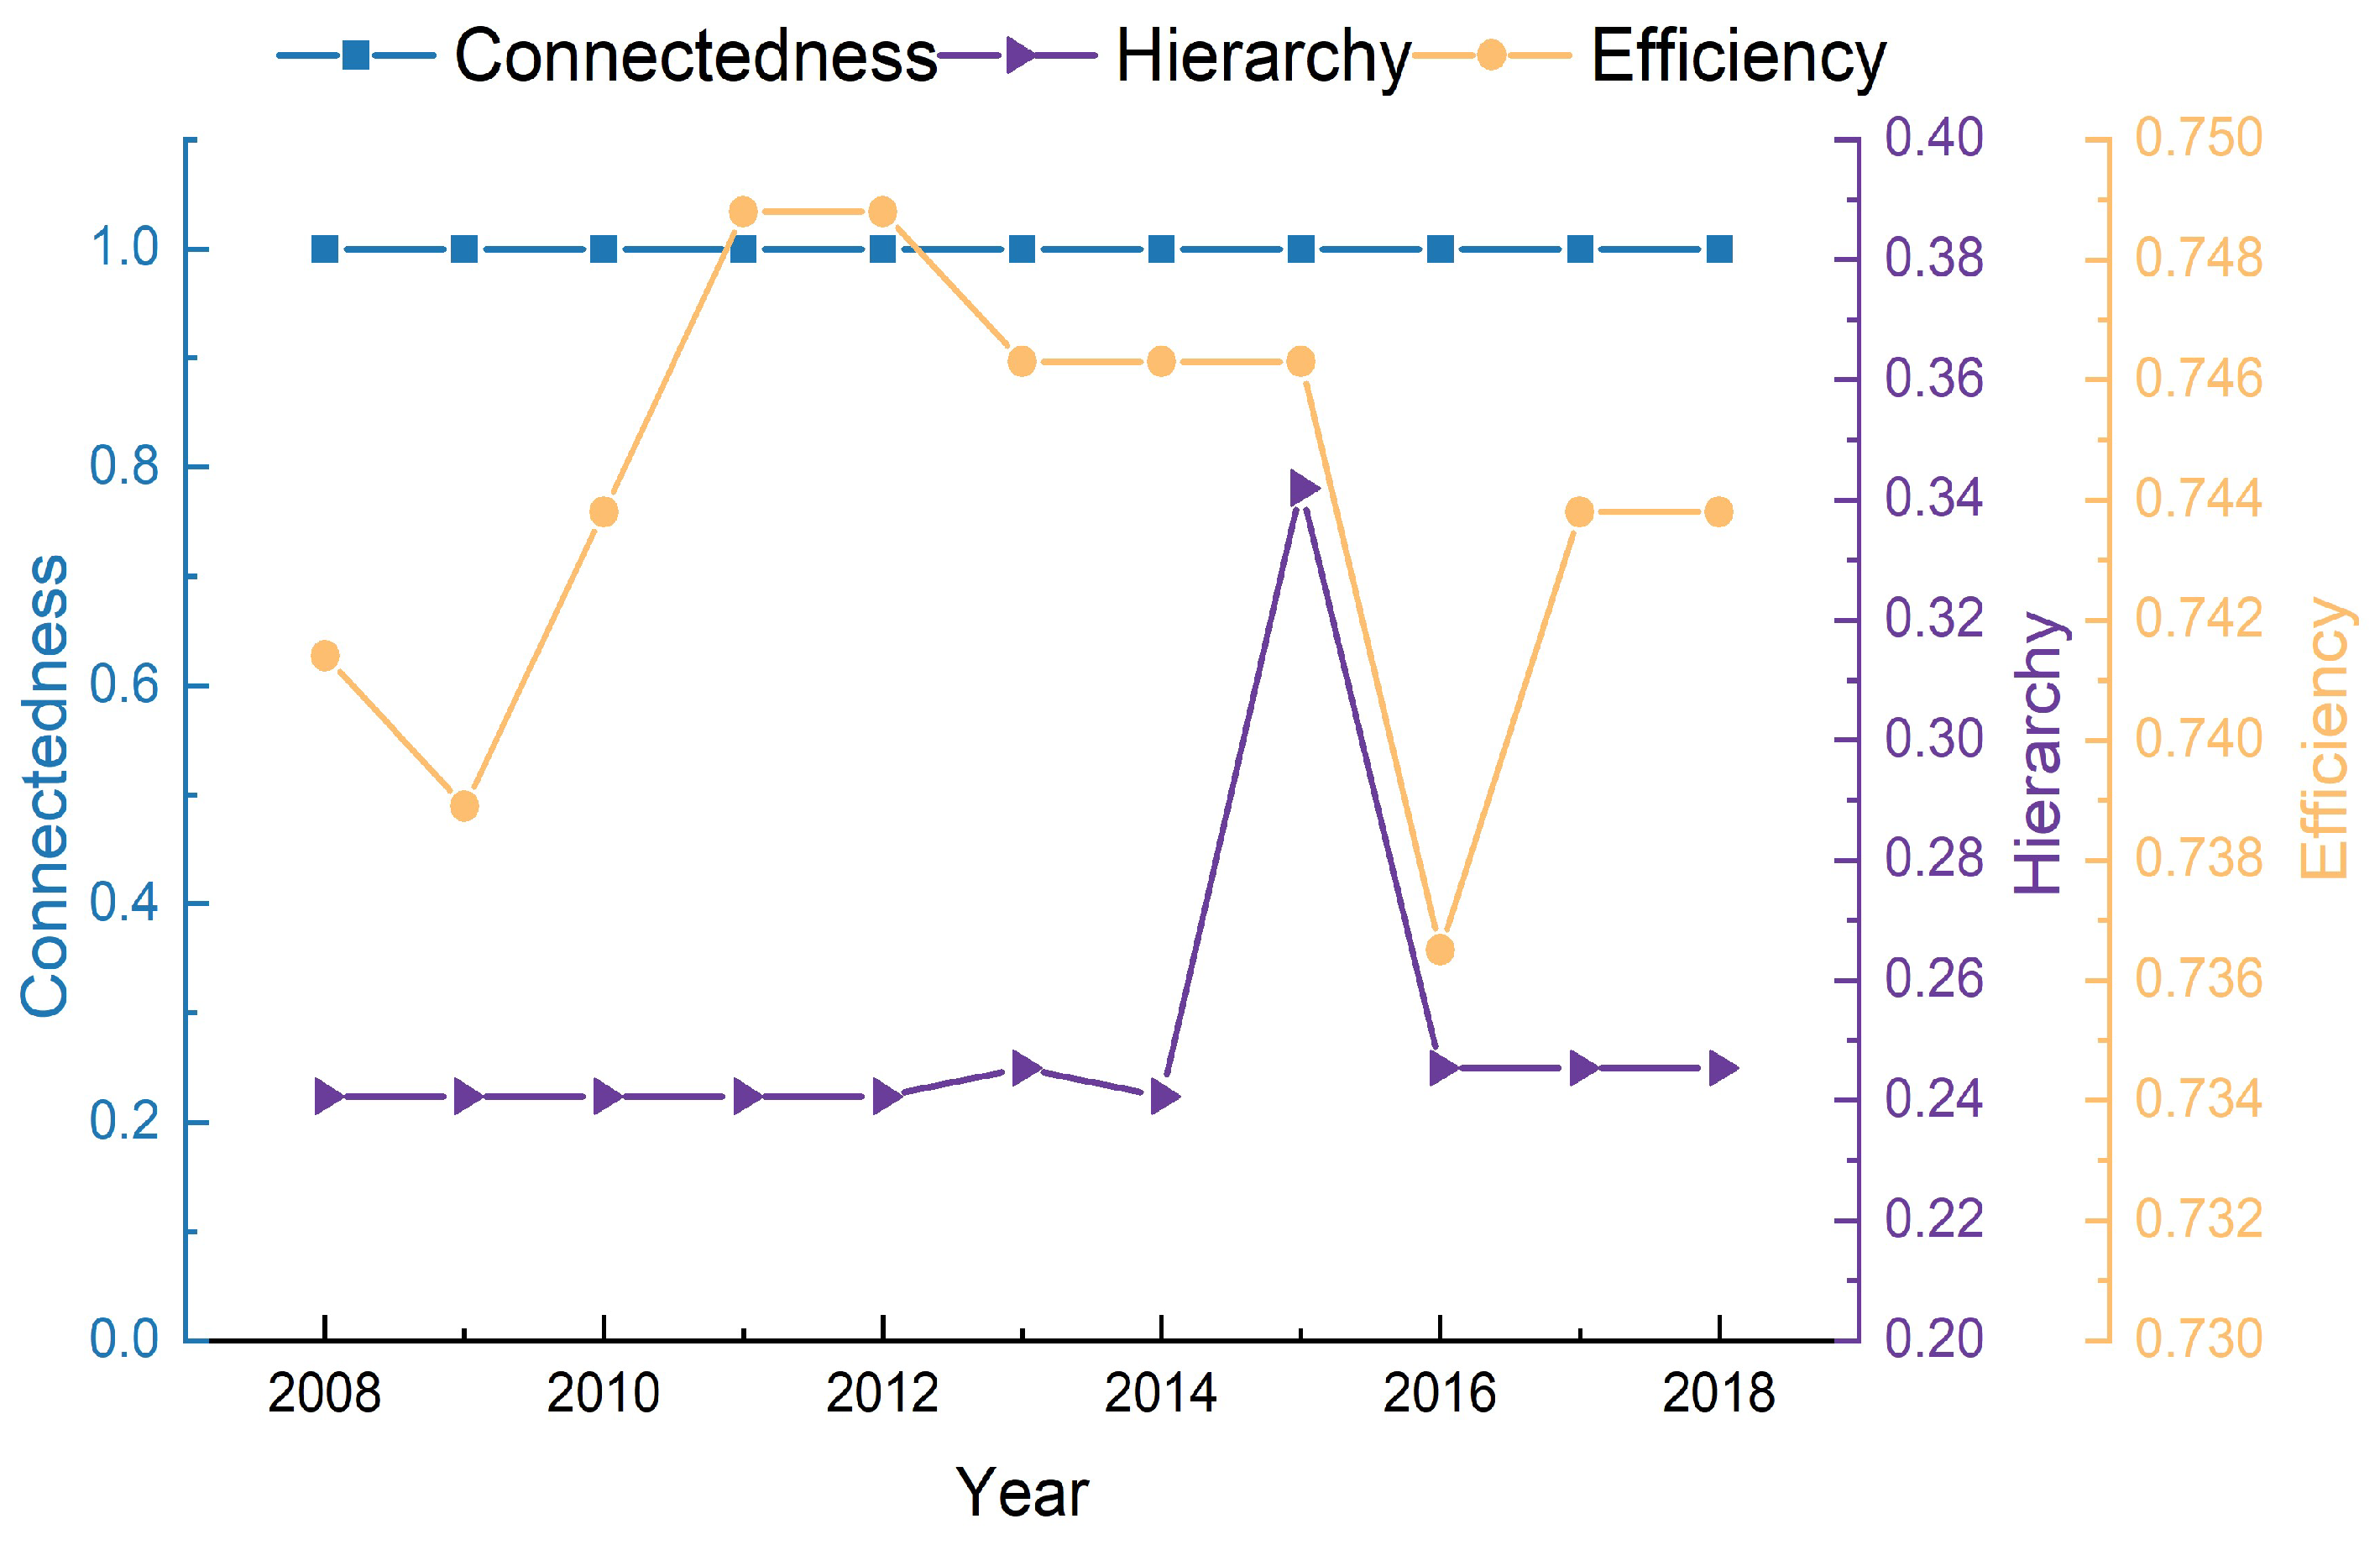
3.3.1. Overall Network Features

  • Network strength
Figure 4 shows that the trends of network density and the number of network relationships for provincial tourism efficiency in China remain consistent during 2008–2018, showing a decreasing trend followed by an increasing trend, but the changes are generally small. Among them, the network density value fluctuates between 0.190–0.210, which is far below the medium level, and the number of network relationships is basically below 200. The peak of the spatially linked network density and the number of network relationships in China’s provincial tourism efficiency occurred in 2008. This may be due to the change in the vacation system and the influence of Beijing Olympic Games, which strengthened the tourism cooperation and connection between provinces. In 2014, China’s provincial tourism efficiency had its lowest spatial association network density and its lowest number of network relationships. This may be related to the policy of tourism reform after the 18th National Congress, in which tourism no longer simply focuses on the speed of development but more on the improvement of quality.
2.
Network relevancy
During the study period, the network correlation degree of tourism efficiency for Chinese provinces was 1, indicating that the network structure remained well-connected and at a robust state in all years. The network rank degree shows a fluctuating upward trend, reaching a peak of 0.342 in 2015, but it is still at a lower level overall. This indicates that the spatial network structure rank between high-tourism efficiency provinces and low-tourism efficiency provinces is weak. In addition, the low rise indicates that the tourism industry in China is developing continuously while the tourism cooperation among provinces is also strengthening, and the spatially linked network level is not changing significantly. The overall level of network efficiency is high, with a mean value of 0.744 (which is at a moderate-to-high level), thus indicating a strong network correlation of tourism efficiency in Chinese provinces (Figure 5).

3.3.2. Individual Network Features

The more recent our information is, the more it can illustrate the actual problems facing the China’s tourism industry today. Therefore, this paper selects the latest 2018 data as a representative, and analyzes the spatial correlation characteristics of tourism efficiency in each province through three indicators: point centrality, proximity centrality, and intermediary centrality (Table 3), in order to provide a theoretical basis for the linkage and cooperation of tourism among these provinces from a spatial perspective.
  • Point degree centrality
The center degree indicates the number of direct connections between a province and other provinces; the higher the degree, the stronger the connection between the province and other provinces. In the directed graph, the degree of each node can be divided into the point-in degree and point-out degree. The point-out degree indicates the radiation effect of each province to other provinces, and the point-in degree indicates the agglomeration effect of each province to other provinces.
As shown in Table 3, the mean value of point degree centrality of tourism efficiency in China in 2018 was 30.575, and the distribution had distinct unevenness characteristics. Jiangsu, Shandong, and Guangdong provinces rank in the top three in terms of point degree centrality values, indicating that these provinces are located at the center of the spatially linked network structure of tourism efficiency, with strong ties to other provinces and high influence on other provinces. In terms of point-in and point-out degrees, each province has a radiating and clustering relationship with an average of 5.967 to other provinces. There are eight provincial areas with a point entry above the average value. These regions are mainly developed eastern provinces with stronger economic strength, better transportation accessibility, and abundant resources, such as tourism talents and technologies. These superior tourism development conditions make them the agglomeration centers of tourism efficiency spatial association networks. Sixteen provinces have point-out degrees higher than the average value, among which Ningxia, Gansu, and Qinghai have the highest point-out degrees, indicating that these provinces have a strong spatial spillover effect on other provinces.
2.
Proximity centrality
Proximity centrality is a measure that is not controlled by the influence of other provinces. The higher the proximity centrality, the easier it is for the province to be connected to other provinces. The mean value of proximity centrality of tourism efficiency in China in 2018 was 59.969, and the distribution was more balanced, indicating that all provinces in the spatial association network were easily connected to other provinces in terms of tourism efficiency. Nine provinces were above the mean value, and these provinces were in the dominant position in the spatial association network by relying on their own tourism resource endowment and strong economic strength. The proximity centralities of Shanghai, Anhui, and Hainan were in the last three positions, indicating that they are in a subordinate position in the spatial network and less connected with other provinces.
3.
Intermediary centrality
Intermediary centrality is a measure of the degree of control a province has over other provinces in the overall network. The higher the degree of intermediation centrality, the stronger the control of the province in the network, playing the role of acting as an intermediary. The mean value of intermediation centrality of tourism efficiency in China’s provinces was 3.436 in 2018, and the distribution was more uneven, with the values of intermediation centrality varying widely across provinces. Six provincial areas were above the mean value, indicating that they played an intermediary role in the spatial association network, and other provincial areas were more dependent on them. Among them, Guangdong Province had the highest intermediary centrality degree and a key position in the network, which indicates that its rich tourism resources and large economic benefits from tourism, together with its superior geographical location, make it an important intermediary for inter-provincial tourism links and cooperation. In contrast, Hainan, Heilongjiang, and Xinjiang are in the bottom three in terms of intermediary centrality, indicating their weaker control and fewer links with other provinces.

3.3.3. Core-Edge Structure

In order to summarize the provinces that have a greater impact on the overall tourism efficiency of China, this paper analyzes the network structure of provincial tourism efficiency in China using the core-edge model and explores the relationship between the core and edge areas. The distribution of core and edge areas is shown in Table 4. The results indicate that there is distinct core-edge structure in the network, and the core areas show a clustered distribution pattern. The relationship between core and edge areas is shown in Table 5. The inter-node density of 0.226 in the core area indicates that there are fewer and fewer connected provinces in the core area. The inter-node density of the edge zone is 0.500, indicating that the connection between the two provinces in the edge zone is stronger and the degree of interaction is high. The network densities of core area to edge area and edge area to core area are relatively low, indicating that there is less interaction between the two and there is an obvious hierarchical structure of the network structure.

4. Spatial Econometric Regression Analysis of the Impact of Provincial Tourism Efficiency in China

4.1. Model Measurement Results and Spatial Correlation Test

In this paper, we first used the traditional least squares method to perform preliminary simulations of the spatial econometric model described in Equation (5), and then verified the appropriateness of spatial model adoption by using Matlab 7.12 software (R2011a, Cleve Moler, USA) to test the spatial autocorrelation of the model residual terms. The results are shown in Table 6. Table 6 compares the regression results of four models: no fixed, area fixed, time fixed, and two-way fixed. We selected the strongest fixed-effect model in terms of the strength of the model comparison results.
The four models are compared based on the coefficient of determination of goodness of fit (Table 6). The R-squared values of the four models are 0.4172, 0.8582, 0.4821, and 0.8885, respectively, showing that the two-way fixed-effects model fits the best compared to the other three. The Log-L values demonstrate that two-way fixed-effects model is still the best. The results in Table 6 indicate that the two-way fixed effects model has the best explanatory strength compared to the other models, therefore, this model is chosen for the subsequent analysis. Also, Table 6 presents the test outcomes on whether the residual terms of the model have spatial autocorrelation; for the two-way fixed effects model, LM-lag is 7.6222 and LM-err is 10.2776, with the former passing the test at the 5% significance level and the latter performing significantly at the 1% level. Both of the validations show that the residual terms of the model are spatially autocorrelated, but this problem cannot be solved using the traditional least squares estimation. Because the estimation results of the ordinary model may be distorted, the ordinary model should be converted into a spatial model. In addition, since the statistics of LM-err are larger than those of LM-lag, the spatial error model is more suitable for the relevant study in this paper, by comparison.

4.2. Estimation Results of the Spatial Panel Data Model

Since the estimation results of the ordinary spatial econometric model cannot well solve the spatial autocorrelation problem of the residual terms, the results will inevitably be distorted or even have large deviations. Therefore, this paper uses the great likelihood method in the spatial model to simulate the model iteratively and derive different cases under the spatial autoregressive model (SAR) and the spatial error model (SEM), respectively, and the results are shown in Table 7. The tests of 1% significance level for both the SAR and the SEM once again prove the scientific nature and rationality of using the spatial model. Compared with the ordinary spatial econometric model, the values of the log-likelihood functions of the new spatial econometric model have all increased, which reflects the increasing explanatory strength of the model. The regression coefficients of the variables in the econometric model are consistent with the ordinary model, but their t-tests have been improved, reflecting that the estimation results of the spatial econometric model have been improved and optimized based on the ordinary model. In addition, the Log-L value of the SEM model is larger than that of the SAR model, indicating that the former has a stronger explanatory power than the latter. After comparing the studies, it is found that the SEM is the best choice for this empirical study. Therefore, this paper focuses on the explanatory analysis on the measurement results of each explanatory variable in the SEM.
The number of patent licenses has a positive effect on tourism efficiency at a significance level of 1%, which indicates that the development and progress of science and technology can promote the improvement in tourism efficiency. The progress of science and technology improves the tourist facilities of scenic spots, which greatly facilitates the food, accommodation, transportation, and entertainment of tourists. The improvement in information technology promotes the development and promotion of tourist resources. The application of science and technology enhances the safety of adventurous tourist activities, such as bungee jumping, rock climbing, river rafting, etc., and brings tourists a better experience. The development of biotechnology can mitigate the negative environmental impacts related to tourism and protect the ecological balance. In general, the impact of science and technology on tourism permeates all aspects related to tourism and promotes the overall development of tourism, thus helping to improve tourism efficiency.
The level of urbanization has a positive but insignificant effect on tourism efficiency. Urbanization construction mainly transforms a traditional agricultural society into an industrial and service society. The increase in the level of urbanization is a general trend, and the process of urbanization will bring about changes in many aspects, including economic and social. However, improvement in the level of urbanization does not happen overnight but requires long-term persistence. The low impact of urbanization on tourism efficiency indicates that the construction of urbanization has not yet reached a sufficient degree to affect tourism efficiency.
The level of transportation has a positive effect on tourism efficiency, at a 5% level of significance. Traffic level is an important factor that affects the development of tourism. Firstly, the traffic condition directly affects the choice of tourist destination and the arrangement of tourist itinerary, and the quality of the roads is directly related to the tourist experience. Tourist destinations with convenient transportation have more complete accommodation, catering, and other supporting facilities, which can attract a large number of tourists and is conducive to the development of tourism. Secondly, traffic conditions are one of the key factors in the development of tourism resources. Since tourism resources depend on tourists’ patronage to generate economic benefits, without convenient and reliable transportation, the scale and long-term nature of the tourism economy will be difficult to form. Therefore, the size of the attractiveness and effectiveness of tourism resource development is largely influenced by the level of transportation.
The scale of financial development also has a positive effect on tourism efficiency, at a significance level of 5%. This indicates that strengthening financial capital investment in the tourism industry can promote tourism development. From the government side, financial support for the tourism industry is mainly manifested in tourism national bonds, tourism development funds, a special fund for tourism development, financial subsidies for policy bank loans, and national poverty alleviation funds for supporting tourism. These funds are mainly used to improve relevant tourism infrastructure and to promote tourism development. From the bank side, the credit support provided by banks for the tourism industry is also being strengthened. Taking into account the risk and operation of tourism projects, banks set reasonable loan interest rates, and innovate and develop credit products and models that meet the characteristics of the tourism industry to facilitate the development of the tourism industry. From the capital market, the number of listed companies in the tourism industry, such as restaurants, hotels, and travel agencies, is increasing, which facilitates the raising of their capital and greatly promotes the development of the tourism industry.
Government macro-regulation has a positive effect on tourism efficiency, at a 1% significance level. This indicates that government macro-regulation can better provide policy and financial support for the development of the tourism industry in each province, thus promoting the improvement in residents’ consumption levels and the expansion of local tourism market scale. On the one hand, the government macro-control can form a development mode oriented by policy and guaranteed by financial support, which provides a solid backing for the development of the tourism industry. On the other hand, the well-developed tourism industry brings economic benefits to the region, thus promoting the development of the regional economic level, which continues to promote the development of the tourism industry and form a virtuous circle.
The effect of fixed asset investment on tourism efficiency is negative but not significant. In terms of total investment, the relationship between fixed asset investment and the tourism economy is manifested on two aspects. On the one hand, reasonable and effective fixed investment will promote the flourishing of the tourism industry and improve economic efficiency. On the other hand, there may be inefficient investment that cannot stimulate the development of the regional tourism economy. In general, a high rate of investment can drive economic development, but that is not to say the higher the better. Excessive investment can cause the rapid expansion of the capital scale and the fast economic growth rate, resulting in greater economic volatility. In recent years, the fixed asset investment in each region continued to be a growing trend and a reasonable scale suitable for the development of tourism in each province was ignored. In addition, the actual situation of each province differs greatly and we should pursue capital expansion according to the actual situation and conduct reasonable industry planning. The improvement in tourism efficiency not only needs fixed asset investment to bring the expected output, but also a reasonable scale of investment suitable for local development.
The effect of energy consumption on tourism efficiency is negative but not significant. The development of tourism-related industries strongly relies on energy. The increase in energy consumption indicates that tourism-related industries are developed well and this helps to improve tourism efficiency. However, at the same time, the increase in energy consumption will cause resource depletion and environmental pollution, which will affect the quality of tourism development. In particular, the over-exploitation of natural tourism resources, such as forest parks and mountain landscapes, can be detrimental to the balanced development of the ecological environment, thus hindering the healthy development of the tourism industry and negatively impacting tourism efficiency. The negative impact of increased energy consumption offsets part of the positive impact of energy utilization, resulting in an overall insignificant negative impact.

5. Conclusions and Policy Implications

5.1. Conclusions

In this paper, the SBM-DEA model was applied to measure tourism efficiency in 30 provinces in China, and the spatial network structure and influencing factors of tourism efficiency were analyzed using SNA and spatial econometric regression models. The results show that there are distinct regional differences in tourism efficiency. Among them, the tourism efficiency level in the southwest region is high and steadily developing, and the tourism efficiency level in the northwest region is the lowest among the seven regions. Among the different regions, there are also significant differences in tourism efficiency values among provinces. For example, Zhejiang’s tourism efficiency value has been stable at 1, while Ningxia’s tourism efficiency value fluctuates around 0.25. In terms of spatial network structure, the spatially linked network of provincial tourism efficiency in China has gradually become more complex and the links between provinces have been increasing. The network strength shows a trend of first decreasing and then increasing. The overall level of network efficiency is high. The unevenness of inter-provincial tourism efficiency development is significant. In terms of influencing factors, the number of patents granted, the level of transportation, the scale of financial development and government macro-control play a positive role in influencing tourism efficiency. The level of urbanization, fixed asset investment, and energy consumption have insignificant effects on tourism efficiency.

5.2. Policy Implications

Based on this work, we propose the following recommendations.
(i)
Strengthen the role of government guidance to promote tourism efficiency. National policy guidance is found to be an important influencing factor. The government should assist in the development planning of the tourism industry, improve the relevant supporting rules and regulations, monitor the infrastructure construction situation, and increase investment in the tourism industry to provide a good development environment for it. In addition, the government should play a macro-control role in tourism development. There are regional differences between provinces because of various influencing factors, such as geographical location and different development statuses. The government should innovate the management mode for different regional tourism development statuses, strengthen departmental collaboration, optimize resource allocation, and effectively promote the improvement in tourism efficiency.
(ii)
Strengthen inter-regional cooperation to improve the overall efficiency of tourism. From this work, it is clear that tourism efficiency exhibits a form of distribution that is higher in the central and eastern regions of the country and lower in the west. To improve overall tourism efficiency, we should pay attention to the influence of spatial dependence on the tourism efficiency between regions. On the one hand, it is necessary to break the restrictions of administrative divisions, encourage cross-regional cooperation, and facilitate the integration of advantageous resources. In particular, exotic tourism resources in the western region and natural scenery tourism in deserts and grasslands are integrated with the advantageous resources of efficient tourism in the central and eastern regions to realize the rational use of resources. On the other hand, the radiation-driven role of high-efficiency areas should be strengthened and the spatial correlation of tourism efficiency should be enhanced. It is also important to radiate and drive the surrounding low efficiency areas with high efficiency areas, strengthen the cooperative relationship with low efficiency areas, collaboratively and efficiently develop the surrounding tourism resources, narrow the regional gap, and effectively improve tourism efficiency.
(iii)
Prioritize ecological development and strengthen the innovative and rational use of resources. Ecosystems are closely correlated with and inseparable from tourism development; they are both the guarantee of tourism development and the key to human survival [44]. A good ecological environment can benefit the development of tourism and promote a virtuous cycle of ecology–tourism development. We recommend actively responding to the concept of sustainable development [45], focusing on the balanced development of ecology and resource development, and gradually optimizing the input–output structure while using tourism resources to achieve effective allocation of resources. It is necessary to strengthen the innovation of mutual integration of the ecological economy and the tourism economy, to realize the reasonable and efficient use of tourism resources under the priority condition of ecological protection, and to improve the utilization rate of resources.

Author Contributions

Conceptualization, G.Y.; methodology, Y.Y.; software, Y.Y.; validation, Y.Y., G.G. and Q.G.; formal analysis, G.Y.; investigation, Y.Y.; resources, G.Y.; data curation, Y.Y.; writing—original draft preparation, G.Y. and Y.Y.; writing—review and editing, Y.Y.; visualization, G.Y.; supervision, G.Y.; project administration, G.G. and Q.G. All authors have read and agreed to the published version of the manuscript.

Funding

This research was funded by the Science and Technology Research Program of Chongqing Municipal Education Commission (Grant No. KJQN202101122 and No. KJQN201904002), Chongqing Higher Education Society Project (Grant No. CQGJ21B057), Chongqing Postgraduate Education and Teaching Reform Research Project (Grant No. yjg223121), Chongqing University of Technology Higher Education Research Project (Grant No. 2022ZD01), Undergraduate Education Reform Project of Chongqing University of Technology (Grant No. 2021YB21) and China National Business Education Subjects 14th Five-Year Plan 2022 (Grant No. SKKT-22015).

Institutional Review Board Statement

Not applicable.

Informed Consent Statement

Not applicable.

Data Availability Statement

The data used to support the findings of this study are available from the corresponding author upon request (e-mail: gongguofang@2020.cqut.edu.cn).

Acknowledgments

The authors would like to thank anonymous reviewers for their valuable comments on drafts of this paper.

Conflicts of Interest

The authors declare no conflict of interest.

References

  1. Faber, B.; Gaubert, C. Tourism and Economic Development: Evidence from Mexico’s Coastline. Am. Econ. Rev. 2019, 109, 2245–2293. [Google Scholar] [CrossRef] [Green Version]
  2. Teng, Y.; Cox, A.; Chatziantoniou, I. Environmental degradation, economic growth and tourism development in Chinese regions. Environ. Sci. Pollut. Res. Int. 2021, 28, 33781–33793. [Google Scholar] [CrossRef]
  3. Sun, X.; Gao, L.; Ren, H.; Ye, Y.; Li, A.; Stafford-Smith, M.; Connor, J.D.; Wu, J.; Bryan, B.A. China’s progress towards sustainable land development and ecological civilization. Landsc. Ecol. 2018, 33, 1647–1653. [Google Scholar] [CrossRef]
  4. Farrell, M.J. The Measures of Productive Efficiency. J. R. Stat. Soc. 1957, 120, 253–290. [Google Scholar] [CrossRef]
  5. Arbelo-Pérez, M.; Arbelo, A.; Pérez-Gómez, P. Impact of quality on estimations of hotel efficiency. Tour. Manag. 2017, 61, 200–208. [Google Scholar] [CrossRef]
  6. Maha, L.-G.; Viorică, E.D.; Asandului, M.; Maha, A. Hotel Efficiency Analysis from the Customer’s Point of View in Romania: A Stochastic Production Frontier Approach. Emerg. Mark. Financ. Trade 2018, 54, 661–676. [Google Scholar] [CrossRef]
  7. Karakitsiou, A.; Kourgiantakis, M.; Mavrommati, A.; Migdalas, A. Regional efficiency evaluation by input-oriented data envelopment analysis of hotel and restaurant sector. Oper. Res. 2018, 20, 2041–2058. [Google Scholar] [CrossRef]
  8. Zhang, D.; Jinghua, T.; Zhou, L.; Yu, Z. Higher tourism specialization, better hotel industry efficiency? Int. J. Hosp. Manag. 2020, 87, 102509. [Google Scholar] [CrossRef]
  9. Köksal, C.D.; Aksu, A.A. Efficiency evaluation of A-group travel agencies with data envelopment analysis (DEA): A case study in the Antalya region, Turkey. Tour. Manag. 2007, 28, 830–834. [Google Scholar] [CrossRef]
  10. Fuentes, R. Efficiency of travel agencies: A case study of Alicante, Spain. Tour. Manag. 2011, 32, 75–87. [Google Scholar] [CrossRef]
  11. Li, B.; Ma, X.; Chen, K. Eco-efficiency measurement and spatial–temporal evolution of forest tourism. Arab. J. Geosci. 2021, 14, 568. [Google Scholar] [CrossRef]
  12. Choo, H.; Ahn, Y.-H.; Park, D.-B. Using the Data Envelopment Analysis to Measure and Benchmark the Efficiency of Small-scale Tourism Farms in South Korea. J. Rural Community Dev. 2018, 13, 1–15. [Google Scholar]
  13. Yuan, J.; Liu, Y. Evaluation of Tourism Efficiency in the Coastal Areas of China in the Context of the Happiness Industry. J. Coast. Res. 2020, 99, 144. [Google Scholar] [CrossRef]
  14. Li, R.; Guo, Q.; Wu, D.; Yin, H.; Zhang, H.; Zhu, T. Spatial characteristics of development efficiency for urban tourism in eastern China: A case study of six coastal urban agglomerations. J. Geogr. Sci. 2014, 24, 1175–1197. [Google Scholar] [CrossRef]
  15. Chaabouni, S. China’s regional tourism efficiency: A two-stage double bootstrap data envelopment analysis. J. Destin. Mark. Manag. 2019, 11, 183–191. [Google Scholar] [CrossRef]
  16. Wang, Y.; Wang, M.; Li, K.; Zhao, J. Analysis of the Relationships between Tourism Efficiency and Transport Accessibility—A Case Study in Hubei Province, China. Sustainability 2021, 13, 8649. [Google Scholar] [CrossRef]
  17. Tang, R.; Xiu, P. The modern service industry agglomeration and tourism efficiency in China: Regional difference and influencing mechanism. J. Asia Pac. Econ. 2021, 1–20. [Google Scholar] [CrossRef]
  18. Choi, K.; Kang, H.J.; Kim, C. Evaluating the efficiency of Korean festival tourism and its determinants on efficiency change: Parametric and non-parametric approaches. Tour. Manag. 2021, 86, 104348. [Google Scholar] [CrossRef]
  19. Wang, Z.; Liu, Q.; Xu, J.; Fujiki, Y. Evolution characteristics of the spatial network structure of tourism efficiency in China: A province-level analysis. J. Destin. Mark. Manag. 2020, 18, 100509. [Google Scholar] [CrossRef]
  20. Niavis, S.; Tsiotas, D. Assessing the tourism performance of the Mediterranean coastal destinations: A combined efficiency and effectiveness approach. J. Destin. Mark. Manag. 2019, 14, 100379. [Google Scholar] [CrossRef]
  21. Cvetkoska, V.; Barišić, P. The efficiency of the tourism indusrty in the balkans. Zb. Rad. Ekon. Fak. U Istoc. Sarajev. 2017, 14, 31–41. [Google Scholar] [CrossRef] [Green Version]
  22. Casanueva, C.; Gallego, Á.; García-Sánchez, M.-R. Social network analysis in tourism. Curr. Issues Tour. 2014, 19, 1190–1209. [Google Scholar] [CrossRef]
  23. Kang, S.; Lee, G.; Kim, J.; Park, D. Identifying the spatial structure of the tourist attraction system in South Korea using GIS and network analysis: An application of anchor-point theory. J. Destin. Mark. Manag. 2018, 9, 358–370. [Google Scholar] [CrossRef]
  24. Liu, B.; Huang, S.; Fu, H. An application of network analysis on tourist attractions: The case of Xinjiang, China. Tour. Manag. 2017, 58, 132–141. [Google Scholar] [CrossRef]
  25. Chu, C.-P.; Chou, Y.-H. Using cellular data to analyze the tourists’ trajectories for tourism destination attributes: A case study in Hualien, Taiwan. J. Transp. Geogr. 2021, 96, 103178. [Google Scholar] [CrossRef]
  26. Leung, X.Y.; Wang, F.; Wu, B.; Bai, B.; Stahura, K.A.; Xie, Z. A Social Network Analysis of Overseas Tourist Movement Patterns in Beijing: The Impact of the Olymoic Games. Int. J. Tour. Res. 2012, 14, 469–484. [Google Scholar] [CrossRef]
  27. Gan, C.; Voda, M.; Wang, K.; Chen, L.; Ye, J. Spatial network structure of the tourism economy in urban agglomeration: A social network analysis. J. Hosp. Tour. Manag. 2021, 47, 124–133. [Google Scholar] [CrossRef]
  28. Tan, Y.; Xiang, P.; Liu, S.; Yu, L. Evaluating provincial tourism competitiveness in China: An empirical application based on the EM-MGM-SNA model. Environ. Dev. Sustain. 2022, 1–22. [Google Scholar] [CrossRef]
  29. Munguia, R.; Davalos, J.; Urzua, S. Estimation of the Solow-Cobb-Douglas economic growth model with a Kalman filter: An observability-based approach. Heliyon 2019, 5, e01959. [Google Scholar] [CrossRef] [PubMed] [Green Version]
  30. Hu, W.; Zhang, Y. Evaluation of tourism efficiency in the middle and lower reaches of the Yellow River. J. Arid Land Resour. Environ. 2022, 36, 187–193. [Google Scholar] [CrossRef]
  31. Xie, C.; Fan, L.; Wu, G. Spatial network structure and influencing factors of urban tourism efficiency in the Yellow River Basin. J. Cent. China Norm. Univ. 2022, 56, 146–157. [Google Scholar] [CrossRef]
  32. Charnes, A.; Cooper, W.W.; Rhodes, E. Measuring the efficiency of decision making units. Eur. J. Oper. Res. 1978, 2, 429–444. [Google Scholar] [CrossRef]
  33. Ren, Y.; Fang, C.; Lin, X.; Sun, S.; Li, G.; Fan, B. Evaluation of the eco-efficiency of four major urban agglomerations in coastal eastern China. J. Geogr. Sci. 2019, 29, 1315–1330. [Google Scholar] [CrossRef] [Green Version]
  34. Chen, Y.; Ma, L.; Zhu, Z. The environmental-adjusted energy efficiency of China’s construction industry: A three-stage undesirable SBM-DEA model. Environ. Sci. Pollut. Res. Int. 2021, 28, 58442–58455. [Google Scholar] [CrossRef] [PubMed]
  35. Chu, J.-F.; Wu, J.; Song, M.-L. An SBM-DEA model with parallel computing design for environmental efficiency evaluation in the big data context: A transportation system application. Ann. Oper. Res. 2016, 270, 105–124. [Google Scholar] [CrossRef]
  36. Pishgar-Komleh, S.H.; Cechura, L.; Kuzmenko, E. Investigating the dynamic eco-efficiency in agriculture sector of the European Union countries. Environ. Sci. Pollut. Res. Int. 2021, 28, 48942–48954. [Google Scholar] [CrossRef]
  37. Guangming, Y.; Qingqing, G.; Fengtai, Z.; Guofang, G.; Yunrui, Y. The Temporal and Spatial Characteristics and Influencing Factors of Low-Carbon Economy Efficiency and Science and Technology Development Level in China’s Provinces From the Perspective of Uncoordinated Coupling. Front. Environ. Sci. 2022, 10, 886886. [Google Scholar] [CrossRef]
  38. Keum, K. Tourism flows and trade theory: A panel data analysis with the gravity model. Ann. Reg. Sci. 2010, 44, 541–557. [Google Scholar] [CrossRef]
  39. Yang, G.; Gong, G.; Gui, Q. Exploring the Spatial Network Structure of Agricultural Water Use Efficiency in China: A Social Network Perspective. Sustainability 2022, 14, 2668. [Google Scholar] [CrossRef]
  40. Seok, H.; Barnett, G.A.; Nam, Y. A social network analysis of international tourism flow. Qual. Quant. 2020, 55, 419–439. [Google Scholar] [CrossRef]
  41. Ma, D.; Xiong, H.; Zhang, F.; Gao, L.; Zhao, N.; Yang, G.; Yang, Q. China’s industrial green total-factor energy efficiency and its influencing factors: A spatial econometric analysis. Environ. Sci. Pollut. Res. Int. 2021, 29, 18559–18577. [Google Scholar] [CrossRef] [PubMed]
  42. Santos, L.D.; Vieira, A.C. Tourism and regional development: A spatial econometric model for Portugal at municipal level. Port. Econ. J. 2020, 19, 285–299. [Google Scholar] [CrossRef]
  43. Zhang, F.; Xiao, Y.; Gao, L.; Ma, D.; Su, R.; Yang, Q. How agricultural water use efficiency varies in China—A spatial-temporal analysis considering unexpected outputs. Agric. Water Manag. 2022, 260, 107297. [Google Scholar] [CrossRef]
  44. Bryan, B.A.; Gao, L.; Ye, Y.; Sun, X.; Connor, J.D.; Crossman, N.D.; Stafford-Smith, M.; Wu, J.; He, C.; Yu, D.; et al. China’s response to a national land-system sustainability emergency. Nature 2018, 559, 193–204. [Google Scholar] [CrossRef] [PubMed]
  45. Gao, L.; Bryan, B.A. Finding pathways to national-scale land-sector sustainability. Nature 2017, 544, 217–222. [Google Scholar] [CrossRef]
Figure 1. Spatiotemporal evolution of China’s provincial tourism efficiency ((ad) are the distribution of tourism efficiency in 2008, 2012, 2016 and 2018 respectively).
Sustainability 14 09921 g001
Figure 2. Tourism efficiency zoning map ((a) is the average tourism efficiency zoning map of each province; (b) is the distribution map of tourism efficiency of each province; (c) is the trend chart of tourism efficiency zoning of each province; (d) is the comparison map of tourism efficiency zoning of each province).
Sustainability 14 09921 g002
Figure 3. Spatial correlation networks of China’s provincial tourism efficiency ((ad) are the spatial correlation network diagrams of tourism efficiency in 2008, 2012, 2016 and 2018 respectively).
Sustainability 14 09921 g003
Figure 4. China’s provincial tourism efficiency network density and its correlation during 2008–2018.
Sustainability 14 09921 g004
Figure 5. China’s provincial tourism efficiency network relevance, network grade, and network efficiency during 2008–2018.
Sustainability 14 09921 g005
Table 1. Selected indicators for measuring tourism efficiency.
TypeNameUnitMeaningReference
Input IndicatorsFixed assets investment amountBillionAmount of factor capital investment in tourism industry[12,13,15,16,19,20]
Number of travel agenciesIndividual
Number of star-rated hotelsIndividual
Number of A-rated scenic spotsIndividual
Number of employees in the tertiary sectorTen thousandAmount of labor input
Output IndicatorsTotal Tourism RevenueBillionEconomic benefits generated by tourism flows, which can be converted into tourism capital
Total number of touristsTen thousandAttractiveness of tourist destinations to tourist flows is strong or weak
Table 2. Tourism Efficiency Results for 30 Chinese Provinces and Cities, 2008–2018.
Name20082009201020112012201320142015201620172018Average Value
Beijing11110.9570.8850.7610.8510.7860.7020.8960.894
Tianjin1111110.70111110.973
Hebei0.5290.5370.4380.4810.5350.5060.5780.560.6010.6590.6320.551
Shanxi0.790.7250.5860.610.6990.8120.87611110.827
Inner Mongolia0.4140.4060.3510.3920.3850.4080.4130.5140.4860.5050.5260.437
Liaoning110.8550.9210.9080.9090.7130.6840.7680.6590.7570.834
Jilin0.4910.5120.440.550.5340.5730.4230.6550.6790.6390.6090.555
Heilongjiang0.5610.580.4430.4920.5790.4540.4870.5340.5790.5640.6110.535
Shanghai1111110.9210.9170.8360.9020.961
Jiangsu0.8230.840.7780.8540.80.7450.7640.7560.8120.720.7580.786
Zhejiang111111111111
Anhui0.5720.590.5270.7010.6650.6920.6130.6950.7790.7140.7030.659
Fujian0.6290.6240.570.6360.6260.6160.5670.5980.5690.5790.6640.607
Jiangxi0.7090.7630.5340.5120.5110.5640.6120.7060.8230.7260.7810.658
Shandong0.6810.6850.6140.6590.6240.6150.5140.6060.5450.5770.630.614
Henan0.8630.840.7820.8580.7380.7430.6150.6950.7930.7890.7010.765
Hubei0.4780.5010.4880.6730.7290.7510.5490.7370.7550.6860.6910.64
Hunan0.6520.7040.7380.6850.6780.6630.7030.7140.6540.6660.7020.687
Guangdong0.5970.6370.6790.7330.7510.7680.5870.7460.6750.5750.6650.674
Guangxi0.740.7240.750.6730.6580.6370.6360.6520.5420.5140.5510.643
Hainan0.60.4790.3870.3830.3240.3040.2590.3040.2940.3760.3840.372
Chongqing1111111110.9540.7850.976
Sichuan0.92810.9660.9660.9890.98110.9220.7910.7750.938
Guizhou111111111111
Yunnan0.6610.6040.5820.5450.6190.5810.530.5660.5750.6110.6150.59
Shaanxi111111111111
Gansu0.3150.3380.3150.3480.3610.3790.4070.4480.430.5080.5580.401
Qinghai0.6620.5960.4830.430.2690.280.310.3820.3930.3980.4070.419
Ningxia0.3790.3630.2910.2450.2130.2310.1940.1820.2420.2530.2490.258
Xinjiang0.3710.2920.3450.460.5120.6680.5230.5350.5510.5510.5780.49
Average value0.7150.7110.6650.6940.6890.6920.6420.7040.7060.6850.704
Note: Since data on Tibet, Hong Kong, Macau, and Taiwan are difficult to obtain, 30 provinces and cities in mainland China are used as the scope of the study.
Table 3. The centrality of the spatial correlation network of China’s provincial tourism efficiency in 2018.
ProvincesPoint Degree CentralityProximity CentralityIntermediary Centrality
Degree of Point-OutDegree of Point EntryDegree of Centrality
Beijing5424.13856.8631.93
Tianjin5417.24154.7171.769
Hebei5727.58658.0000.674
Shanxi5420.69055.7693.161
Inner Mongolia7324.13856.8633.095
Liaoning5220.69055.7690.123
Jilin6120.69055.7690.523
Heilongjiang6020.69055.7690.000
Shanghai3210.34551.7860.74
Jiangsu42793.10393.5486.896
Zhejiang41758.62170.7322.889
Anhui3310.34551.7860.875
Fujian5117.24154.7170.212
Jiangxi6624.13856.8635.929
Shandong62482.75985.29416.237
Henan81351.72467.44211.044
Hubei4524.13856.8630.266
Hunan5317.24154.7170.854
Guangdong92172.41474.35928.489
Guangxi4113.79353.7040.173
Hainan2210.34552.7270.028
Chongqing6220.69055.7692.091
Sichuan9834.48360.4175.478
Guizhou7324.13856.8633.327
Yunnan6220.69055.7692.091
Shaanxi8531.03459.1840.689
Gansu10434.48360.4172.227
Qinghai10234.48360.4170.185
Ningxia10334.48360.4171.083
Xinjiang6020.69055.7690.000
Average value5.9675.96730.57559.9693.436
Table 4. China’s provincial tourism efficiency core-peripheral structure analysis results.
CategoryChinese Provinces
Core Members (12)Beijing Tianjin Hebei Shanxi Inner-Mongolia Liaoning Jilin Heilongjiang Shanghai Jiangsu Zhejiang Anhui Fujian Jiangxi Shandong Henan Hubei Hunan Guangdong Chongqing Sichuan Guizhou Yunnan Shaanxi Gansu Qinghai Ningxia Xinjiang
Fringe members (2)Guangxi Hainan
Table 5. China’s provincial tourism efficiency core-edge density matrix.
CategoryCore AreaFringe Area
Core area0.2260.036
Fringe area0.0890.500
Table 6. Estimation and test results of ordinary panel data models.
VariableNo Fixed EffectSpatial Fixed EffectTime Fixed EffectTwo-Way Fixed Effect
PAT0.1352 ***
(5.2154)
0.0545 ***
(2.5458)
0.0989 ***
(3.9040)
0.0608 ***
(2.8228)
URB0.3318 **
(2.1706)
0.5189 *
(1.6705)
0.0140
(0.0897)
0.3560
(1.1402)
TRA0.0809 ***
(2.8139)
0.0576 *
(1.6443)
−0.0231 *
(−0.6994)
0.0965 **
(2.1822)
FIR−0.0913 ***
(−1.9394)
−0.0717 *
(−1.9444)
0.0433
(0.8652)
0.0931
(1.4083)
GMR0.5364 ***
(6.2347)
0.1275 ***
(2.9443)
0.5943 ***
(7.2443)
0.1336 ***
(3.2110)
INV−0.1178 ***
(−4.3200)
−0.0532
(−2.2398)
−0.0060
(−0.1889)
−0.0561 **
(−2.2890)
ENE−0.0005
(−0.0195)
−0.0270
(−0.4390)
−0.0604 **
(−2.2282)
−0.0274
(−0.4452)
R-squared0.41720.85820.48210.8885
Log-L115.0680390.4708135.9534410.1193
DW2.15752.03932.48962.0734
LM-lag12.8753 ***1.02232.8683 *7.6222 ***
Robust LM-lag0.31780.40440.68542.1370
LM-err19.9686 ***0.84236.6059 ***10.2776 ***
Robust LM-err7.4111 ***0.22434.4231 ***4.7924 **
Note: ( ) represents the t-test value. The superscripts *, **, and *** indicate the 10%, 5%, and 1% significance levels, respectively. The model estimation and spatial autocorrelation tests used Matlab 7.12. R-squared is the value of the coefficient of determination of goodness of fit. DW is the autocorrelation test. Log-L is the value of the log-likelihood function. LM-lag is the spatial autoregressive lag variable value. Robust LM-lag is the spatial autoregressive lag model robust value. Lm-err is the spatial autocorrelation error model value. Robust LM-err is the spatial autocorrelation error model robust value.
Table 7. Estimation and test results of the spatial measurement model (two-way fixed effect).
VariableSARSEM
PAT0.0606 ***
(2.9129)
0.0639 ***
(3.2642)
URB0.3976
(1.3152)
0.4024
(1.4405)
TRA0.0860 **
(2.0101)
0.0883 **
(2.0712)
FIR0.1090 *
(1.7061)
0.1224 **
(2.0897)
GMR0.1251 ***
(3.1111)
0.1151 ***
(2.9067)
INV−0.0718 ***
(−3.0256)
−0.0919
(−4.1274)
ENE−0.0153
(−0.2577)
−0.0015
(−0.0259)
W*dep.var−0.2670 ***
(−3.5243)
Spat.aut. −0.3509 ***
(−4.4499)
R-squared0.90690.9017
Log-L414.9080417.6547
Note: W*dep.var is the explained spatial autoregressive term. Spat.aut. is the spatial error term. R-squared is the value of the coefficient of determination of the goodness of fit. Lastly, Log-L is the value of the log-likelihood function. The upper corner marks *, **, *** indicate the significance levels of 10%, 5% and 1%, respectively.
Publisher’s Note: MDPI stays neutral with regard to jurisdictional claims in published maps and institutional affiliations.

