Article

Does Environmental Regulation Improve Carbon Emission Efficiency? Inspection of Panel Data from Inter-Provincial Provinces in China

1
School of Economics and Management, Southwest University of Science and Technology, Mianyang 621010, China
2
School of Environment and Resource, Southwest University of Science and Technology, Mianyang 621010, China
*
Author to whom correspondence should be addressed.
Sustainability 2022, 14(16), 10448; https://doi.org/10.3390/su141610448
Submission received: 23 June 2022 / Revised: 11 August 2022 / Accepted: 17 August 2022 / Published: 22 August 2022
(This article belongs to the Special Issue Development Trends of Environmental and Energy Economics)

Abstract

:
This study aims to analyze the nonlinear relationship between environmental regulation and carbon emission efficiency and provide scientific reference for achieving the goal for carbon neutrality at a lower cost. Taking 30 provinces in China, using dual carbon policy as the research objects, the slacks-based measure–Malmquist–Luenberger (SBM–ML) index method was used to measure the carbon emission efficiency from 2009 to 2019 and a panel threshold regression model was established to explore the nonlinear effects of environmental regulation and carbon emission efficiency in each province. The results show that: (1) during the sample period, there is geographical variability in CEE, with the eastern coastal provinces having the highest CEE, followed by the central and western provinces, and the resource-dependent provinces having the lowest CEE and their energy consumption and utilization efficiency being significantly lower than other provinces; (2) when the energy consumption intensity is used as a threshold variable, the relationship between environmental regulation and carbon emission rate is an inverted “U” shape; and (3) when green technology innovation is used as a threshold variable, the relationship between environmental regulation and carbon emission rate is a “U” shape. This study provides a new perspective for improving carbon emission efficiency.

1. Introduction

Climate change is posing a challenge to sustainable development worldwide. Countries around the world have set carbon peak and carbon neutralization targets to accelerate the low-carbon green transformation of energy and actively address climate change, which is a common global issue [1,2,3]. China has actively declared and promoted the implementation of carbon peak and carbon neutralization targets [4,5] and has committed to reach peak carbon dioxide emissions by 2030. Thus, the Chinese government has successively implemented a series of environmental policies to limit carbon dioxide emission activities to guide the market process through the introduction of environmental regulatory policies and correct the carbon dioxide emission response [1], so as to achieve the goal of sustainable and coordinated development between China’s economic growth and the environment [6,7]. However, scholars still fail to reach a consensus on the necessity and effectiveness of environmental regulation in reducing carbon emissions [8]. Therefore, a scientific assessment and cause analysis of the current stage of carbon emissions and the identification of a reasonable path to reduce emissions in the future have become an urgent issue for academics and politicians. At the same time, it is of great importance to accelerate China’s low-carbon transformation and achieve the carbon peak target at an early date.
As an important evaluation standard of low-carbon economy, carbon emission efficiency is directly related to the degree of coordination between economic growth and sustainable development [9]. Scholars from various countries have carried out research on the impact of carbon emission efficiency in various respects and have achieved fruitful results, among which the influencing factors of carbon emission efficiency are mainly concentrated in countries, provinces, regions, enterprises and industries [10], as shown in Table 1. Studies have confirmed environmental regulation [11,12], energy consumption intensity [13,14,15], green technological innovation [16,17,18], spatial spillover [19], evaluation of influencing factors [20] and the relationship between environmental regulation and carbon emissions [21]. Few studies have studied the relationship between environmental regulation and carbon emission efficiency. The relationship between environmental regulation and sustainable development has always been a controversial topic in academic circles [22] because it affects many important economic development policies.
Environmental regulation, as one of the important policy tools for China to achieve its sustainable development strategy, plays an important role in promoting low-carbon economy and social transformation [30]. Environmental regulation is a kind of restraint ability, which achieves the purpose of protecting the natural environment by controlling and constraining various behaviors of economic entities that pollute the environment. Environmental regulation tools include not only legal and policy tools, such as the formulation of pollutant discharge permits and penalties for polluting enterprises, but also market-based tools, such as pollution rights trading, environmental taxes and environmental subsidies, and voluntary awareness-based tools, such as public supervision and advice. The sample for this article is each province in China and aims to make management recommendations for the government in each province, so we choose to study environmental regulation from the perspective of the government. Previous studies have found that there is spatial heterogeneity in carbon emission efficiency under different levels of environmental regulation and in different regions [2]. This also means that improving carbon emission efficiency is an inevitable trend. How to improve the impact of environmental regulation on carbon emission efficiency has become a research focus. In short, in the context of global carbon peak and carbon neutrality, environmental regulation has become an important means for China to achieve the goal of dual carbon policy, ease the crisis of climate change, address the issue of energy security and improve environmental quality. Provincial development is the core platform of modern economic growth and an important starting point for reducing carbon emissions and improving carbon emission efficiency to realize China’s dual carbon policy. Therefore, the objective of this study is to explore the nonlinear impact of environmental regulation on provincial carbon emission efficiency in China. By comparing the direction and degree of impact under different threshold variables, it can provide a reference for decision making to achieve carbon neutrality at a lower cost.
Therefore, in this paper, 30 provinces in China (except Hong Kong, Macao, Taiwan and Tibet) are selected as the research objects and their carbon emission efficiency from 2009 to 2019 is measured by using the method of the Malmquist–Luenberger index based on slacks-based measure’s directional distance function (SBM–ML). Then, a panel threshold regression model is established with energy consumption intensity and green technology innovation as threshold variables and the relationship and influencing factors of these variables on provincial carbon emission efficiency are analyzed. This will not only provide empirical evidence for optimizing the low-carbon green transition path and fulfilling the goal of carbon neutrality, but also provide policy recommendations for low-carbon development research in developing countries under the dual carbon goal (Figure 1).

2. Literature Review

2.1. Environmental Regulation

Environmental regulation (ER) mainly refers to the institutional arrangement in which the government restrains public behavior by means of policies and regulations, economic measures and market mechanisms, in order to protect the environment [15]. There are two main methods to measure environmental regulation. One is the single-index method, such as pollutant emission [31], emission fee [32] and the proportion of environmental protection input to GDP [33]. These indicators are pollution-control cost indicators, which reflect the intensity of environmental regulation; that is, the higher the cost of pollution control, the greater the intensity of environmental regulation. Anyone of them can be used to represent environmental regulation constraints. The other is the composite index method. The comprehensive index of environmental regulation can be constructed by five single indexes, namely, wastewater discharge compliance rate, sulfur dioxide removal rate, solid waste, comprehensive utilization rate, soot removal rate and dust removal rate [34]. This comprehensive index reflects the effect and level of environmental regulation.
The research on environmental regulation in academic circles mainly focuses on the “Paradox of Green”. Sinn [30] developed the concept of the “Paradox of Green”, arguing that the more carbon taxes there are, the higher the resource owners’ expectations of future resource tax increases, thus, increasing short-term extraction and accelerating global warming. Grafton’s [35] analysis of U.S. carbon emissions data from 1981 to 2011, which concluded that biofuel subsidies would increase fuel extraction rates and carbon emissions and would also confirm the “Paradox of Green”. Others deny the existence of “Paradox of Green “, with academics arguing that governments can limit corporate emissions by setting strict emission standards [36]. At the same time, technological innovation based on environmental regulations also contributes to the realization of energy conservation and emission reduction targets [37]. In addition, Zhang’s [21] research shows that there is an inverse “U” relationship between environmental regulation and carbon emissions. Only when a certain threshold is crossed will the impact of environmental policies on carbon emissions change from positive to negative. This kind of research believes that the influence of environmental regulation is nonlinear, which is different from the first two views.

2.2. Carbon Emission Efficiency

Carbon Emission efficiency (CEE) is a complex concept, involving economy, environment, region and other factors, which is defined by academia from perspectives of single factor and total factor at present. Defining from the perspective of single-factor mainly refers to measuring carbon emission efficiency from three single-factor indicators, namely, carbon productivity [38], carbon index [39] and carbon emission intensity [40]. The calculation of carbon emission efficiency index from the single-factor perspective is simple and easy to understand, but the contribution of other factors is ignored. Therefore, scholars begin to define carbon emission efficiency from the perspective of total factor. For example, Zaim and Taskin [41], on the basis of taking carbon emissions as an undesirable output, put forward a comprehensive evaluation index of carbon emissions to explore carbon emission efficiency.
Defining from this perspective refers to measuring carbon emission efficiency from the total-factor perspective and can be measured by stochastic frontier analysis (SFA) and data envelopment analysis (DEA), both of which have different characteristics. SFA is a parameter based on regression analysis and its estimated results depend upon the setting of production function. For example, Jin, Kim [42] and Wang et al. [43] all adopted the SFA method to calculate carbon emission efficiency in different countries and industries. DEA is a non-parameter without the assumption of the form of production function in advance. In the current study on carbon emission efficiency, most scholars regard carbon emissions as undesired output and use the improved DEA model to calculate and evaluate the efficiency. The slacks-based measure (SBM) model proposed by Tone [44] is a further improvement on the traditional model. It not only considers the influence of input and output slack variables on production efficiency but also correctly distinguishes the quality of output. On this basis, Gao et al. [45] extended the input–output model to the field of environmental economics, estimated China’s carbon emission efficiency by using the SBM model and measured the calculated carbon emission efficiency and the direct carbon emission efficiency, respectively.

2.3. Green Technological Innovation

“Green technology” puts all the technologies, crafts or products that can achieve energy saving and emission reduction together [46]. Scholars interpret the concept of green technology innovation mainly from two aspects. Firstly, based on the whole process of production, the connotation of green technology innovation is summarized by describing the process from a systematic perspective. According to the Organization for Economic Co-operation and Development (OECD), green technology innovation refers to the creative behavior of developing or improving new products, crafts and marketing methods, without the purpose of improving the environment. Secondly, based on the characteristics of innovation, green technology innovation is defined by summarizing its main characteristics [47]. James et al. [48] defined green technology innovation as a new product or process that simultaneously reduces industrial pollution, improves the profits and increases the vitality from a microscopic perspective.
The existing literature research on green technology innovation is from two perspectives. Firstly, from the perspective of management innovation, scholars combine green technology innovation with industry development and they believe that green technology innovation plays a crucial role in the sustainable development of the industry. They have explored the impact of green technology innovation on the environment through manufacturing [17], industrial industry [49] and other industries. Secondly, from the perspective of technical innovation, Wang et al. [50] explored the inhibition effect and path of informal environmental regulation on air pollution based on the panel data of 285 Cities in China from 1998 to 2018.

2.4. Energy Consumption Intensity

Energy consumption intensity refers to the amount of energy consumed per unit of economic output. Higher energy consumption intensity means that producing a unit of output requires more energy consumption, which is a manifestation of low energy efficiency. However, lower energy consumption intensity means less energy consumption and high energy efficiency to produce one unit of output. Energy consumption intensity varies in regions, industries and years. Linwang [51] discovered that China’s energy intensity decreased considerably during 2000–2016. From the perspective of regional differences, countries with higher Gross Domestic Product (GDP) and smaller population tend to have lower energy intensity values [52] and the energy intensity in inland areas is usually higher than that in coastal areas [21].
The important goal of energy conservation and emission reduction [53] is to reduce the energy consumption intensity in the production process. Starting with the factors affecting energy consumption intensity, scholars studied the impact of some factors, including industrialization intensity, opening up [54], relative energy price [55], total-factor productivity [56], technological improvement [57] and other factors. The result shows that these factors as opening up, technological innovation and so on can improve the energy consumption intensity of a region, while the increase in relative energy prices and economic growth based on the increase in total-factor productivity will reduce the energy intensity.

3. Research Methods and Data

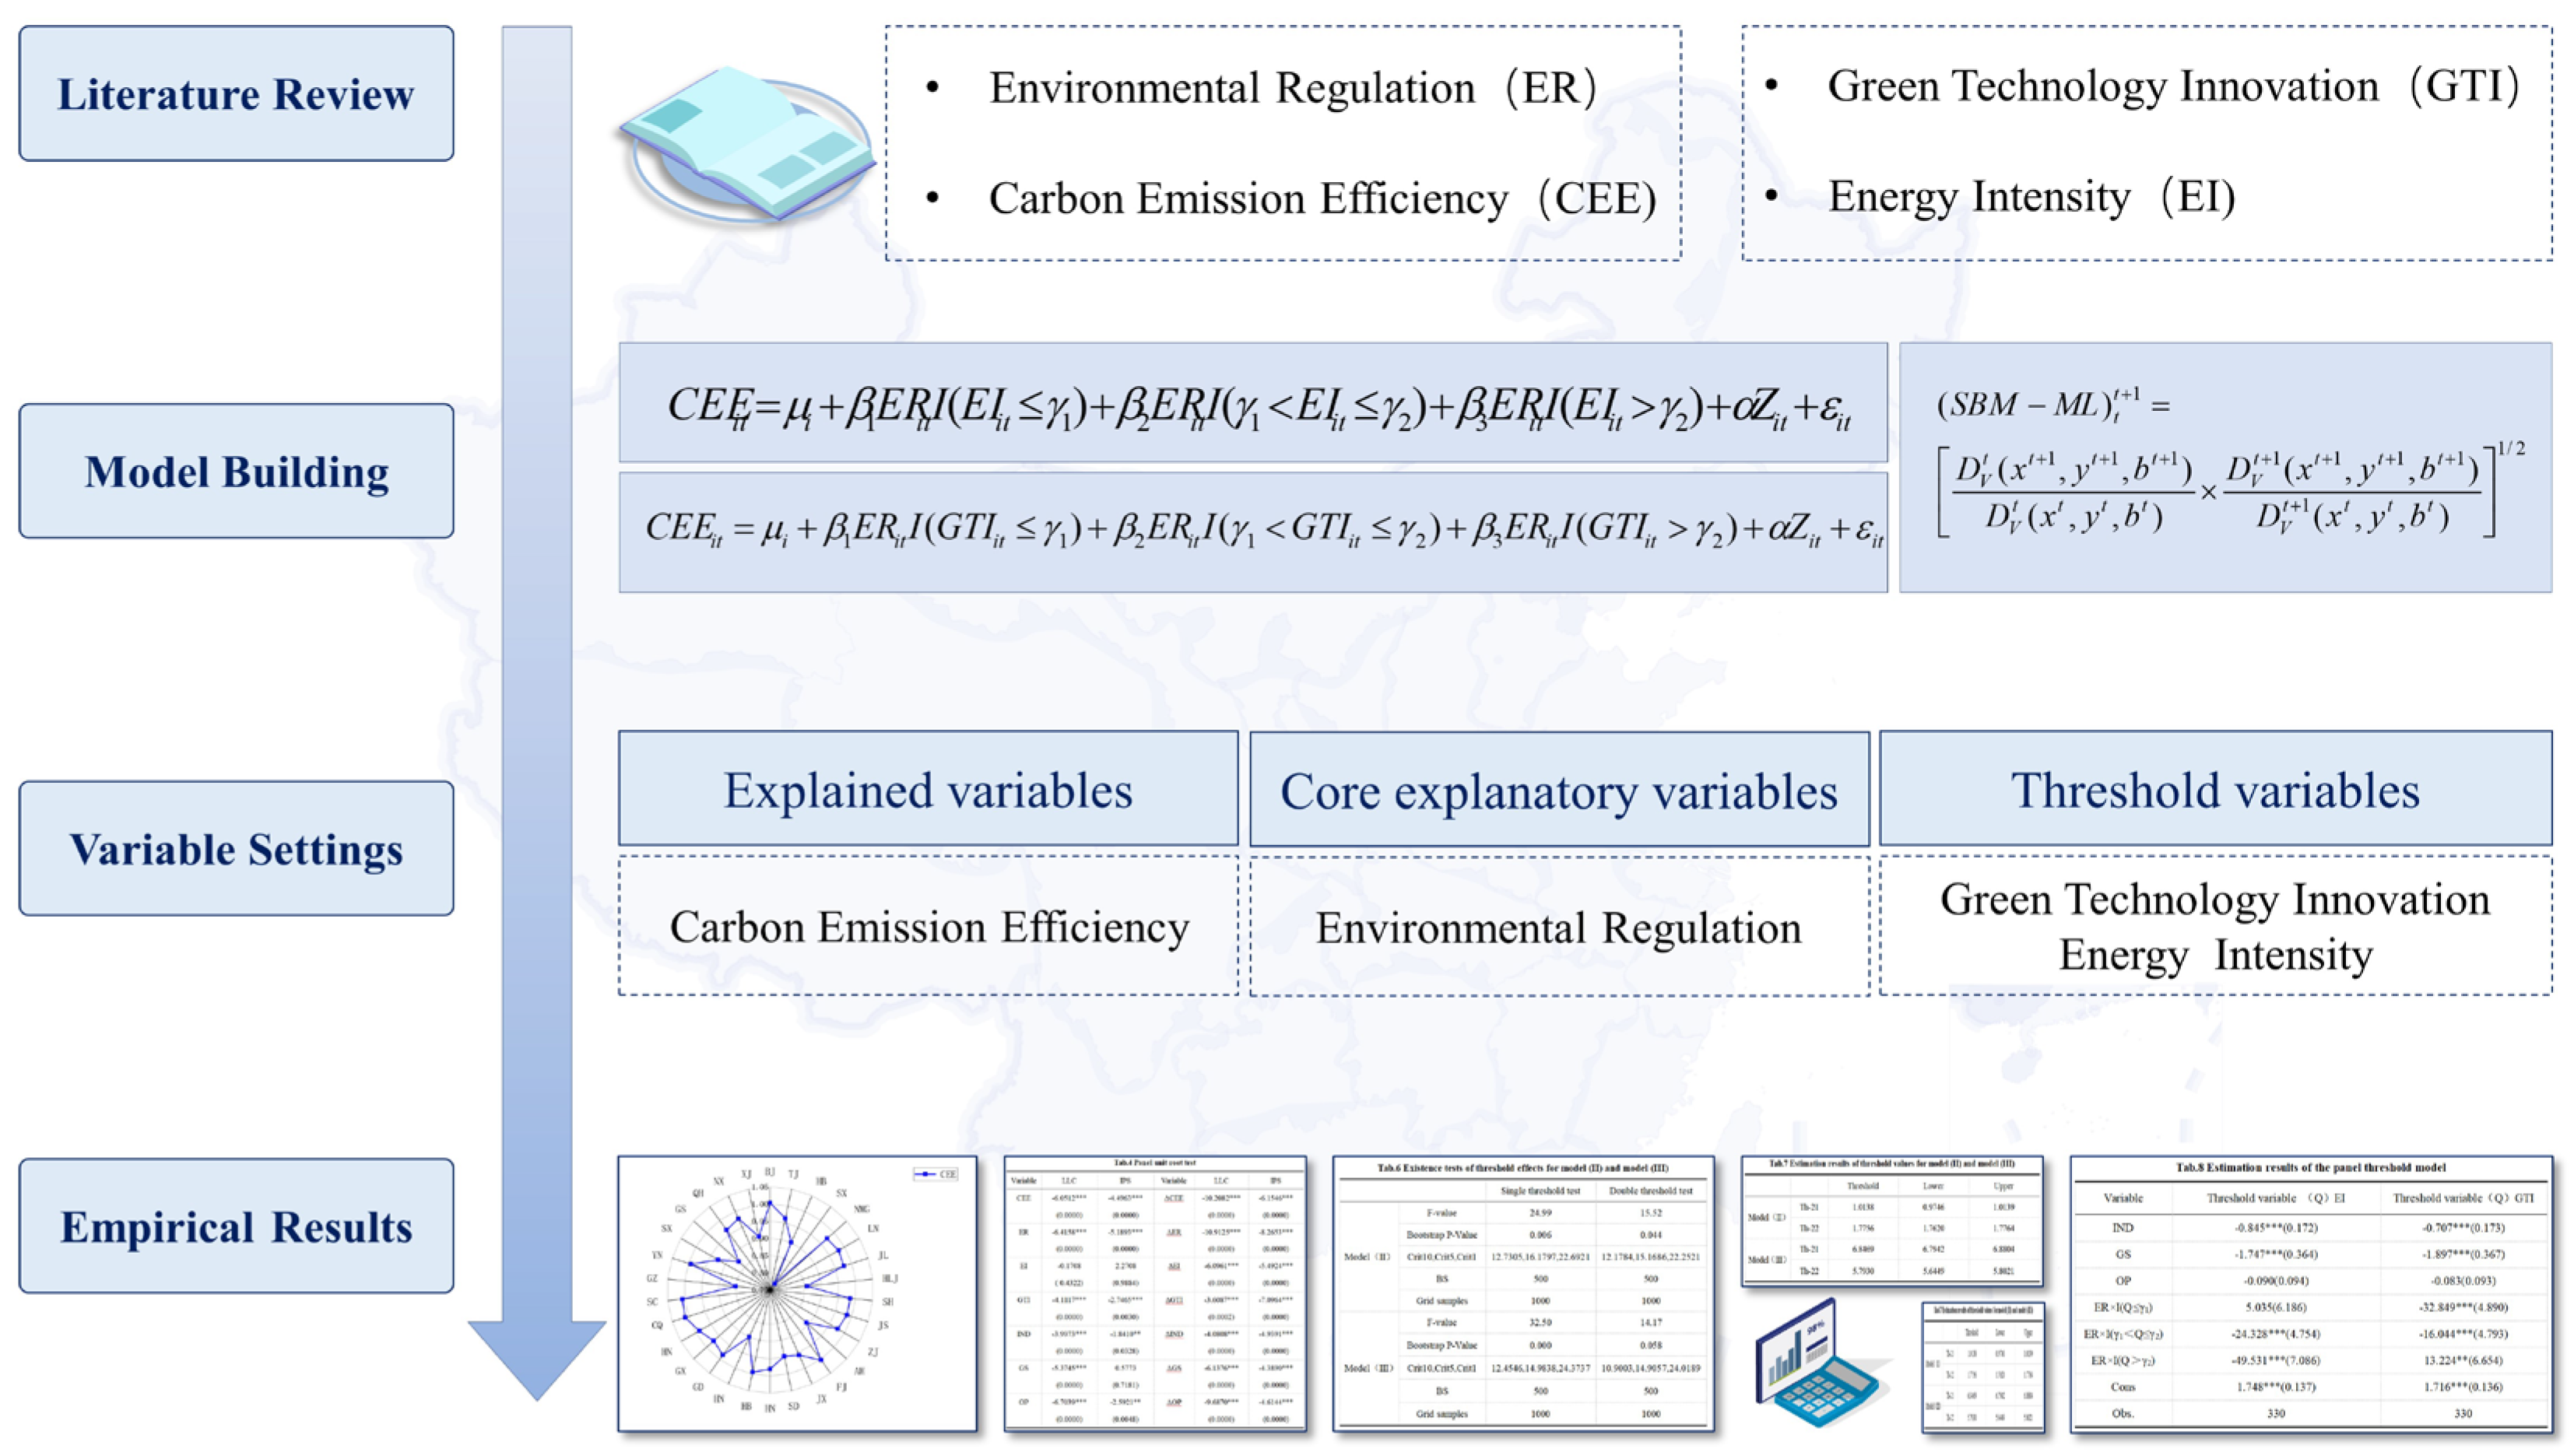
3.1. Panel Threshold Model

Threshold regression model is a nonlinear econometric model, which estimates the significance of parameters to divide the sample group by the estimated threshold value. Hansen proposed a panel data threshold regression model based on the static panel threshold model. By combining the regression model and the piecewise function, threshold variables are set into it to estimate and test the threshold value and threshold effect [58]. The panel threshold model avoids the randomness of traditional panel regression in grouping. It determines the threshold number endogenously by the number of samples and estimates the threshold value and tests its significance according to the characteristics of samples. This helps to overcome the bias of the supervisor in setting the structural mutation point. In order to explore the nonlinear effect of environmental regulation on carbon emission efficiency, this paper introduces carbon emission efficiency, environmental regulation and related threshold variables and this paper introduces a series of control variables to avoid the estimation bias caused by missing variables and, finally, constructs the following panel threshold model:
C E E i t = μ i + β 1 E R i t I ( Q i t γ 1 ) + β 2 E R i t I ( γ 1 < Q i t γ 2 ) + β 3 E R i t I ( Q i t > γ 2 ) + α Z i t + ε i t
where, i represents province, t represents Year, C E E i t represents carbon emission efficiency, E R i t represents environmental regulation, β 1 , β 2 and β 3 are regression coefficients, Q i t is threshold variable and γ 1 , γ 2 is threshold value to be estimated. I ( ) is indicative function, taking 1 when there is a threshold value and taking 0 when there is no threshold value. μ i is characteristics value of the observed value, Z i t is control variable, α is control variable coefficients and ε i t is stochastic disturbance. Equation (1) is a double-threshold model. If there is no estimate γ 1 < Q i t γ 2 in the middle, it is a single-threshold model.
Taking energy consumption intensity and green technology innovation as threshold variables, this paper discusses the nonlinear relationship between environmental regulation and carbon emission efficiency and constructs a double-threshold model [24,28], which is specifically expressed as Model (2) and Model (3). Model (2) takes energy consumption intensity (EI) as the threshold variable and Model (3) takes green technology innovation (GTI) as the threshold variable.
C E E i t = μ i + β 1 E R i t I ( E I i t γ 1 ) + β 2 E R i t I ( γ 1 < E I i t γ 2 ) + β 3 E R i t I ( E I i t > γ 2 ) + α Z i t + ε i t
C E E i t = μ i + β 1 E R i t I ( G T I i t γ 1 ) + β 2 E R i t I ( γ 1 < G T I i t γ 2 ) + β 3 E R i t I ( G T I i t > γ 2 ) + α Z i t + ε i t

3.2. Variable Setting

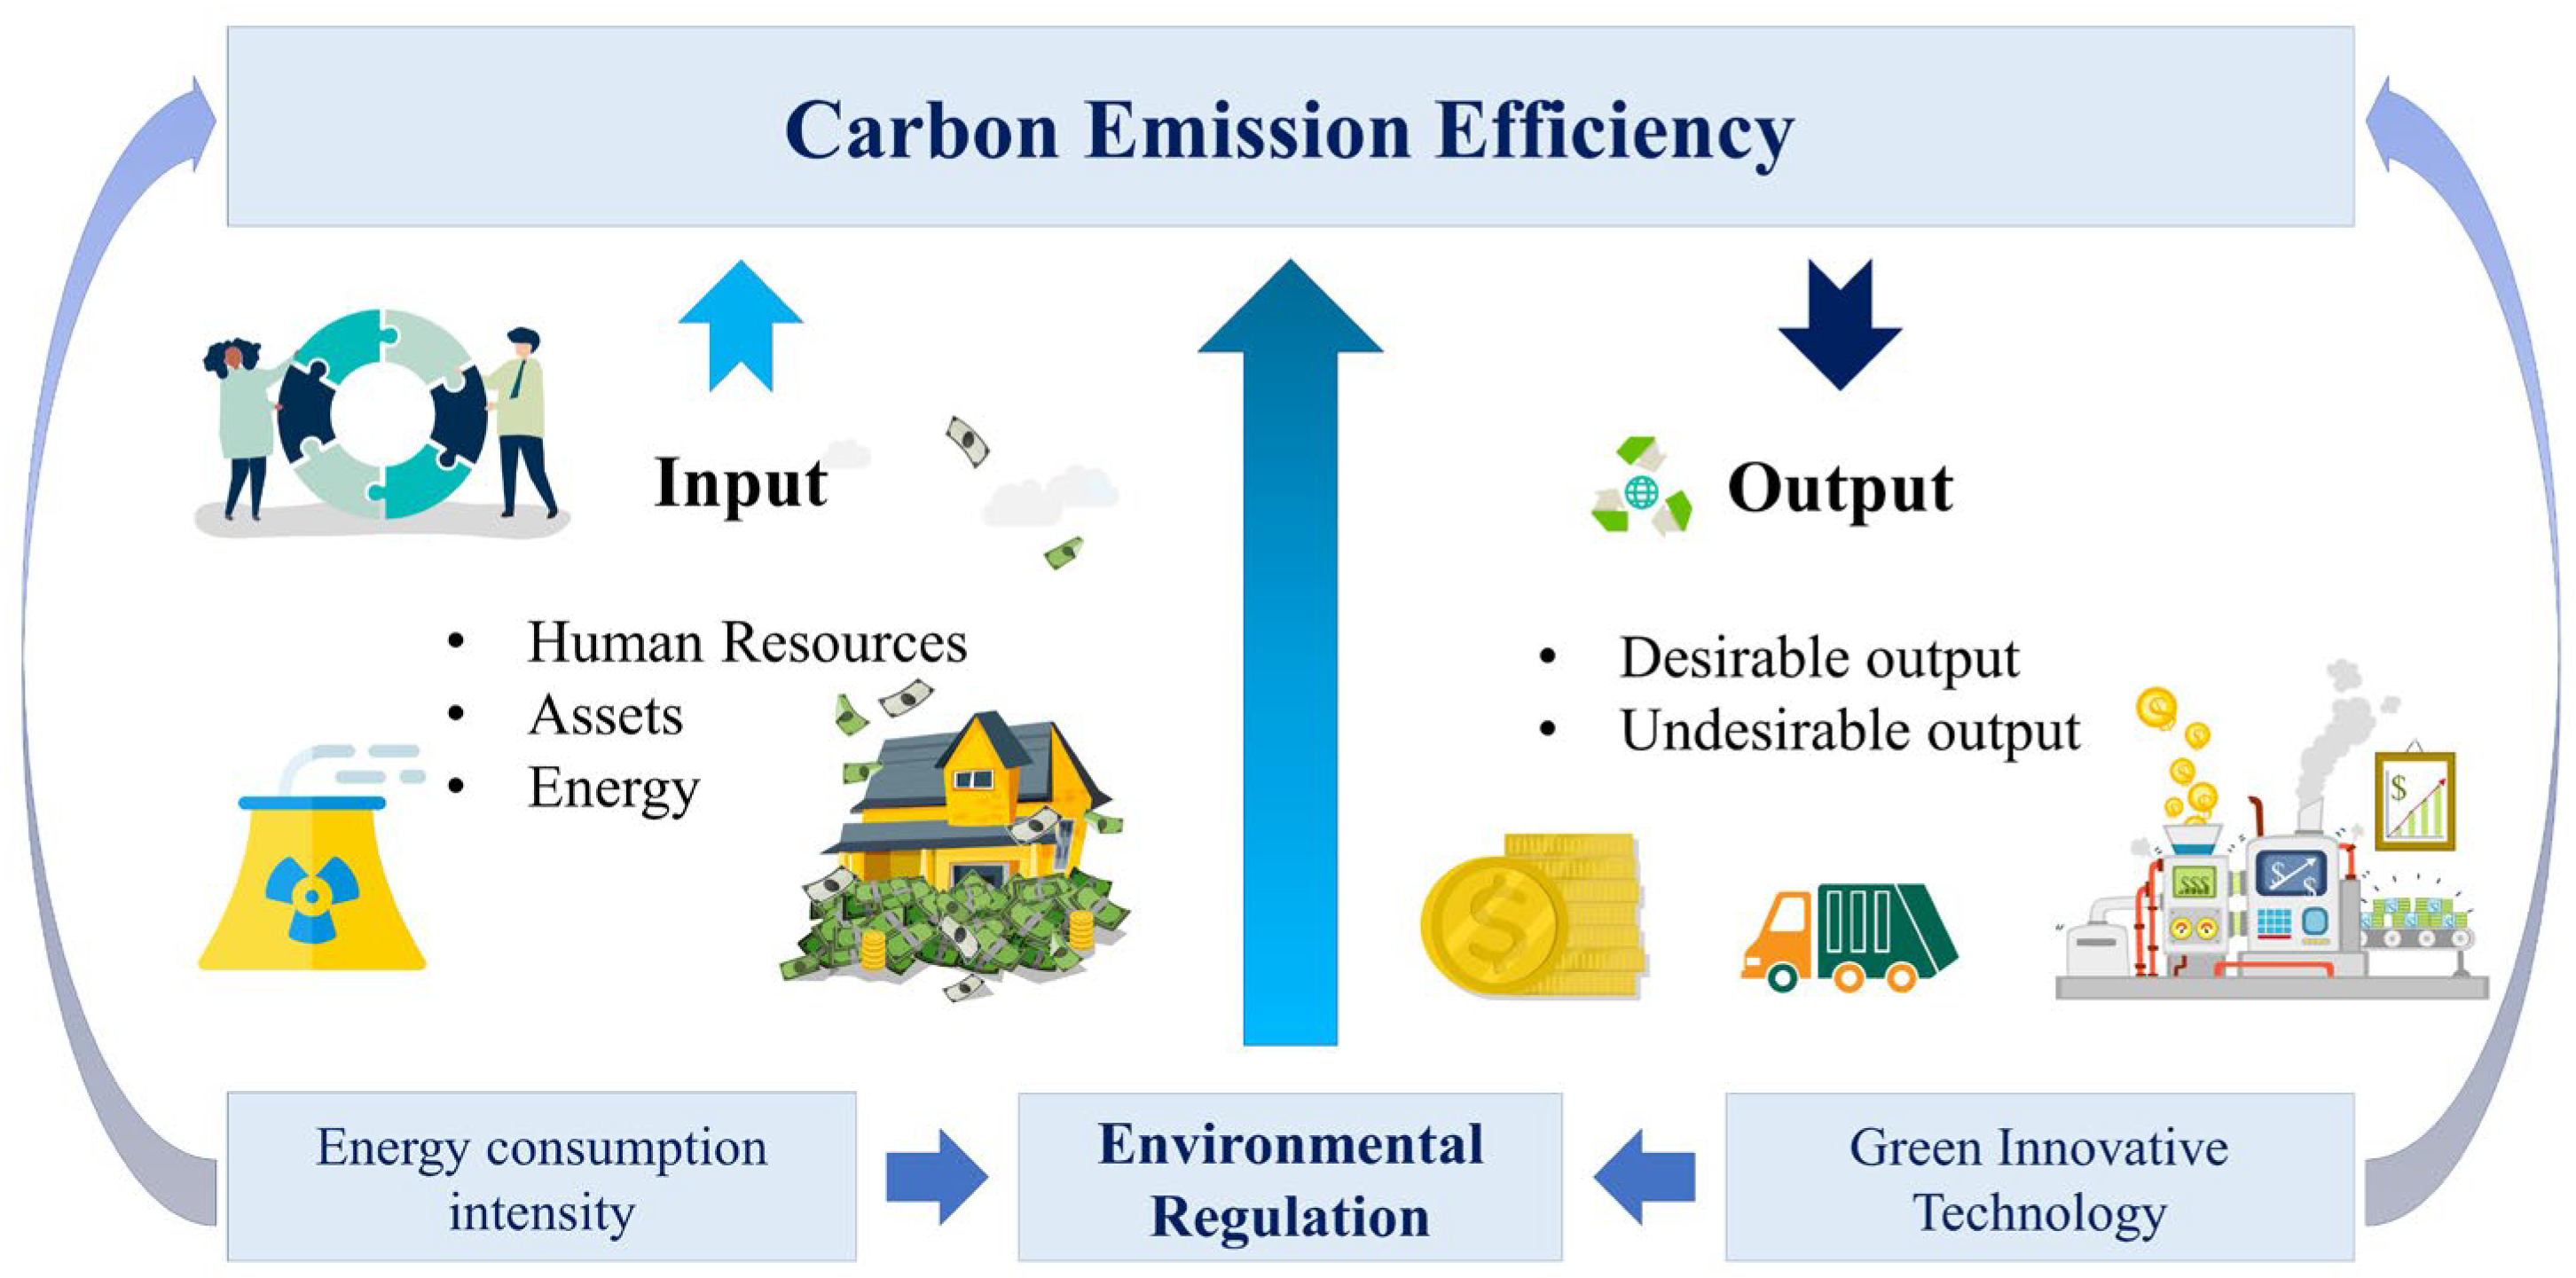
3.2.1. Explained Variable: Carbon Emission Efficiency (CEE)

DEA method is widely used in efficiency measurement but in the traditional DEA, it is difficult to distinguish good from bad output, that is, it can not correctly deal with bad output. The SBM direction distance model proposed by Tone is a further improvement on the traditional model [44]. It not only considers the impact of input and output relaxation variables on production efficiency, but also correctly distinguishes the quality of output. On this basis, this paper introduces the concept of intertemporal dynamics, adopts the SBM–ML index model containing undesirable output and measures China’s provincial carbon emission efficiency under the condition of variable return to scale [59]. In this paper, each province is taken as the production decision-making unit. Assuming that each province has N inputs X = x 1 , x 2 , , x n R + N , which can produce Q 1 desirable outputs Y = y 1 , y 2 , , y n R + Q 1 and Q 2 undesirable outputs B = b 1 , b 2 , , b n R + Q 2 . Under the condition of variable returns to scale, each province contains the possible set of desirable outputs and undesirable outputs P t ( x ) = y t , b t in the year t , then the SBM directional distance function of the province i in the year t is:
D V t x i t , y i t , b i t = ρ ^ = min ( 1 1 N n = 1 N s n x x n i 1 + 1 Q 1 + Q 2 q 1 = 1 Q 1 s q 1 y y q 1 i + q 2 = 1 Q 2 s q 2 b b q 2 i ) s . t . i = 1 I z i t y i , q 1 t s q 1 y = y i , q 1 t , q 1 = 1 , 2 , , Q 1 i = 1 I z i t x i , n t + s n x = x i , n t , n = 1 , 2 , , N i = 1 I z i t b i , q 2 t + s q 2 b = b i , q 2 t , q 2 = 1 , 2 , , Q 2 i = 1 I z i t = 1 , z i t 0 , s q 1 y 0 , s n x 0 , s q 2 b 0 , i = 1 , 2 , , I
where min ( ) is minimum function value and ρ ^ ’s numerator and denominator, respectively, represent the average distance between input and output and the production frontier. s n x , s q 1 y , s q 2 b denote the slack variable, respectively, and z i t is weight vector. Further, the SBM–ML index for two consecutive years t and t + 1 is constructed as follows:
( S B M M L ) t t + 1 = D V t ( x t + 1 , y t + 1 , b t + 1 ) D V t ( x t , y t , b t ) × D V t + 1 ( x t + 1 , y t + 1 , b t + 1 ) D V t + 1 ( x t , y t , b t ) 1 / 2
where S B M M L > 1 means an increase in carbon emission efficiency and S B M M L < 1 means a reduction in carbon emission efficiency.
According to the existing literature [25,60], this paper selects the number of urban employments in each province from 2008 to 2019 as labor input, adopts the perpetual inventory method [61] to account for the fixed capital stock in each province as capital input, considers the depreciation of fixed capital stock with a depreciation rate of 9.6% and selects the total energy consumption as energy input; the desirable output is expressed with regional GDP, which is calculated and adjusted to real GDP using 2008 as the base period and the undesirable output is expressed with carbon dioxide emissions, which is calculated with reference to the estimation method of the IPCC Guidelines for National Greenhouse Gas Emission Inventories, 2006 edition. The definitions of input and output variables are detailed in Table 2.
In Formula (6), K i t denotes the fixed capital stock of province i in period t, I i t represents the fixed capital investment of province i in period t and δ i t represents the depreciation rate. In Formula (7), R j t denotes the consumption of the No. j energy in period t, δ j denotes the standard energy consumption conversion factor corresponding to the No. j energy and α j represents the carbon emission factor corresponding to the energy source.

3.2.2. Core Explanatory Variable: Environmental Regulation

There is no unified standard for the measurement of environmental regulation in the existing literature and some scholars measure it from the perspective of the intensity of environmental regulation. Morgenstern uses industry pollution reduction investment as a measure of environmental regulation [62] and Liu adopts the relative index of the proportion of industrial pollution control investment in the added value of the secondary industry to measure environmental regulation [63]. Considering that this paper studies the impact of environmental regulation on the efficiency indicator, carbon emission efficiency, this paper chooses the proportion of industrial pollution control investment in the added value of the secondary industry to measure this indicator.

3.2.3. Threshold Variable

(1)
The energy consumption intensity is measured by the proportion of the total energy consumption of each province in the regional GDP. This indicator is a negative indicator; that is, the higher the economic development level of a region and the more reasonable the industrial structure, the lower its energy consumption intensity and the higher the economic and ecological losses [64].
(2)
The green technology innovation indicator uses the sum of the number of environmentally friendly inventions and utility models obtained by each province, allowing it to measure the technological innovation of a province in saving resources, reducing pollution and achieving clean production, reflecting the overall level and scale of green technology innovation activities in a region.

3.2.4. Controlled Variable

Referring to related research results, industrial structure, government scale and openness are included as controlled variables in the analysis model to avoid the estimation bias caused by missing variables.
(1) Industrial structure is applied to measure the proportion of industrial added value in regional GDP. The secondary industry is a carbon-emission-intensive industry. The larger the proportion of the secondary industry, the more obvious the scale effect of carbon emissions. Therefore, the evolution of the industrial structure is closely related to the total-factor carbon emission efficiency. (2) Government scale is adopted to measure the proportion of government fiscal expenditure in GDP. Fiscal policies in different regions will promote the transfer and upgrading of the industrial structure, which will affect the carbon emission efficiency of each region. (3) Openness is included to measure the proportion of total imports and exports in GDP. Opening to the outside world is often accompanied by technology transfer and pollution emissions. Improvements in the level of opening to the outside world will inevitably lead to the transfer of international carbon emissions (Figure 2).

3.3. Data Source

According to the availability of data, 30 provinces (Tibet, Hong Kong, Macao and Taiwan are excluded because of incomplete data) responding to the dual carbon policy in China are selected as the research samples and the relevant data from 2008 to 2019 are selected to calculate the carbon emission efficiency of each province. The calculation data are from the China Statistical Yearbook and the China Energy Statistical Yearbook; the data of environmental regulation (ER), green technology innovation (GTI), energy consumption intensity (EI), industrial structure (IND), government scale (GS) and openness (OP) are from China Statistical Yearbook (2009–2019), China Energy Statistical Yearbook (2009–2019), IPCC 2006 and CNRDS database. The descriptive statistical results of each variable are shown in Table 3. In order to alleviate heteroscedasticity, logarithmic transformation is carried out for green technological innovation. Table 4 shows the correlation coefficient and multicollinearity test results among the variables, which illustrates the significant correlation between variables and shows that the maximum VIF value is 3.18, a number far less than 10, indicating that there is no multicollinearity.

3.4. Panel Unit Root Cointegration Test Results

In order to avoid spurious regression, a unit root test was conducted on the panel data to increase the stability of the data. The LLC test and IPS test were used for the unit root test in this paper and the results are shown in Table 5. From the results, it is clear that some of the variables in the original values have unit roots, indicating that the data are non-stationary, but all the variables are significant after first-order difference test, indicating that the variables are first-order stationary.
The unit root test shows that the data are first-order integration. Therefore, the cointegration test is conducted in this paper to verify the long-term cointegration relationship between variables and the results are shown in Table 6. The results show that the original hypothesis is rejected at the level of 1% significance after passing the Kao test and Pedroni test, which shows that there is a cointegration relationship between variables.

4. The Empirical Test

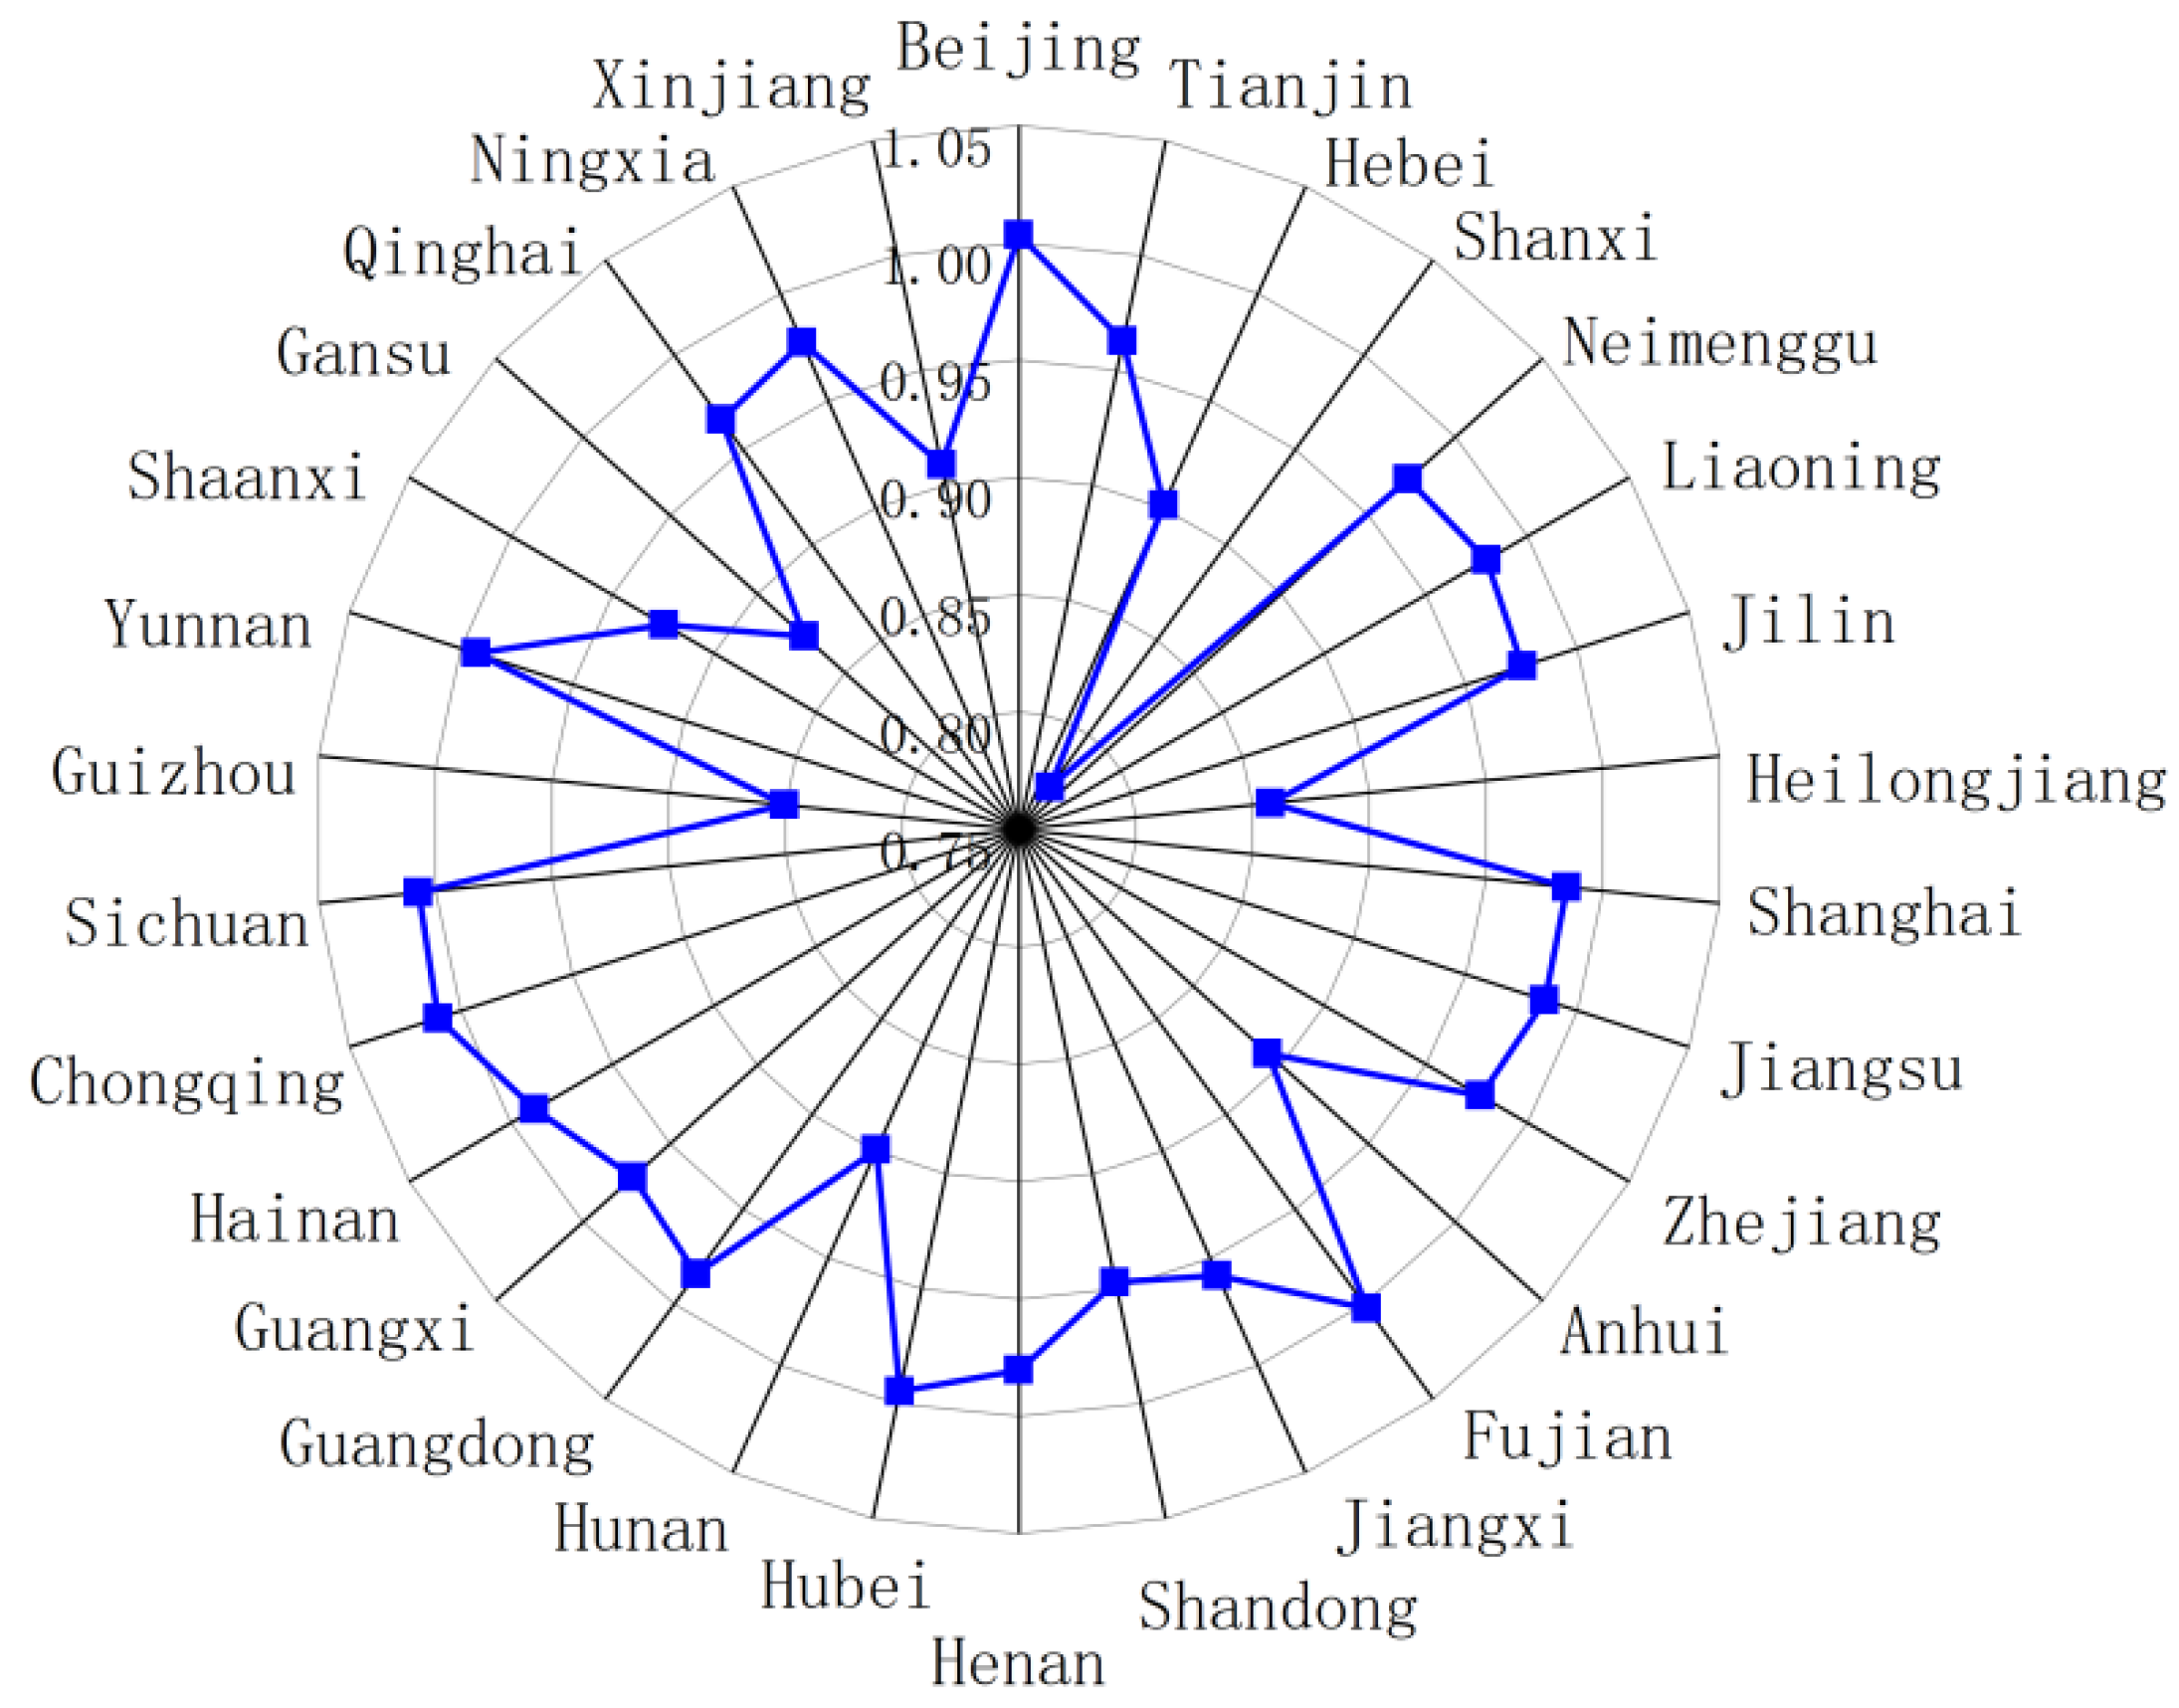
4.1. Analysis of Carbon Emission Efficiency Results

According to Formula (4) to (7), the carbon emission efficiency of 30 provinces in China (except Tibet, Hong Kong, Macau and Taiwan) from 2009 to 2019 is calculated and the average carbon emission efficiency of each province is compared; the results are shown in Figure 3. Most of the top-ten regions in carbon emission efficiency are coastal regions, such as Beijing, Fujian, Hainan, Jiangsu, Shanghai and Guangdong. With a high economic development level and reasonable energy utilization, these regions obtain more desirable outputs with less inputs. Provinces with middle-level carbon emission efficiency are mostly distributed in Central, Western and Northeastern China, such as Hebei, Henan, Anhui, Hunan, Shaanxi, Jilin, Liaoning, Inner Mongolia, Qinghai, Guangxi and other regions, which have a lower energy utilization rate than the eastern coastal regions in the process of economic development. At the same time, these areas have taken over the transfer of heavy polluting industries from the eastern region to promote local economic development. At the bottom of the list, in terms of carbon emission efficiency, are regions, such as Gansu, Heilongjiang, Guizhou and Shanxi, which are China’s major resource provinces. These regions have advantages in resources, such as coal and oil, but this also leads to their high energy consumption intensity and low carbon emission efficiency.

4.2. Results of Panel Threshold Regression Analysis

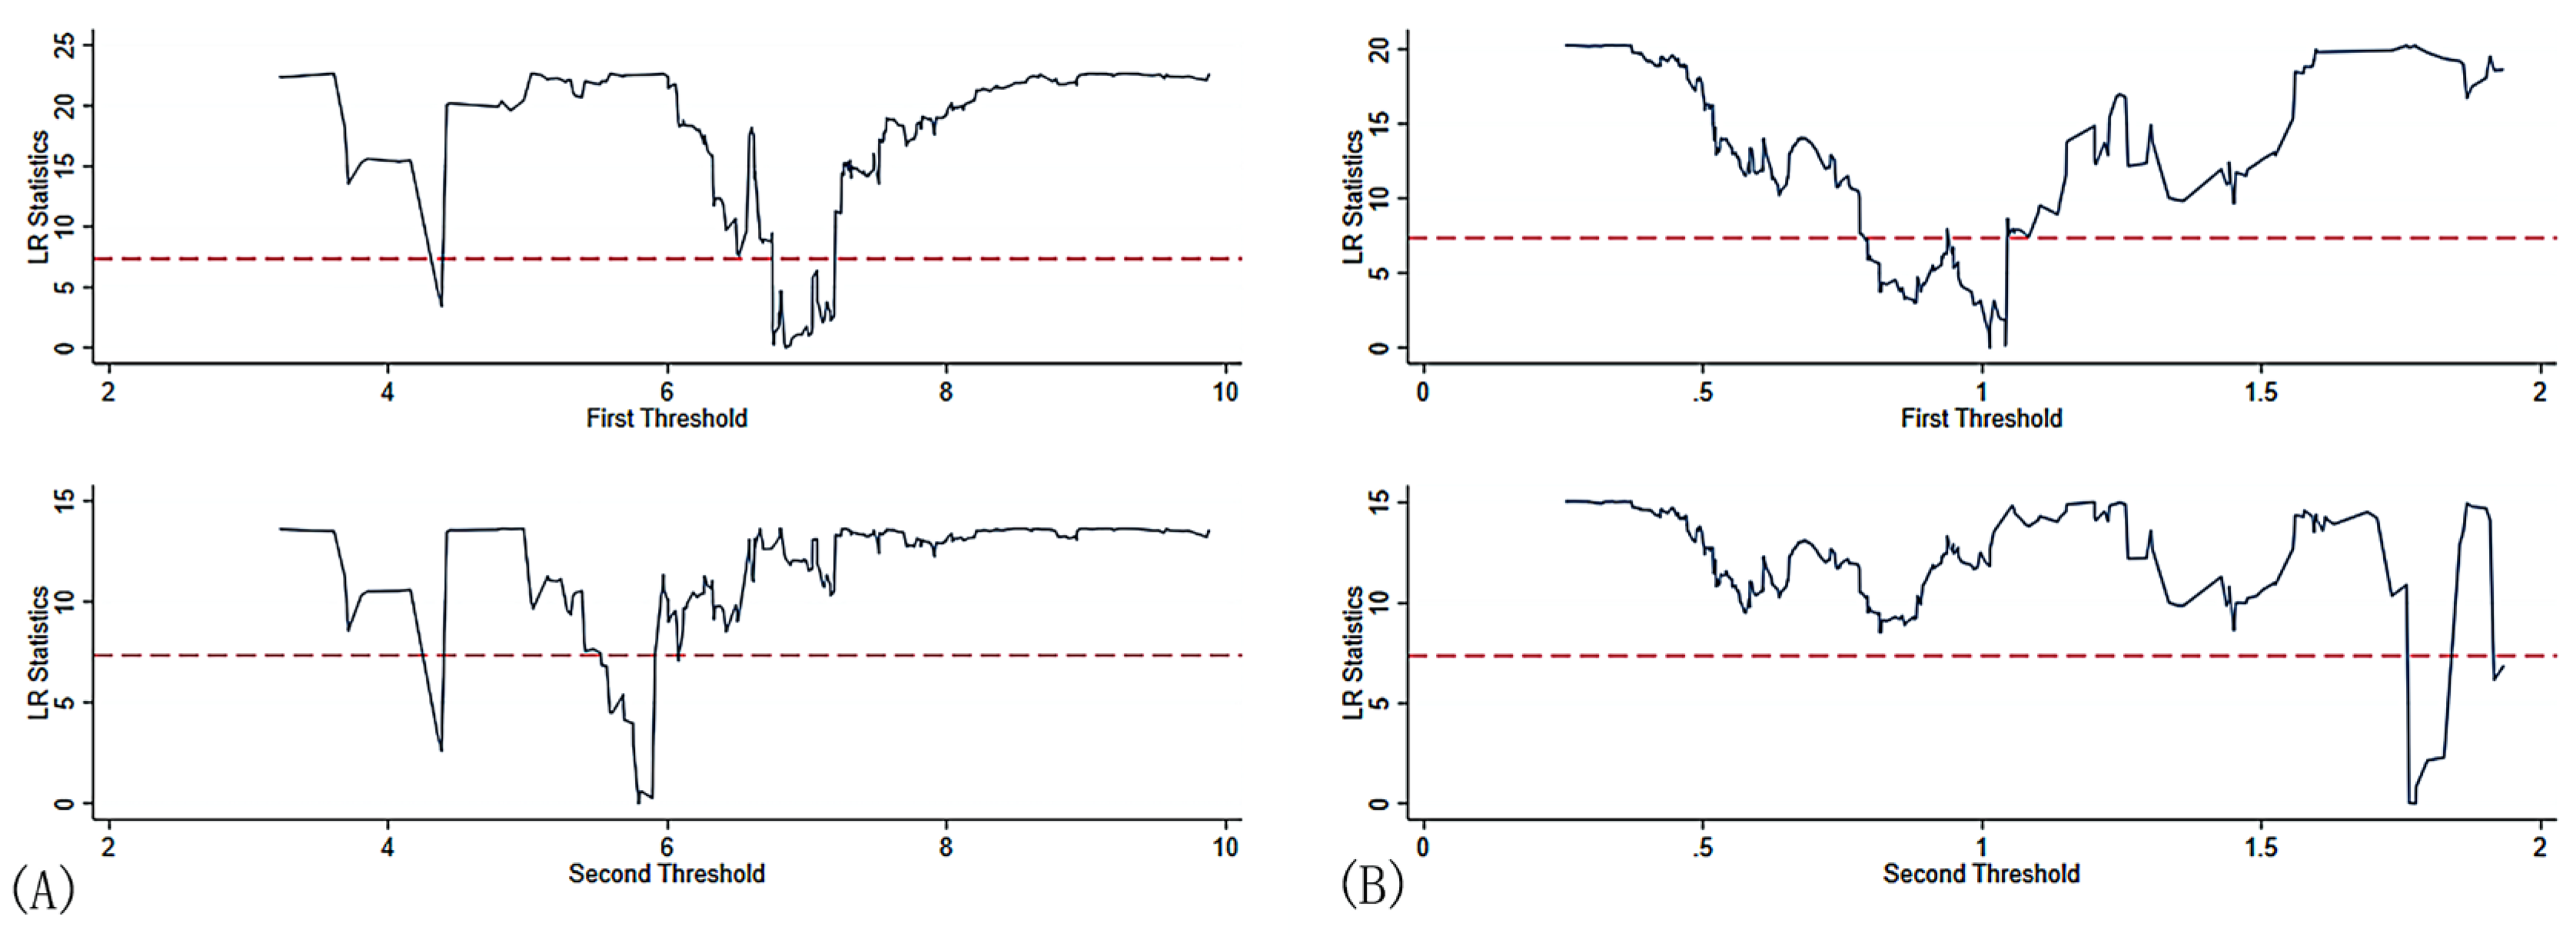
4.2.1. Threshold Effect Test

According to Model (2) and Model (3), the effect of environmental regulation on carbon emission efficiency was tested with energy consumption intensity and green technology innovation as threshold variables, respectively. First, the threshold value was estimated and significance test was conducted. The results are shown in Table 7. From the table, it can be seen that the p value of the single-threshold test in Model (2) is 0.006 (0.006 < 0.01), which indicates that there is a single-threshold effect. Then, the double-threshold test was carried out and the p value of the double-threshold test was 0.044 (0.044 < 0.05), which indicates that there is a double-threshold effect in Model (2). Similarly, the p value of the double-threshold test for Model (3) is 0.058 (0.058 < 0.01), indicating that there is a double-threshold effect for Model (3). Furthermore, Figure 4A,B, respectively, show the LR plots of the double-threshold estimation with energy intensity and green technology innovation as threshold variables and Table 8 shows the results of threshold value and the confidence intervals (at 95% level). The confidence intervals of the four thresholds are relatively narrow, which can further prove the significant threshold effect, indicating that there is a nonlinear relationship between environmental regulations and carbon emission efficiency in each province.
The estimation results of the threshold effect show that the energy consumption intensity of coastal regions, such as Beijing, Shanghai, Guangdong, Zhejiang and Jiangsu, has been below the first threshold value from 2009 to 2019 in the sample of this paper. Yunnan, Sichuan, Henan, Hebei, Hunan, Chongqing and Heilongjiang were below the first threshold value in 2009–2011 and Gansu and Guizhou were also below the first threshold value in 2014–2015, which indicates that these regions are constantly improving their energy utilization efficiency. Shanxi and Qinghai were below the second threshold value from 2010 to 2014, while Ningxia’s energy consumption intensity has been higher than the second threshold value, which indicates that these regions pay attention to energy utilization efficiency. From 2009 to 2019, the capability of green technology innovation in Beijing, Shanghai, Guangdong, Shandong, Zhejiang and Jiangsu was above the second threshold value, while central and western regions, such as Sichuan, Chongqing, Henan, Hebei, Hunan and Hubei, broke through the second threshold value in 2010–2012. The western regions, such as Yunnan, Inner Mongolia, Guizhou and Gansu, broke through the second threshold in 2015–2018. It indicates that these regions attach great importance to the role of green technology innovation and continuously improve their own capabilities in this respect. Ningxia, Qinghai and Hainan broke the first threshold value in 2016–2018, indicating that the green technology innovation capacity of these three provinces needs to be improved.

4.2.2. Estimation Results

Table 9 reports the effect of environmental regulation on carbon emission efficiency in different threshold intervals for Model (2) and Model (3), respectively. As Table 8 shows, there is a nonlinear relationship between environmental regulation and carbon emission efficiency in each province in China. This influence relationship is varied because of external conditions. For provinces with energy consumption intensity below the first threshold value of 1.0138, their environmental regulations can promote carbon emission efficiency, but they cannot pass the significance test. When the energy consumption intensity exceeds the first threshold value, environmental regulation plays an inhibitory role. When the energy consumption intensity exceeds the second threshold value of 1.7756, the inhibitory effect of environmental regulation intensifies and the estimated coefficient decreases from −24.328 to −49.531; for provinces whose green technology innovation capability is below the first threshold value of 5.7930, their environmental regulation suppresses carbon emission efficiency improvement. When the innovation capability breaks the first threshold value, the inhibition effect of environmental regulation weakens and the estimated coefficient increases from −32.849 to −16.044. When the innovation capability breaks the second threshold value of 6.8469, the estimated coefficient of environmental regulation rises from negative to positive and the significance level decreases.

4.3. Robustness Test

To ensure the reliability of the threshold regression analysis results, a fixed effects model with interaction terms is considered to test the robustness of the results. The interaction term robustness test involves the following two models:
C E E i t = μ i + β 1 E R i t + β 2 ( E R i t × E I i t ) + α Z i t + ε i t
C E E i t = μ i t + β 1 E R i t + β 2 ( E R i t + G T I i t ) + α Z i t + ε i t
In Model (8) and Model (9), the interaction terms of energy consumption intensity and environmental regulation, green technology innovation and environmental regulation are added into the general regression model, respectively, which are control variables, and a fixed effect model with interaction terms is established. The test results are shown in Table 10. After the interaction term between energy consumption intensity and environmental regulation is added into Model (8), the total influence coefficient of environmental regulation on carbon emission efficiency is “26.432–36.843EI”, indicating that when energy consumption intensity is low, environmental regulation promotes carbon emission efficiency. When energy consumption intensity increases to a certain extent, environmental regulation restrains carbon emission efficiency and with a further increase in energy consumption intensity, the inhibition effect is strengthened, which is consistent with the conclusion of Model (2). After the interaction between green technology innovation and environmental regulation is added into Model (9), the total influence coefficient of environmental regulation on carbon emission efficiency is “−85.160–11.059GTI”, indicating that when the green technology innovation capability is low, environmental regulation inhibits carbon emission efficiency, but with a further increase in energy consumption intensity, the inhibition effect is weakened. When the green technology innovation capacity is improved to a certain extent, environmental regulation promotes carbon emission efficiency, which is consistent with the conclusion of Model (3). Through the test of two groups of interactive terms, it is proved that the result of the threshold regression model is robust.

5. Discussion

Most of the existing studies focus on the impact of environmental regulation and carbon emissions, but in the context of climate change, carbon emission efficiency can reflect the coordinated relationship between economic growth and carbon emissions [65]. Scholars have also paid attention to the study of carbon emission efficiency. After verification, the research results of this paper are applicable to all provinces in China and provide scientific basis for improving carbon emission efficiency in Chinese provinces [28]. Specifically, the paper analyzes the carbon emission efficiency of China’s 30 provinces. This paper also discusses the nonlinear relationship between environmental regulation and carbon emission efficiency, focusing on the three findings below.
Firstly, by establishing the input–output index system, this paper measures the carbon emission efficiency of 30 provinces in China from 2009 to 2019 by using the SBM–ML index method and compares the average value of 30 provinces, which is consistent with the research conclusions of Lan and Wang [11]. The eastern coastal regions, such as Beijing, Fujian, Jiangsu, Shanghai and Guangdong, transferred energy-consuming and high- polluting industries to the central and western regions and they improve the efficiency of human resource, capital, as well as energy utilization and carbon emission. In order to promote their economic development, Hebei, Henan, Anhui, Hunan and Shaanxi have taken over the industrial transfer from eastern regions. However, this method ignores carbon emissions to some extent, increasing their undesirable output. The carbon emission efficiency of these regions is lower than that of eastern coastal regions, while regions, such as Shanxi, Guizhou, Gansu and Heilongjiang, are rich in miner and petroleum resources and their residents use mineral and petroleum resources as their businesses. As a result, their energy consumption intensity is high and industrial transformation is difficult, so the carbon emission efficiency of these regions is relatively low.
Secondly, the change in energy consumption intensity affects the carbon dioxide emissions and also the regional carbon emission efficiency. Few studies have explored the impact of energy consumption intensity on the relationship between environmental regulation and carbon emission efficiency. Therefore, this paper establishes a panel thresh- old model using energy consumption intensity as a threshold variable to carry out the study. The results find that the energy consumption intensity in 13 regions, Shanghai, Beijing, Guangdong, Jiangsu, Zhejiang, Fujian, Shandong, Shaanxi, Anhui, Jiangxi, Hainan, Guangxi and Hainan, was below the first threshold value of 1.0138 from 2009 to 2019. These regions are relatively energy deficient and are actively pursuing the “dual control” goal and their environmental regulations contribute to carbon emission efficiency. However, it does not pass the significance test as the energy consumption intensity in these regions seems to have remained low during the sample period, and the intensity of environmental regulations and carbon emission efficiency have little relationship with energy consumption intensity. The effect of environmental regulations on carbon emission efficiency changed from negative to positive during the sample period in 11 regions: Hebei, Liaoning, Jilin, Heilongjiang, Henan, Hubei, Hunan, Chongqing, Sichuan, Yunnan and Gansu. These regions took over the industrial transfer from Eastern China and increased energy consumption intensity in earlier years, but in recent years, they have continued to pay attention to the control and utilization of energy consumption while promoting economic growth. Shanxi, Qinghai and Guizhou are ahead of other regions in terms of total energy consumption and more difficult industrial transformation, but they still control energy consumption and actively explore industrial optimization and transformation, and the inhibiting effect of their environmental regulations on carbon emission efficiency diminishes during the sample period. Due to high energy consumption and slow economic growth, as well as the ineffective implementation of the “dual control” policy, Ningxia’s energy consumption intensity has always exceeded the second threshold, while Inner Mongolia and Xinjiang are located between the first and second thresholds, whose environmental regulations will inhibit improvements in carbon emission efficiency and Ningxia’s inhibiting effect is even stronger.
Thirdly, green technology innovation capability refers to a technology, process or product that can promote carbon emission reduction, which is an important factor affecting carbon emission efficiency. In order to explore the influence of green technology innovation on the relationship between environmental regulation and carbon emission efficiency, this paper establishes a panel threshold model, with green technology innovation as a threshold variable to conduct the study. The results find that Hainan, Qinghai and Ningxia actively respond to the policy of green low-carbon transition. Nevertheless, due to the lack of talent, capital, technology and other innovation resources, their green technology innovation only broke through the first threshold in 2015–2017 and the negative influence of their environmental regulation on carbon emission efficiency weakened. Seven provinces, Shanxi, Inner Mongolia, Guangxi, Guizhou, Yunnan, Gansu and Xinjiang, have continuously improved their green technology systems and policies and their green technology innovation capabilities have significantly improved and optimized their carbon emission efficiency. The impact of environmental regulations on carbon emission efficiency in these regions has turned from negative to positive. The 12 central and northeastern provinces, Tianjin, Hebei, Jilin, Heilongjiang, Anhui, Fujian, Henan, Hubei, Hunan, Chongqing, Sichuan and Shaanxi, broke through the second threshold earlier. The impact of environmental regulations on carbon emission efficiency in these regions was achieved earlier from inhibition to promotion in the context of green transformation in key supported industry sectors, drawing on the experience of coastal regions and using their own excellent innovative resources to enhance capacity. Beijing, Shanghai, Guangdong, Shandong, Jiangsu, Zhejiang and Liaoning focus on green technology innovation capability to achieve sustainable development and on using technology innovation to achieve carbon emission efficiency at a lower cost and their regional environmental regulations have promoted carbon emission efficiency.

6. Conclusions

This paper analyzed the impact of environmental regulation on provincial carbon emission efficiency through relevant data from 30 provinces. The concept and related theories are explained and considered. Through empirical analysis, the author finds that different energy consumption intensity and green technology innovation capability have a double-threshold effect on provincial carbon emission efficiency, at levels of 5% and 10%, respectively. In general, there is a nonlinear relationship between environmental regulation and carbon emission rate in each province. When considering the external condition of energy consumption intensity, the relationship between environmental regulation and carbon emission efficiency would be shown as an inverted “U” shape. When the external conditions of green technology innovation are considered, the relationship between environmental regulation and carbon emission efficiency would be shown as a “U” shape. This further verifies the view of some scholars that the impact of environmental regulation on carbon emission efficiency is uncertain and China still needs to find the appropriate intensity of environmental regulation to maximize the role of environmental regulation.

6.1. Policy Implications

Based on the analysis results, this paper offers the following suggestions.
Firstly, China should improve the efficiency of human resource, capital and energy and further implement laws on carbon emissions. Provinces in Central, Western and Northeast China have formulated measures to introduce talent. They advocate local enterprises to make full use of capital resources and encourage enterprises to actively implement the “dual control” policy of energy consumption to improve the utilization efficiency of various resources. At present, China lacks regulations on “Undesirable Output”, that is, carbon dioxide emissions, so Chinese provinces can regulate carbon dioxide emissions by improving laws and policies, which will help provinces to further constrain their own behavior and take measures to achieve emission reduction.
Secondly, all regions in China should continuously reduce their own energy consumption intensity and, at the same time, adjust the intensity of environmental regulation accordingly, so as to effectively exert the positive effect of environmental regulation on carbon emission efficiency. Sichuan, Chongqing, Hunan, Hubei and other central and western regions have accelerated industrial upgrading and transformation. These regions actively promote the transformation of labor-intensive and resource-intensive industries to technology-intensive and capital-intensive industries and continue to encourage the development of low-carbon green industries. Gansu, Qinghai, Xinjiang and many other provinces can combine regional advantages to develop wind and solar energy to reduce energy consumption. Decision makers in these regions should continue to seek to reduce the intensity of regional energy consumption, while strengthening the intensity of environmental regulation accordingly, so as to have a positive impact on carbon emission efficiency and seek a coordinated path between regional economic benefits and environmental pollution. The coastal areas of East China should continue to maintain low energy consumption, strengthen support for sustainable development in industrial sectors and continuously strengthen environmental regulation to improve carbon emission efficiency.
Thirdly, Chinese provinces should strengthen their green technology innovation capabilities and determine the intensity of environmental regulation according to their own green technology innovation levels. The central and western provinces with weak green technology innovation capabilities should actively promote the green transformation of industries, attach importance to and support the development of emission reduction technologies, advocate clean energy and actively promote green environmental protection technologies. With improvements in green technology innovation capabilities, provinces should appropriately strengthen the intensity of environmental regulation to play a positive role in carbon emission efficiency and, at the same time, use green technology to reduce unnecessary expenditure in environmental regulation and increase carbon emission efficiency at a low cost. The eastern coastal areas with strong green technology innovation capabilities should continue to break through the high level of green technology innovation, continue to strengthen environmental regulations and improve carbon emission efficiency.

6.2. Outlook and Deficiencies

In this paper, there are still some areas that need to be further improved. Firstly, although the applicability of this study to Chinese provinces has been validated, it is necessary to test whether the conclusions are applicable to different industries and different countries. In future studies, sample data from other countries or a wider range of industries can be collected to explore the general impact mechanism of environmental regulation on carbon emission efficiency. Secondly, environmental regulation can be measured from two aspects: intensity and effect. Different types or different measurement standards may have completely different impacts on carbon emission efficiency. However, this study only considers the impact of the intensity of environmental regulation on carbon emission efficiency. Future studies may measure environmental regulation from different angles to further improve the impact mechanism of environmental regulation on carbon emission efficiency.

Author Contributions

Data curation, P.J., M.L., Y.Z. (Yuhan Zhang), R.J. and X.L.; Formal analysis, Y.Z. (Yuting Zhao) and X.G.; Project administration, L.L.; Supervision, L.L.; Writing—original draft, P.J. and M.L.; Writing—review & editing, L.L. All authors have read and agreed to the published version of the manuscript.

Funding

This research was funded by the Strategic Research and Consulting Project of the Chinese Academy of Engineering (Project Numbers: 2021-XY-16), the National Natural Science Foundation of China (Project Numbers: 72004188) and the Sichuan Provincial Science and Technology Program Projects (Project Numbers: 2022JDR0177).

Institutional Review Board Statement

Not applicable.

Informed Consent Statement

Not applicable.

Data Availability Statement

Not applicable.

Conflicts of Interest

The authors declare no conflict of interest.

References

  1. IPCC Working Group. Global Warming of 1.5 °C; Technical Report; IPCC: Incheon, Korea, 2018. [Google Scholar]
  2. Climate Change 2021: The Physical Science Basis, Intergovernmental Panel on Climate Change Working Group I Contribution to the Sixth Assessment Report. Available online: https://www.ipcc.ch/report/ar6/wg1/resources/press (accessed on 14 June 2022).
  3. Informed Debate on Energy and Climate Change. Available online: https://eciu.net/netzerotracker (accessed on 14 June 2022).
  4. Xi, J. Address to the General Debate of the Seventy-Fifth Session of the United Nations General Assembly. Peoples Daily, 23 September 2020; 3. [Google Scholar] [CrossRef]
  5. Xi Jinping’s Speech at the Climate Ambition Summit. Available online: http://www.xinhuanet.com/politics/leaders/2020-12/12/c_1126853600.htm (accessed on 14 June 2022).
  6. Ikram, M.; Mahmoudi, A.; Shah, S.Z.A.; Mohsin, M. Forecasting Number of ISO 14001 Certifications of Selected Countries: Application of Even GM (1,1), DGM, and NDGM Models. Environ. Sci. Pollute Res. 2019, 26, 12505–12521. [Google Scholar] [CrossRef] [PubMed]
  7. Ngo, T.Q. How Do Environmental Regulations Affect Carbon Emission and Energy Efficiency Patterns? A Provincial-Level Analysis of Chinese Energy-Intensive Industries. Environ. Sci. Pollute Res. 2022, 29, 3446–3462. [Google Scholar] [CrossRef] [PubMed]
  8. Xu, Q.; Zou, Z.; Chen, Y.; Wang, K.; Du, Z.; Feng, J.; Ding, C.; Bai, Z.; Zang, Y.; Xiong, Y. Performance of a Novel-Type of Heat Flue in a Coke Oven Based on High-Temperature and Low-Oxygen Diffusion Combustion Technology. Fuel 2020, 267, 117160. [Google Scholar] [CrossRef]
  9. Xu, L.; Fan, M.; Yang, L.; Shao, S. Heterogeneous Green Innovations and Carbon Emission Performance: Evidence at China’s City Level. Energy Econ. 2021, 99, 105269. [Google Scholar] [CrossRef]
  10. Guo, C.X. Decomposition of China’s CARBON Emissions: Based on LMDI Method. China Popul. Resour. Environ. 2010, 20, 4–9. [Google Scholar]
  11. Lan, H.; Wang, L.-Y. Research on Regional Carbon Emission Performance and Environmental Regulation Threshold Effect under Green Development—Based on SE-SBM and Double Sill Panel Model. Soft Sci. 2019, 33, 71–81+101. [Google Scholar]
  12. Liu, L.; Jiang, J.; Bian, J.; Liu, Y.; Lin, G.; Yin, Y. Are Environmental Regulations Holding Back Industrial Growth? Evidence from China. J. Clean Prod. 2021, 306, 127007. [Google Scholar] [CrossRef]
  13. Zhang, S.; Wang, Y.; Hao, Y.; Liu, Z. Shooting Two Hawks with One Arrow: Could China’s Emission Trading Scheme Promote Green Development Efficiency and Regional Carbon Equality? Energy Econ. 2021, 101, 105412. [Google Scholar] [CrossRef]
  14. Cleff, T.; Rennings, K. Determinants of Environmental Product and Process Innovation. Eur. Environ. 1999, 9, 191–201. [Google Scholar] [CrossRef]
  15. Ren, S.; Li, X.; Yuan, B.; Li, D.; Chen, X. The Effects of Three Types of Environmental Regulation on Eco-Efficiency: A Cross-Region Analysis in China. J. Clean. Prod. 2018, 173, 245–255. [Google Scholar] [CrossRef]
  16. Xu, S.-C.; Li, Y.-F.; Zhang, J.-N.; Wang, Y.; Ma, X.-X.; Liu, H.-Y.; Wang, H.-N.; Tao, Y. Do Foreign Direct Investment and Environmental Regulation Improve Green Technology Innovation? An Empirical Analysis Based on Panel Data from the Chinese Manufacturing Industry. Environ. Sci. Pollute Res. 2021, 28, 55302–55314. [Google Scholar] [CrossRef]
  17. Liu, J.; Zhao, M. Does Environmental Regulation Promote Green Technology Innovation in Chinese Manufacturing? Open Access Libr. J. 2020, 7, 1–16. [Google Scholar] [CrossRef]
  18. Du, M.; Antunes, J.; Wanke, P.; Chen, Z. Ecological Efficiency Assessment under the Construction of Low-Carbon City: A Perspective of Green Technology Innovation. J. Environ. Plan. Manag. 2022, 65, 1727–1752. [Google Scholar] [CrossRef]
  19. Du, Q.; Deng, Y.; Zhou, J.; Wu, J.; Pang, Q. Spatial Spillover Effect of Carbon Emission Efficiency in the Construction Industry of China. Environ. Sci. Pollute Res. 2022, 29, 2466–2479. [Google Scholar] [CrossRef]
  20. Wang, S.; Zeng, J.; Liu, X. Examining the Multiple Impacts of Technological Progress on CO2 Emissions in China: A Panel Quantile Regression Approach. Renew. Sustain. Energy Rev. 2019, 103, 140–150. [Google Scholar] [CrossRef]
  21. Bian, Y.; Ping, H.; Hao, X. Estimation of Potential Energy Saving and Carbon Dioxide Emission Reduction in China Based on an Extended Non-Radial DEA Approach. Energy Policy 2013, 63, 962–971. [Google Scholar] [CrossRef]
  22. Manral, L. An Evolutionary Theory of Demand-Side Determinants of Strategy Dynamics. Manag. Res. Rev. 2018, 41, 314–344. [Google Scholar] [CrossRef]
  23. Teng, X.; Liu, F.; Chiu, Y. The Change in Energy and Carbon Emissions Efficiency after Afforestation in China by Applying a Modified Dynamic SBM Model. Energy 2021, 216, 119301. [Google Scholar] [CrossRef]
  24. Li, S.; Ma, Y. The Effect of Environmental Regulation on the Factorization of Total Factor Carbon Emission Efficiency—Based on the Threshold Effect. J. Shanxi Univ. Finance Econ. 2019, 41, 50–62. [Google Scholar] [CrossRef]
  25. Xie, Z. How Technological Progress Affects the Carbon Emission Efficiency? Evidence from National Panel Quantile Regression. J. Clean. Prod. 2021, 307, 127133. [Google Scholar] [CrossRef]
  26. Zhang, R.; Tai, H.; Cheng, K.; Zhu, Y.; Hou, J. Carbon Emission Efficiency Network Formation Mechanism and Spatial Correlation Complexity Analysis: Taking the Yangtze River Economic Belt as an Example. Sci. Total Environ. 2022, 841, 156719. [Google Scholar] [CrossRef] [PubMed]
  27. Shi, X.; Xu, Y. Evaluation of China’s Pilot Low-Carbon City Program: A Perspective of Industrial Carbon Emission Efficiency. Atmos. Pollute Res. 2022, 13, 101446. [Google Scholar] [CrossRef]
  28. Dong, F.; Li, Y.; Gao, Y.; Zhu, J.; Qin, C.; Zhang, X. Energy Transition and Carbon Neutrality: Exploring the Non-Linear Impact of Renewable Energy Development on Carbon Emission Efficiency in Developed Countries. Resour. Conserv. Recycl. 2022, 177, 106002. [Google Scholar] [CrossRef]
  29. Niu, H.; Zhang, Z.; Xiao, Y.; Luo, M.; Chen, Y. A Study of Carbon Emission Efficiency in Chinese Provinces Based on a Three-Stage SBM-Undesirable Model and an LSTM Model. Int. J. Environ. Res. Public. Health 2022, 19, 5395. [Google Scholar] [CrossRef]
  30. Sinn, H.-W. Public Policies against Global Warming: A Supply Side Approach. Int. Tax Public Financ. 2008, 15, 360–394. [Google Scholar] [CrossRef]
  31. Trumpp, C.; Guenther, T. Too Little or Too Much? Exploring U-Shaped Relationships between Corporate Environmental Performance and Corporate Financial Performance. Bus. Strategy Environ. 2017, 26, 49–68. [Google Scholar] [CrossRef]
  32. Guo, R.; Yuan, Y. Different Types of Environmental Regulations and Heterogeneous Influence on Energy Efficiency in the Industrial Sector: Evidence from Chinese Provincial Data. Energy Policy 2020, 145, 111747. [Google Scholar] [CrossRef]
  33. Zhang, L.; Wang, Q.; Zhang, M. Environmental Regulation and CO2 Emissions: Based on Strategic Interaction of Environmental Governance. Ecol. Complex. 2021, 45, 100893. [Google Scholar] [CrossRef]
  34. Wang, J.; Duan, R.; Sun, X. Environmental Regulation, Product Quality and Chinese Firms’ Upgrading in Global Value Chain. Ind. Econ. Res. 2019, 2, 64–75+101. [Google Scholar] [CrossRef]
  35. Grafton, R.Q.; Kompas, T.; Long, N.V.; To, H. US Biofuels Subsidies and CO2 Emissions: An Empirical Test for a Weak and a Strong Green Paradox. Energy Policy 2014, 68, 550–555. [Google Scholar] [CrossRef]
  36. Zhao, X.; Yin, H.; Zhao, Y. Impact of Environmental Regulations on the Efficiency and CO2 Emissions of Power Plants in China. Appl. Energy 2015, 149, 238–247. [Google Scholar] [CrossRef]
  37. Guo, L.; Wang, Y. How Does Government Environmental Regulation “Unlock” Carbon Emission Effect?—Evidence from China. Chin. J. Popul. Resour. Environ. 2018, 16, 232–241. [Google Scholar] [CrossRef]
  38. United Nations University Press. Environment, Energy, and Economy: Strategies for Sustainability; Kaya, Y., Yokobori, K., Eds.; United Nations University Press: Tokyo, Japan, 1997. [Google Scholar]
  39. Mielnik, O.; Goldemberg, J. Communication The Evolution of the “Carbonization Index” in Developing Countries. Energy Policy 1999, 27, 307–308. [Google Scholar] [CrossRef]
  40. Aldy, J.E. Per Capita Carbon Dioxide Emissions: Convergence or Divergence? Environ. Resour. Econ. 2006, 33, 533–555. [Google Scholar] [CrossRef] [Green Version]
  41. Zaim, O.; Taskin, F. Environmental Efficiency in Carbon Dioxide Emissions in the OECD: A Non-Parametric Approach. J. Environ. Manag. 2000, 58, 95–107. [Google Scholar] [CrossRef]
  42. Jin, T.; Kim, J. A Comparative Study of Energy and Carbon Efficiency for Emerging Countries Using Panel Stochastic Frontier Analysis. Sci. Rep. 2019, 9, 6647. [Google Scholar] [CrossRef]
  43. Wang, C.; Zhan, J.; Bai, Y.; Chu, X.; Zhang, F. Measuring Carbon Emission Performance of Industrial Sectors in the Beijing–Tianjin–Hebei Region, China: A Stochastic Frontier Approach. Sci. Total Environ. 2019, 685, 786–794. [Google Scholar] [CrossRef]
  44. Tone, K. A Slacks-Based Measure of Efficiency in Data Envelopment Analysis. Eur. J. Oper. Res. 2001, 130, 498–509. [Google Scholar] [CrossRef] [Green Version]
  45. Gao, P.; Yue, S.; Chen, H. Carbon Emission Efficiency of China’s Industry Sectors: From the Perspective of Embodied Carbon Emissions. J. Clean. Prod. 2021, 283, 124655. [Google Scholar] [CrossRef]
  46. Braun, E.; Wield, D. Regulation as a Means for the Social Control of Technology. Technol. Anal. Strateg. Manag. 1994, 6, 259–272. [Google Scholar] [CrossRef]
  47. OECD. Sustainable Manufacturing and Eco-Innovation: Towards a Green Economy; Policy Brief-OECD Observer; OECD: Paris, France, 2009. [Google Scholar]
  48. James, P. The Sustainability Cycle: A New Tool for Product Development and Design. J. Sustain. Prod. Des. 1997, 52–57. [Google Scholar]
  49. Chen, W.; Pan, L.; Lin, C.; Zhao, M.; Li, T.; Wei, X. Efficiency Evaluation of Green Technology Innovation of China’s Industrial Enterprises Based on SBM Model and EBM Model. Math. Probl. Eng. 2021, 2021, e6653474. [Google Scholar] [CrossRef]
  50. Wang, X.; Wu, S.; Qin, X.; La, M.; Zuo, H. Informal Environment Regulation, Green Technology Innovation and Air Pollution: Quasi-Natural Experiments from Prefectural Cities in China. Sustainability 2022, 14, 6333. [Google Scholar] [CrossRef]
  51. Lin, B.; Wang, M. What Drives Energy Intensity Fall in China? Evidence from a Meta-Frontier Approach. Appl. Energy 2021, 281, 116034. [Google Scholar] [CrossRef]
  52. Kepplinger, D.; Templ, M.; Upadhyaya, S. Analysis of Energy Intensity in Manufacturing Industry Using Mixed-Effects Models. Energy 2013, 59, 754–763. [Google Scholar] [CrossRef]
  53. Zhang, W.; Li, K.; Zhou, D.; Zhang, W.; Gao, H. Decomposition of Intensity of Energy-Related CO2 Emission in Chinese Provinces Using the LMDI Method. Energy Policy 2016, 92, 369–381. [Google Scholar] [CrossRef]
  54. Pan, X.; Uddin, M.K.; Saima, U.; Jiao, Z.; Han, C. How Do Industrialization and Trade Openness Influence Energy Intensity? Evidence from a Path Model in Case of Bangladesh. Energy Policy 2019, 133, 110916. [Google Scholar] [CrossRef]
  55. Hang, L.; Tu, M. The Impacts of Energy Prices on Energy Intensity. J. Quant. Technol. Econ. 2006, 12, 93–100. [Google Scholar]
  56. Dargahi, H.; Khameneh, K.B. Energy Intensity Determinants in an Energy-Exporting Developing Economy: Case of Iran. Energy 2019, 168, 1031–1044. [Google Scholar] [CrossRef]
  57. Yan, H. Provincial Energy Intensity in China: The Role of Urbanization. Energy Policy 2015, 86, 635–650. [Google Scholar] [CrossRef]
  58. Hansen, B.E. Threshold Effects in Non-Dynamic Panels: Estimation, Testing, and Inference. J. Econom. 1999, 93, 345–368. [Google Scholar] [CrossRef] [Green Version]
  59. Gao, Y.; Niu, Z. Agricultural Informatization, Spatial Spillover Effect and Agricultural Green Total Factor Productivity: Based on the Method of SBM–ML Index and Spatial Durbin Model. Stat. Inf. Forum 2018, 33, 10. [Google Scholar]
  60. Cheng, Z.; Li, L.; Liu, J.; Zhang, H. Total-Factor Carbon Emission Efficiency of China’s Provincial Industrial Sector and Its Dynamic Evolution. Renew. Sustain. Energy Rev. 2018, 94, 330–339. [Google Scholar] [CrossRef]
  61. Zhang, J.; Wu, G.; Zhang, J. The Estimation of China’s Provincial Capital Stock: 1952–2000. Econ. Res. J. 2004, 10, 35–44. [Google Scholar]
  62. Morgenstern, R.D.; Pizer, W.A.; Shih, J.-S. Jobs Versus the Environment: An Industry-Level Perspective. J. Environ. Econ. Manag. 2002, 43, 412–436. [Google Scholar] [CrossRef] [Green Version]
  63. Liu, R.; He, C. Study on the Threshold Effect of Environmental Regulation on Income Inequality of Urban Residents. China Soft Sci. 2021, 08, 41–52. [Google Scholar]
  64. Qi, S.; Li, Y. Threshold Effects of Renewable Energy Consumption on Economic Growth under Energy Transformation. Chin. J. Popul. Resour. Environ. 2017, 15, 312–321. [Google Scholar] [CrossRef]
  65. Wang, G.; Deng, X.; Wang, J.; Zhang, F.; Liang, S. Carbon Emission Efficiency in China: A Spatial Panel Data Analysis. China Econ. Rev. 2019, 56, 101313. [Google Scholar] [CrossRef]
Figure 1. Research framework.
Sustainability 14 10448 g001
Figure 2. Variable relationship diagram.
Sustainability 14 10448 g002
Figure 3. Average carbon emission efficiency by province, 2009–2019.
Sustainability 14 10448 g003
Figure 4. LR plots of the double-threshold estimates. (A,B) respectively show the LR plots of the double-threshold estimation with energy intensity and green technology innovation as threshold variables.
Sustainability 14 10448 g004
Table 1. Studies on measuring carbon emission efficiency.
AuthorsMethodScope of ResearchInputDesirable OutputUndesirable Output
Teng et al. (2021) [23]Modified dynamic SBM model30 provinces in ChinaPopulation,
Energy
GDPCO2 emissions
Li et al. (2019) [24]DEA-Malmquist28 provinces in ChinaCapital, Labor, EnergyGDPCO2 emissions
Xie et al. (2021) [25]Super-SBM59 countriesCapital, Labor, EnergyGDPCO2 emissions
Zhang et al. (2022) [26]SBMthe Yangtze River
Economic Belt
Capital, Labor, EnergyGDPCO2 emissions
Wen et al. (2022) [27]Super-SBM266 Chinese citiesCapital, Labor, EnergyGDPCO2 emissions
Dong et al. (2022) [28]SE-SBM32 developed countriesCapital, Labor, EnergyRegional GDPCO2 emissions
Niu et al. (2022) [29]Three-Stage SBM-Undesirable Model30 provinces in ChinaCapital, Labor, EnergyGross regional productCO2 emissions
Table 2. Input and output variables.
Variable DefinitionSource
InputLabor InputTotal Urban EmploymentChina Statistical Yearbook
Capital Input K i t = K i , t 1 ( 1 δ i t ) + I i t (6)China Statistical Yearbook
Energy InputTotal Energy Consumption in Standard CoalChina Energy Statistical Yearbook
Desirable OutputRegional GDPAdjusted Real GDP on 2008 Base PeriodChina Statistical Yearbook
Undesirable OutputCO2; Emission ( C O 2 ) i j t = j = 1 j R j t × δ j × α j × 44 12 (7)China Energy Statistical Yearbook; IPCC 2006
Table 3. Descriptive statistics of study variables.
VariableObsMeanStd. Dev.MinMax
CEE3300.9500.1490.2091.808
ER3300.0030.0030.0010.015
EI3300.8410.4510.2082.503
GTI3307.3151.4593.09110.874
IND3300.3700.0880.1200.508
GS3300.2430.1000.1100.593
OP3300.2750.3150.0271.447
Table 4. Correlation coefficients and multiple covariance tests.
CEEEREIGTIINDGSOP
CEE-
ER−0.261 ***1.57
EI−0.271 ***0.598 ***3.18
GTI0.211 ***−0.482 ***−0.720 ***2.48
IND−0.160 ***0.103 *0.176 ***−0.0391.76
GS−0.0800.352 ***0.584 ***−0.610 ***−0.390 ***2.86
OP0.122 **−0.290 ***−0.441 ***0.472 ***−0.147 ***−0.372 ***1.39
Note: The diagonal is the variance inflation factor. Its maximum value is 3.18 (3.18 < 10) and there is no multicollinearity. * p < 0.1, ** p < 0.05, *** p < 0.01.
Table 5. Panel unit root test.
VariableLLCIPSVariableLLCIPS
CEE−6.0512 *** (0.0000)−4.4963 *** (0.0000)CEE−10.2082 *** (0.0000)−6.1546 *** (0.0000)
ER−6.4158 *** (0.0000)−5.1893 *** (0.0000)ER−10.9125 *** (0.0000)−8.2653 *** (0.0000)
EI−0.1708 (0.4322)2.2708 (0.9884)EI−6.0961 *** (0.0000)−5.4924 *** (0.0000)
GTI−4.1117 *** (0.0000)−2.7465 *** (0.0030)GTI−3.6087 *** (0.0002)−7.0964 *** (0.0000)
IND−3.9973 *** (0.0000)−1.8410 ** (0.0328)IND−4.0808 *** (0.0000)−4.9391 *** (0.0000)
GS−5.3745 *** (0.0000)0.5773
(0.7181)
GS−6.1376 *** (0.0000)−4.3890 *** (0.0000)
OP−6.7039 *** (0.0000)−2.5921 ** (0.0048)OP−9.6870 *** (0.0000)−4.6144 *** (0.0000)
Note: ** p < 0.05, *** p < 0.01. Standard errors are in parentheses.
Table 6. Panel cointegration test.
KaoPedroni
Modified Dickey-Fuller t−7.4182 ***
(0.0000)
Modified Phillips-Perron t8.6376 ***
(0.0000)
Dickey-Fuller t−9.1739 ***
(0.0000)
Phillips-Perron t−12.0192 ***
(0.0000)
Augmented Dickey-Fuller t−3.9415 ***
(0.0000)
Augmented Dickey-Fuller t−10.0236 ***
(0.0000)
Note: *** p < 0.01. Standard errors are in parentheses.
Table 7. Existence tests of threshold effects for Model (2) and Model (3).
Single Threshold TestDouble Threshold Test
Model (2)F-value24.9915.52
Bootstrap p-Value0.0060.044
Crit10, Crit5, Crit112.7305, 16.1797, 22.692112.1784, 15.1686, 22.2521
BS500500
Grid samples10001000
Model (3)F-value32.5014.17
Bootstrap p-Value0.0000.058
Crit10, Crit5, Crit112.4546, 14.9838, 24.373710.9003, 14.9057, 24.0189
BS500500
Grid samples10001000
Table 8. Estimation results of threshold values for Model (2) and Model (3).
ThresholdLowerUpper
Model (2)Th-211.01380.97461.0139
Th-221.77561.76201.7764
Model (3)Th-216.84696.79426.8804
Th-225.79305.64495.8021
Table 9. Estimation results of the panel threshold model.
VariableThreshold Variable (Q)EIThreshold Variable (Q)GTI
IND−0.845 *** (0.172)−0.707 *** (0.173)
GS−1.747 *** (0.364)−1.897 *** (0.367)
OP−0.090 (0.094)−0.083 (0.093)
ER × I (Q1)5.035 (6.186)−32.849 *** (4.890)
ER × I (1Q2)−24.328 *** (4.754)−16.044 *** (4.793)
ER × I (Q2)−49.531 *** (7.086)13.224 ** (6.654)
Cons1.748 *** (0.137)1.716 *** (0.136)
Obs.330330
Note: ** p < 0.05, *** p < 0.01. Standard errors are in parentheses.
Table 10. Robustness test results.
VariableModel (8)Model (9)
IND−0.837 *** (0.220)−0.724 *** (0.210)
GS−1.670 *** (0.446)−1.852 *** (0.656)
OP−0.053 (0.046)−0.051 (0.049)
ER26.432 ** (10.300)−85.160 ** (38.308)
ER × EI−36.843 *** (9.883)
ER × GTI 11.059 * (5.491)
Cons1.718 *** (0.164)1.713 *** (0.195)
Obs.330330
Note: * p < 0.1, ** p < 0.05, *** p < 0.01. Standard errors are in parentheses.
Publisher’s Note: MDPI stays neutral with regard to jurisdictional claims in published maps and institutional affiliations.

