Article

Spatiotemporal Evolution and Influencing Factors of Economic Resilience: Evidence from Resource-Based Cities in China

School of Economics, Hebei GEO University, Shijiazhuang 050031, China
*
Author to whom correspondence should be addressed.
Sustainability 2022, 14(16), 10434; https://doi.org/10.3390/su141610434
Submission received: 13 July 2022 / Revised: 18 August 2022 / Accepted: 19 August 2022 / Published: 22 August 2022

Abstract

:
In the context of sustainable development, economic resilience provides a new research perspective for resource-based cities to resist external shocks and risks. The purpose of this study is to explore the characteristics and determinants of resource-based cities’ economic resilience in China, and to provide effective policy recommendations. This paper constructs an index system to measure the economic resilience of 114 resource-based cities in China from 2005 to 2019. This paper uses spatial analysis methods and the Theil index to reveal spatiotemporal evolution and regional disparities. Then, it uses the spatial Durbin model to reveal influencing factors from the perspective of spatial spillover effects. The conclusions are as follows: Firstly, the economic resilience of resource-based cities in China shows a growth trend. The spatial polarization of economic resilience in resource-based cities has intensified, showing a distribution pattern of high in the east and low in the west and northeast, with the cold spot of economic resilience moving from the southwest to the northeast. Secondly, the distribution of economic resilience in the eight economic regions is spatially heterogeneous. Inter-regional disparity is the main source of different economic resilience in the eight major economic regions. Thirdly, market potential and talent development potential are the direct drivers of economic resilience in resource-based cities. Nationalization, industrial specialization, and fiscal risk inhibit the development of economic resilience. Resource dependence not only hinders local innovation and transformation ability, but also negatively impacts the economic resilience of surrounding cities. Therefore, resource-based cities need to promote the diversification of industrial structures, and ensure resource allocation through the combination of the market and the government. At the same time, the government should build a new mechanism for coordinated regional development and open up the enclave economic model.

1. Introduction

Identifying the evolution and limiting factors of city economic system resilience is fundamental to understanding the evolutionary trajectory of economic systems and responding to external shocks. It is also a frontier of sustainability science research [1]. In the past few decades, China has experienced the impact of a series of internal and external factors, such as hyperinflation in 1989, the Asian financial crisis in 1997, and the international financial crisis in 2008. After these shocks, China can defuse risks and achieve stable economic operations without the strong resilience of the economic system. Although China’s economy has maintained steady growth as a whole, the economic development of resource-based cities has been slow or has even stopped after a series of crises, and city transformation has been weak. The drawbacks of insufficient economic resilience of resource-based cities were gradually exposed. Especially after the outbreak of the global financial crisis in 2008, how a resource-based city, a special type of city region, could maintain a stable city structure after external shocks became an urgent problem to be solved.
As a national energy resource strategic guarantee base, resource-based cities are types of cities with a special nature, relying on the rise and development of resource exploitation, as well as taking resource-based industries as the leading industries of the city’s economies. Its large number and wide distribution have made great historical contributions to the improvement of the national industrial system and the recovery of the national economy since the founding of New China [2,3,4]. However, with the depletion of resources, the risks of path dependence and lock-in formation are gradually exposed. Resource-based cities have become China’s economic growth depressions, and their sustainable development faces a series of problems. At present, China’s resource-based cities are still overly dependent on resources, and the ecological damage caused by irregular resource exploitation contradicts the distribution of economic benefits [5]. In addition, resource-based cities also face the threat of insufficient development momentum, and when the external environment fluctuates strongly, this resource-led economic activity mode makes city transformation weak and falls into the trap of resource advantage [6]. After China entered the stage of high-quality development, a number of industrial transformations and upgrading demonstration zones and demonstration parks were established to support the transformation and upgrading of old industrial cities and resource-based cities. The Fourteenth Five-Year Plan focuses on special types of areas and improves the long-term mechanisms for sustainable development of resource-based areas. Although resource-based cities have made phased achievements in industrial transformation and ecological protection, external shocks and disturbances have been frequent since China’s economy entered the new normal, and COVID-19 has posed new challenges to the smooth operation of the national economy. Improving the resilience of urban economies not only helps resource-based cities resist external risks caused by uncertainties in their own economic downturn, but also has great significance for achieving high-quality development.
Facing the dual pressures of the transformation of old and new kinetic energy in the city economic system and the increase in external uncertainties and risks, improving economic resilience is an important way for resource-based cities to cope with internal disturbances and external shocks. In order to improve the economic resilience of resource-based cities, we need to solve the imbalance in the development of resource-based cities, and provide a theoretical basis and decision-making support for promoting regional sustainable developments. This paper attempts to construct a scientific index system to measure the economic resilience of resource-based cities, elaborate on the temporal and spatial evolutionary characteristics of economic resilience, and identify the driving mechanisms of economic resilience from the perspective of spatial spillover.
The structure of the rest of the paper is as follows: Section 2 is a literature review; Section 3 introduces the methods and data sources; Section 4 discusses the temporal evolution, spatial evolution, and regional disparities of China’s resource-based cities’ economic resilience, and reveals the influencing factors of economic resilience from a spatial perspective; Section 5 discusses the research results; Section 6 summarizes the conclusions and presents policy recommendations.

2. Literature Review

Resilience reflects the ability of things to return to their original state after external shocks and disturbances. The concept first appeared in 1970 and was introduced to the field of ecology by the biologist Holling to measure whether an ecosystem can remain in its original state after absorbing driving variables [7]. Since then, academia has expanded its connotations of resilience to the fields of physics, sociology, and economics. Economic resilience is an inherent attribute formed in the operation of a regional economic system that takes different forms after external shocks. The evolution trajectory of the economic system after a shock is different, and the economic resilience shows different forms: returning to the exact same steady growth path as before the disturbance; maintaining the original structure and function; maintaining a stable growth path below the original level; diving below the original level of development and remaining unable to maintain stability; functions and structure are reorganized, transcending the original state and entering a new development model [8]. The resilience of economic systems mainly includes the following four aspects: the ability of the economic system to resist shocks, the ability of the economic system to recover after the shock, the ability of the economic system to reorganize internal resources and structures, and the ability to adopt a new development model after an impact [9].
The economic resilience research stage can be divided into two phases: the concept formation stage and the research exploration stage [10]. The first stage (2002–2010) draws on the theories of other disciplines and introduces resilience theory into the field of economics. Research on economic resilience is mainly based on theoretical exploration and qualitative analysis, while research in the field of macroeconomics is more intensive. Simmie and Martin integrated resilience theory into city economic systems, pioneering the study of urban economic resilience [8]. Aiginger explored how to make a country’s economic system resistant to shocks and how economic policies can stabilize the economy after shocks [11]. Briguglio constructed an economic resilience indicator system from four dimensions, and measured the economic resilience of different countries [12]. The theory of economic resilience in the second stage (2010–present) has deepened, relevant empirical analysis has developed rapidly. Europe has pioneered empirical research on economic resilience. Based on Schumpeterian perspective, regional innovation capabilities contribute to economic resilience growth in the UK [13]. Masik built an economic resilience framework for future events of the same crisis based on Poland’s experience of not sliding into a recession during the crisis in Europe [14]. The strength of the 2008 financial crisis and resilience were heterogeneous among European Union countries. Pontarollo used spatial econometrics to explore whether and how differences in economic virtuosity affected the employment trajectories of European regions [15]. Ezcurra believes that government quality is an important factor when shaping regional resilience after a crisis [16]. From the experience of other regions, employment diversification is gradually becoming a determinant of the resilience of U.S. provincial cities [17]. Resilience is a key concept for solving the vulnerability of Filipino families [18]. Chinese scholars’ research on economic resilience is still in its infancy, and most of the research subjects are certain urban agglomerations in certain provinces. From the perspective of urban agglomeration, Zhu. J and other scholars explored the evolution of economic resilience in China’s three urban agglomerations [19,20]. Xie, Juntao et al. focused on the economic resilience of northeast China, and studied its manifestation and formation mechanisms [21,22]. Tang Yu analyzed the obstacle factors of economic resilience in Shanxi Province, providing theoretical support for the economic transformation and high-quality development of Shanxi Province [23]. Li chose resistance and recoverability to reflect the regional economic resilience of Liaoning Province, and explored the influencing factors of economic resilience by constructing a spatial model [24]. Some scholars have also conducted preliminary explorations of the economic resilience of China’s resource-based cities. When comparing the economic resilience of resource-based cities in northeast China with northern coastal areas, it was found that different institutional reform models affect the urban development path [25]. For mining cities, industrial diversification had a positive effect on economic resilience, and industrial specialization was not conducive to economic resilience growth [26].
In summary, current research on economic resilience is relatively weak and there are certain deficiencies. First, there are many studies on the economic resilience of European countries, and less research on China’s economic resilience. Research on China’s economic resilience is narrow, mainly concentrated at the level of a certain urban agglomeration in a certain province, the analysis of the economic resilience of resource-based cities in the country needs to be expanded. Second, most of the current research is based on single-level indicators to explore the evolution of economic resilience, and the establishment of a resource-based urban economic resilience index system can more comprehensively reflect the spatial-temporal differentiation characteristics and the ability of urban systems to cope with long-term shocks. Third, spatial correlations are ignored when discussing the factors influencing economic resilience. The spillover effects and influencing factors of economic resilience are rarely revealed from a spatial perspective.
This paper is different from previous studies by taking 114 resource-based cities in China as the research subjects, constructing an economic resilience index system, measuring the economic resilience of China’s resource-based cities from 2005 to 2019, and revealing its spatiotemporal evolution pattern in order to provide a reference for Chinese resource-based cities to narrow the gap between regional economic resilience and improve the overall resilience level, using the Durbin model to explore the influencing factors of various dimensions of resource-based urban economic resilience based on the perspective of spatial spillover effect.

3. Data and Methods

3.1. Construction of an Indicator System

There are two main methods to measure economic resilience currently [27], one is to reflect regional economic resilience with the help of change when a core variable faces shocks. This method focuses on the resilience of regional economic systems in short-term shocks. Scholars mostly use changes in regional GDP to indicate economic resilience or to predict economic resilience based on economic facts [24,28,29,30]. Another is to build an indicator system to measure regional economic resilience. A single indicator does not provide a comprehensive and objective assessment of economic resilience and does not reflect the ability of the economic system to respond to shocks in the long term.
With reference to existing research, this paper constructs an evaluation system for the economic resilience of resource-based cities from three dimensions: resistance and recovery ability, adaptation and regulation ability, and innovation and transformation ability [31,32]. The indicators are shown in Table 1. Resistance and recovery ability reflect the vulnerability and stability of an economic system, in terms of its ability to withstand external shocks and restore its structural and functional stability after a disturbance. Cities with high resilience can be less affected by shocks, which are usually influenced by factors, such as the level of economic development, the level of urban construction, and the employment of the population [33]. This article uses six indicators to measure resistance and recovery ability: savings amount of urban and rural areas, per capita GDP, registered urban unemployment rate, regional GDP growth rate, green coverage, and per capita road area. Adaptation and regulation ability is the potential of an economic system to actively adjust after a shock, adapt to the shock, and develop according to the original path. It is often influenced by ecology, government management capacity, and consumer potential [12,22]. Five indicators are used to measure adaptation and regulation ability: financial self-sufficiency, total retail sales of consumer goods, financial scale, sulfur dioxide emissions, and comprehensive utilization rate of solid waste. Innovation and transformation ability is a higher-level capability that reflects the ability of an economic system to actively adjust its internal structure and transform into a new development model. It is influenced by a combination of factors, such as technology, education, and industrial structure [34,35]. We measured innovation and transformation ability with six indicators: financial expenditure on education, technological level, internet penetration, innovation and entrepreneurship index, rationalization of industrial structure, and optimization of industrial structure.
The index attributes of unemployment rates, sulfur dioxide emissions, and rationalization of industrial structure are negative, and the remaining index attributes are positive. The rationalization of industrial structures reflects the transformation ability of resource-based cities. The more reasonable the industrial structure, the stronger the ability to innovate and evolve. Drawing on the practices of Wang Jun and Li Hong [36,37], the following methods are used to construct the industrial structure rationalization index:
R I S = i = 1 n ( Y i L i / Y L ) = i = 1 n ( Y i Y / L i L )
In Formula (1), Y i represents the added value of i industry; Y represents the total output value of each industry;   L i is the number of people employed in i industry; L is the total number of people employed.

3.2. Methods

3.2.1. The Entropy Evaluation Method

The concept of entropy originated in the classical theory of thermodynamics and was introduced into information theory by Shannon in 1948. Entropy measures uncertainty. The more information there is, the less uncertainty there is and the less entropy there is. The smaller the amount of information, the greater the uncertainty and the greater the entropy [38]. Delphi and APH are subjective weighting methods that are subjective to a certain extent, and the scoring expert affects the credibility of the overall results. Compared to these two methods, the entropy method reflects the information entropy of the indicators and is an objective weighting method that effectively overcomes the bias caused by human factors and the problem of superimposing information on indicators. This paper uses the entropy evaluation method to determine the weights to comprehensively measure the economic resilience of resource-based cities in China.
In a comprehensive evaluation, there are differences in the magnitudes and types of indicators. In order to exclude the influence of differences in indicators in the results, standardization is required to remove the magnitudes. Commonly used standardization methods are min-max normalization and zero-mean normalization. Compared to zero-mean normalization, min-max normalization scales the original metric proportionally to a number between 0 and 1, and the resulting interval is more stable. Therefore, this article uses min-max normalization for dimensionless processing. If a single indicator is beneficial to the development of economic resilience, the positive indicator calculation method is used. If a single indicator is not conducive to economic resilience, the negative indicator calculation method is used.
positive   indicator :   X i j = X i j X min X max X min
negative   indicator :   X i j = X max X i j X max X min
In Equations (2) and (3), X i j is the standardized value of the j-th index of the i-th city, X m i n is the minimum value of the j-th index in the sample period, and X m a x is the maximum value of the j-th index in the sample period.
Afterwards, the weight of each indicator in the index system is calculated with information entropy: P i j represents the weight of the index; e j indicates information entropy, d i indicates redundancy; w j is the weight for each indicator. Finally, we then calculate the score S i for economic resilience.
{ P i j = X i j / i = 1 m X i j e j = 1 ln m i = 1 m P i j ln P i j d i j = 1 e j w j = d j / i = 1 m d j S i = j = 1 n w j X i j

3.2.2. Theil Index

The Theil index was introduced in 1967 by Dutch economist Theil, and was the most commonly used measure of regional economic disparities. The advantage of the Theil index over the coefficient of variation and generalized entropy is that it can decompose overall regional differences into intra-regional differences and inter-regional differences, thus, better reflecting the sources of the overall regional variation. Drawing on Theil’s research, this paper uses Stata to decompose the Theil index and the total difference in economic resilience of resource-based cities into intra-regional differences and inter-regional differences across eight major economic regions. The calculation formula is as follows:
T p i = i j ( Y i j Y i ) log ( Y i j / Y 1 / n i )
T p = T W R + T B R = i ( Y i Y ) T p i + i ( Y i Y ) log ( Y i / Y n i / n )
T p i represents the overall difference in economic resilience in resource-based cities, which is decomposed into intra-regional differences, T W R , and inter-regional differences, T B R . The Theil index is valued between 0 and 1, and the smaller the value, the smaller the regional economic resilience gap.

3.2.3. Moran’s I

Global spatial autocorrelation refers to the degree of correlation between object attributes and adjacent spatial unit attributes. Moran’s I is derived from Pearson correlation coefficients, which are the primary method for measuring spatial autocorrelation [39]. This article uses Stata’s spatgsa command to calculate Moran’s I. Measuring whether there is spatial autocorrelation in the economic resilience of resource-based cities in China is helpful for understanding the spatial pattern of economic resilience of resource-based cities, and for analyzing whether the economic resilience of each city has a spatial spillover effect. The calculation formula is as follows:
Moran s   I = n i = 1 n j = 1 n w i j ( x i x ¯ ) ( x j x ¯ ) i = 1 n j = 1 n w i j i = 1 n ( x i x ¯ ) 2
In Formula (7), w i j represents the spatial weight matrix, x i and x j represent the economic resilience of i cities and j cities, and x ¯ is the average economic resilience of each city. Moran’s I greater than 0 indicates the presence of a positive spatial correlation, and less than 0 indicates the existence of a spatial negative correlation.

3.3. Influencing Factor Model

3.3.1. Spatial Durbin Model

Spatial econometrics was born in the 1970s and was first proposed by Paelinck and Klaassen. They did not give a specific definition of spatial econometrics, but only gave the criteria for future formation and development of spatial models. Later, Anselin et al. expanded on Paelinck’s research, refining the theory of spatial econometrics, and building a more effective spatial model [40].
The spatial model can be divided into spatial lag model (SLM), spatial error model (SEM), and spatial Durbin model (SDM) according to the different manifestations of spatial spillover effects. The spatial lag model is primarily used to study the spatial correlation between the explanatory variables and emphasizes the spatial spillover effects of the explanatory variables. The spatial error model emphasizes the existence of spatial heterogeneity, and believes that the spatial correlation between variables is caused by random disturbances between regions.
The spatial Durbin model is a generalized form of the spatial error model and the spatial lag model, which can be simplified to the SEM model and the SLM model under certain conditions. The SDM considers the interaction between spatial units and considers that the explanatory variables are not only affected by local factors, but also by the explanatory variables and explanatory variables in the neighboring regions, and can more accurately identify the influencing factors of the explained variables. This article uses Stata to execute the spatial Durbin model. The specific settings of the model are as follows:
Y i t = δ j = 1 n W i j Y j t + α + β X i t + j = 1 n W i j X j t θ + μ i + λ t + ε i t
In Formula (8), Y i t is the dependent variable, representing the economic resilience of resource-based cities; W i j is the spatial weight matrix; Y j t is the economic resilience of neighboring resource-based cities; X i t represents the set of resource-based city independent variables; X j t is a set of explanatory variables for neighboring resource-based cities; α is a constant term. μ i and λ t are spatial fixation effects and time fixation effects, respectively; ε i t is a random error term.

3.3.2. Influencing Factor Setting

A variety of factors jointly affect a city’s economic resilience. This paper selects the eight variables in Table 2 as explanatory variables to explore the impact mechanism of the temporal and spatial evolution of China’s resource-based cities’ economic resilience: resource dependence, nationalization, market potential, talent development potential, work-force level, specialization of industry structure, fiscal risk, and location factors.
Resource dependence is defined as an economy’s dependence on resources, measured by the ratio of the total employed population in extractive industries to the total employed population [41]. Areas rich in natural resources are prone to over-dependence on resources in the development process, resulting in a series of problems. The excessive concentration of resources affects the government’s investment in other areas. Resource industries are controlled by a few, which can easily breed administrative corruption and widen the gap between the rich and the poor in the city [42]. Natural resources have low price elasticity. Once resource prices fluctuate greatly, the entire economy will face greater uncertainty. This series of problems has a negative impact on economic resilience and is not conducive to the timely recovery of cities after external shocks [43,44].
Excessive nationalization is not conducive to the growth of China’s economic resilience [45,46]. Non-state enterprises have higher efficiencies than state-owned enterprises. From the experience of China’s reform and opening, China’s economic growth and efficiency improvement mainly come from the non-state sector. The high degree of nationalization leads to the joint monopoly of large state-owned enterprises and the government on urban resources, squeezing the production and operation activities of small and medium-sized enterprises, which is not conducive to the stability of the city’s internal structure and innovative development.
The market potential is expressed by population density, and the talent development potential is expressed by the number of universities. The market potential can induce factor inflow by raising factor prices, which has a positive impact on the growth in economic resilience. The expansion of the local market leads to the strengthening of the spatial agglomeration of economic activities, promotes the generation and diffusion of new ideas and new technologies, and promotes the development of surrounding areas in the process of diffusion. Talent development potential improves a city’s economic resilience by reserving human resources [47]. The city needs to be replenished with large amounts of manpower and materials to maintain its functional stability after a shock. High-quality human resources are conducive to improving the efficiency of factor allocation and enhancing the city’s economic resilience.
The workforce level is an important factor affecting the growth in economic resilience. This article uses the number of employees at the end of the year to measure the labor force level. Most existing studies believe that labor supply has a positive impact on economic resilience’s growth [48]. As an important production factor, the labor force is the basic factor of regional economic development. Sufficient labor is conducive to the stability of a city’s structure and the smooth operation of its economy.
In the early stages of reform and opening, China’s resource-based cities built professional cities relying on natural resources and accumulated huge amounts of wealth. However, when the city encounters a strong industrial crisis or the economy is in a downward state, the specialization of the industrial structure will no longer be suitable for the development of resource-based cities. Industrial diversification can diversify and reduce risks brought on by external shocks [26,49], enhance urban economic resilience, and maintain stable regional development.
Fiscal risk and geographic location also have an impact on the economic resilience of resource-based cities. This paper uses the ratio of the fiscal deficit to regional GDP to measure fiscal risk. Fiscal deficits increase the burden of government debt. Excessive fiscal deficits may trigger fiscal crises and reduce the city’s adjustment capabilities. Eastern China has an advantageous geographical location, while the west is dominated by mountains and basins; the transportation is inconvenient. In the production process, factors flow from remote western cities to eastern cities, making the economic resilience of eastern cities higher than that of western cities.

3.4. Study Area and Data Sources

The State Council of China issued the “National Sustainable Development Plan of Resource-Based Cities (2013–2020)” in 2013, which defined the scope of resource-based cities in China. China’s resource-based cities involve 28 provincial-level administrative regions, 126 prefecture-level administrative regions, 62 county-level cities, 58 counties, and 16 municipal districts, covering more than 40% of China’s land area and more than 36% of the country’s population. The 126 prefecture-level administrative regions include 116 prefecture-level cities, 8 autonomous prefectures, and 2 prefectures. Due to the serious lack of data in autonomous prefectures, prefectures in Bijie and Laiwu withdrew from the city and joined districts in 2019. This paper selects 114 prefecture-level cities as research objects, including 14 growing cities, 62 mature cities, 23 declining cities, and 15 regenerative cities. It should be noted that the resource-based cities referred to in this article are resource-based city regions.
This paper uses the panel data of 114 prefecture-level cities from 2005 to 2019 to comprehensively measure the economic resilience level of resource-based cities in China, and at the same time study its impact mechanism. The data were mainly derived from the China City Statistical Yearbook, the China Regional City Statistical Yearbook, the China Urban-Rural Construction Statistical Yearbook, and the National Bureau of Statistics of the People’s Republic of China. The innovation and entrepreneurship index was from the Peking University Open Research Data Platform [50]. The missing values were created by interpolation. In order to eliminate the factor of price fluctuation, the savings amount of urban and rural areas, per capita GDP, and the total retail sales of consumer goods are all converted from the base period of 2005.

4. Results

4.1. The Temporal Evolution of Economic Resilience in Resource-Based Cities

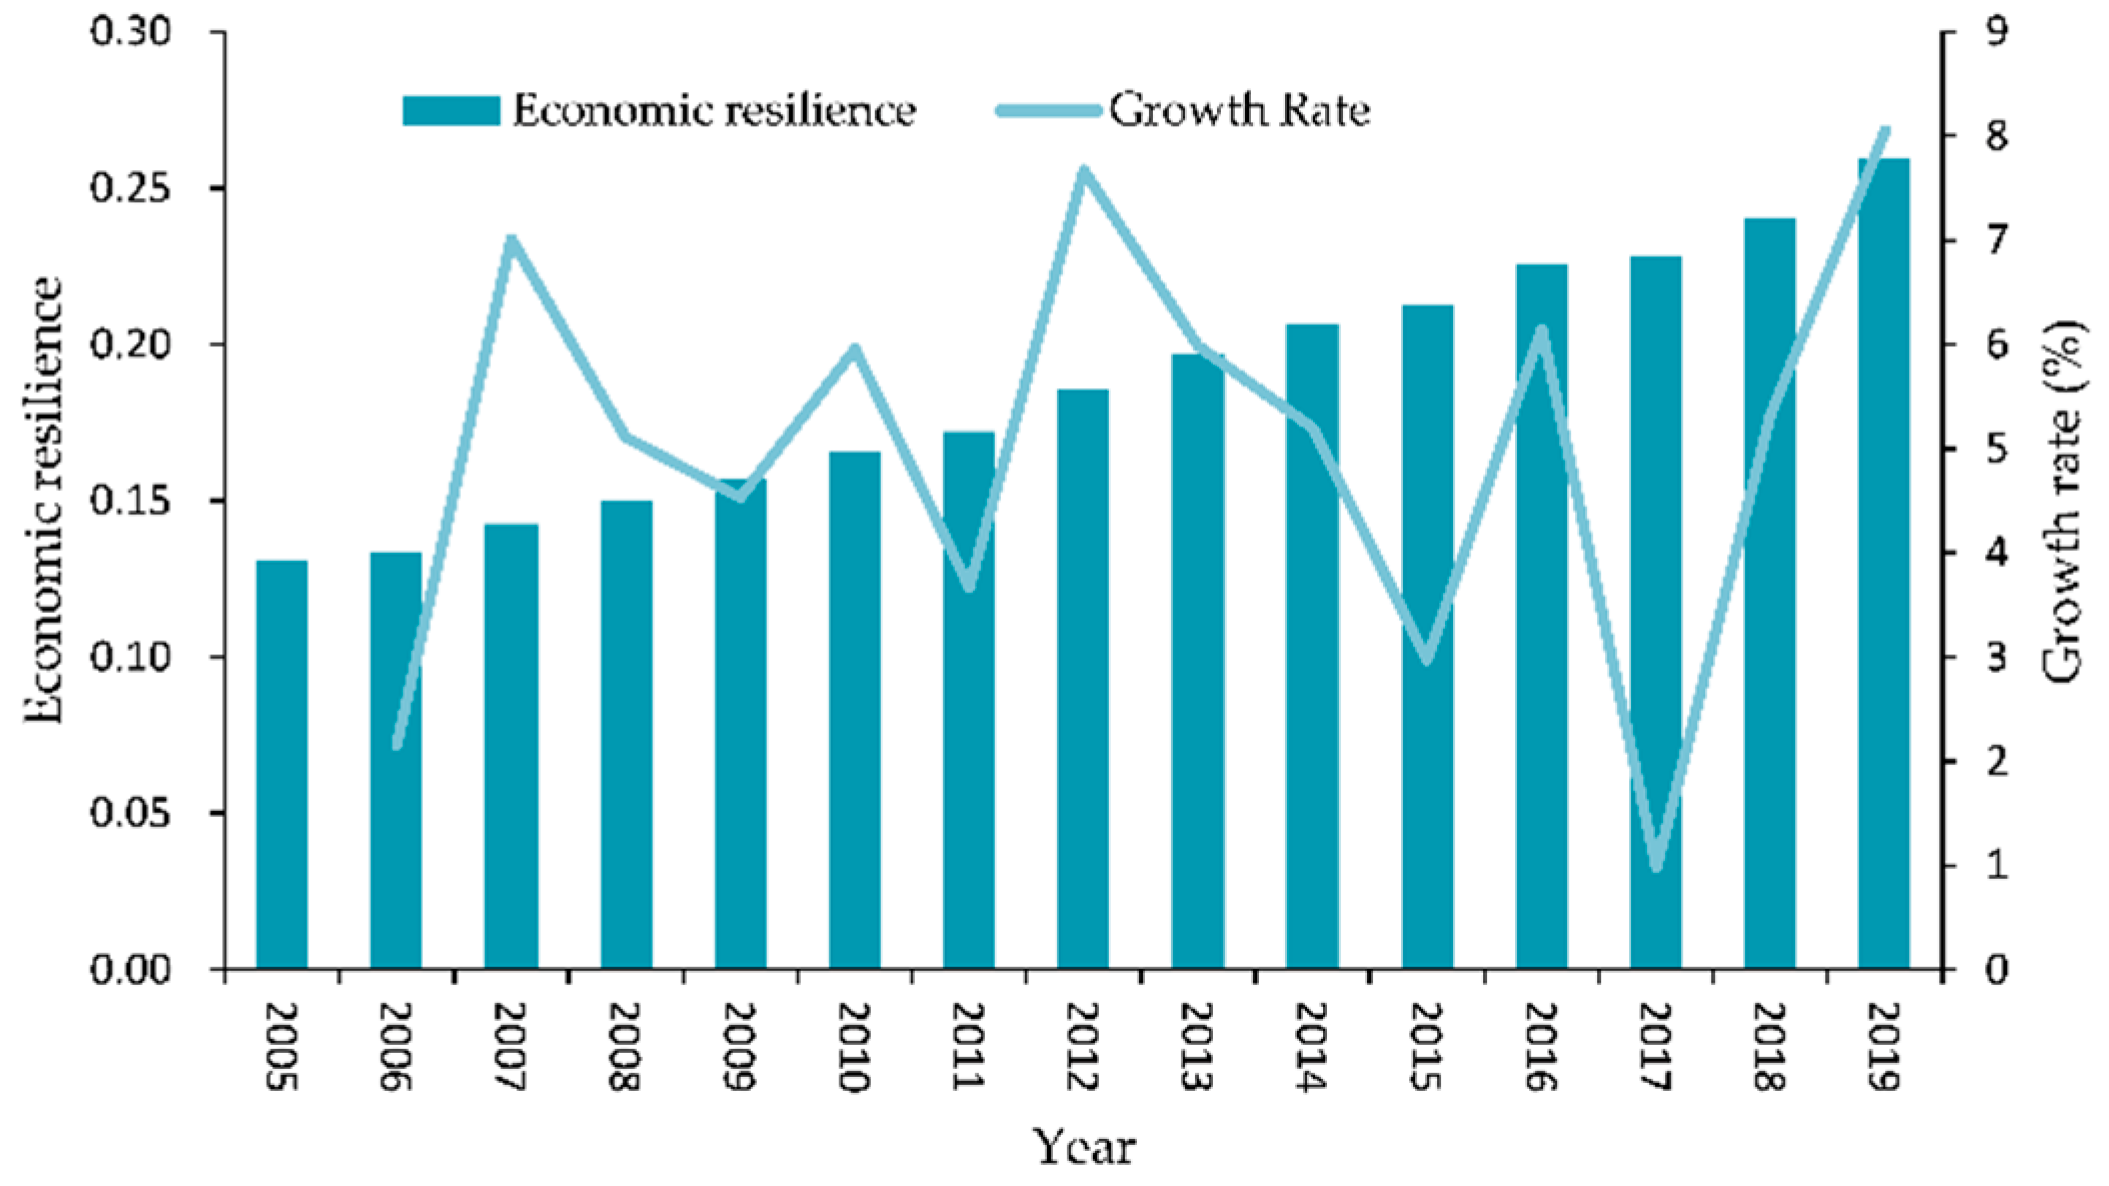
The average economic resilience of resource-based cities in China shows a continuous growth trend. Figure 1 shows the overall time evolution of economic resilience in resource-based cities. From 0.1306 in 2005 to 0.2597 in 2019, the average annual growth rate was 5.04%. There are obvious differences in the growth in economic resilience between different cities. From 2005 to 2007, the growth rate was rising, with an average annual growth rate of 4.55%. From 2008 to 2012, it was at a stage of high-speed growth, with an average annual growth rate of 5.44%. After 2013, the growth rate in economic resilience slowed down and remained at a relatively stable level, which was a stage of steady growth. China’s economy began to transition to high-quality development. Xuzhou, Ganzhou, and Luoyang are the top three cities in terms of the total growth in economic resilience; Qitaihe, Hegang, and Heihe are the last three cities in terms of growth in economic resilience. From the perspective of growth rate, the economic resilience of Ganzhou, Yichun, and Xuzhou has increased rapidly, with an average annual growth rate of more than 9%. Qitaihe, Hegang, and Daqing are the three cities with the lowest growth rates, all located in Heilongjiang Province, with an average annual growth rate of less than 2%.
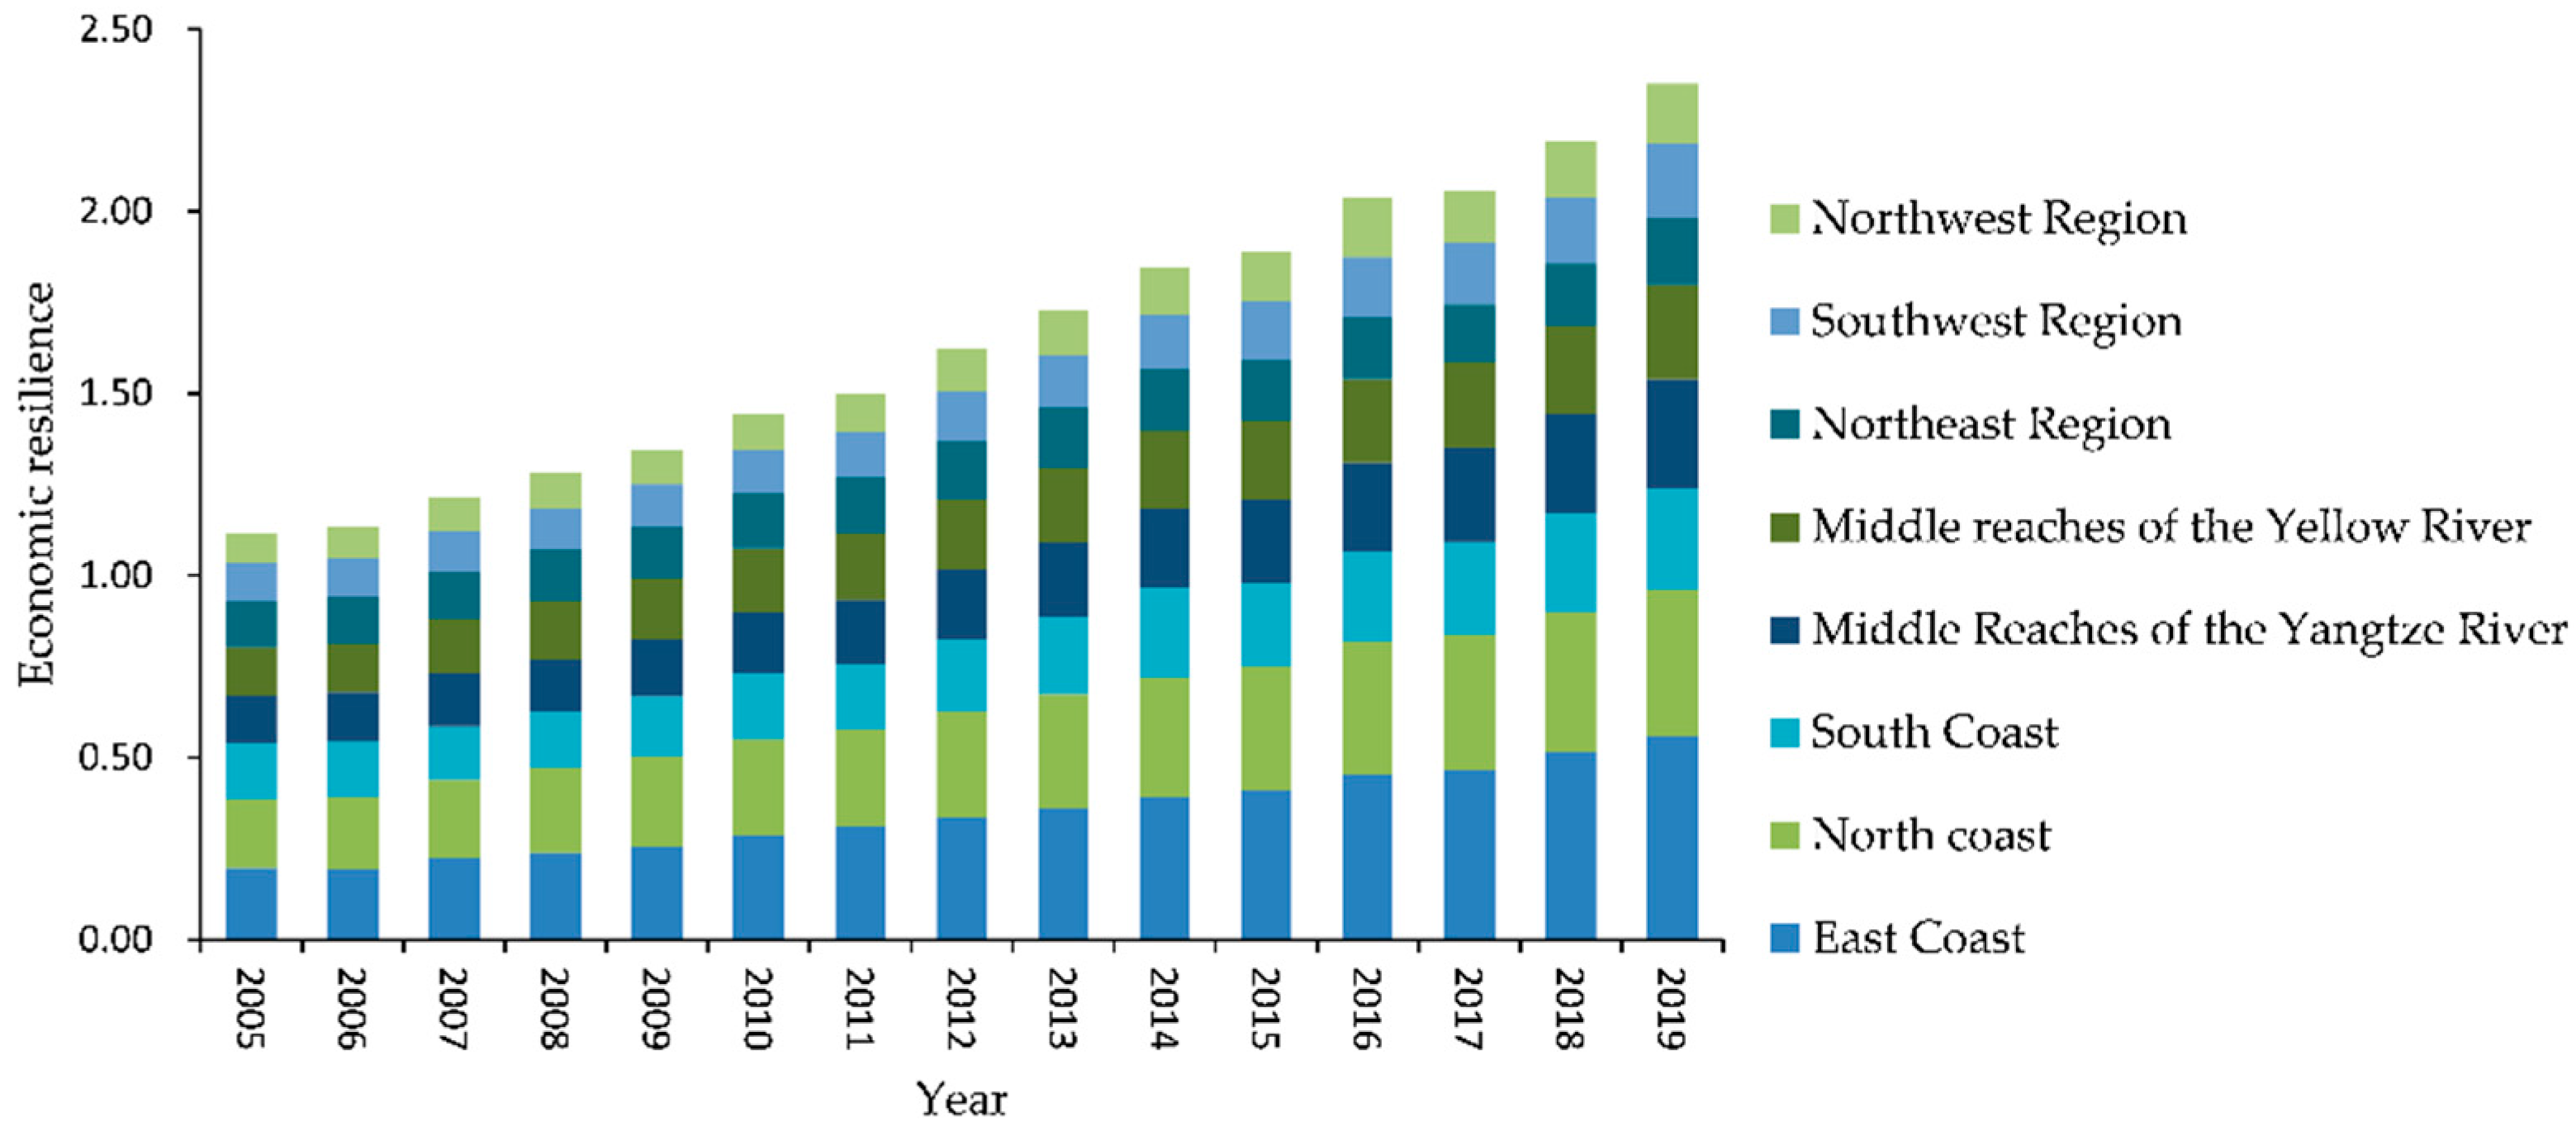
There are obvious differences in the economic resilience of resource-based cities in different regions. Figure 2 shows the characteristics of the economic resilience of resource-based cities: East Coast > Northern Coast > South Coast > Middle Reaches of the Yangtze River > Middle Reaches of the Yellow River > Northeast Region > Southwest Region > Northwest Region. The cities with the largest growth rates in economic resilience are in the coastal area, with an average annual growth rate of 6.11%; the growth rate in economic resilience of cities along the Yellow River and Yangtze River is in the middle, at 5.57%; the northeast region has the smallest average annual growth rate of only 2.59%. During the Thirteen Five-Year Plan period, the economic resilience of resource-based cities in the middle reaches of the Yangtze River increased, gradually surpassing the resource-based cities in the southern coastal areas, and the overall economic resilience of the southwest region began to exceed that of the northeast region.

4.2. The Spatial Evolution of Economic Resilience in Resource-Based Cities

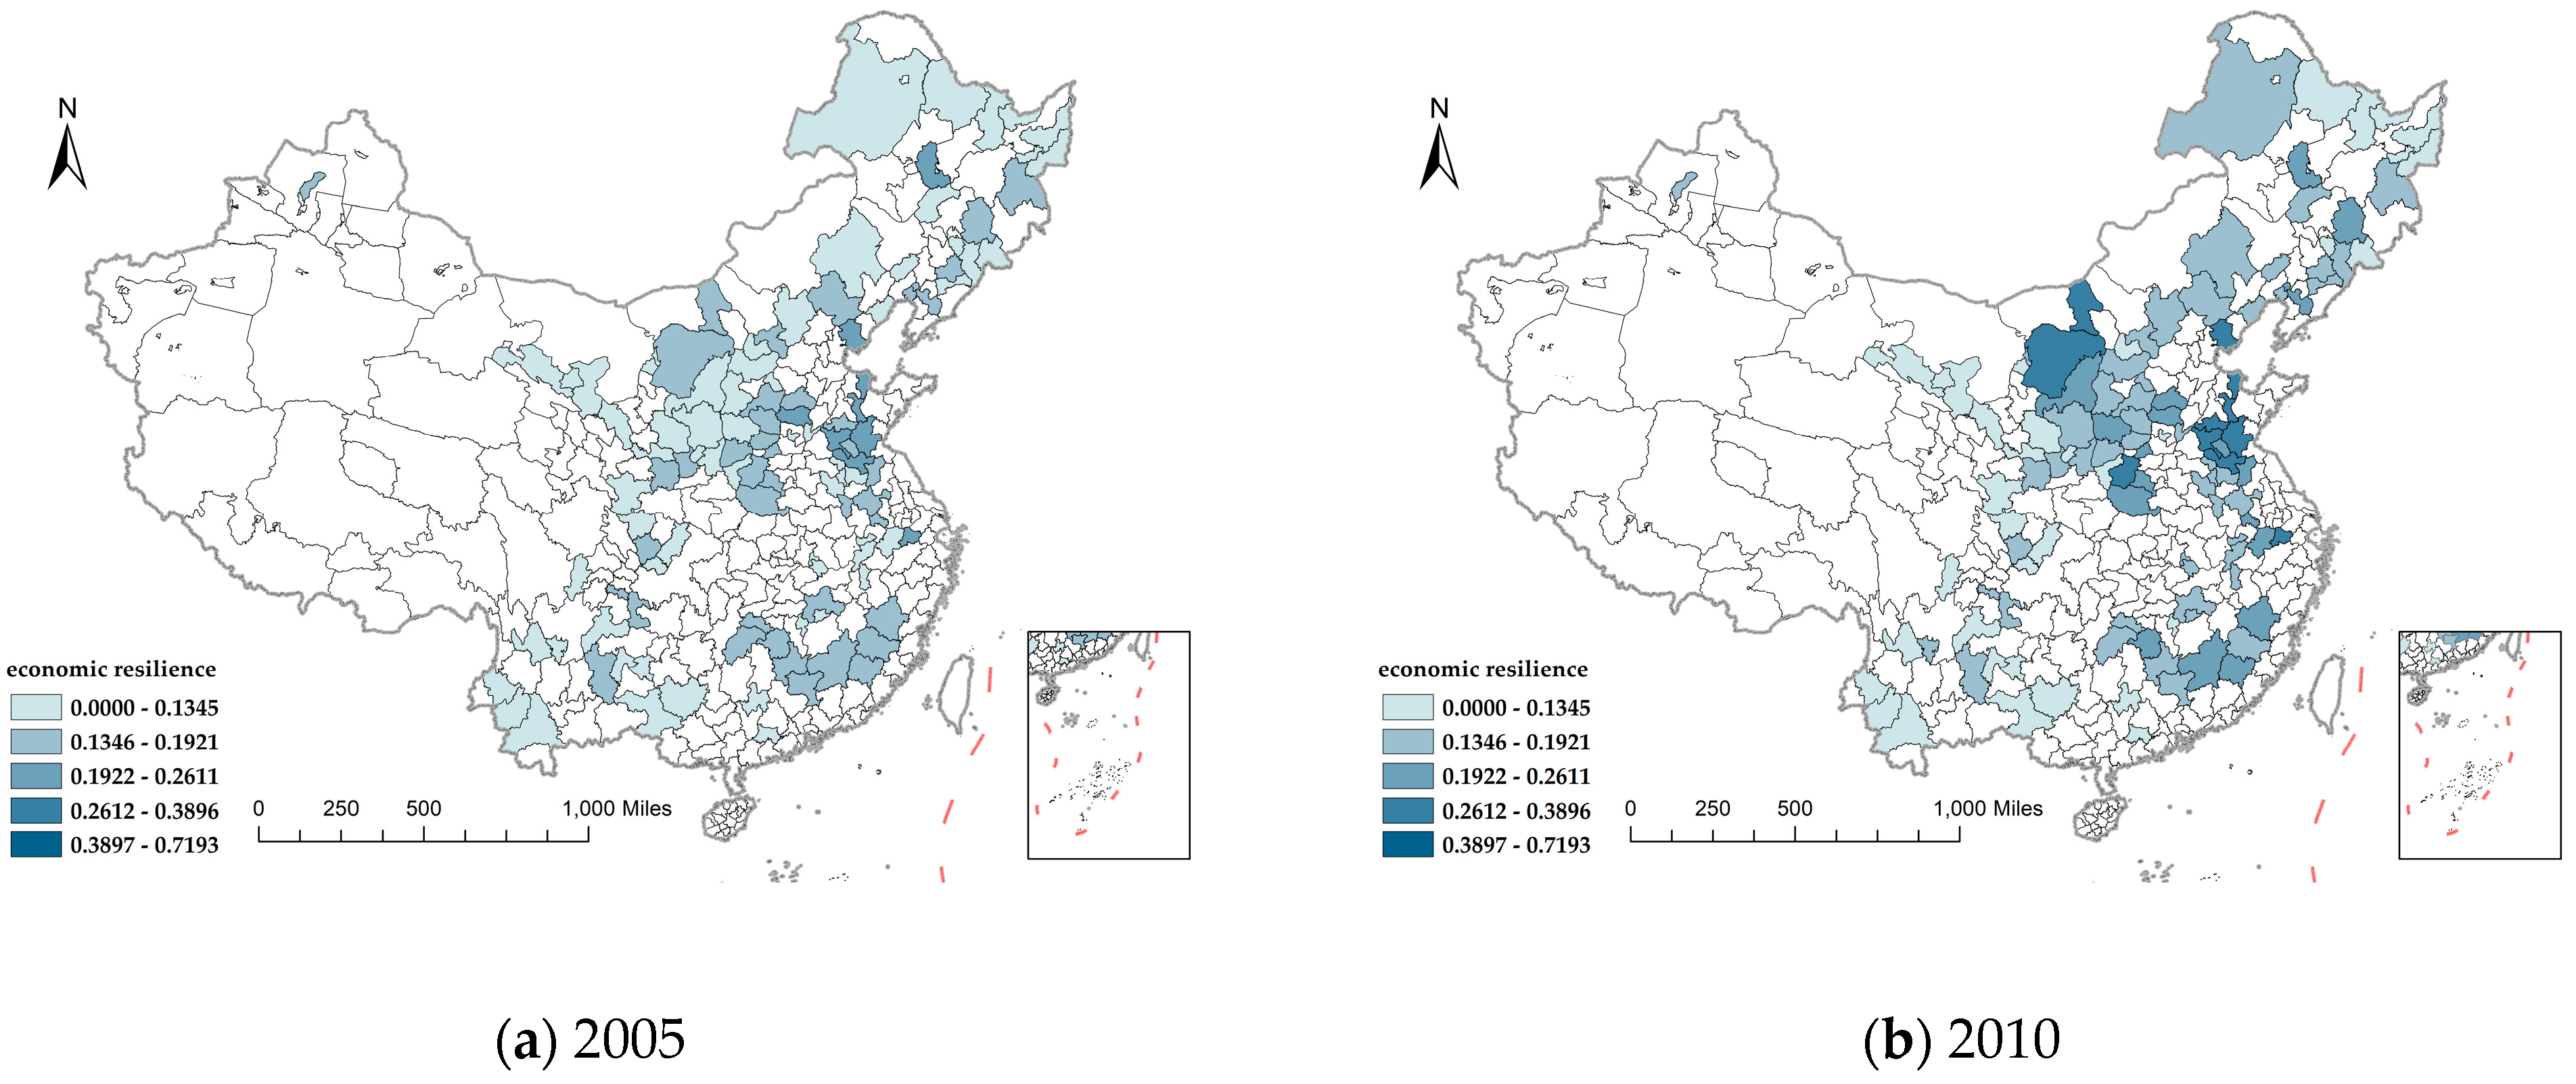
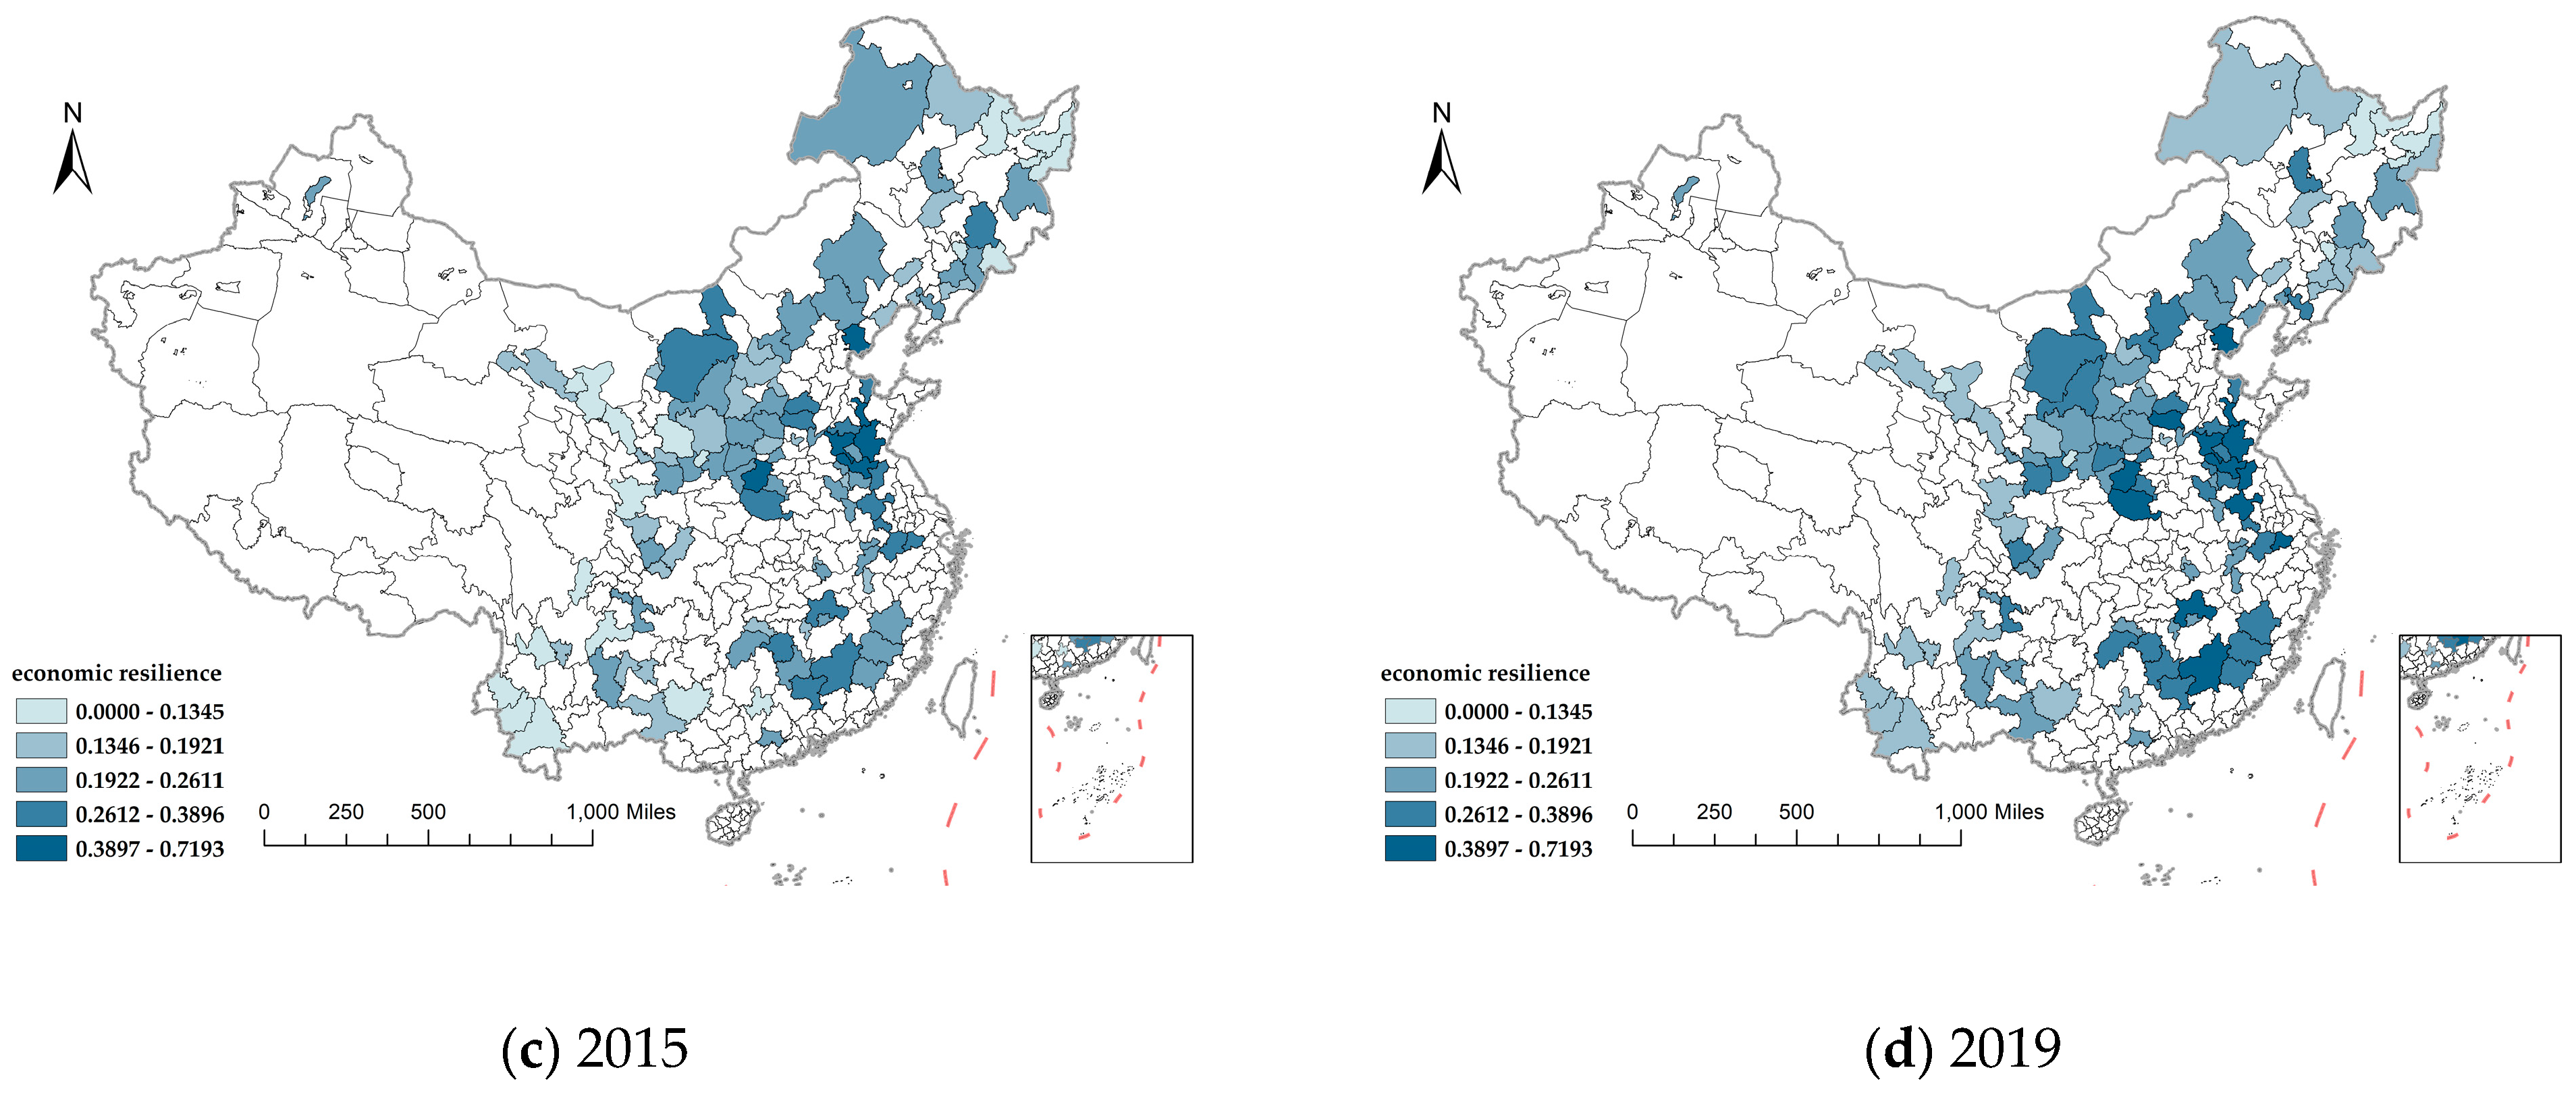
We used sequential clustering to divide the different economic resilience types of 114 resource-based cities in China. According to the loss function, resource-based economic resilience is divided into five levels: low level (0–0.1345), lower level (0.1346–0.1921), medium level (0.1922–0.2611), higher level (0.2612–0.3896), and high level (0.3897–0.7193). Figure 3 shows the spatial evolution of the resilience of China’s resource-based cities.
First, from 2005 to 2019, the resilience of China’s resource-based cities showed a low-medium-high growth trend. The economic resilience of Chinese resource-based cities was low in 2005; cities with low levels of economic resilience accounted for 56.14%. Economic resilience has ample potential since China entered the new normal in 2013. In 2015, only 18.42% of cities were at a low level of economic resilience. After 2019, there were only seven low-value areas, namely Jinchang, Hegang, Qitaihe, Shuangyashan, Yichun, Liaoyuan, and Tongchuan. High-value areas increased from 6 to 13 between 2015 and 2019; the new cities were Chuzhou, Handan, Nanyang, Suqian, Ganzhou, Yichun, and Huzhou.
Second, the spatial differentiation of economic resilience in resource-based cities is remarkable, with a distribution pattern of high in the east and low in the west. In 2015, 25% of the top 20 cities with economic resilience were located in Shandong Province, and 30% of the bottom 20 cities were located in Gansu Province. In 2019, the middle reaches of the Yangtze River also became a high-level area of economic resilience, with representative cities including Ganzhou, Yichun, Chuzhou, and Xuancheng. In 2019, areas with low levels of economic resilience were mainly located in the northwest and northeast regions. The bottom 20 cities with economic resilience are now mainly located in Heilongjiang and Gansu Province.
Third, the spatial polarization of the economic resilience in resource-based cities has intensified, and the distribution has shown a non-equilibrium trend. Between 2005 and 2019, the number of cities with low levels of economic resilience continued to decrease, and the number of cities at higher and higher levels increased. The economic resilience of resource-based cities was low in 2005, with a value of 0.1765. However, the economic resilience range of China’s resource-based cities increased to 0.6135 in 2019. It shows that the spatial polarization of the economic resilience level of China’s resource-based cities continues to expand. The Matthew effect, proposed by Robert K. Merton in 1968, can explain this phenomenon. If an individual has an advantage in a certain aspect, this advantage will continue to accumulate, thereby gaining a greater advantage. If an individual is disadvantaged in one aspect, the disadvantage will continue to expand. The expansion of the range shows that the economic resilience of regions with high economic resilience is increasing, while the economic resilience of cities with low economic resilience is decreasing. The Matthew effect states that the strong get stronger and the weak get weaker, which gradually emerges here.
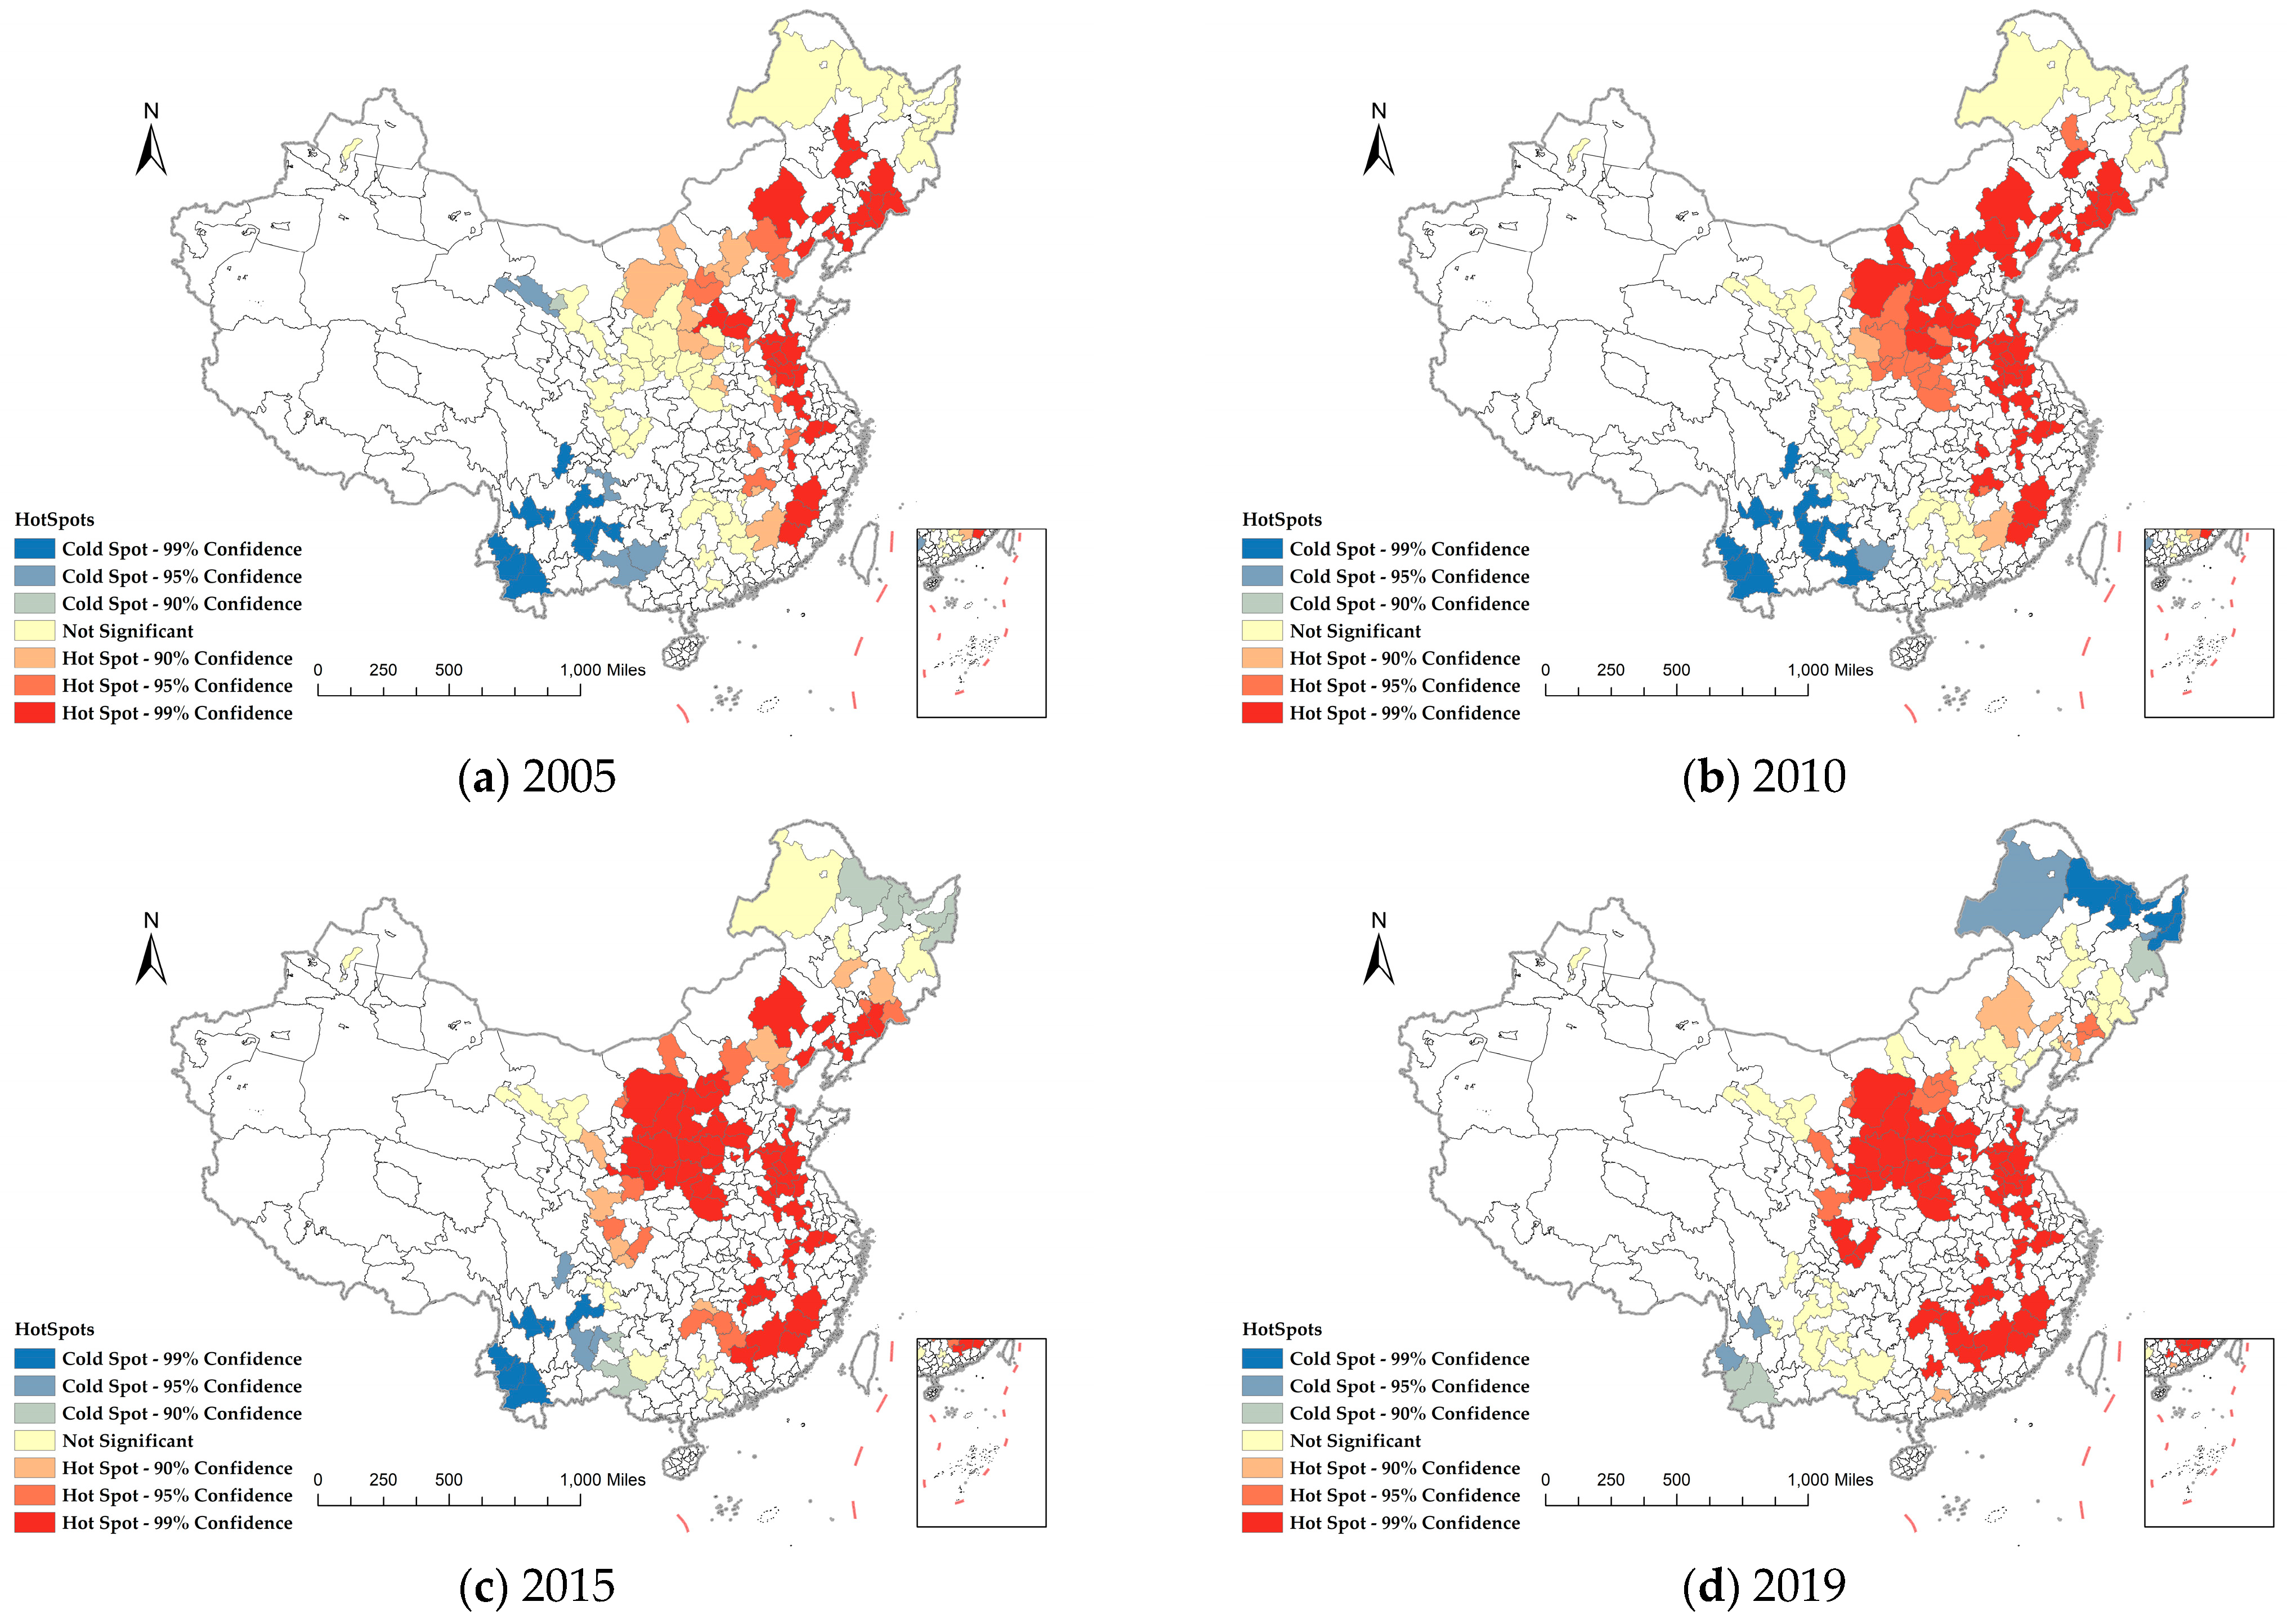
Clustering can be found in Figure 4. The cold spot areas are low-value clusters, and the hot spot areas are high-value clusters. The cold spot areas of economic resilience have changed significantly, and the hot spot areas have remained basically unchanged. The cold spot areas with low economic resilience values were first located in the southwest, and then gradually shifted to the northeast. The regions with high-value economic resilience have always been concentrated in the eastern and central regions. The trickle-down effect believes that cities where economic development is prioritized can drive the development of surrounding cities. Tangshan, Xuzhou, Zibo, and Linyi had high economic resilience in 2005, which had a positive radiation effect on the surrounding areas, making the high-value agglomeration of economic resilience in eastern and central cities more and more significant.

4.3. The Regional Disparities of Economic Resilience in Resource-Based Cities

This paper uses the Theil index to calculate the overall gap in the economic resilience of resource-based cities in China, and decomposes them according to the eight major economic regions (Northeast Region, Middle reaches of the Yellow River, North coast, Northwest Region, Southwest Region, Middle Reaches of the Yangtze River, East Coast, and South Coast). The results are shown in Table 3 and Figure 5.
The Theil index of economic resilience of resource-based cities in China increased from 0.0435 to 0.0835 from 2005 to 2019, with an average annual growth rate of 4.76%, indicating that the overall regional gap in economic resilience in the eight major economic zones widened. The decomposition of the Theil index yields intra-regional gaps and inter-regional gaps. Before 2008, intra-regional disparities contributed greatly to the overall regional disparity in economic resilience of resource-based cities in China, with an average contribution rate of 50.45%. After the 2008 financial crisis, the resilience of cities between regions expanded, and the overall gap was mainly due to the inter-regional gaps, with an average contribution rate of 56.03%. To sum up, the gap in economic resilience among resource-based cities is mainly caused by the unbalanced development among regions. The inter-regional gap continues to widen, and it will still be the decisive force for the gap in economic resilience and development in the future.
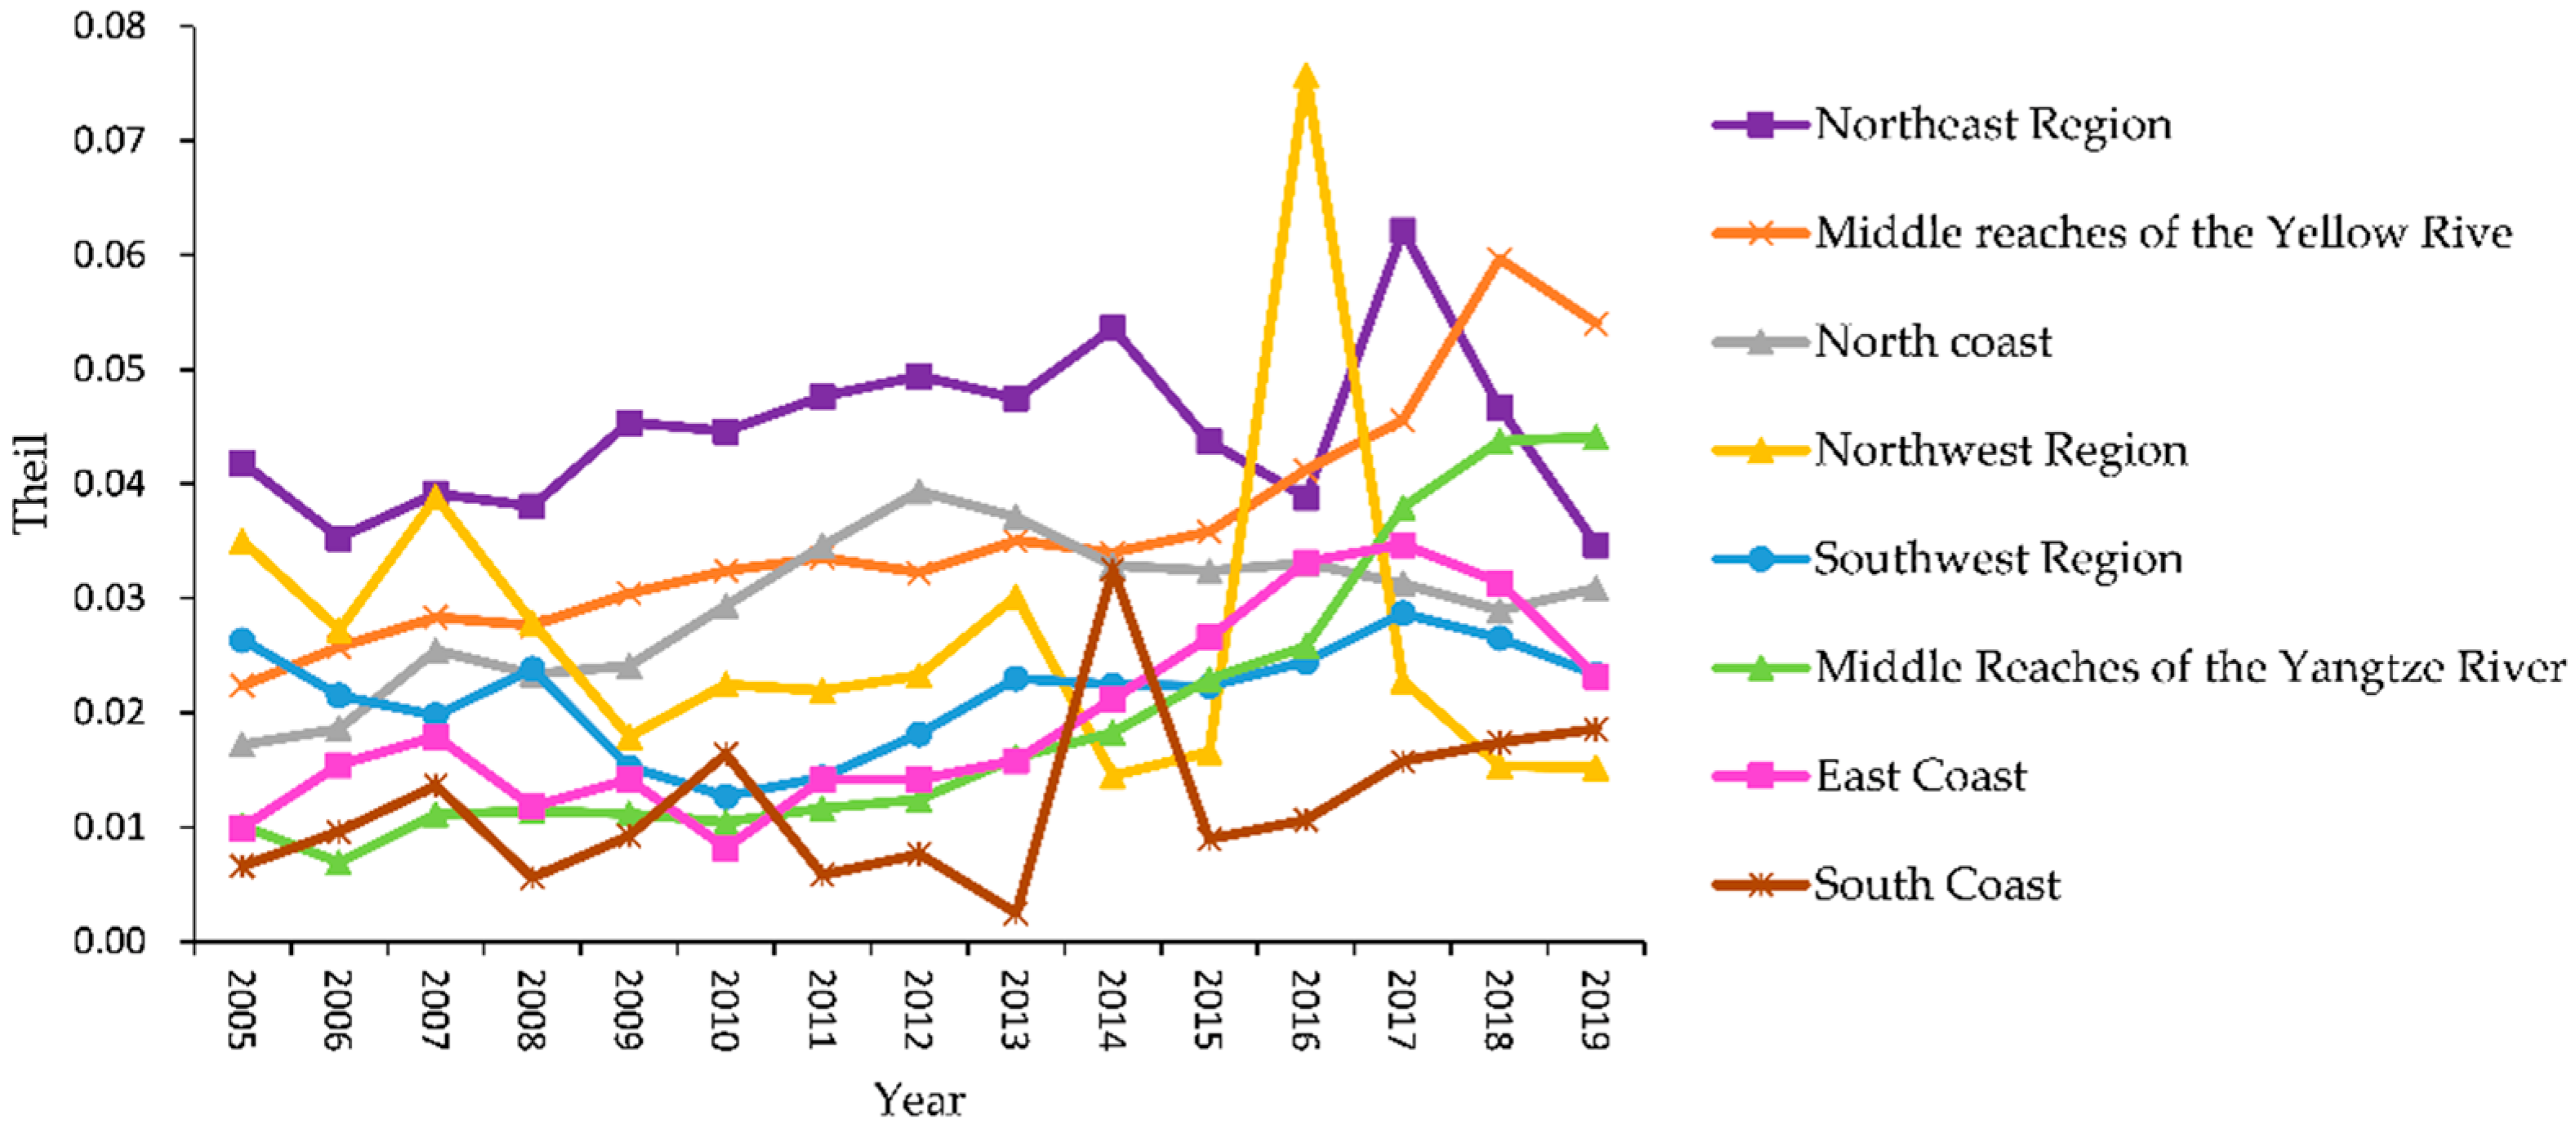
Figure 5 shows that the economic resilience and regional gaps of resource-based cities in the eight major economic regions are at different levels, and at the same time, show a trend of differentiated evolution. The Theil index ranking of each region is as follows: Northeast Region > Middle Reaches of the Yellow River > Northern Coast > Northwest Region > Southwest Region > Middle Reaches of the Yangtze River > East Coast > South Coast. Meanwhile, the Theil index of cities located in the middle reaches of the Yellow River and the middle reaches of the Yangtze River has the most obvious upward trend; the regional differences in economic resilience in the northwest, northeast, and southwest regions show a downward trend, of which the northwest region has the most significant decline. This trend shows that the development of the eastern and western regions has become more uncoordinated, and the economic resilience gap between cities has gradually widened. However, the economic resilience gap between underdeveloped cities in the northeast and northwest has gradually narrowed.

4.4. Spatial Regression Analysis of Factors Impacting Economic Resilience

Using the Moran index to test the spatial autocorrelation of economic resilience of resource-based cities in China. Table 4 shows that Moran’s I from 2005 to 2019 was significantly greater than zero at the 1% level, indicating that there is a positive spatial correlation in the economic resilience of Chinese resource-based cities.
Table 5 shows that the LM test rejects the null hypothesis at the 1% significance level, indicating that there are spatial errors and spatial lag effects, and that the spatial Doberman model is more appropriate. In addition, the LR test and Wald test also rejected the null hypothesis at the 1% significance level, further indicating that the spatial Durbin model cannot be degraded into the SAR and SEM. Using the same method to determine that all dimensions of economic resilience are applicable to the spatial Durbin model.
Table 6 shows the estimation results of the economic resilience of China’s resource-based cities by the SDM. The spatial autoregressive coefficient ρ passed the 1% significance test, indicating that economic resilience has an endogenous interaction between regions in resource-based cities. Resilience is affected not only by local explained variables, but also by the spatial spillover effects of explained variables and explanatory variables in neighboring cities. For every 1% increase in the economic resilience of local resource-based cities, the economic resilience of neighboring resource-based cities increases by 0.1931%. The estimation results of the SDM show that, in terms of main effects, market potential and location factors have a significant positive impact on the economic resilience, the degree of nationalization, and industrial structure specialization, and financial risks have a significant negative impact; in terms of spillover effects, talent development potential and industrial structure specialization have a significant role in promoting the economic resilience of neighboring resource-based cities; resource dependence, labor level, and financial risks have a significant inhibitory effect on the economic resilience of neighboring resource-based cities.
When the spatial spillover effect exists, changes in a certain influencing factor not only cause changes in local economic resilience, but also affect changes in the economic resilience in neighboring cities through a feedback mechanism. However, there is a certain bias in the parameter estimation results of the SDM, which cannot accurately reflect the marginal effects of the respective variables. This paper draws on the practice of Lesage and uses the partial differential method to decompose the total effect into direct effects and indirect effects. Direct effects reflect the impact of changes in local explanatory variables on local economic resilience, and indirect effects reflect the impact of local explanatory variables on the economic resilience of neighboring resource-based cities. Table 7 shows the direct effect, indirect effect, and total effect of economic resilience in each dimension in resource-based cities.
Resource dependence has a significant negative impact on economic resilience and innovation and transformation ability, and has a significant negative spatial spillover effect on the economic resilience, resistance and recovery, adaptation and regulation ability, and innovation and transformation ability of neighboring cities. This proves the existence of the “resource curse” effect. Relying on their rich natural resources, resource-based cities focus on developing resource-based industries, crowding out investment in scientific and technological innovation, which is not conducive to the long-term development of economic resilience. Therefore, the degree of resource dependence not only hinders the development of local innovation, but also inhibits the overall economic resilience of neighboring resource-based cities.
Nationalization has a significant inhibitory effect on the economic resilience, adaptation and regulation ability, and innovation and transformation ability of resource-based cities, and the coefficients are −0.0068, −0.0078, and −0.0230, respectively. The dimension of innovation and transformation ability is most affected by nationalization. Nationalization is not conducive to the ownership structure breaking the single-subject pattern of state-owned enterprises and promoting the diversified development of the market economy. In addition, the spatial spillover effect of nationalization is limited, and the diffusion effect is not strong, which does not have a significant impact on neighboring resource-based cities.
Market potential and talent development potential play a significant role in promoting the economic resilience of resource-based cities in China. At the same time, they radiate to surrounding cities and have a positive spatial spillover effect on neighboring resource-based cities. The dimension of resistance and recovery is most obviously affected by the factors of market potential, and the dimension and transformation ability are most affected by the talent development potential. Increasing the market potential and talent development potential can stimulate the endogenous driving force of economic growth. The increase in local market capacity and the gathering of high-quality talents are the “shock absorbers” to stabilize economic fluctuations, which not only enhance the city’s risk resistance and innovation ability, but also benefit the surrounding resource-based cities.
The workforce level has a significant positive effect on promoting the economic resilience of resource-based cities, and has a negative effect on neighboring regions. The more abundant the local labor force, the more resilient the economy is. In the context of the transformation of resource-based cities, if the city lacks sufficient talent reserves, the current labor force level will not match the new industry. Local resource-based cities are forced to introduce talents from other places, which aggravates the instability of the local economy.
The specialization of the industrial structure has a significant negative impact on the economic resilience, adaptation and regulation ability, and innovation and transformation ability of resource-based cities, and has a positive spillover effect on the economic resilience of neighboring cities. Resource-based cities used to rely on the rich local natural resources and invested a lot of resources in a leading industry in the local area, focusing on building a specialized city. This development model has played an important role during a specific period, but in the context of the new era, the drawbacks of this model are gradually revealed. Once the local leading industry is strongly impacted by external influences, it is difficult for the city to transform in time and maintain a stable development trend in the crisis according to its own characteristics.
The direct and indirect effects of fiscal risk on economic resilience are significantly negative at the level of 1%, indicating that fiscal risk not only hinders the improvement of local economic resilience of resource-based cities, but also has a negative impact on the economic resilience of neighboring cities. Fiscal risk increases the possibility of damage to the government’s fiscal revenue and expenditure systems and affects the city’s ability to withstand external shocks.
The location of resource-based cities is also an important factor affecting their economic resilience. The economic resilience of resource-based cities in the east is better than that of resource-based cities in other regions. The geographical location of eastern cities is better than that of the western region, which means the production factors flow from west to east in the development process, resulting in a serious loss of resources in underdeveloped cities. A sharp decline in city resistance has reduced the overall economic resilience of cities.

5. Discussion

Economic resilience provides a new research perspective for cities to resist external risks and achieve sustainable development. At present, most studies evaluate city resilience based on a single indicator, and rarely build an indicator system to comprehensively measure the long-term resilience of city economic systems. In addition, most studies analyze European regional economic resilience from a national macro-perspective, ignoring the spatiotemporal characteristics of city economic resilience. Based on the theory of economic system resilience and combining the characteristics of resource-based cities, this research constructs an evaluation system and an analysis framework for the economic resilience of resource-based cities in China. On this basis, the temporal and spatial evolution laws and regional gaps of resource-based cities are revealed. Different from previous studies, this paper considers spatial correlation when studying the influencing factors, and reveals the spillover effects and determinants of economic resilience based on spatial perspectives. The research results provide a theoretical basis for the resilience and sustainable development of China’s resource-based cities.
Based on resilience theory, the research constructs a scientific index system from three dimensions of resistance and recovery ability, adaptation and regulation ability, and innovation and transformation ability to measure the economic resilience of resource-based cities in China, and identifies its spatial and temporal differentiation. The overall resilience of China’s resource-based cities has continued to grow, but the resilience of the northeast and northwest regions is low and the growth rate is slow, and the resilience of the coastal areas is high and the growth rate is fast. This is consistent with the study by Hu et al., cities located in the northeastern region have low resilience, while cities in the eastern coastal regions have higher economic resilience [25]. Different regions have different institutional changes and development paths, resulting in regional locations and urban historical characteristics that affect key institutions’ interpretation of resilience [31,51]. Developed regions are more receptive to new ideas and new technologies, thereby adjusting city structures and enhancing their resilience to risks. Although the economic resilience gap between resource-based cities in northeast China has a tendency to narrow, the city’s development potential is insufficient, and it is easy to lose and lose. In addition, more attention should be paid to the spatial correlation characteristics of resource-based cities, a special type of city. This paper verifies the existence of spatial correlations and spillovers in the economic resilience of resource-based cities in China. An increase or decrease in the resilience of one city could affect the economic resilience of neighboring cities, triggering simultaneous changes in surrounding cities. Therefore, cities should make full use of this spillover effect. High-resilience cities drive the development of surrounding cities, while low-resilience cities actively undertake industrial restructuring and upgrading [26,49]. Consistent with existing research, resource dependence, nationalization, industrial structure specialization, and financial risks have a negative effect on the economic resilience of resource-based cities, while marketization, talent development potential, and labor force have a positive effect on resilience improvement [47,48]. From the perspective of spatial spillover, high resource dependence and financial risks are not conducive to the improvement of the economic resilience of neighboring cities, and the market potential and talent potential have become the keys to driving the improvement of the overall economic resilience of the region. Therefore, in the process of sustainable development of resource-based cities, attention should be paid to the diversification and transformation of the industrial structure, and the ability of the urban economic system to disperse risks should be improved. Expanding the market and attracting high-quality talent can break the long-standing resource-dependent development model of resource-based cities.
Simultaneously, the study still has some limitations. Firstly, due to limited access to data, the study only covered 114 prefecture-level cities. Given the limitations of the data, it was determined that the sample could be broadened in the future to include data from all prefectures, autonomous prefectures, and leagues. Alternatively, further focus on the county, a more microscopic area, to make the findings more relevant. It is also possible to include non-resource-based cities in the study, compare the economic resilience of resource-based cities and non-resource-based cities, identify the gap between them and the reasons for the gap, and provide more favorable support for regional balanced development. Secondly, the study lacks a more nuanced consideration of time. Future research can focus on how different times and different types of external shocks affect economic resilience, and how a city’s economic systems can recover and achieve higher levels of growth under a certain shock. Finally, a more detailed classification of resource-based cities by resource type or cycle type can be created, introducing new explanatory variables in the discussion of influencing factors and analyzing what heterogeneous role each determinant plays between different types of cities.

6. Conclusions and Recommendations

6.1. Conclusions

The key conclusions can be summarized as follows:
From the perspective of time evolution, the economic resilience of China’s resource-based cities showed a sustained growth trend. Ganzhou, Yichun and Xuzhou have the fastest economic resilience growth rates, while Qitaihe, Hegang and Daqing have slow growth rates. Resource-based cities’ economic resilience in different regions have significant differences. The economic resilience and growth rates of resource-based cities in the eastern coastal regions are much higher than those in the northeast and northwest regions.
From the perspective of spatial evolution, the economic resilience of resource-based cities in China has significant spatial differentiation, showing a distribution pattern of high in the east and low in the west and northeast. At the same time, the phenomenon of spatial polarization has intensified, and the economic resilience development between cities has shown the Matthew effect. From 2005 to 2019, the hot spots of economic resilience of resource-based cities were always located in the eastern and central regions, and the cold spots shifted from the southwest to the northeast. In addition, from 2005 to 2019, the Theil index of economic resilience of resource-based cities in the eight major regions continued to increase, indicating that the economic resilience disequilibrium in the eight major economic regions has increased. Decomposing the Theil index reveals that inter-regional disparities are the main source of resilience gaps in resource-based cities.
Market potential, talent development potential and labor level are the direct driving forces for improving the economic resilience of China’s resource-based cities. The model with state-owned enterprises as a single subject and excessive industrial concentration is not suitable for the current stage of China’s development. Resource dependence, market potential, talent development potential and fiscal risks not only affect the economic resilience of local resource-based cities, but also have spatial spillover effects on neighboring cities. Resource dependence and financial risks are not conducive to the economic resilience of neighboring areas, but market potential and talent development potential have a radiating effect on surrounding cities, enhancing local economic resilience while also benefiting surrounding cities.

6.2. Policy Recommendations

Based on the above conclusions, China’s resource-based cities should start with their own characteristics and formulate differentiated policies through a combination of local conditions and overall planning, focusing on improving the overall economic resilience of cities and narrowing regional differences in economic resilience.
The first step is to ensure the rationality and fairness of resource allocation through an implementation mechanism that combines market leadership and government guidance. The market mechanism has changed the traditional direct intervention method, using the macro-management method to adjust the market economy from both the supply side and the demand side by promoting the function and scope of resource allocation, and stimulating market vitality. The government guides and guarantees fairness in the allocation of public resources and avoids homogeneous competition and the siphoning effect.
Second, China’s resource-based cities should break the lock-in effect and promote the diversification of industrial structures. Relying on resource advantages to develop a specific industry is the early choice of resource-based cities, and the resource advantage trap restricts the transformation of resource-based industries to non-resource-based industries. Therefore, resource-based cities should take the industrial transfer in coastal areas as an opportunity to develop high-value-added industries, cultivate a matching production structure, and realize the diversification and upgrading of industrial structures. In addition, in order to solve the problem of unbalanced development of regional economic resilience, a new mechanism for coordinated regional development should be built, resources should be complemented within urban agglomerations, and the “enclave economy” model should be opened up.
The final step is to take the digital economy and intelligent economy as an opportunity to stimulate the potential of new talent resources, giving priority to the new economic sectors, and realizing the extension of the industrial chain. The low conversion rate of education and technological achievements has weakened the economic resilience of resource-based cities, so China’s resource-based cities should effectively integrate resources, provide preferential policies for talents, and explore new power and new technologies.

Author Contributions

Conceptualization, G.L. and M.L.; methodology, G.L. and M.L.; software, G.L. and M.L.; formal analysis, G.L. and M.L.; data curation, G.L. and M.L.; writing—original draft preparation, G.L. and M.L.; writing—review and editing, G.L.; funding acquisition, G.L.; G.L. and M.L. are the co-first authors, M.L. is the corresponding author. All authors contributed equally to this work. All authors have read and agreed to the published version of the manuscript.

Funding

This research was supported by the National Social Science Funding of China, grant number (18BJY081).

Institutional Review Board Statement

Not applicable.

Informed Consent Statement

Not applicable.

Data Availability Statement

Innovation and entrepreneurship index is from Peking University Open Research Data Platform (https://doi.org/10.18170/DVN/PEFDAS, accessed on 27 November 2021). Other data are mainly from China City Statistical Yearbook (https://navi.cnki.net/knavi/yearbooks/YZGCA/detail, accessed on 19 November 2021), China Regional Economy Statistical Yearbook (https://navi.cnki.net/knavi/yearbooks/YZXDR/detail, accessed on 19 November 2021), China Urban-Rural Construction Statistical Yearbook (https://navi.cnki.net/knavi/yearbooks/YCXTJ/detail, accessed on 22 November 2021) and National Bureau of statistics of the People’s Republic of China(http://www.stats.gov.cn, accessed on 3 December 2021).

Acknowledgments

Thanks to the editors and reviewers for their comments; our article has been greatly improved. Moreover, we would like to thank Hebei GEO University (KJCXTD-2022-02) for providing us with the necessary financial support.

Conflicts of Interest

The authors declare no conflict of interest.

References

  1. Elmqvist, T.; Andersson, E.; Frantzeskaki, N. Sustainability and resilience for transformation in the urban century. Nat. Sustain. 2019, 2, 267–273. [Google Scholar] [CrossRef]
  2. Li, H.; Long, R.; Hong, C. Economic transition policies in chinese resource-based cities: An overview of government efforts. Energy Policy 2013, 55, 251–260. [Google Scholar] [CrossRef]
  3. Yu, J.; Li, J.; Zhang, W. Identification and classification of resource-based cities in China. Geographical 2019, 29, 1300–1314. [Google Scholar] [CrossRef] [Green Version]
  4. Miao, C.; Hu, Z.; Geng, F.; Miao, J. Characteristics of economic evolution and the influencing factors of resource-dependent cities in China: The role of path dependence, vulnerability and path creation. Geogr. Res. 2018, 37, 1268–1281. [Google Scholar]
  5. Li, Q.; Guo, Q.; Zhou, M.; Xia, Q.; Quan, M. Analysis on the mechanism and influencing factors of the coordinated development of economy and environment in china’s resource-based cities. Sustainability 2022, 14, 2929. [Google Scholar] [CrossRef]
  6. Hou, G.; Zou, Z.; Zhang, T.; Meng, Y. Analysis of the Effect of Industrial Transformation of Resource-Based Cities in Northeast China. Economies 2019, 7, 40. [Google Scholar] [CrossRef] [Green Version]
  7. Holling, C.S. Resilience and Stability of Ecological Systems. Annu. Rev. Ecol. Syst. 1973, 4, 1–23. [Google Scholar] [CrossRef] [Green Version]
  8. Simmie, J.; Martin, R. The economic resilience of regions: Towards an evolutionary approach. Camb. J. Reg. Econ. Soc. 2010, 3, 27–43. [Google Scholar] [CrossRef] [Green Version]
  9. Martin, R.; Sunley, P.; Gardiner, B.; Tyler, P. How regions react to recessions: Resilience and the role of economic structure. Reg. Stud. 2016, 50, 561–585. [Google Scholar] [CrossRef] [Green Version]
  10. Sun, J.W.; Sun, X.Y. Research Progress of Regional Economic Resilience and Exploration of Its Application in China. Econ. Geogr. 2017, 37, 1–9. [Google Scholar]
  11. Aiginger, K. Strengthening the resilience of an economy. Intereconomics 2009, 44, 309–316. [Google Scholar] [CrossRef] [Green Version]
  12. Briguglio, L.; Cordina, G.; Farrugia, N.; Vella, S. Economic Vulnerability and Resilience: Concepts and Measurements. Oxf. Dev. Stud. 2009, 37, 229–247. [Google Scholar] [CrossRef]
  13. Simmie, J. Regional Economic Resilience: A Schumpeterian Perspective. Raumforsch. Raumordn. 2014, 72, 103–116. [Google Scholar] [CrossRef]
  14. Masik, G. Economic resilience: The case of Poland and Certain European regions. Geogr. Pol. 2016, 89, 457–471. [Google Scholar] [CrossRef]
  15. Pontarollo, N.; Serpieri, C. Challenges and Opportunities to Regional Renewal in the European Union. Int. Reg. Sci. Rev. 2021, 44, 142–169. [Google Scholar] [CrossRef]
  16. Ezcurra, R.; Rios, V. Quality of Government and Regional Resilience in the European Union. Evidence from the Great Recession. Pap. Reg. Sci. 2019, 98, 1267–1290. [Google Scholar] [CrossRef]
  17. Bogdański, M. Employment Diversification as a Determinant of Economic Resilience and Sustainability in Provincial Cities. Sustainability 2021, 13, 4861. [Google Scholar] [CrossRef]
  18. Lomboy, C.; Belinario, F.; Pomeroy, R.; Pedrajas, J.; Tirona, R.; Box, S. Building household economic resilience to secure a future for near shore fishers in the philippines. Mar. Policy 2019, 99, 334–342. [Google Scholar] [CrossRef]
  19. Zhang, M.; Feng, X. A comparative study of urban resilience and economic development level of cities in yangtze river delta urban agglomeration. Urban Dev. Stud. 2019, 26, 82–91. [Google Scholar]
  20. Zhu, J.H.; Sun, H.X. Research on Spatial-temporal Evolution and Influencing Factors of Urban Resilience of China’s Three Metropolitan Agglomerations. Soft Sci. 2020, 34, 72–79. [Google Scholar]
  21. Xie, M.; Feng, Z.; Li, C. How does population shrinkage affect economic resilience? a case study of resource-based cities in northeast china. Sustainability 2022, 14, 3650. [Google Scholar] [CrossRef]
  22. Tan, J.; Zhang, P.; Kevin, L.O.; Jing, L.I.; Liu, S. Conceptualizing and measuring economic resilience of resource-based cities: Case study of northeast china. Chin. Geogr. Sci. 2017, 27, 471–481. [Google Scholar] [CrossRef] [Green Version]
  23. Tang, Y.; Song, Y.; Xue, D.; Dong, C. Spatio—temporal evolution of economic resilience of resource—based cities in Shanxi province amd its obstacles. Arid. Land Res. Manag. 2022, 36, 53–61. [Google Scholar]
  24. Li, L.; Zhang, P.; Li, X. Regional Economic Resilience of the Old Industrial Bases in China—A Case Study of Liaoning Province. Sustainability 2019, 11, 723. [Google Scholar] [CrossRef] [Green Version]
  25. Hu, X.; Yang, C. Institutional change and divergent economic resilience: Path development of two resource-depleted cities in China. Urban Stud. 2019, 56, 3466–3485. [Google Scholar] [CrossRef]
  26. Jt, A.; Xh, B.; Rh, C.; Jn, D. Industrial structure or agency: What affects regional economic resilience? evidence from resource-based cities in china. Cities 2020, 106, 102906. [Google Scholar]
  27. Liangang, L.I.; Zhang, P.Y.; Tan, J.T.; Guan, H.M. Review on the evolution of resilience concept and research progress on regional economic resilience. Hum. Geogr. 2019, 34, 1–7. [Google Scholar]
  28. Peng, R.; Liu, T.; Cao, G. Spatial pattern of urban economic resilience in eastern coastal China and industrial explanation. Geogr. Res. 2021, 40, 1732–1748. [Google Scholar]
  29. Doran, J.; Fingleton, B. US Metropolitan Area Resilience: Insights from dynamic spatial panel estimation. Environ. Plan. 2018, 50, 111–132. [Google Scholar] [CrossRef]
  30. Xu, Y.; Zhang, L. The Economic Resilience of Chinese Cities and Its Origin: From the Perspective of Diversification of Industrial Structure. Financ. Trade Econ. 2019, 40, 110–126. [Google Scholar]
  31. Martin, R.; Sunley, P. On the notion of regional economic resilience: Conceptualisation and explanation. Pap. Evol. Econ. Geogr. 2013, 15, 1–42. [Google Scholar] [CrossRef] [Green Version]
  32. Ding, J.; Wang, Z.; Liu, Y.; Yu, F. Measurement of economic resilience of contiguous poverty-stricken areas in China and influencing factor analysis. Prog. Geogr. 2020, 39, 924–937. [Google Scholar] [CrossRef]
  33. Zeng, B. Analysis on the Connotation of Regional Economic Resilience and Construction of Index System. J. Reg. Financ. Res. 2020, 7, 74–78. [Google Scholar]
  34. Walker, B.; Holling, C.S.; Carpenter, S.R.; Kinzig, A. Resilience, adaptability and transformability in social—Ecological systems. Ecol. Soc. 2004, 9, 5. [Google Scholar] [CrossRef]
  35. Folke, C.; Carpenter, S.R.; Walker, B.; Scheffer, M.; Chapin, T.; Rockstrm, J. Resilience thinking: Integrating resilience, adaptability and transformability. Ecol. Soc. 2010, 15, 299–305. [Google Scholar] [CrossRef]
  36. Li, H.; Zou, Q. Environmental Regulations, Resource Endowments and Urban Industry Transformation: Comparative Analysis of Resource-based and Non-resource-based Cities. Econ. Res. J. 2018, 53, 182–198. [Google Scholar]
  37. Wang, J.; Zou, G.P.; Shi, X.J. Impact of Institutional Change on China’s Economic Growth—An Empirical Study Based on VAR Model. Chin. Ind. Econ. 2018, 53, 182–198. [Google Scholar]
  38. Shannon, C.E. A Mathematical Theory of Communication. Bell Syst. Tech. J. 1948, 27, 379–423. [Google Scholar] [CrossRef] [Green Version]
  39. Chen, Y. New Framework of Getis-Ord’s Indexes Associating Spatial Autocorrelation with Interaction. PLoS ONE 2018, 15, e0236765. [Google Scholar] [CrossRef]
  40. Anselin, L. Spatial Econometrics: Methods and Models; Springer: Cham, The Netherlands, 1988. [Google Scholar]
  41. Cockx, L.; Francken, N. Natural resources: A curse on education spending? Energy Policy 2016, 92, 394–408. [Google Scholar] [CrossRef] [Green Version]
  42. Bhattacharyya, S.; Hodler, R. Natural resources, democracy and corruption. Eur. Econ. Rev. 2010, 54, 608–621. [Google Scholar] [CrossRef] [Green Version]
  43. Dy, A.; Xga, B.; Lxa, C.; Qg, A. Constraint-adaptation challenges and resilience transitions of the industry–environmental system in a resource-dependent city—sciencedirect. Resour. Conserv. Recycl. 2018, 134, 196–205. [Google Scholar]
  44. Li, Q.; Zeng, F.; Liu, S.; Yang, M.; Xu, F. The effects of china’s sustainable development policy for resource-based cities on local industrial transformation. Resour. Policy 2020, 71, 101940. [Google Scholar] [CrossRef]
  45. Chen, Y.; Wang, S.; Mei, L. The comparison study of industrial structure transformation between non-resource-based and resource-based cities in Northeast China. Geogr. Res. 2021, 40, 808–820. [Google Scholar]
  46. Sun, T.Y.; Lu, Y.; Cheng, L. Implementation Effect of Resource Exhausted Cities’ Supporting Policies, Long-term Mechanism and Industrial Upgrading. Chin. Ind. Econ. 2020, 7, 98–116. [Google Scholar]
  47. Sun, H.; Yuan, W. A Study on the Relationship Between Economic Resilience and High-Quality Economic Development in Western China. Reg. Econ. Rev. 2020, 5, 23–35. [Google Scholar]
  48. Tan, J.; Zhao, H.; Liu, W.; Zhang, P.; Qiu, F. Regional Economic Resilience and Influential Mechanism During Economic Crises in China. Sci. Geogr. Sin. 2020, 40, 173–181. [Google Scholar]
  49. Breathnach, P.; Van Egeraat, C.; Curran, D. Regional economic resilience in Ireland: The roles of industrial structure and foreign inward investment. Reg. Stud. Reg. Sci. 2015, 2, 497–517. [Google Scholar] [CrossRef]
  50. Zhang, X. China Innovation and Entrepreneurship Index; Peking University Open Research Data Platform: Beijing, China, 2019; Volume 4. [Google Scholar] [CrossRef]
  51. Zukauskaite, E.; Trippl, M.; Plechero, M. Institutional thickness revisited. Econ. Geogr. 2017, 93, 325–345. [Google Scholar] [CrossRef] [Green Version]
Figure 1. The trend of resource-based cities’ economic resilience.
Sustainability 14 10434 g001
Figure 2. The trend of economic resilience in eight major economic regions.
Sustainability 14 10434 g002
Figure 3. Spatial evolution of resource-based cities’ economic resilience.
Sustainability 14 10434 g003aSustainability 14 10434 g003b
Figure 4. Evolution of hotspots.
Sustainability 14 10434 g004
Figure 5. Theil index of economic resilience in eight major economic regions.
Sustainability 14 10434 g005
Table 1. The index system of economic resilience.
Target LayerCriteria LayerIndicator LayerIndicator DescriptionMinMax
Economic resilienceResistance and recovery abilitySavings amount of urban and rural areas (ten thousand yuan)Reflect the residents’ ability to resist risks (+)4851.0100 411,606.3665
Per capita GDP (yuan)Reflect the level of regional economic development (+)82.1871 176,587.5654
Registered urban unemployment rate (%)Reflects regional unemployment risk (−)0.3011 98.6776
Regional GDP growth rate (%)Reflects the level of economic growth in economic locations (+)−19.3800 37.0000
Green coverage (%)Reflects the level of urban greening0.0000 64.7800
Per capita road area (m2)Reflect the level of infrastructure and construction in the region (+)0.0000 60.0700
Adaptation and regulation abilityFinancial self-sufficiencyRevenue within the general budget of the Treasury/Expenditure within the General Budget of the Treasury (+)0.0544 1.1156
Total retail sales of consumer goods (ten thousand yuan)Reflects the size of the regional market (+)11.5970 216,967.3230
Financial scale (%)Proportion of deposits from financial institutions (+)0.2452 4.3483
Sulfur dioxide emissions (t)Regional industrial sulphur dioxide emissions (−)917.0000 337,164.0000
Comprehensive utilization rate of solid waste (%)Regional comprehensive utilization rate of general industrial solid waste (+)0.0001 135.0000
Innovation and transformation abilityFinancial expenditure on educationLocal financial expenditure on education/ Expenditure within the general budget of local finance (+)0.0357 0.3774
Technological level (ten thousand yuan)Local science and technology expenditure (+)0.7700 1954.9554
Internet penetration (thousand persons)Number of regional internet users (+)97.0000 33,700.0000
Innovation and Entrepreneurship IndexReflect the level of regional innovation and entrepreneurship activity (+)1.3652 90.4110
Rationalization of industrial structureReflect the degree of regional industrial coordination and the degree of effective use of resources (−)0.0943 3.7583
Optimization of industrial structureSecondary industry output value/tertiary industry output value (+)0.0013 2.6692
Table 2. Description of the influencing factor variable.
VariableVariable MeaningVariable DescriptionMinMaxMean
RelyResource dependenceTotal employed population in extractive industries/Total employed population (%)0.00010.57820.1167
NationNationalizationNumber of employees in public administration and social organizations/Total regional population (%)0.00160.05140.0124
MarketMarket potentialTake the natural logarithm of population density2.30466.93185.4854
TalentTalent development potentialTake the natural logarithm of the number of ordinary colleges and universities0.00002.83320.8962
LaborWorkforce levelTake the natural logarithm of the number of employees at the end of the year1.70475.94123.2298
FixlSpecialization of industry structureIndustrial structure specialization index0.347162.56055.0085
RiskFiscal riskFiscal deficit/regional GDP0.01810.97100.1271
LocatLocation factorsThe value for located in the eastern region is 1, otherwise it is 00.00001.00000.2456
Table 3. Theil index of eight economic regions’ economic resilience.
YearsTheilTBRTWR
20050.04350.02250.0210
20060.04340.02120.0222
20070.04910.02490.0241
20080.05250.02370.0287
20090.05630.02430.0320
20100.05970.02510.0346
20110.06100.02680.0342
20120.06230.02800.0343
20130.06640.02950.0369
20140.07060.03060.0400
20150.06880.02950.0393
20160.07720.03470.0425
20170.08810.03840.0496
20180.08930.04010.0492
20190.08350.03690.0466
Table 4. Moran’s I of resource-based cities’ economic resilience from 2005 to 2019.
Years20052006200720082009201020112012
Moran’s I0.380 ***0.438 ***0.459 ***0.487 ***0.461 ***0.514 ***0.492 ***0.461 ***
Years2013201420152016201720182019
Moran’s I0.473 ***0.495 ***0.495 ***0.451 ***0.469 ***0.442 ***0.455 ***
Note: *** indicate the significance levels of 10%.
Table 5. Statistical test of SDM.
VariableStatisticsp-Value
LM-spatial error270.4600.000
LM-spatial lag180.8030.000
LR-spatial error161.120.000
LR-spatial lag72.820.000
Wald-error165.980.000
Wald-lag87.740.000
Table 6. Estimated results for the impact factors of economic resilience.
VariableSEMSARSDM
Rely−0.0601 ***−0.0936 ***−0.0692 ***
Nation−0.0082 ***−0.0060 **−0.0063 **
Market0.0635 ***0.0730 ***0.0652 ***
Talent0.0046 ***0.0053 ***0.0052 ***
Labor0.0693 ***0.0619 ***0.0689 ***
Fixl−0.0014 ***−0.0008 ***−0.0010 ***
Risk−0.0967 ***−0.1132 ***−0.0740 ***
Locat0.0226 ***0.0140 ***0.0230 ***
W*Rely −0.0365 **
W*Nation −0.0018
W*Market 0.0081
W*Talent 0.0030 ***
W*Labor −0.0265 ***
W*Fixl 0.0011 ***
W*Risk −0.1348 ***
W*Locat −0.0110 **
R-square0.57570.62050.6202 ***
ρ 0.1901 ***0.1931 ***
Note: **, *** indicate the significance levels of 5%, and 10%, respectively.
Table 7. Spatial spillover effect for the impact factors of economic resilience.
VariableEconomic ResilienceResistance and Recovery Ability
Direct EffectIndirect EffectTotal EffectDirect EffectIndirect EffectTotal Effect
Rely−0.0737 ***−0.0576 ***−0.1314 ***0.0186−0.1166 ***−0.0979 ***
Nation−0.0068 ***−0.0034−0.0102 ***0.0020−0.00040.0016
Market0.0677 ***0.0243 ***0.0920 ***0.0555 ***0.0640 ***0.1195 ***
Talent0.0056 ***0.0045 ***0.0102 ***0.0045 ***0.0050 ***0.0094 ***
Labor0.0671 ***−0.0151 ***0.0520 ***0.0270 ***−0.00160.0254 ***
Fixl−0.0009 ***0.0010 ***0.0001−0.00030.0011 ***0.0009 *
Risk−0.0881 ***−0.1724 ***−0.2604 ***−0.0905 ***−0.1143 ***−0.2049 ***
Locat0.0220 ***−0.00680.0152 ***0.0283 ***−0.00390.0244
VariableAdaptation and Regulation AbilityInnovation and Transformation Ability
Direct EffectIndirect EffectTotal EffectDirect EffectIndirect EffectTotal Effect
Rely0.0087−0.1352 ***−0.1266 ***−0.0604 **−0.1669 ***−0.2273 ***
Nation−0.0078 **0.0060−0.0018−0.0230 ***−0.0010−0.0240 ***
Market0.0287 ***0.0464 ***0.0751 ***0.0543 ***0.0534 ***0.1077 ***
Talent0.0050 ***0.0043 ***0.0093 ***0.0076 ***0.0067 ***0.0142 ***
Labor0.0377 ***0.00190.0396 ***0.0604 ***−0.00960.0508 ***
Fixl−0.0010 ***0.0005−0.0005−0.0020 ***0.0007−0.0013 **
Risk−0.0702 ***−0.0938 ***−0.1639 ***−0.0224−0.1375 ***−0.1599 ***
Locat0.0384 ***−0.01090.0274 **0.0234 **−0.00600.0174
Note: *, **, *** indicate the significance levels of 1%, 5%, and 10%, respectively.
Publisher’s Note: MDPI stays neutral with regard to jurisdictional claims in published maps and institutional affiliations.

